1. Introduction
Positioning systems are gaining an essential role in indoor scenarios, with several applications on accessibility and marketing [
1,
2]. In addition to classic Visible Light Positioning (VLP) indoor scenarios (commercial areas, hospitals, and visually impaired-people guidance [
3]), applications of this technology can be also oriented to location on industrial environments, (e.g., robot positioning) where the presence of high electromagnetic (EM) noise levels induce huge errors when using traditional Radio Frequency (RF) systems [
4]. Another scenario is underground mining, especially in the case of potentially flammable gases emission, as in coal extraction facilities (or even when coal is just present) or when there is a risk of the atmosphere becomes potentially explosive (e.g., oil and gas production or storage plants). Optical Camera Communication (OCC) and LED-based positioning is an alternative to avoid EM emissions [
5].
Most of the techniques proposed until present are based on radio frequency signals, generated specifically for that purpose [
6], or reused from other systems such as WiFi network devices [
7]. Nevertheless, there are also some techniques based on optical signals, which make use of the Solid State Illumination (SSL) devices present in LED lamps [
8,
9]. This alternative introduces a double purpose of lights in facilities: as light sources and as part of indoor location systems.
Positioning techniques mainly consist of distance measurements among the target to be located, and several reference points to carry out a trilateration operation [
1]. Several schemes for distance estimation have been proposed such as Received Signal Strength (RSS), Time of Flight (ToF), Angle of Arrival (AoA) or Time Difference of Arrival (TDoA) [
6]. In this work, a TDoA scheme based on a Visible Light Communication (VLC) measurement system, as previously proposed in [
10], is presented. The main contribution of this work is the use of OCC techniques and image processing for measuring the signal’s time of flight between the base station (BS) and the mobile station (MS).
Some authors have proposed Optical Camera Communication for Visible Light Positioning (VLP). They are based on the extraction of different information from the camera’s images and, in general, use them for estimating distances among reference points and mobile nodes [
11,
12]. Additionally, the use of OCC to carry out node identification (reference and/or target) has also been studied [
13,
14,
15,
16], achieving centimeter accuracy in small-room scenarios. Thus, the system can obtain both position and identification from the nodes. In this work, OCC technology is involved in the ranging process rather than in the trilateration one, and makes use of the images in a very different way, which is shown in this paper.
The proposed method reduces the time resolution of the system, since it is limited by the camera scanning rate, but improves the received optical signal detection due to the camera’s sensitivity. Furthermore, this scheme can be easily implemented over smartphones using the flash LED (optical emitter), the speaker (sound emitter), and the camera (OCC receiver). The remaining elements are allocated using an external module (optical and acoustic receivers, and optical emitter) unless they can also be integrated into another smartphone: embedded camera as the optical receiver, microphone as the sound receiver, and flash LED as the optical emitter.
The presented work is focused on a new distance estimation technique and describes in depth the proposed distance-measurement scheme. The solutions implemented for adapting the signal transmission and processing, as well as the error performance are also discussed. Several of the presented modules are required for implementing a full positioning system, which are integrated following the general trilateration scheme used by other indoor location alternatives. This work also explores a novel error-mitigation strategy based on the shape of the probability density function associated with the ranging procedure.
This paper is organized as follows. First, a thorough analysis of the current context in VLP is provided in
Section 2. In
Section 3, a description of the proposed method for obtaining the distance is presented.
Section 4 analyzes the proposed method concerning performance.
Section 5 discusses some relevant statistical aspects of the measurement technique. In
Section 6, some relevant results are presented. Finally,
Section 7 provides a thorough discussion of the results and their potential impact on the field.
3. System Description
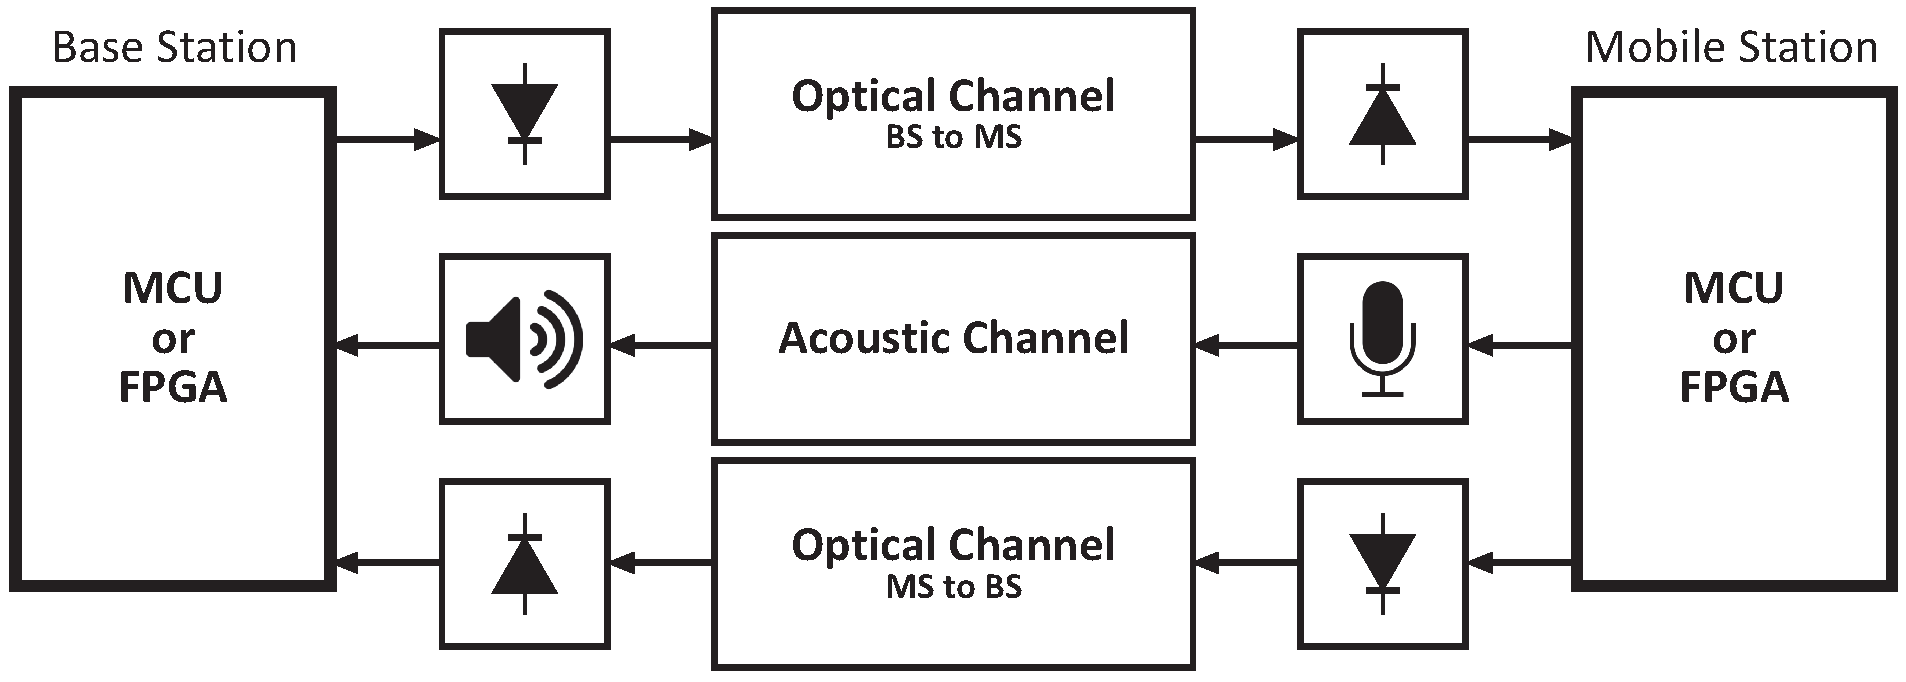
As mentioned above, the proposed system is a variation of the scheme presented in [
10]. Fundamentally, that system uses an optical signal instead of the RF one included in Cricket devices [
49], and introduces an additional optical receiver and emitter to provide distance-measurement capability on both devices. The measurement procedure is triggered by the Base Station (BS), which sends both optical and ultrasound signals simultaneously. When the Mobile Station (MS) detects those signals, it carries out the distance estimation taking into account the time delay between signals. Besides, at the moment of receiving the ultrasound signal, the MS transmits an optical pulse. It is used as a reference for the distance estimation at the BS side. Distance is then calculated from the time lapse between the BS optical signal emission and the reception of the MS optical signal.
Figure 1 depicts the block diagram of the system.
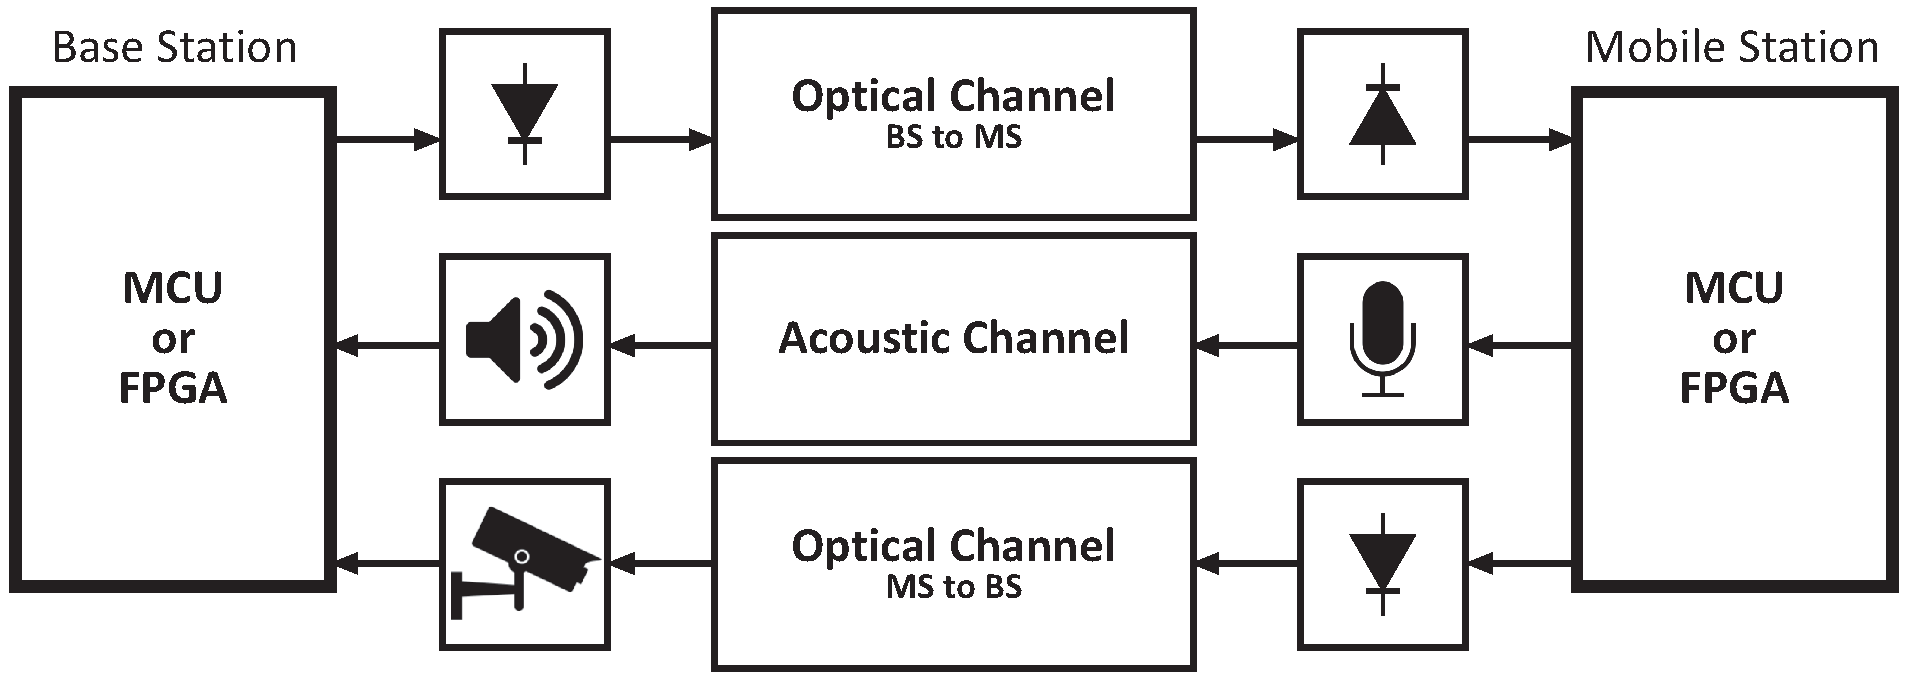
Modifications proposed in this work mainly consist of substituting the BS optical receiver (photodiode) by a Complementary Metal Oxide Semiconductor (CMOS) camera, which implements a Rolling Shutter (RS) scanning method [
50].
Photodiode-based receivers integrate all the incoming light (restricted by its attached optics FOV), generating an electrical signal that depends on the received power and its responsivity. This signal is typically conditioned using amplifiers and finally is analog-to-digital converted at a given sample rate, producing a continuous data stream. This type of receivers is characterized by its minimum detectable signal or sensitivity, and its bandwidth. When used in ranging applications, these parameters determine the maximum measurable range and the maximum distance resolution. Optical cameras can be considered as photodiode arrays attached to imaging optics and optical filters, in which each row is enabled sequentially. The scanning process limits the maximum received signal frequency and, hence, the maximum achievable time resolution. The maximum measurable range will depend on the minimum allowed image size for the performed ranging method. All these characteristics are studied in depth in the following sections, where
Table 1 shows the maximum range and minimum resolution for different camera types.
In this new scheme, the time interval measurement is performed by an image processing algorithm instead of the classical pulse arrival detection used in TDoA systems. Furthermore, if audible elements replaced the ultrasound ones, the system’s BS and MS would be suitable for a COTS devices-based implementation. The location process is thought to be performed, fully or partially, through commercial smartphones or webcams, microphones and speakers. That assumption makes cost implementation similar to a smartphone-based APP. If needed, some specific electronics can also be used in the Mobile Station, but no specific, ad-hoc hardware circuits are needed. Positioning systems require n + 1 reference points on an n-dimensional space (e.g., three points to find position over a surface) to perform the trilateration scheme. In this case, three MS can be used as reference stations, reducing the cost. MS design leads to a very simple and cheap implementation, as only an optical and acoustic receiver, an optical emitter, and some basic control electronics are required, without further computation and communications elements. The new block scheme is shown in
Figure 2.
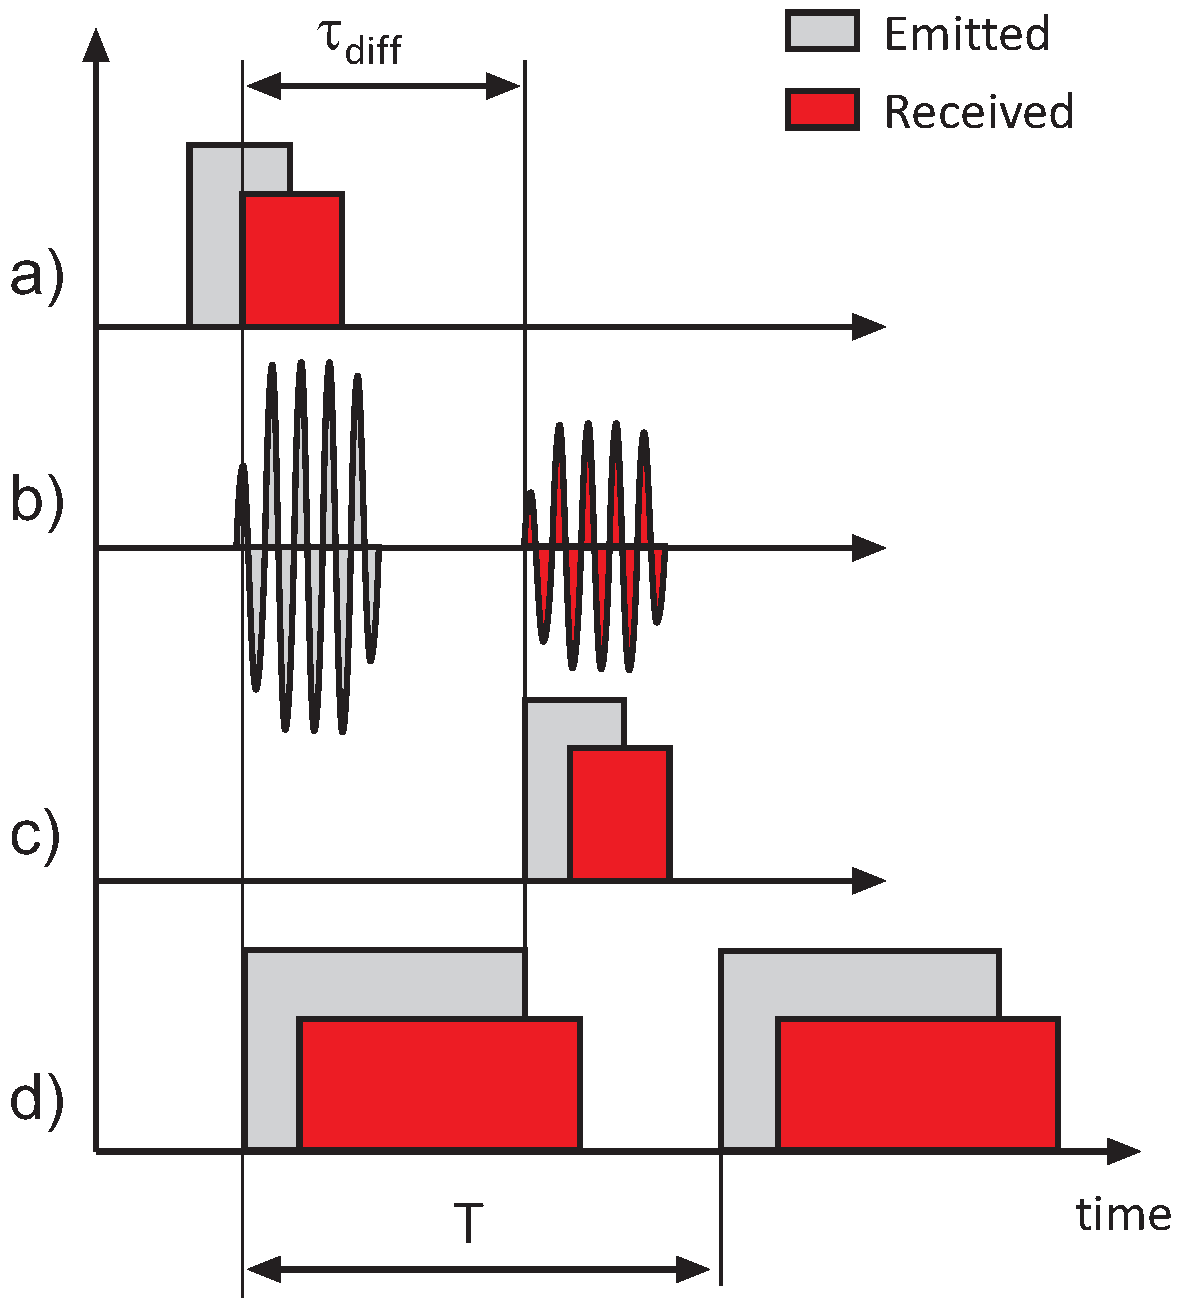
In addition to the hardware modifications, some changes must be introduced in the signals generated in the measurement process. Chronograms for both systems are represented in
Figure 3.
The ranging procedure attaining the MS-side distance estimation remains unchanged from the one in [
10]. Nevertheless, when the MS receives the optical signal, it starts its optical emission and does not finish until the reception of the ultrasound signal. This is the main difference with the former system, in which the optical signal consists of a short pulse when the sound signal is detected. Therefore, the BS camera gets an optical signal whose duration is equal to the time difference of arrival at the MS.
To allow a camera-based detection, the MS does not emit a single pulse, but a pulse train. The period of this signal significantly affects the estimation error performance, as discussed below. Once the camera retrieves enough frames, the system will proceed to the distance estimation using image processing. This is described in the next section.
4. System Performance and Constraints
TDoA-based ranging techniques are based on the different propagation speeds of two emitted signals. Generally, electromagnetic and pressure waves are used because of their extremely different propagation speeds. However, TDoA-based ranging could also be achieved using two different wavelengths whose corresponding refractive indices differ. The ranging procedure is started by the fastest signals and serves as the time reference. Indeed, in this work, the time to reach the receiver is small enough to neglect it in the calculations, as can be observed in the chronogram in
Figure 3 (the transmitted and received optical signals present minimal delay). The slower one, generally a pressure wave such as ultrasound or acoustic emission, is the actual reference for the delay-difference measurement. Equation (
1) shows how the distance estimation is carried out from these two signals.
where
is the estimated distance,
is the quicker signal speed,
is the slower signal speed, and
t is the time interval between signals. Finally,
T is temperature, which profoundly affects propagation speed, mostly in the case of pressure waves. Because of this, these systems also require a calibration based on temperature probing. The higher is
versus
the more accurate the distance estimation could be. In this work, an optical signal with
speed is used, and a pressure wave (ultrasound or acoustic) is employed whose speed
is around 343 m/s, with some variation due to the ambient temperature. The measurement of
t is usually performed employing a digital timer, which is triggered by these signals and its accuracy depends on the clock frequency of the electronics implementing the timer.
This work proposes two main modifications with respect to a conventional TDoA system: the optical signal detection device, and the time estimation procedure. Instead of a typical receiver for the optical signal such as a photodiode, a general purpose CMOS camera is used. The primary requirement is that the camera must be a rolling-shutter type one. The time estimation process is based on image processing techniques, instead of the conventional timer-based schemes.
The inclusion of a camera allows the use of a wide variety of COTS devices available in the market as a Personal Computer (PC) with a webcam, smartphones, tablets or any camera-equipped appliance (if not included, an LED and a speaker or ultrasound emitter should be integrated into the equipment). On the other hand, this kind of devices will presumably present worse time-measurement performance than the dedicated hardware timer of an embedded platform. Hence, a lower effective time resolution is expected. Nevertheless, the ranging accuracy should suffice for most applications, as demonstrated below.
CCD (Charged Coupling Devices) and CMOS are both image sensors usually found in digital cameras, and they are responsible for converting light into electric signals. CCD are high-quality sensors that produce excellent images, but they are costly because they require unique manufacturing processes. CMOS sensors are much more inexpensive when compared to CCD since they can be manufactured on standard silicon integrated circuits production lines. That is the reason CMOS sensors have replaced CCD in the mass market and are being integrated into most cameras at present.
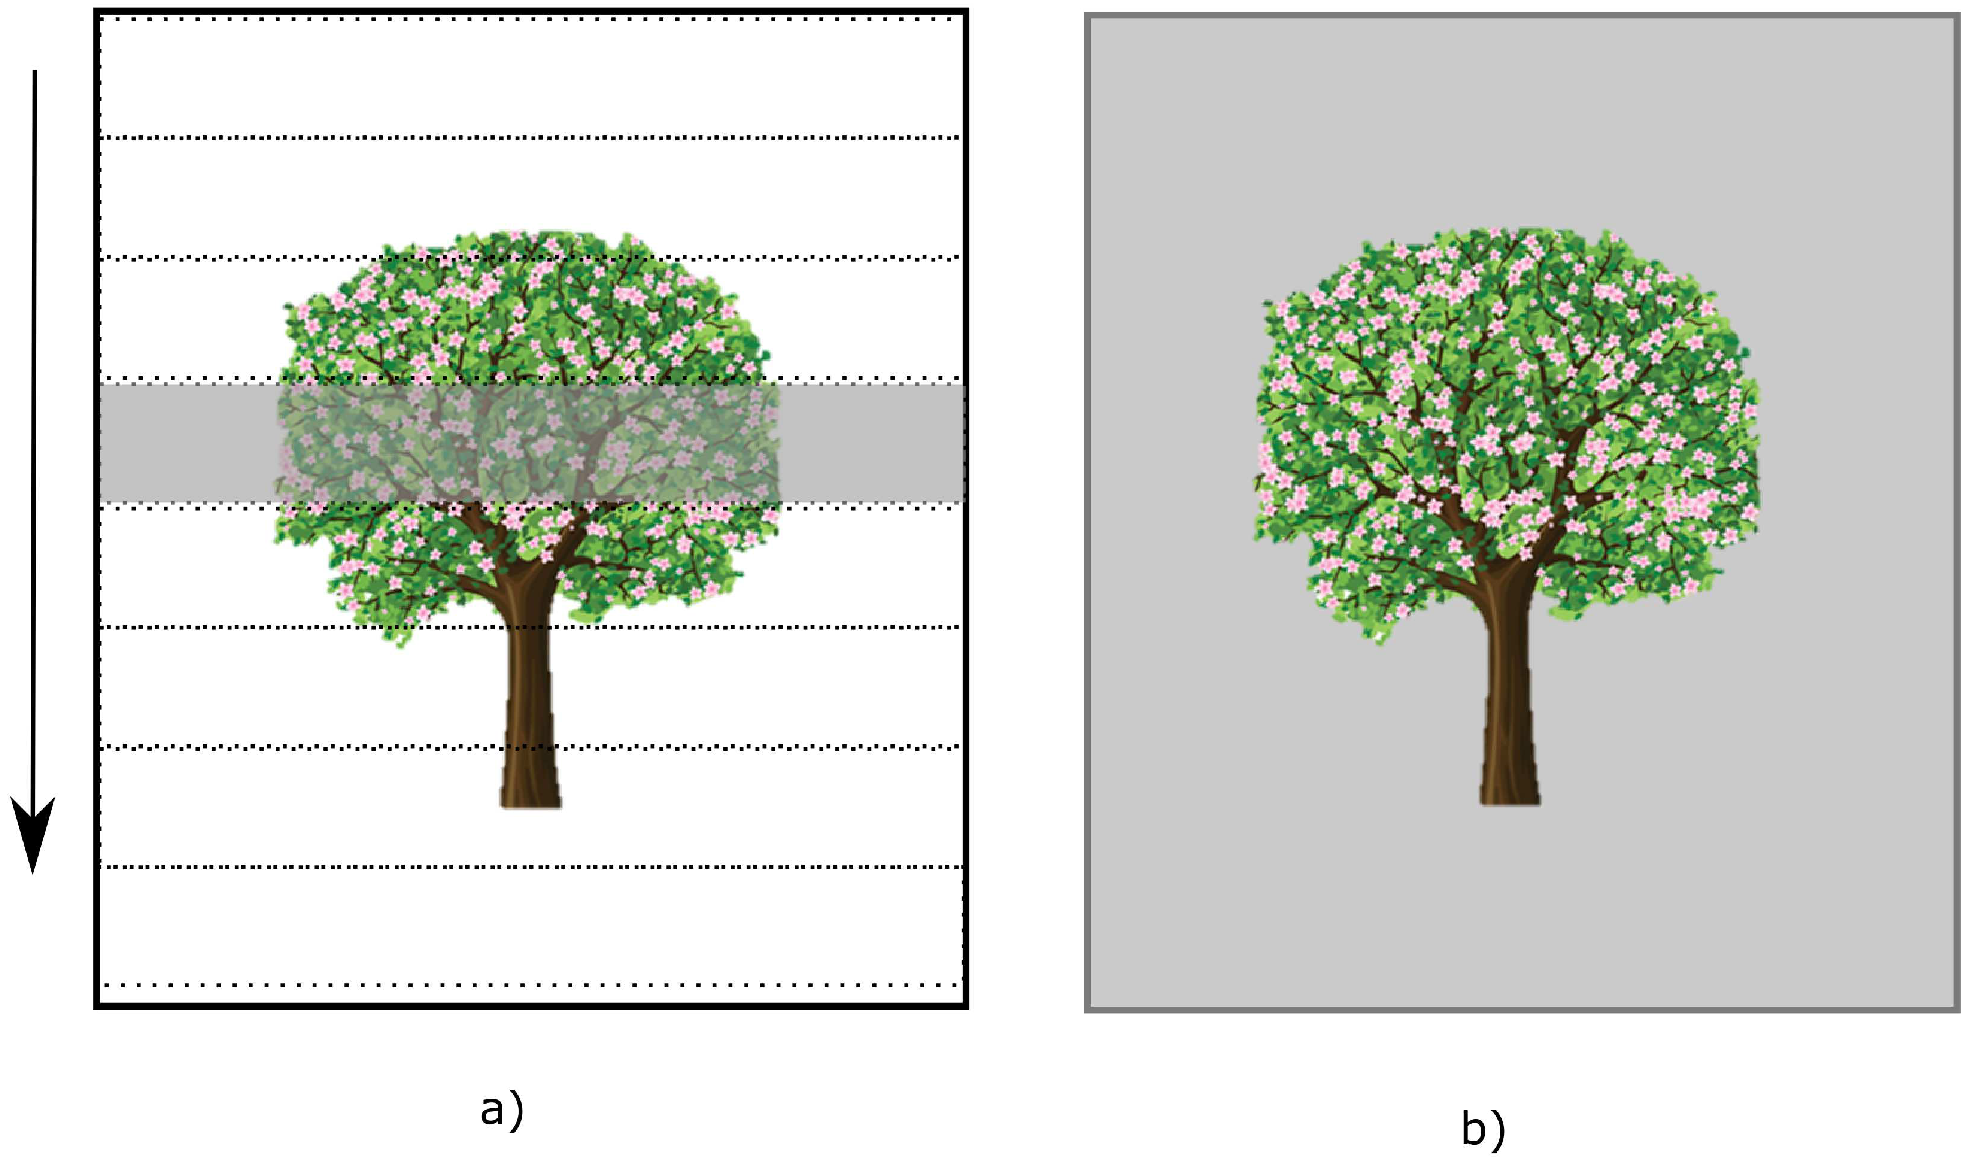
RS is a method of image capture used by CMOS cameras which does not expose the entire sensor simultaneously, but in a row basis. In Global Shutter (GS) systems, a usual technique found in CCD cameras, the whole sensor array integrates the incoming light simultaneously. RS technique activates the sensor array row by row from top to bottom of the picture (scanning across the scene rapidly), as shown in
Figure 4. This difference produces predictable distortions of fast-moving objects (motion blur) or rapid flashes of light since the CMOS sensor top, and bottom parts capture different moments in time. This is a problem to be considered in image processing, but it is an advantage for OCC, since the scanning process allows capturing light changes with a higher time resolution than GS cameras (concretely sensor-height times greater).
To obtain comparable results in both camera scanning types, the activation signal in RS devices needs to be faster than in GS. Therefore, considering a fps camera with a rows sensor, a GS needs to activate its sensor times per second, while a RS element has to enable the rows for readout at a frequency of rows· s. This can be seen from the communications point of view as a different sampling frequency or a distinct time resolution for GS and RS devices, respectively. In this way, RS present an times higher sampling rate than GS. Therefore, it can detect greater bandwidth signals or shorter pulses. The other main difference is that the received signal is distributed among the rows in RS devices, i.e., each line in the sensor takes a sample of the signal, while, for GS, the full sensor takes the sample.
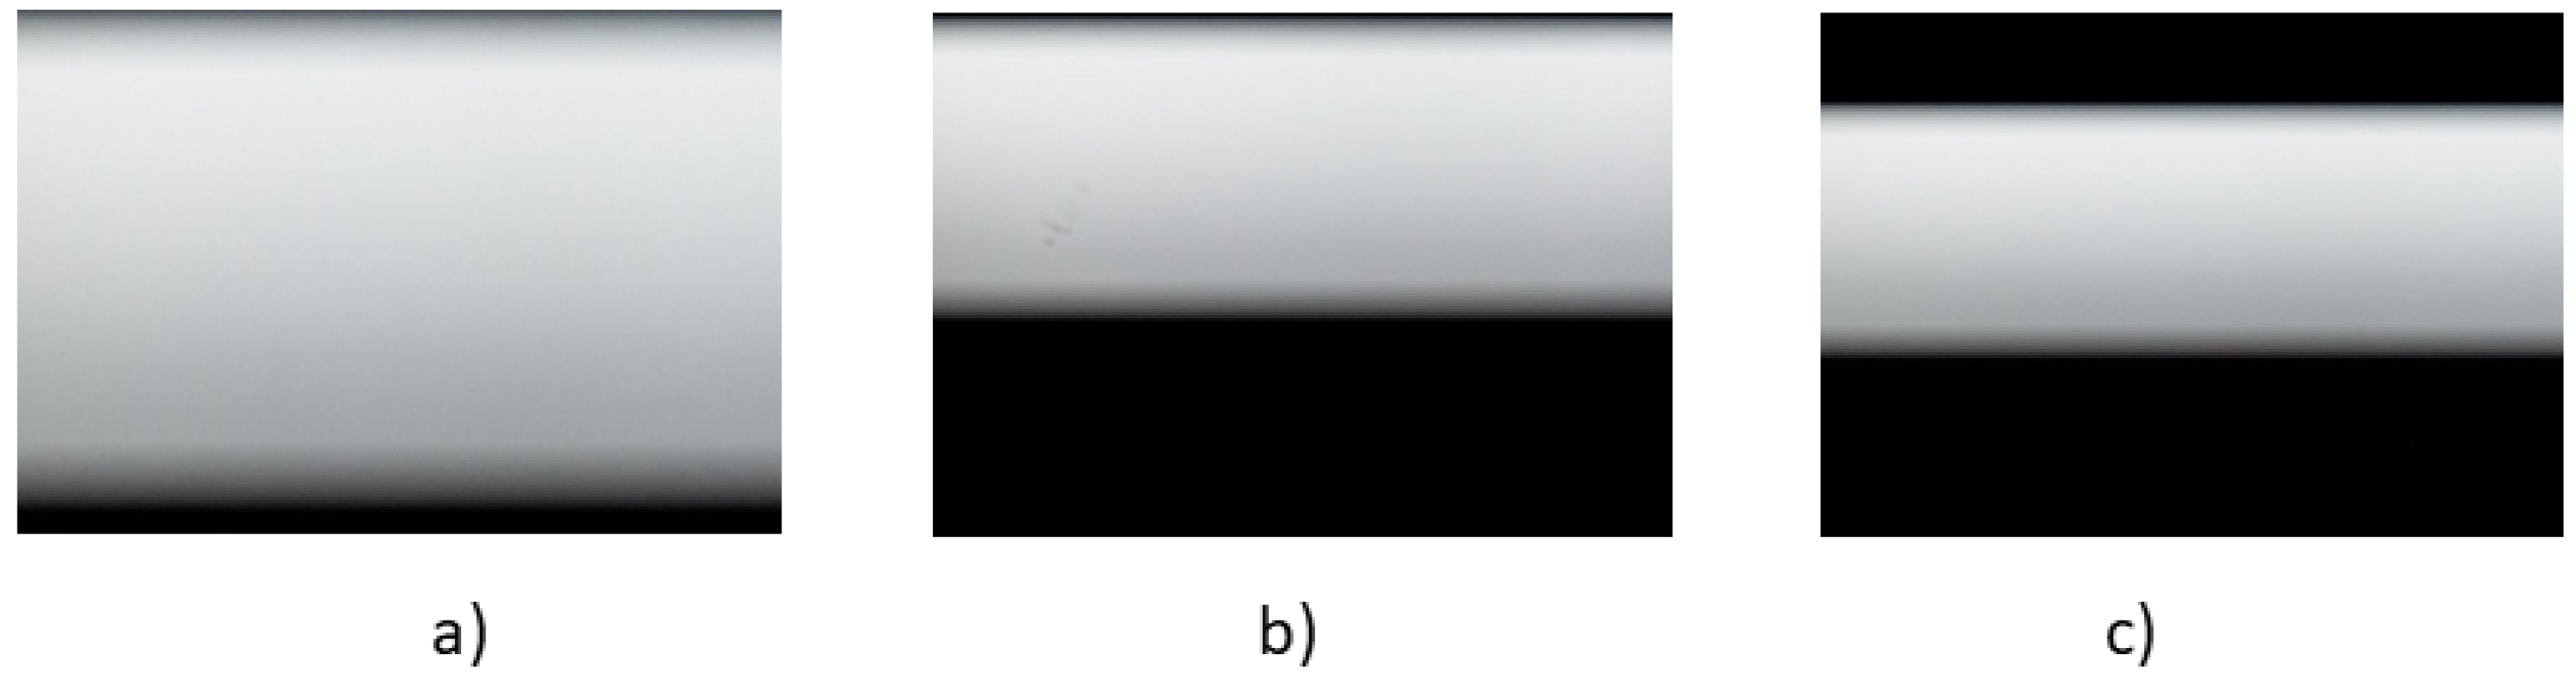
On the other hand, the signal variation is visualized in different ways. GS shows variations of the illuminated area from one frame to other, whilst for RS, it is possible to appreciate partial illuminated areas instead of the whole light spot. It can be appreciated that the time duration is translated into space area, which is why the pulse duration
can be obtained from the illuminated area width. The portion of the illuminated area depends on the signal on-time duration, as
Figure 5 shows. Short pulses excite a few rows, and wider pulses maintain the illumination for a greater number of lines. Equation (
2) calculates the number of illuminated rows
in the camera’s image for a camera with a frame speed of
fps and a
rows vertical size image sensor.
When pulse duration covers all the camera’s lines, the resulting signal corresponds to the system’s maximum measured distance. For example, a 60 fps and
pixels (8 Mpixels) camera, such as that included in some smartphones, provides 2448 lines for an RS system. This corresponds to a sampling frequency of
kHz or, in other words, a time resolution of 1/146,880 = 6.81
s. As the system proposed here uses sound signals for distance measurement, and considering the speed of sound (343 m/s), the theoretical minimum distance change detected by this technique is
mm. In the case of a GS system, due to the used scanning process, it is not possible to perform a similar distance estimation. In the same way, it is also possible to determine the maximum measured distance in RS, multiplying the number of lines of the image by
. For the previous example, the maximum reachable distance is
m. In
Table 1, different video formats are presented determining the same parameters (sampling frequency, time resolution,
, and
). As it can be appreciated from the example and
Table 1, the proposed system provides enough resolution and range for a wide variety of applications relying on distance estimation.
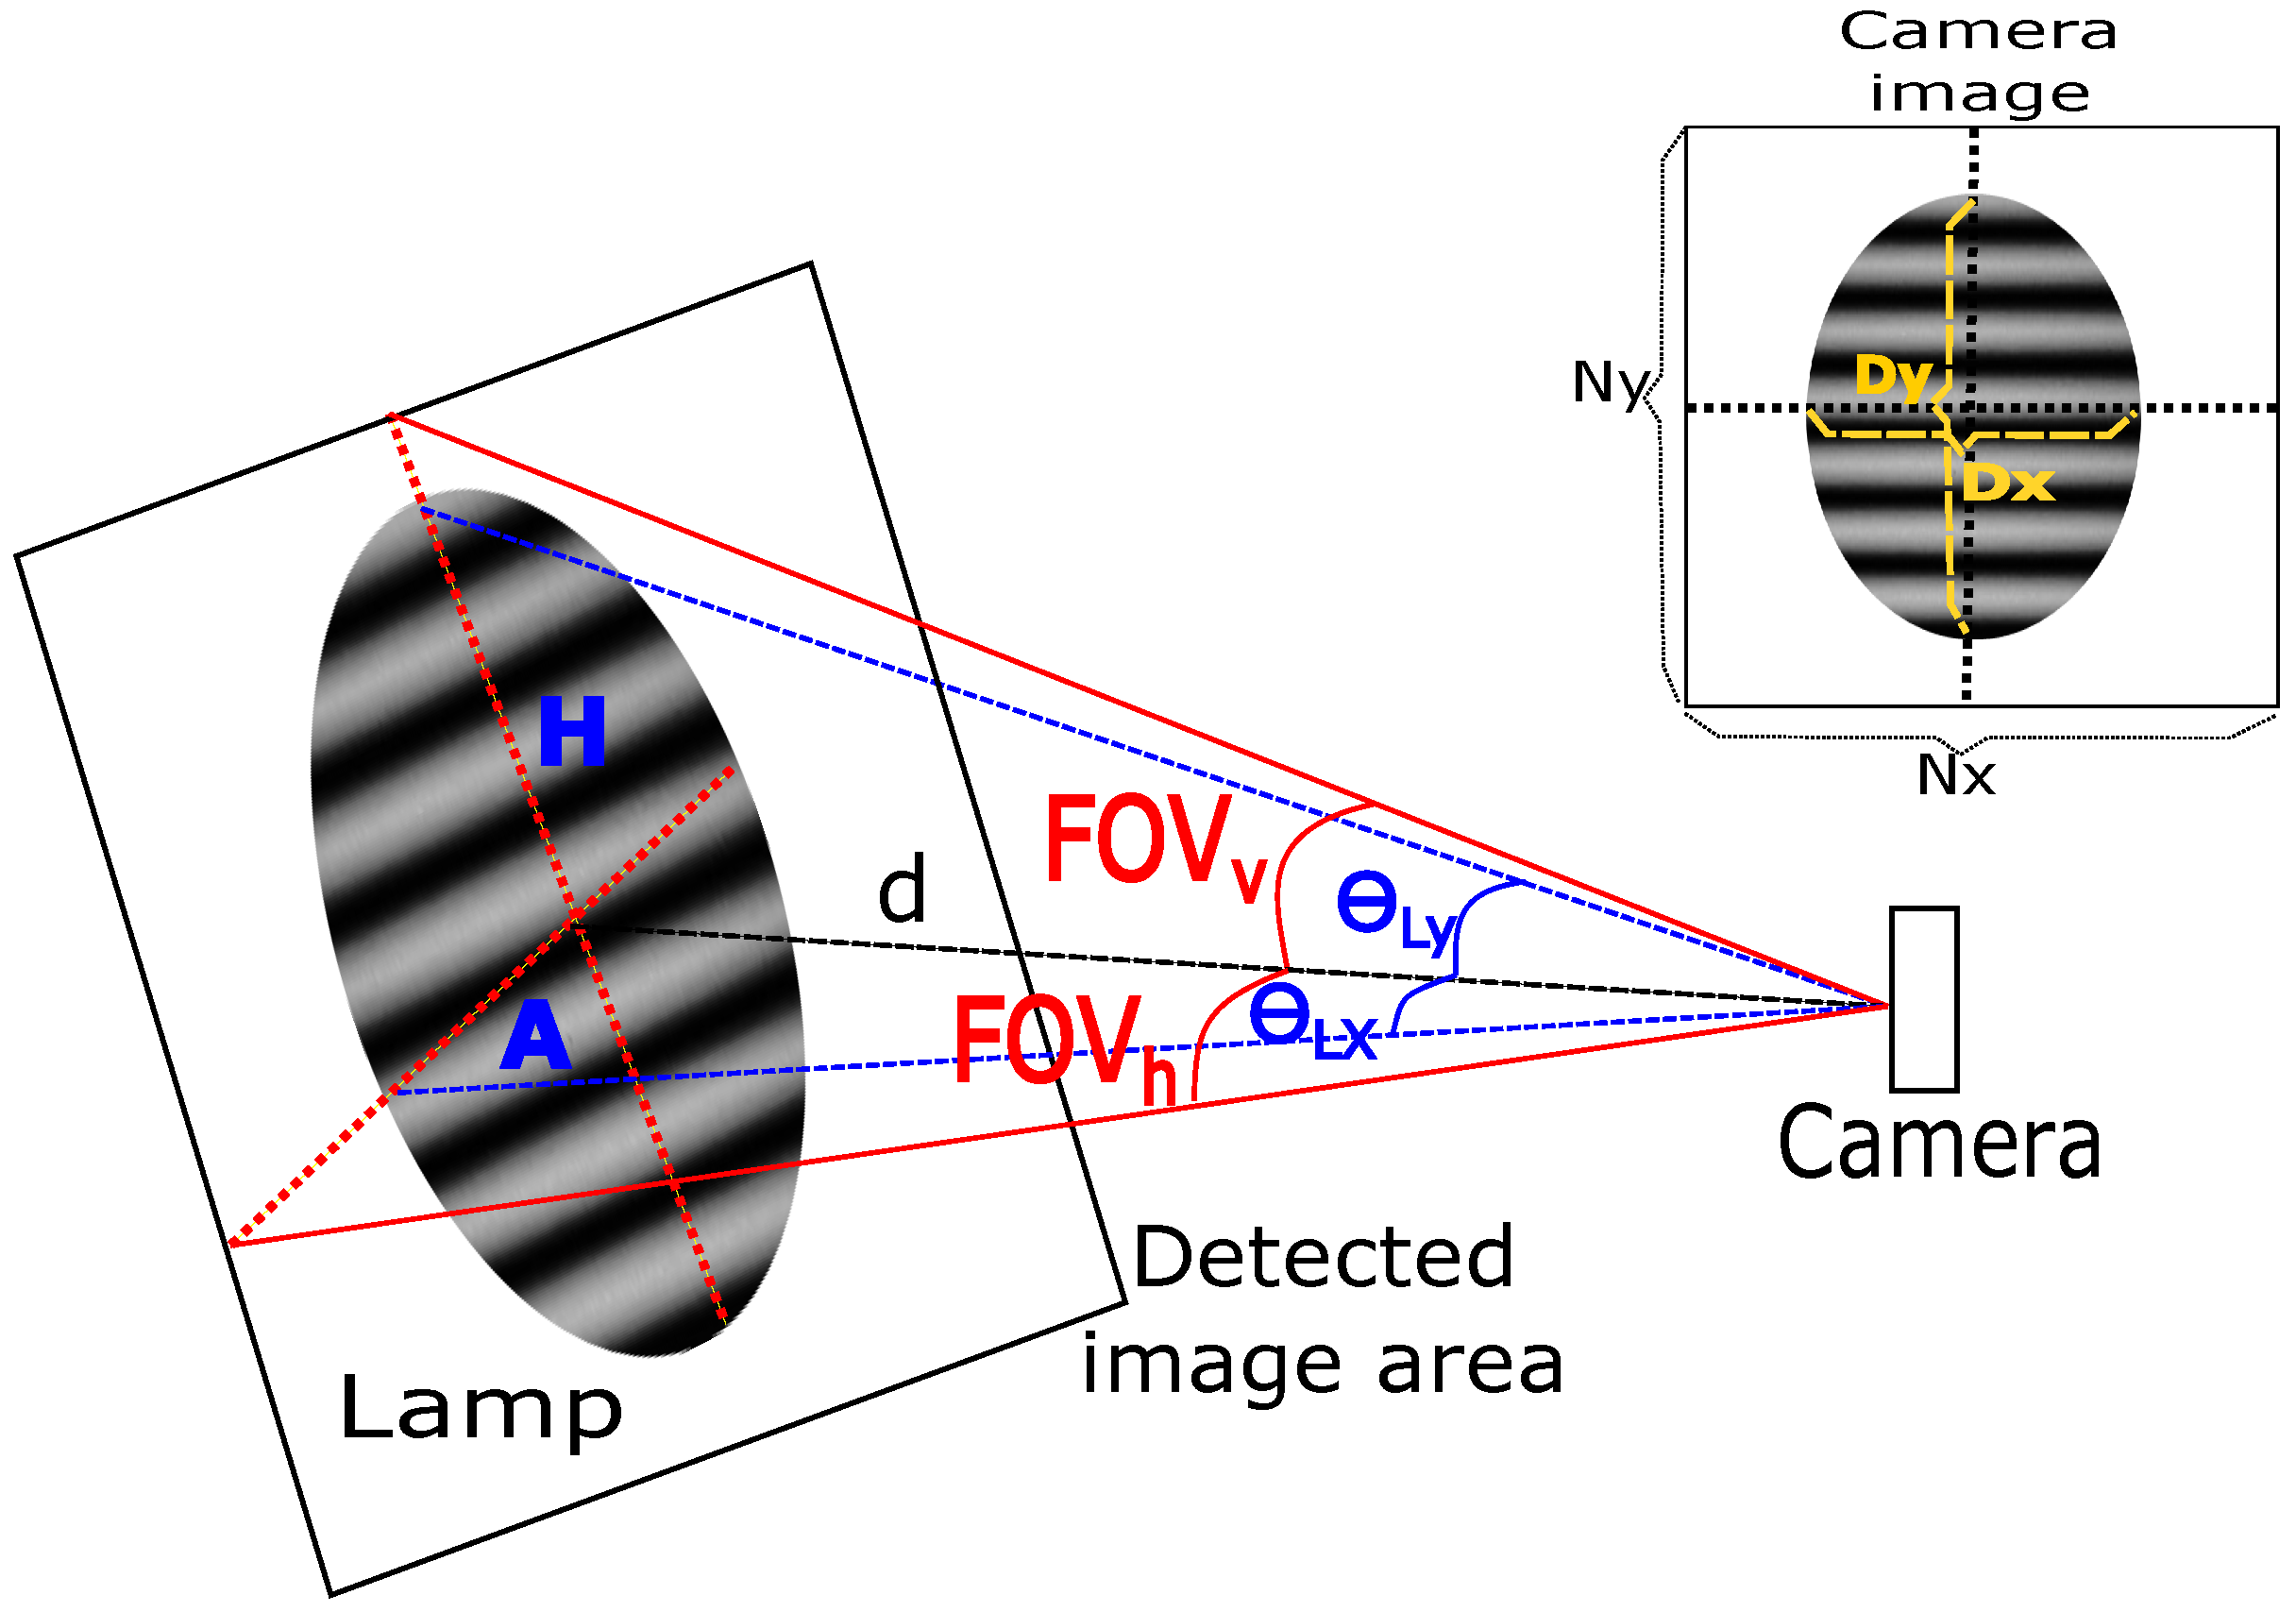
However, in both cases (RS and GS), the transmitted information is contained within the projection of the light source on the image sensor. The lamp’s spot size in the captured image depends on the actual lamp’s size and the distance between lamp and camera.
Figure 6 depicts the geometric diagram.
d is the distance between lamp and camera,
H and
A are the actual lamp’s dimensions and
and
are the vertical and horizontal lamp’s dimensions in the camera’s image (in pixels).
and
are the total image’s size in pixels.
and
are the angles from the camera position corresponding to the vertical and horizontal edges of the lamp, and
and
are the camera’s vertical and horizontal Fields of View, which determine the limits of the area scanned by the camera. Therefore, in the case of RS, the amount of data that can be transmitted within each frame time depends on the source’s height in the image. Concretely, to make the data retrievable by the OCC receiver, the maximum number of rows the transmitted packet can occupy on the picture must satisfy the restriction of Equation (
3).
where
is the packet duration. Furthermore, since there is no synchronization between the image sensor and the light source, the receiver must capture at least two frames per packet and, hence, the emitter must repeat its transmission at least once during that two frames. In the case of the proposed ranging system, the latter restriction can be reformulated since the “packet” is symmetrical and only comprises the pulse duration and a guard time
, which separates the transmitted pulses. Since the objective of the measurement system is to estimate the pulse duration (which is directly related to distance), the lamp’s image size must allocate at least two pulses and one guard time for error-free measurement, yielding to Equation (
4). The value of
must ensure that the packet is entirely allocated within the lamp’s projection. Furthermore, this guard time must be long enough to allow correct pulse duration estimation. High
values allow easy pulse discrimination but reduce the error-free measurement range since the packet would not fit into the source’s image for longer distances.
As mentioned above, the light source’s projected size plays a capital role on the system’s performance. Concretely,
follows Equation (
5) [
51].
where
H is the apparent physical height of the radiant source,
is the receiver’s vertical field of view, and
d is the actual separation distance between transmitter (lamp) and receiver (camera). All these elements are depicted in
Figure 6. Assuming the BS-to-MS ranging is carried out without errors,
can be defined as
.
is a scaling factor introduced by the authors as a way of improving the system’s performance. It modifies the pulse duration at MS-side to allow measurements at longer distances or to increase accuracy. In long-distance mode (
), the generated pulse is shorter than the corresponding to the actual distance. In this way, whole pulses can fit into the resulting smaller Region Of Interest (ROI) due to distance. For instance,
would double the maximum measurement range. As a restriction, the receiver must be aware of this mode in order to compensate the effect of
and to calculate the actual pulse duration. On the other hand, when in short-distance mode (
), the generated pulse is wider than the expected one. Thus, very short distances can be measured because the pulse will cover enough lines in the image. As an example,
will double the resolution and the minimum-reachable distance to the half. Again, the receiver obtains the actual pulse duration compensating the
factor. Introducing this into Equations (
5) and (
4) yields a new distance-dependent restriction (Equation (
6)).
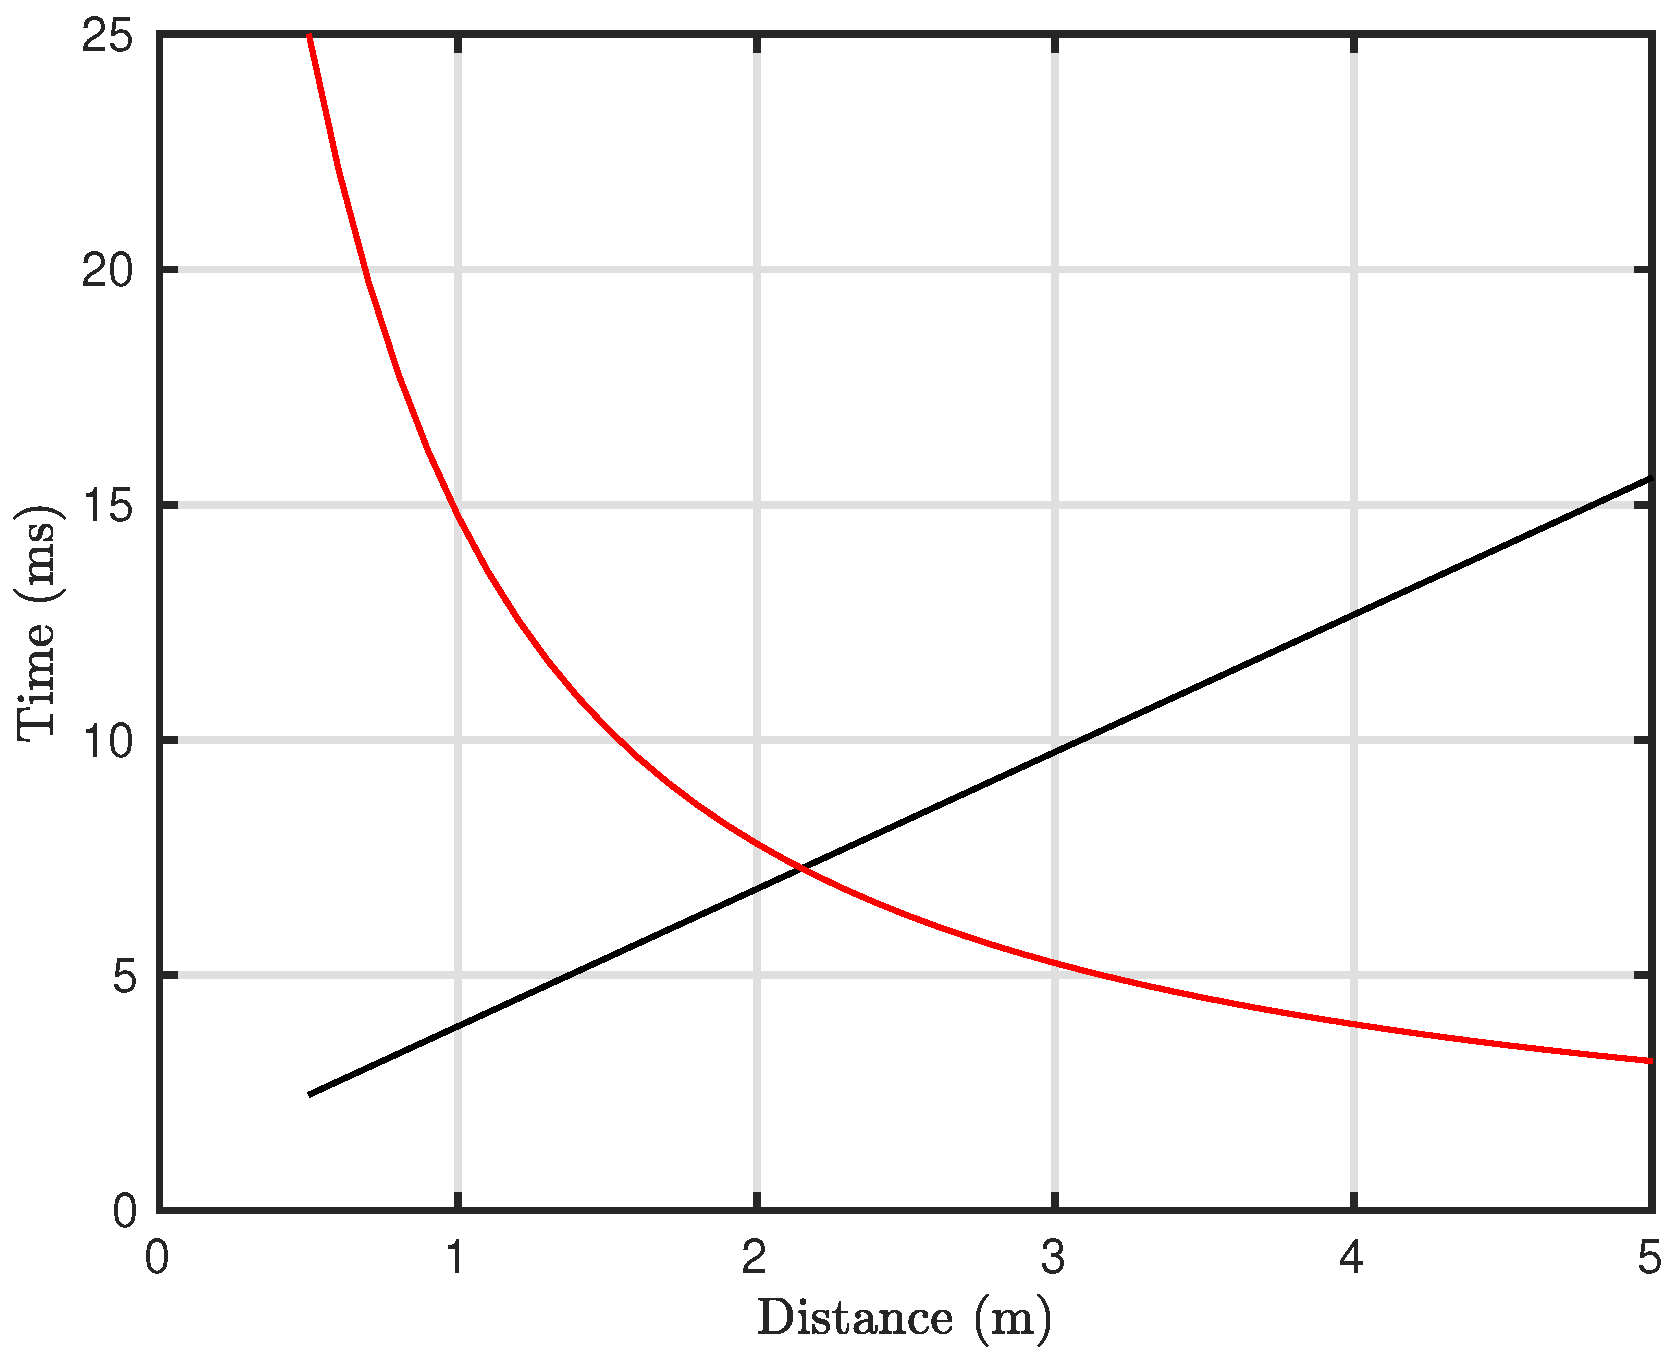
Figure 7 depicts the critical distance at which the condition of Equation (
6) is violated. Beyond this distance, a correct recovery of the pulse duration (as a difference between rising and falling edges) is not ensured, and several runs of the measurement procedure (capturing more frames) must be carried out and statistical treatment must be applied. Typically, error uncertainty is reduced by averaging. However, for the presented scenario, this approach does not offer the best performance, as discussed in
Section 5.
5. Statistical Analysis of the OCC Subsystem
As mentioned in
Section 3, error-less distance estimation could be achieved if Equation (
6) were satisfied. However, there still exists an uncertainty given by the time resolution
of the RS sensor. This resolution corresponds to the row-sweeping time and is presented in Equation (
7).
Therefore, all distance measurements are subject to an uncertainty of
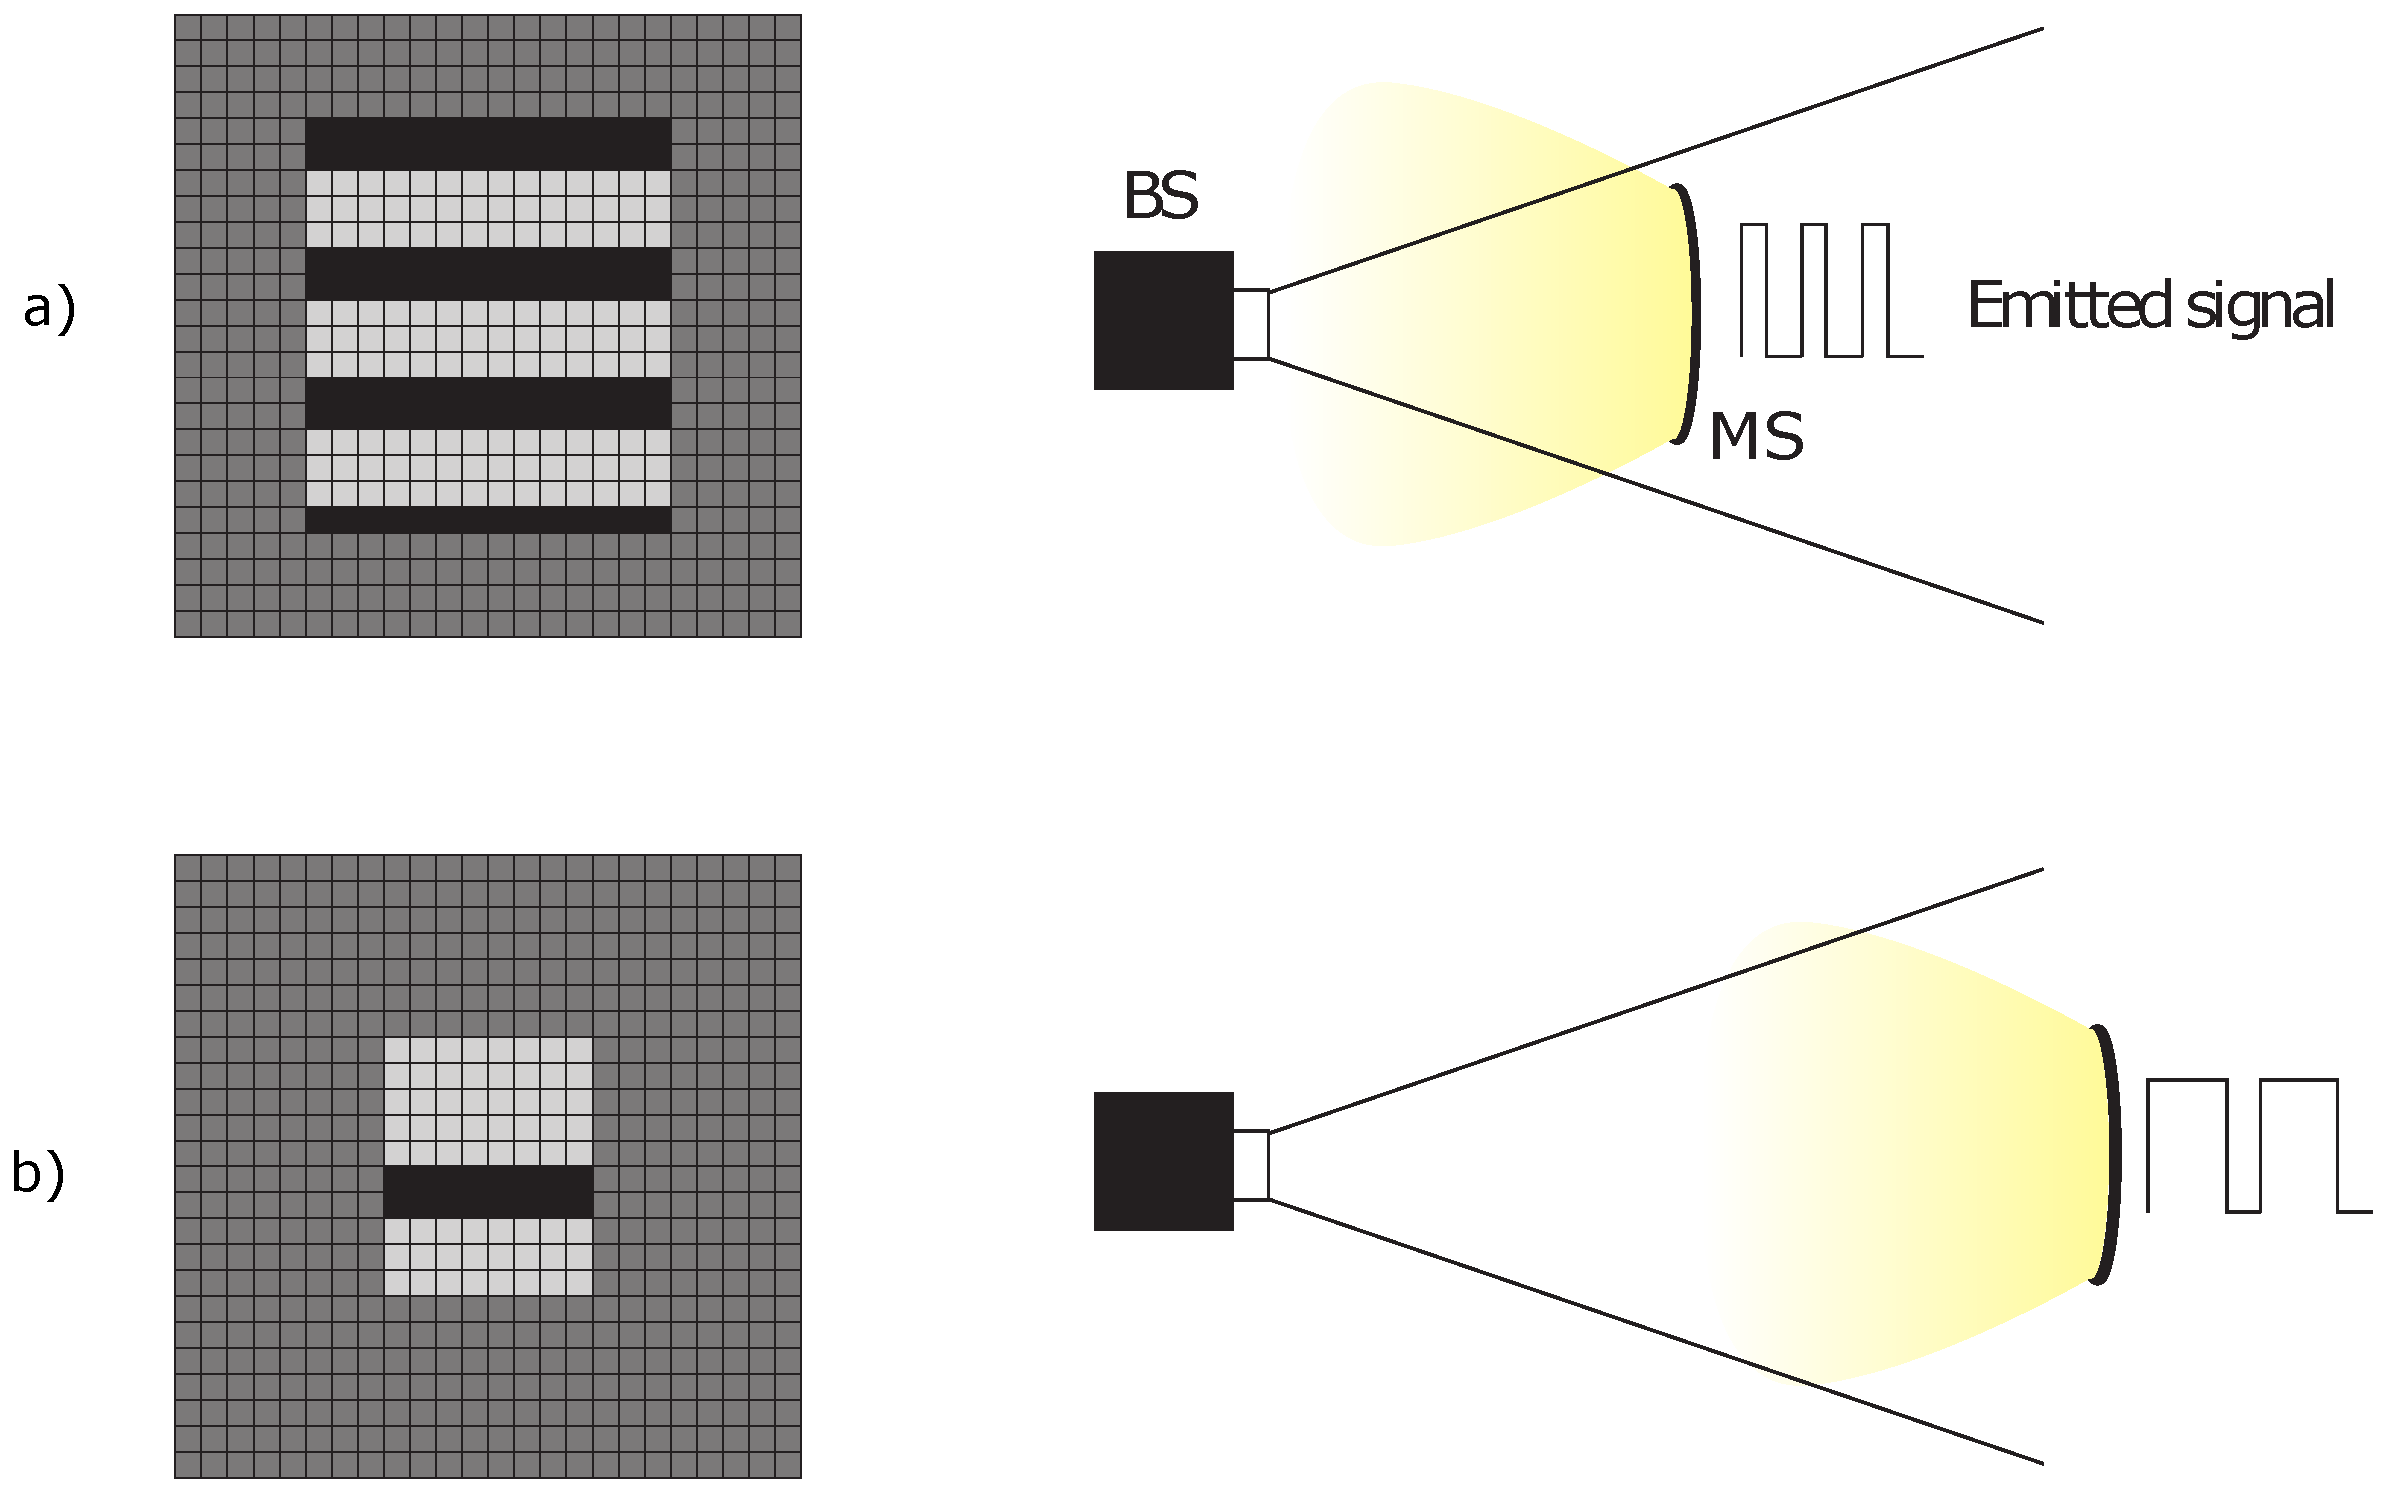
. Hereinafter, for simplicity but without loss of generality, this uncertainty is neglected. Furthermore, the pulse duration is calculated as the maximum size of all the detected pulses within the Region Of Interest (ROI) corresponding to the light source.
Figure 8 illustrates the procedure on a scenario in which several pulses are allocated, and another in which there is not enough space to detect a complete pulse. It must be taken into account that, if the ROI were smaller than
, it would be impossible to estimate distance properly, establishing a measurable-distance upper bound.
In this section, a statistical analysis of the distance estimation error is presented. Furthermore, the implications of the proposed error-mitigation technique on the measurement time are also analyzed. First, let us consider
M runs of the presented pulse detection algorithm. For each measurement, the illuminated row count
n (or detected pulse duration) would follow a probability density function (pdf) determined by
,
, and
. This pdf
is discrete and is governed by Equation (
8). It was assumed that the starting point of the pulsed signal follows a uniform distribution. The pdf was calculated analyzing the amount of cases for each number of rows
n within a determined window of height
.
where
is the floor operation. Note that the pdf can be roughly approximated by a Dirac’s delta at
plus a uniformly distributed function at the rest of possibilities. After this pdf, a row-count error pdf
could be derived from the difference between the correct detection (
) and the performed measurement (Equation (
9)). In this case, the change of variable
was applied and the pdf from Equation (
8) appropriately modified.
This error can be scaled to distance error using Equations (
1) and (
7), yielding the final distance-measurement error pdf
(Equation (
10)). This error is the difference between the actual distance (
d) and the estimated one (
). The estimated distance depends on the number of detected rows (
n), the sound speed (
), and the time resolution (
.
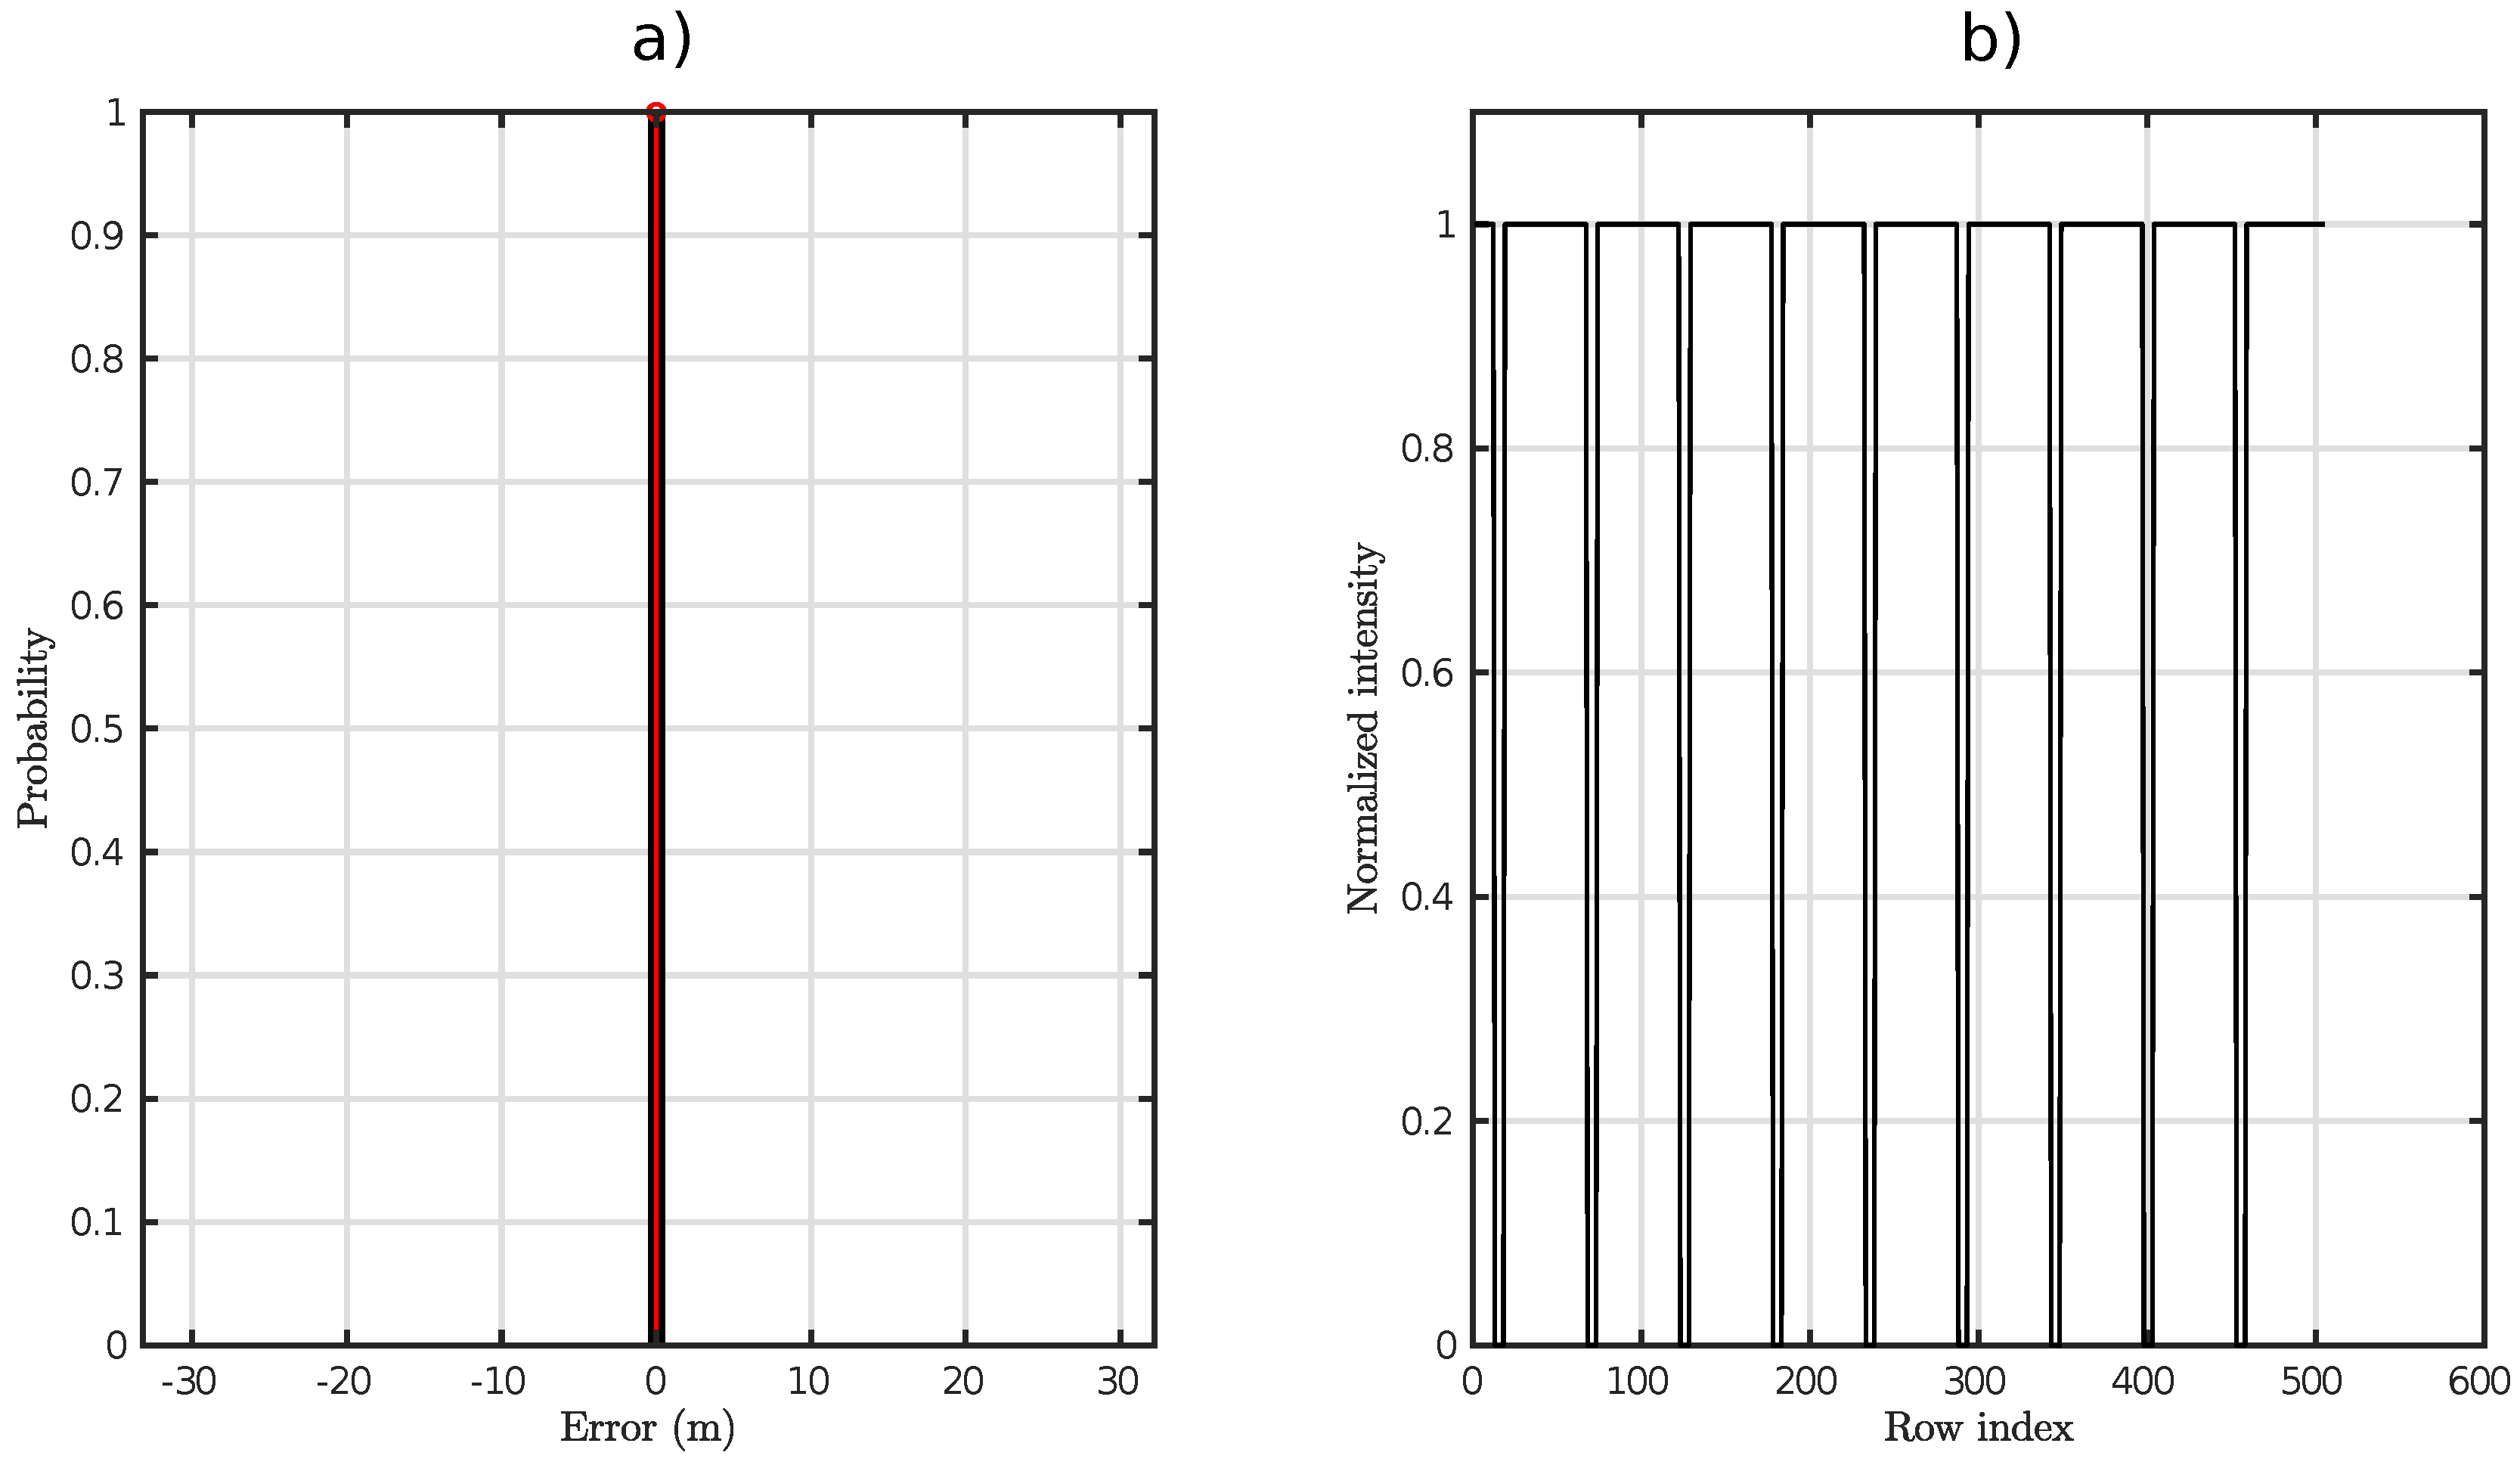
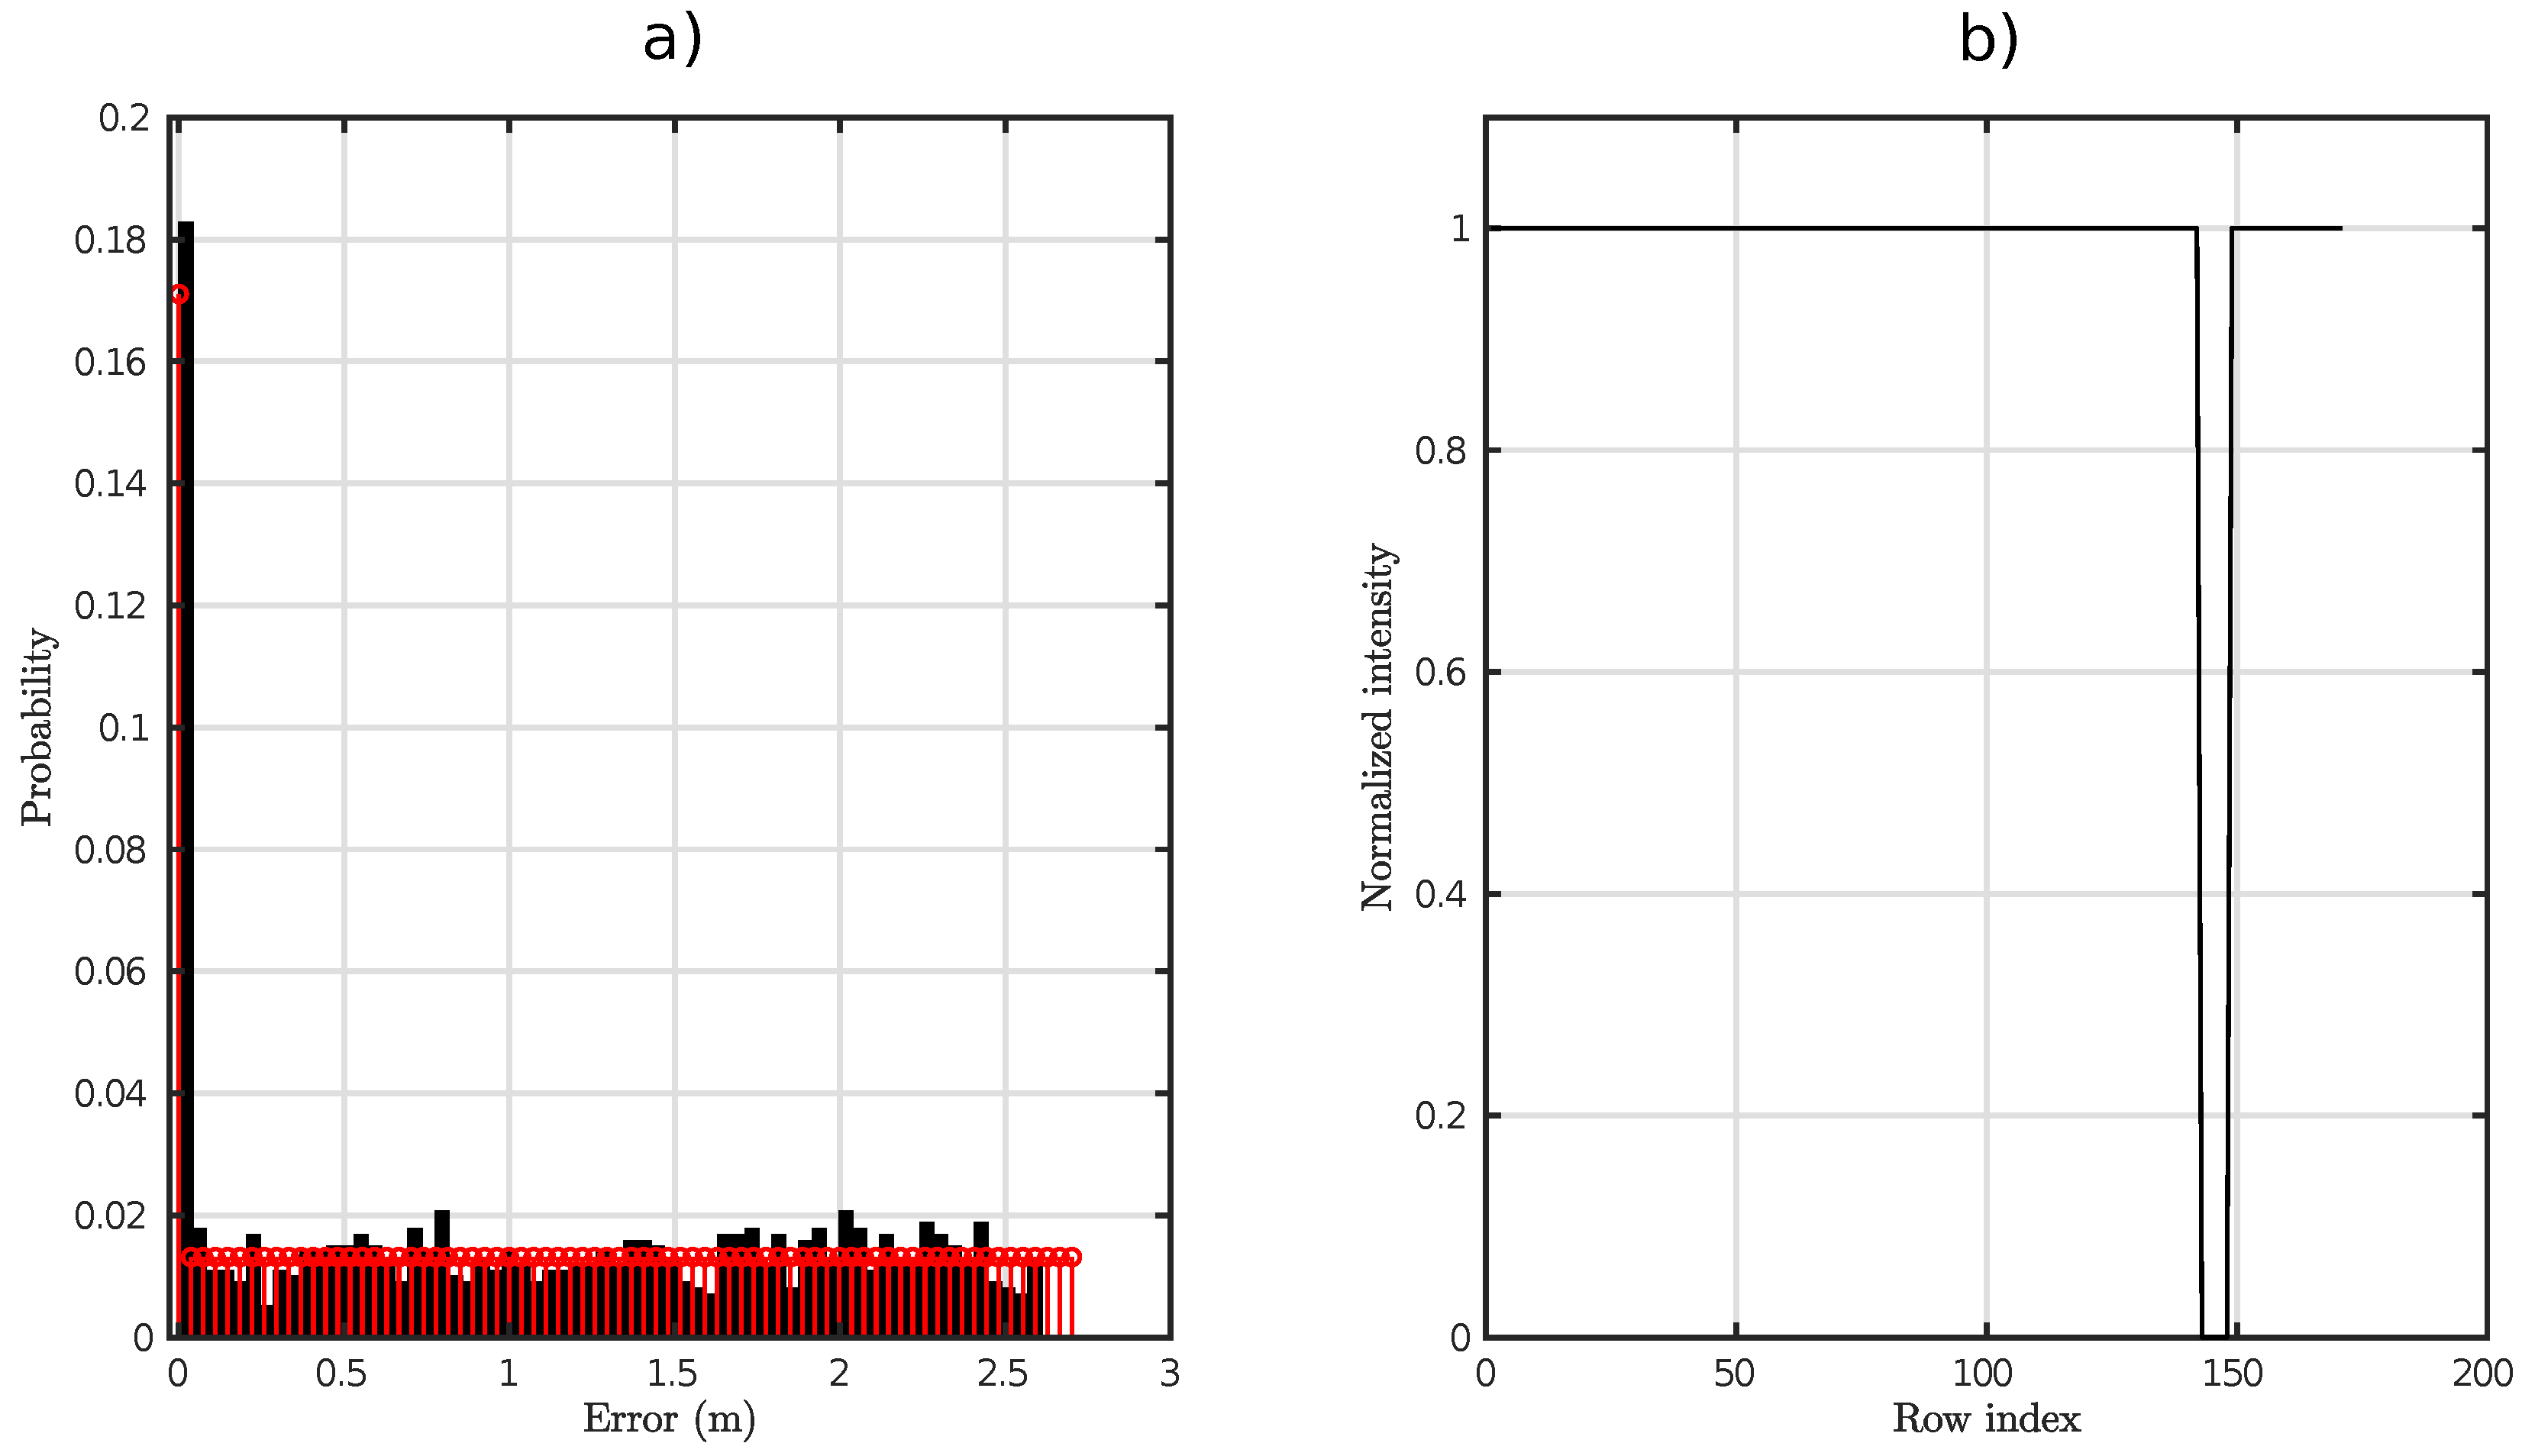
The three probability density functions present the same shape, since their underlying variables (n, r, and e) are related by linear transformations. This means that the final distance error depends on the row-counting mismatch. When the light source’s projection is large enough, the distance error measurement would tend to zero since the pulsed signals would be entirely allocated within the ROI. On the other hand, as the ROI decreases (which is the scenario corresponding to the presented pdfs), the detected number of activated rows could be lower than the actual period of the signal (). When this occurs, there are three possibilities:
The pulse is allocated entirely (, , ). This corresponds to zero error.
The detected pulse size is smaller than the actual one (, , ). This part of the pdf corresponds to a uniform distribution, whose span ranges from 1 to .
The last item corresponds to the case in which the detected pulse is half the actual one. This only occurs when the difference between and is even.
Since the shape of
is asymmetrical, error reduction based on averaging is not optimal. However, there is a predominance of the zero-error measurement with respect to the uniformly distributed rest. In this work, an error-reduction technique based on the mode of a sequence of
M measurements (
) is proposed (Equation (
11)).
where
is a M-element vector of measurements,
is the final estimated pulse length, and
is the maximum value of the mode (since several maxima can be found on
). Focusing (for simplicity) on a situation in which
were odd, and naming
p and
q the probabilities of no measurement error and the rest respectively, the following analysis regarding
can be made.
where
denotes cardinality, and
is the Binomial distribution. The last equations establish the statistical behavior of the absolute frequencies for each possible measurement. The number of correct measurements (
) follows a Binomial distribution with
M tries with success probability
p (first equation).
p corresponds to
from Equation (
8). The second equation describes the number of occurrences for each row count. It must be taken into account that this definition arises from conditional probabilities, and the Binomial distribution of the
jth element depends on both the boundary condition of the third equation and the distribution of the
th element. This definition leads to a
dimensional probability density function, in which each capture is considered independent. In this case, the mode is associated with the superior argument maximum of the cardinality vector. This problem must be solved numerically, which is illustrated in
Section 6.
7. Discussion
In this work, a new distance estimation technique, based on TDoA and VLC OCC systems, is presented. It consists of a variation of another proposal of the authors, which uses optical pulses instead of RF signal as in Cricket systems. The novelty of the present system is the use of a camera as an optical receiver and the performance of time intervals calculations employing image processing techniques. The proposed method is based on the characteristic of the RS cameras, which allows the association of a pulse time interval to the height of the illuminated area produced by this pulse in the camera’s captured picture.
The system’s resolution and range depend on the camera’s video recording frames per seconds and the image’s number of lines used in the RS CMOS sensor. Some millimeters of resolution and tens of meters range are viable capabilities of this kind of systems, and this will be improved with the introduction of faster (more fps) and higher quality (more RS lines) cameras. Furthermore, some advantages are introduced by the proposed scheme such as the capability of several simultaneous distance measurements, since several spots can be present in the same image, and the possibility of being integrated into commercial devices. Smartphones, tablets, and other appliances are provided with LEDs (flash, for example), sound emitters (loudspeaker) and receivers (microphone), and cameras, which are the essential components of the devices used in the proposed system.
The results presented in the previous section assume no error in the hybrid optoacoustic TDoA ranging stage. In actual implementations of this system, the measured time difference would be affected directly by the detection electronics of both optical and ultrasound front-ends. In addition, the BS’s emitted power and the channel’s path loss would also impair error performance. Nonetheless, taking into account that the OCC-based feedback limits the maximum achievable ranging distance, it is not unreasonable to assume at least centimeter accuracies.
From the extracted mathematical formulation, there is a range of distances in which the error would be uniquely subject to the uncertainty defined by the row-count rate
. However, beyond the above-defined critical distance, errors induced by the appearance of partial pulses in the ROI may appear. This distance depends on both geometric and receiver parameters, as can be observed in
Figure 14.
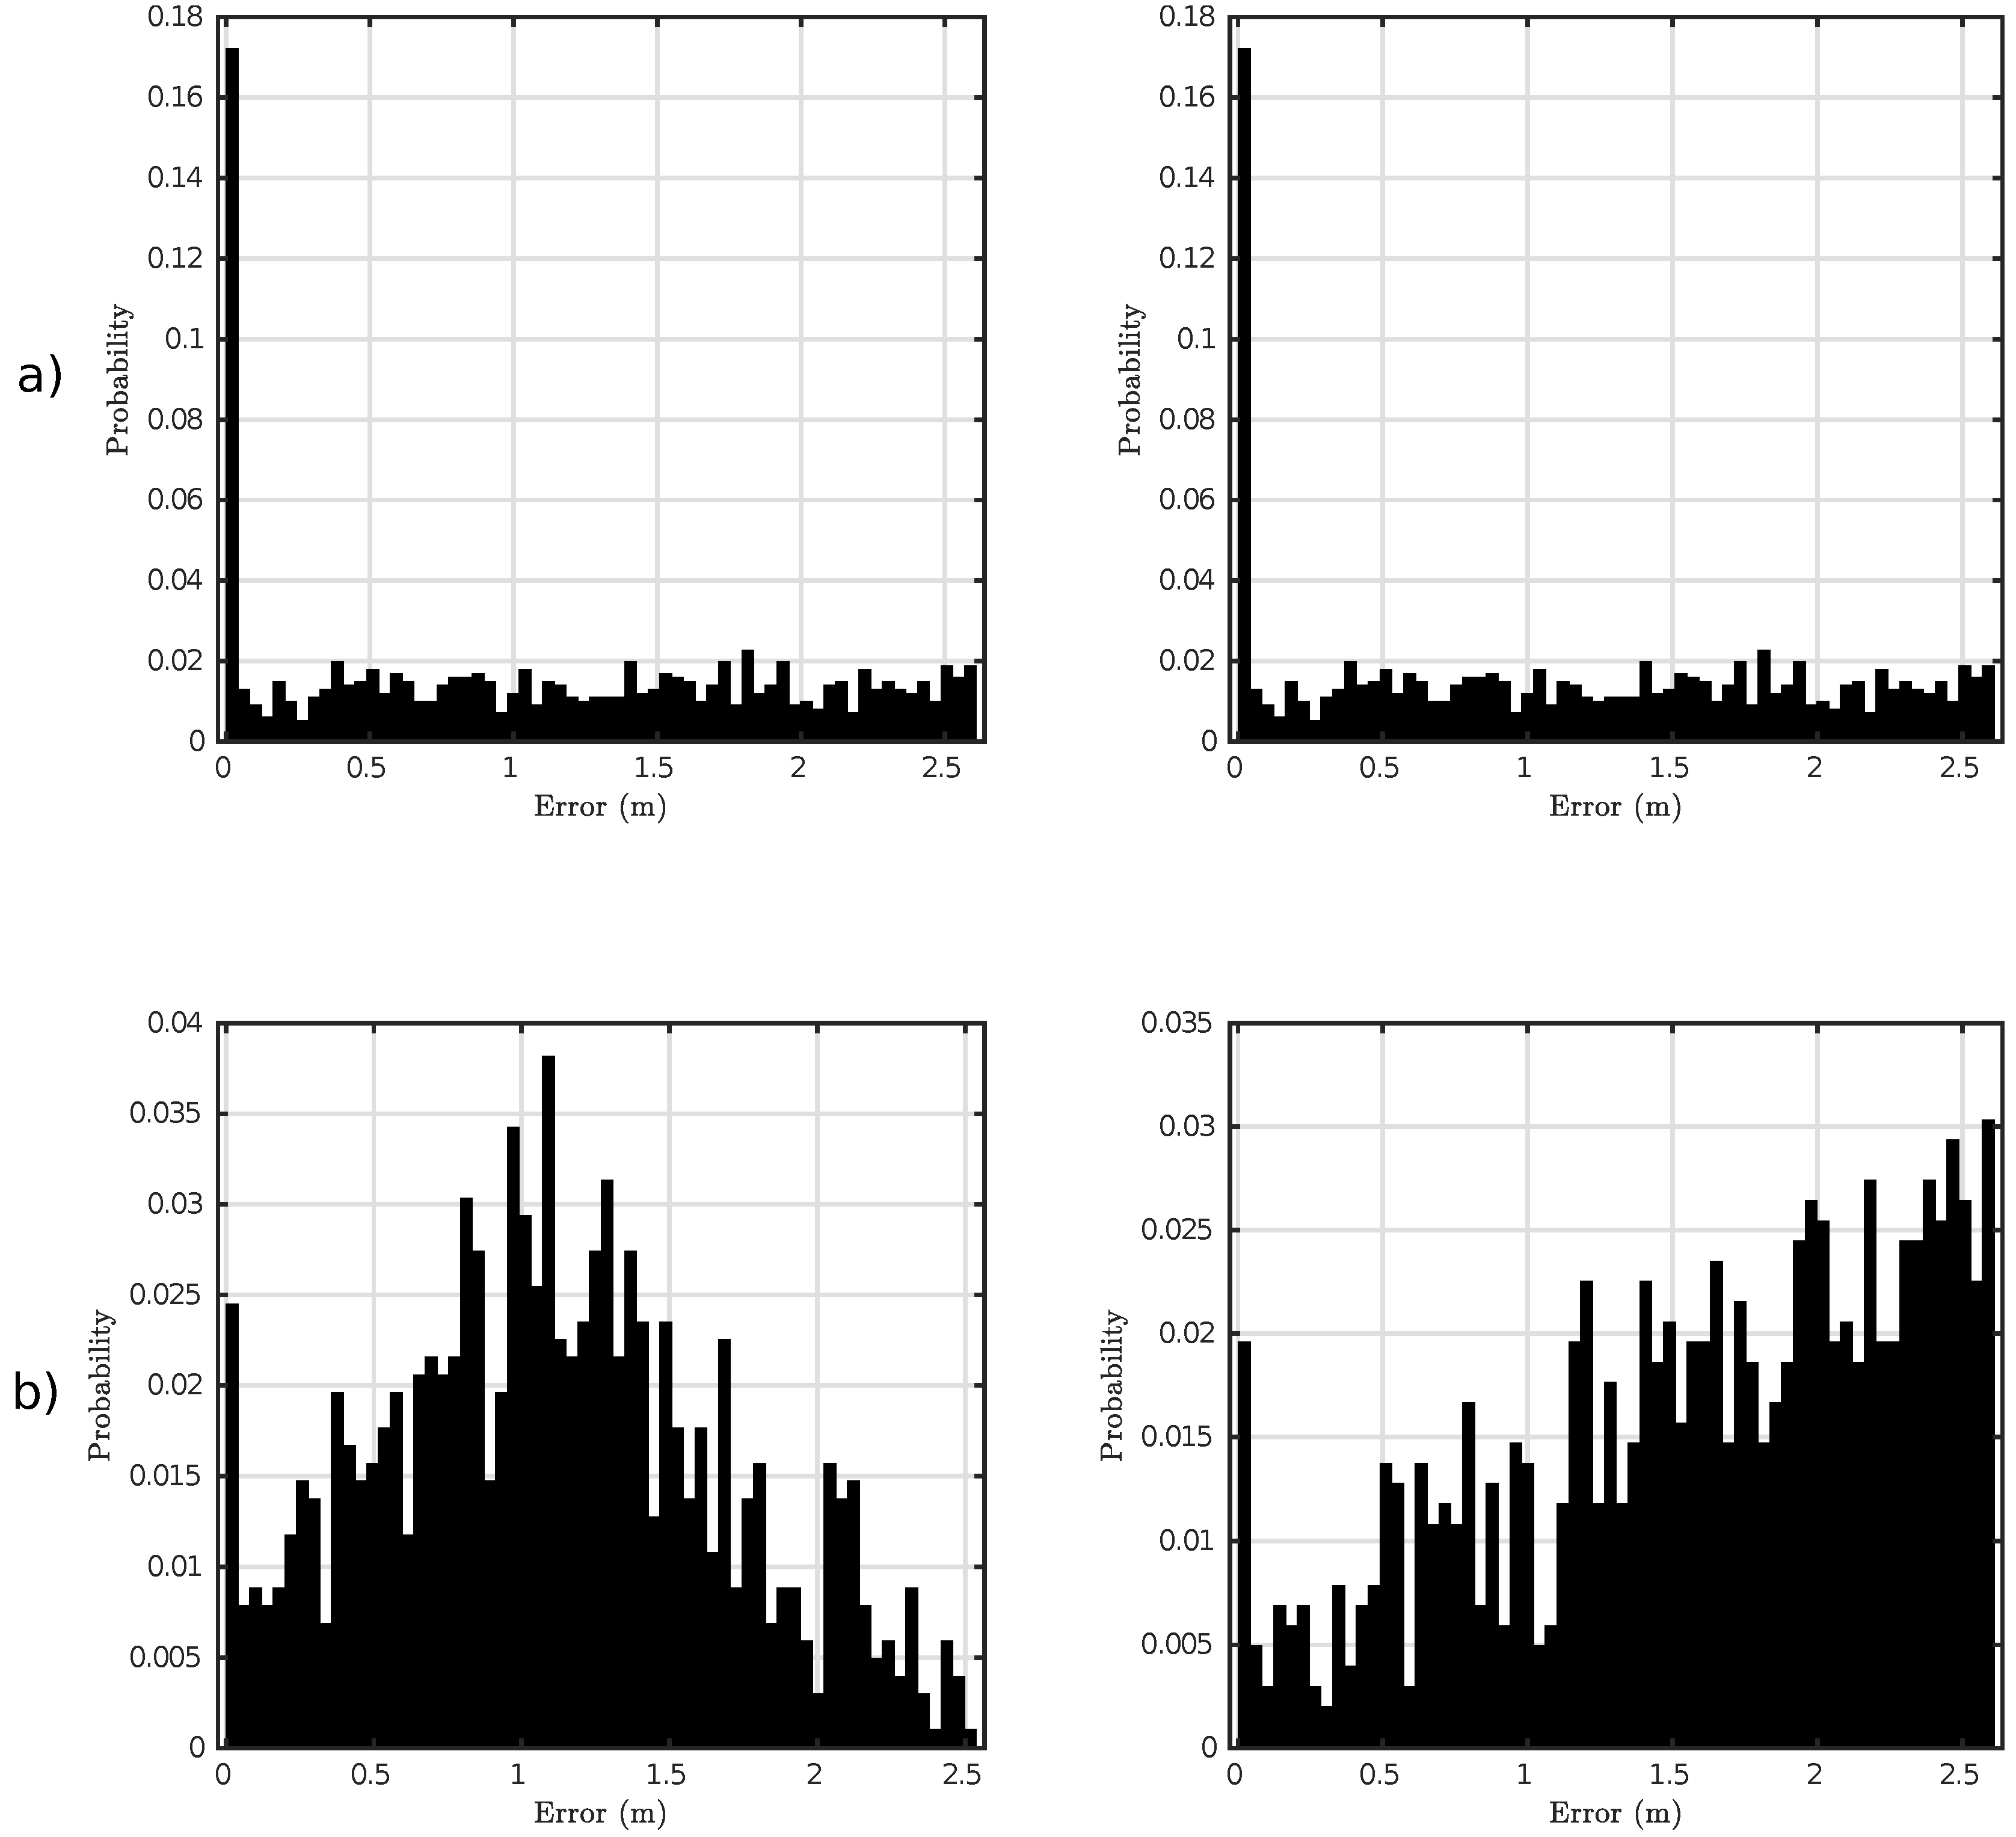
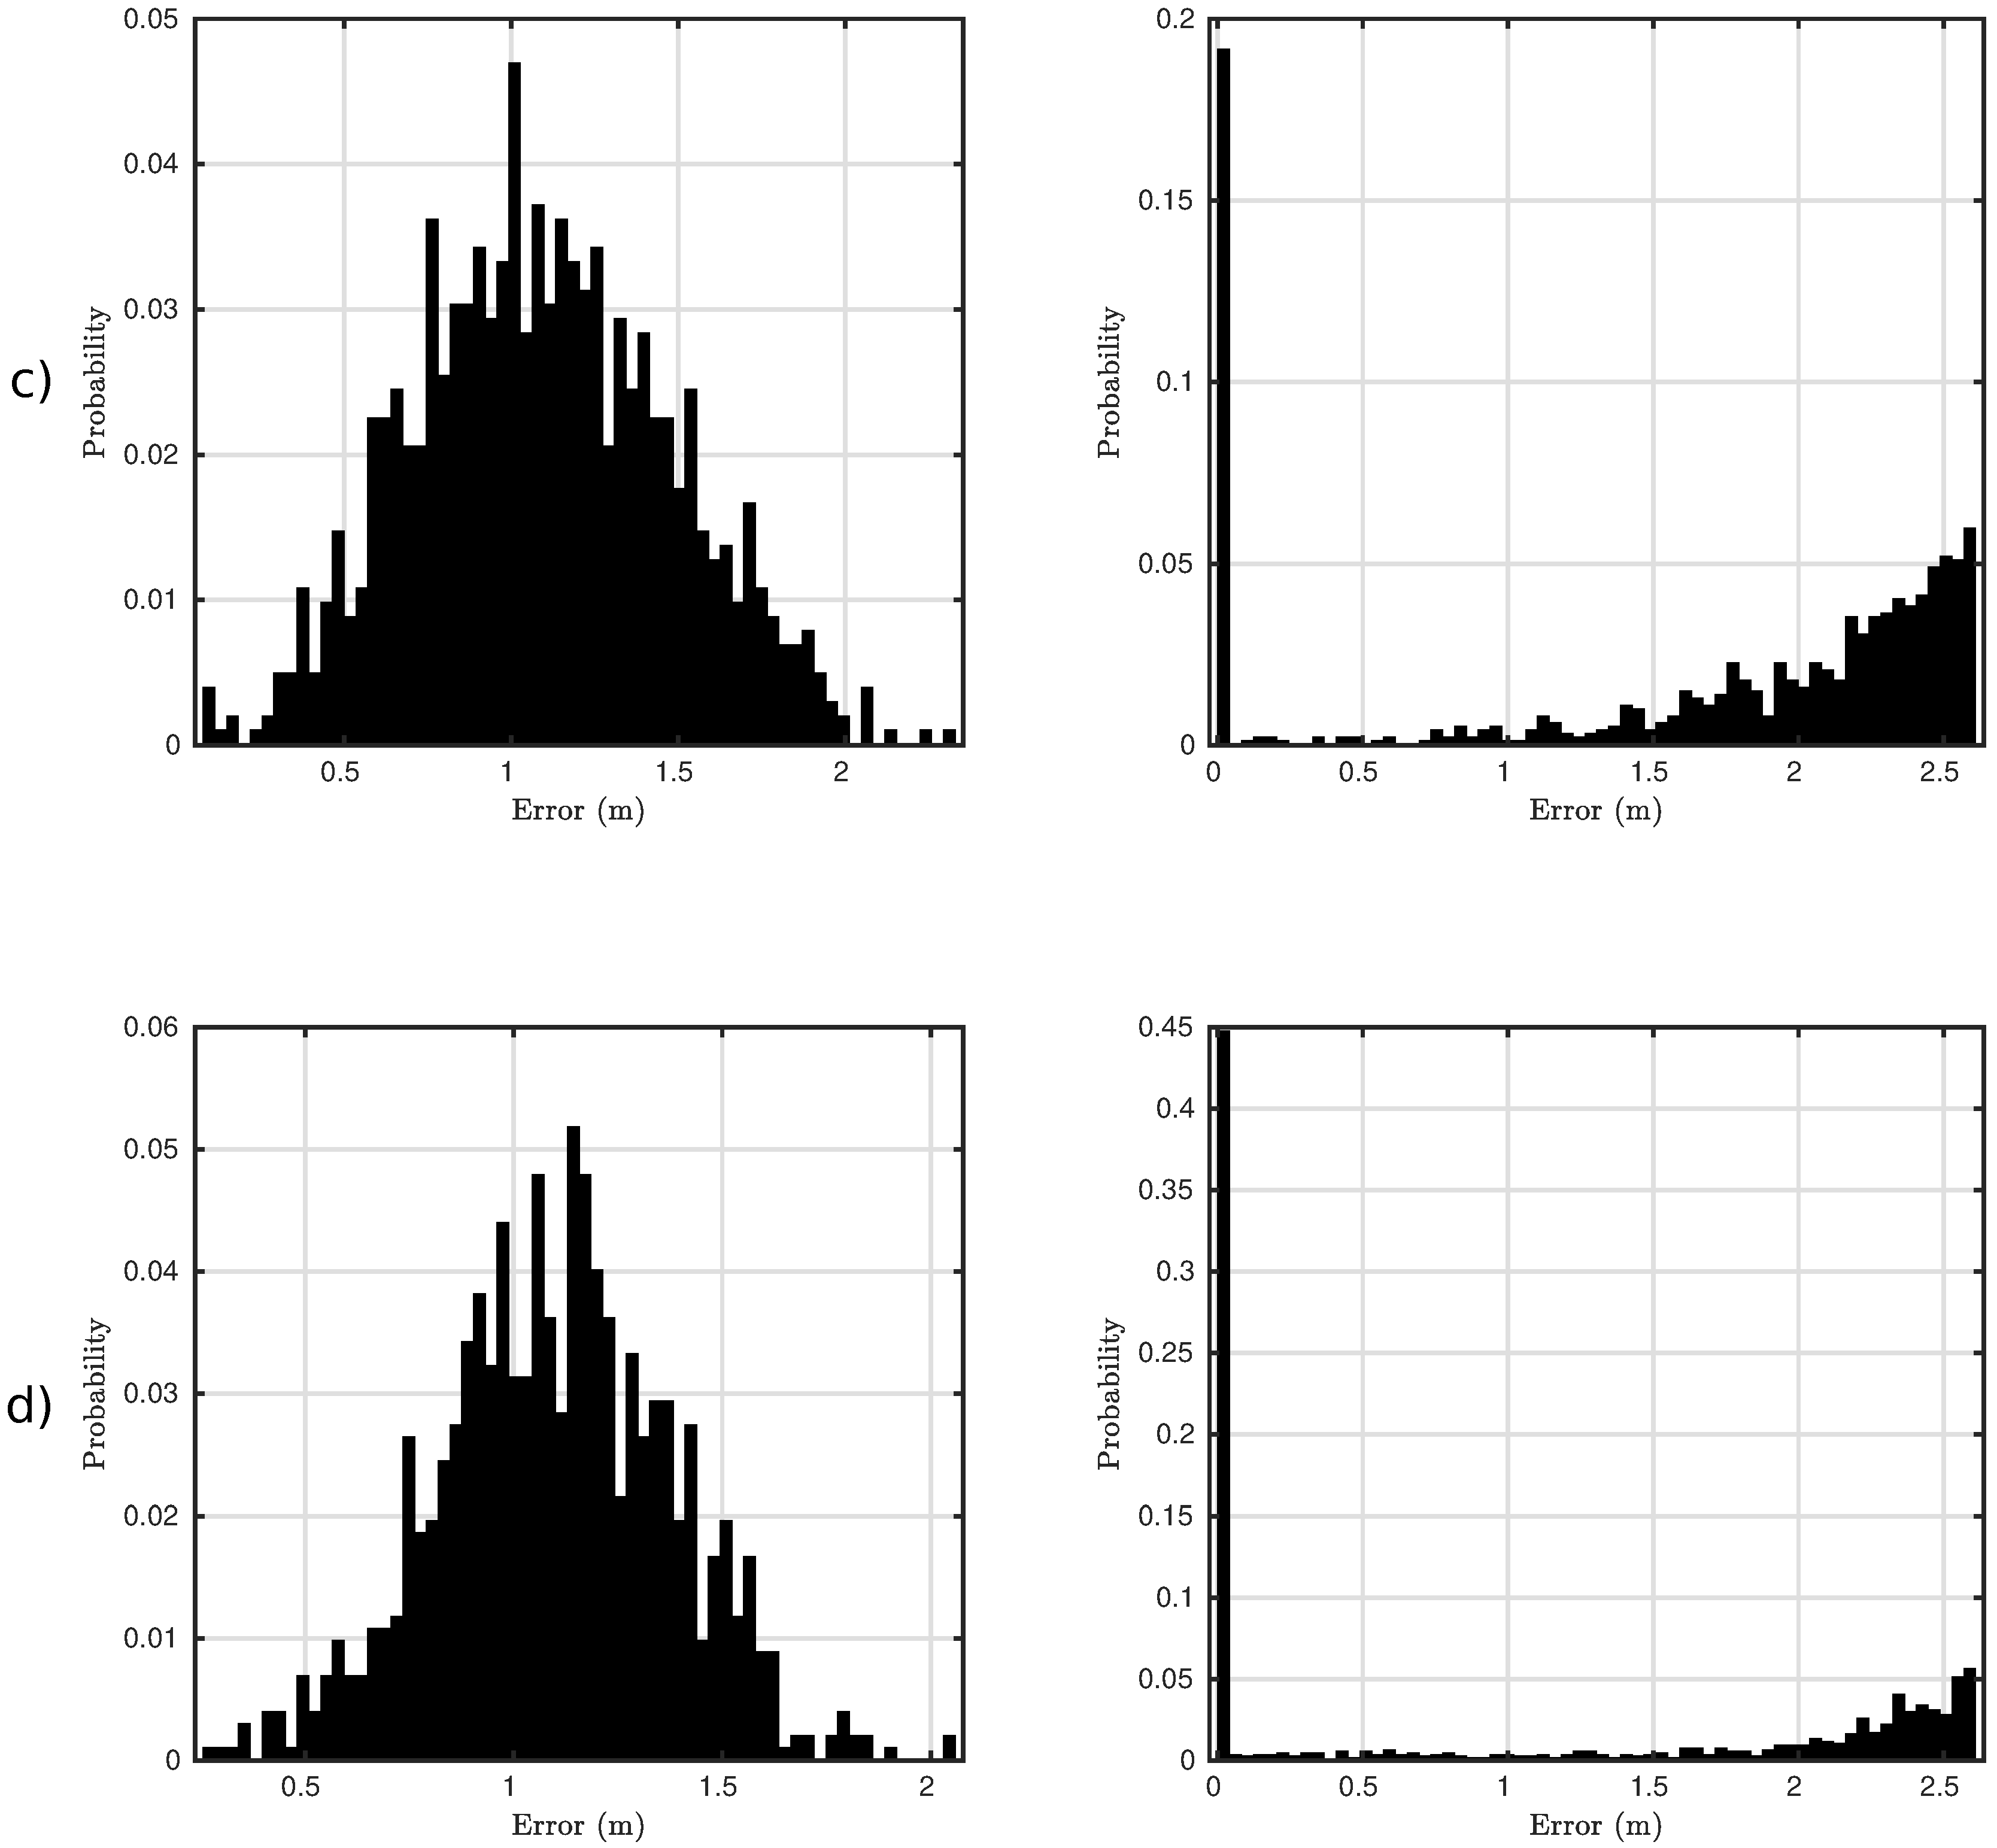
The histograms in
Figure 9 and
Figure 10 validate the mathematical formulation extracted in
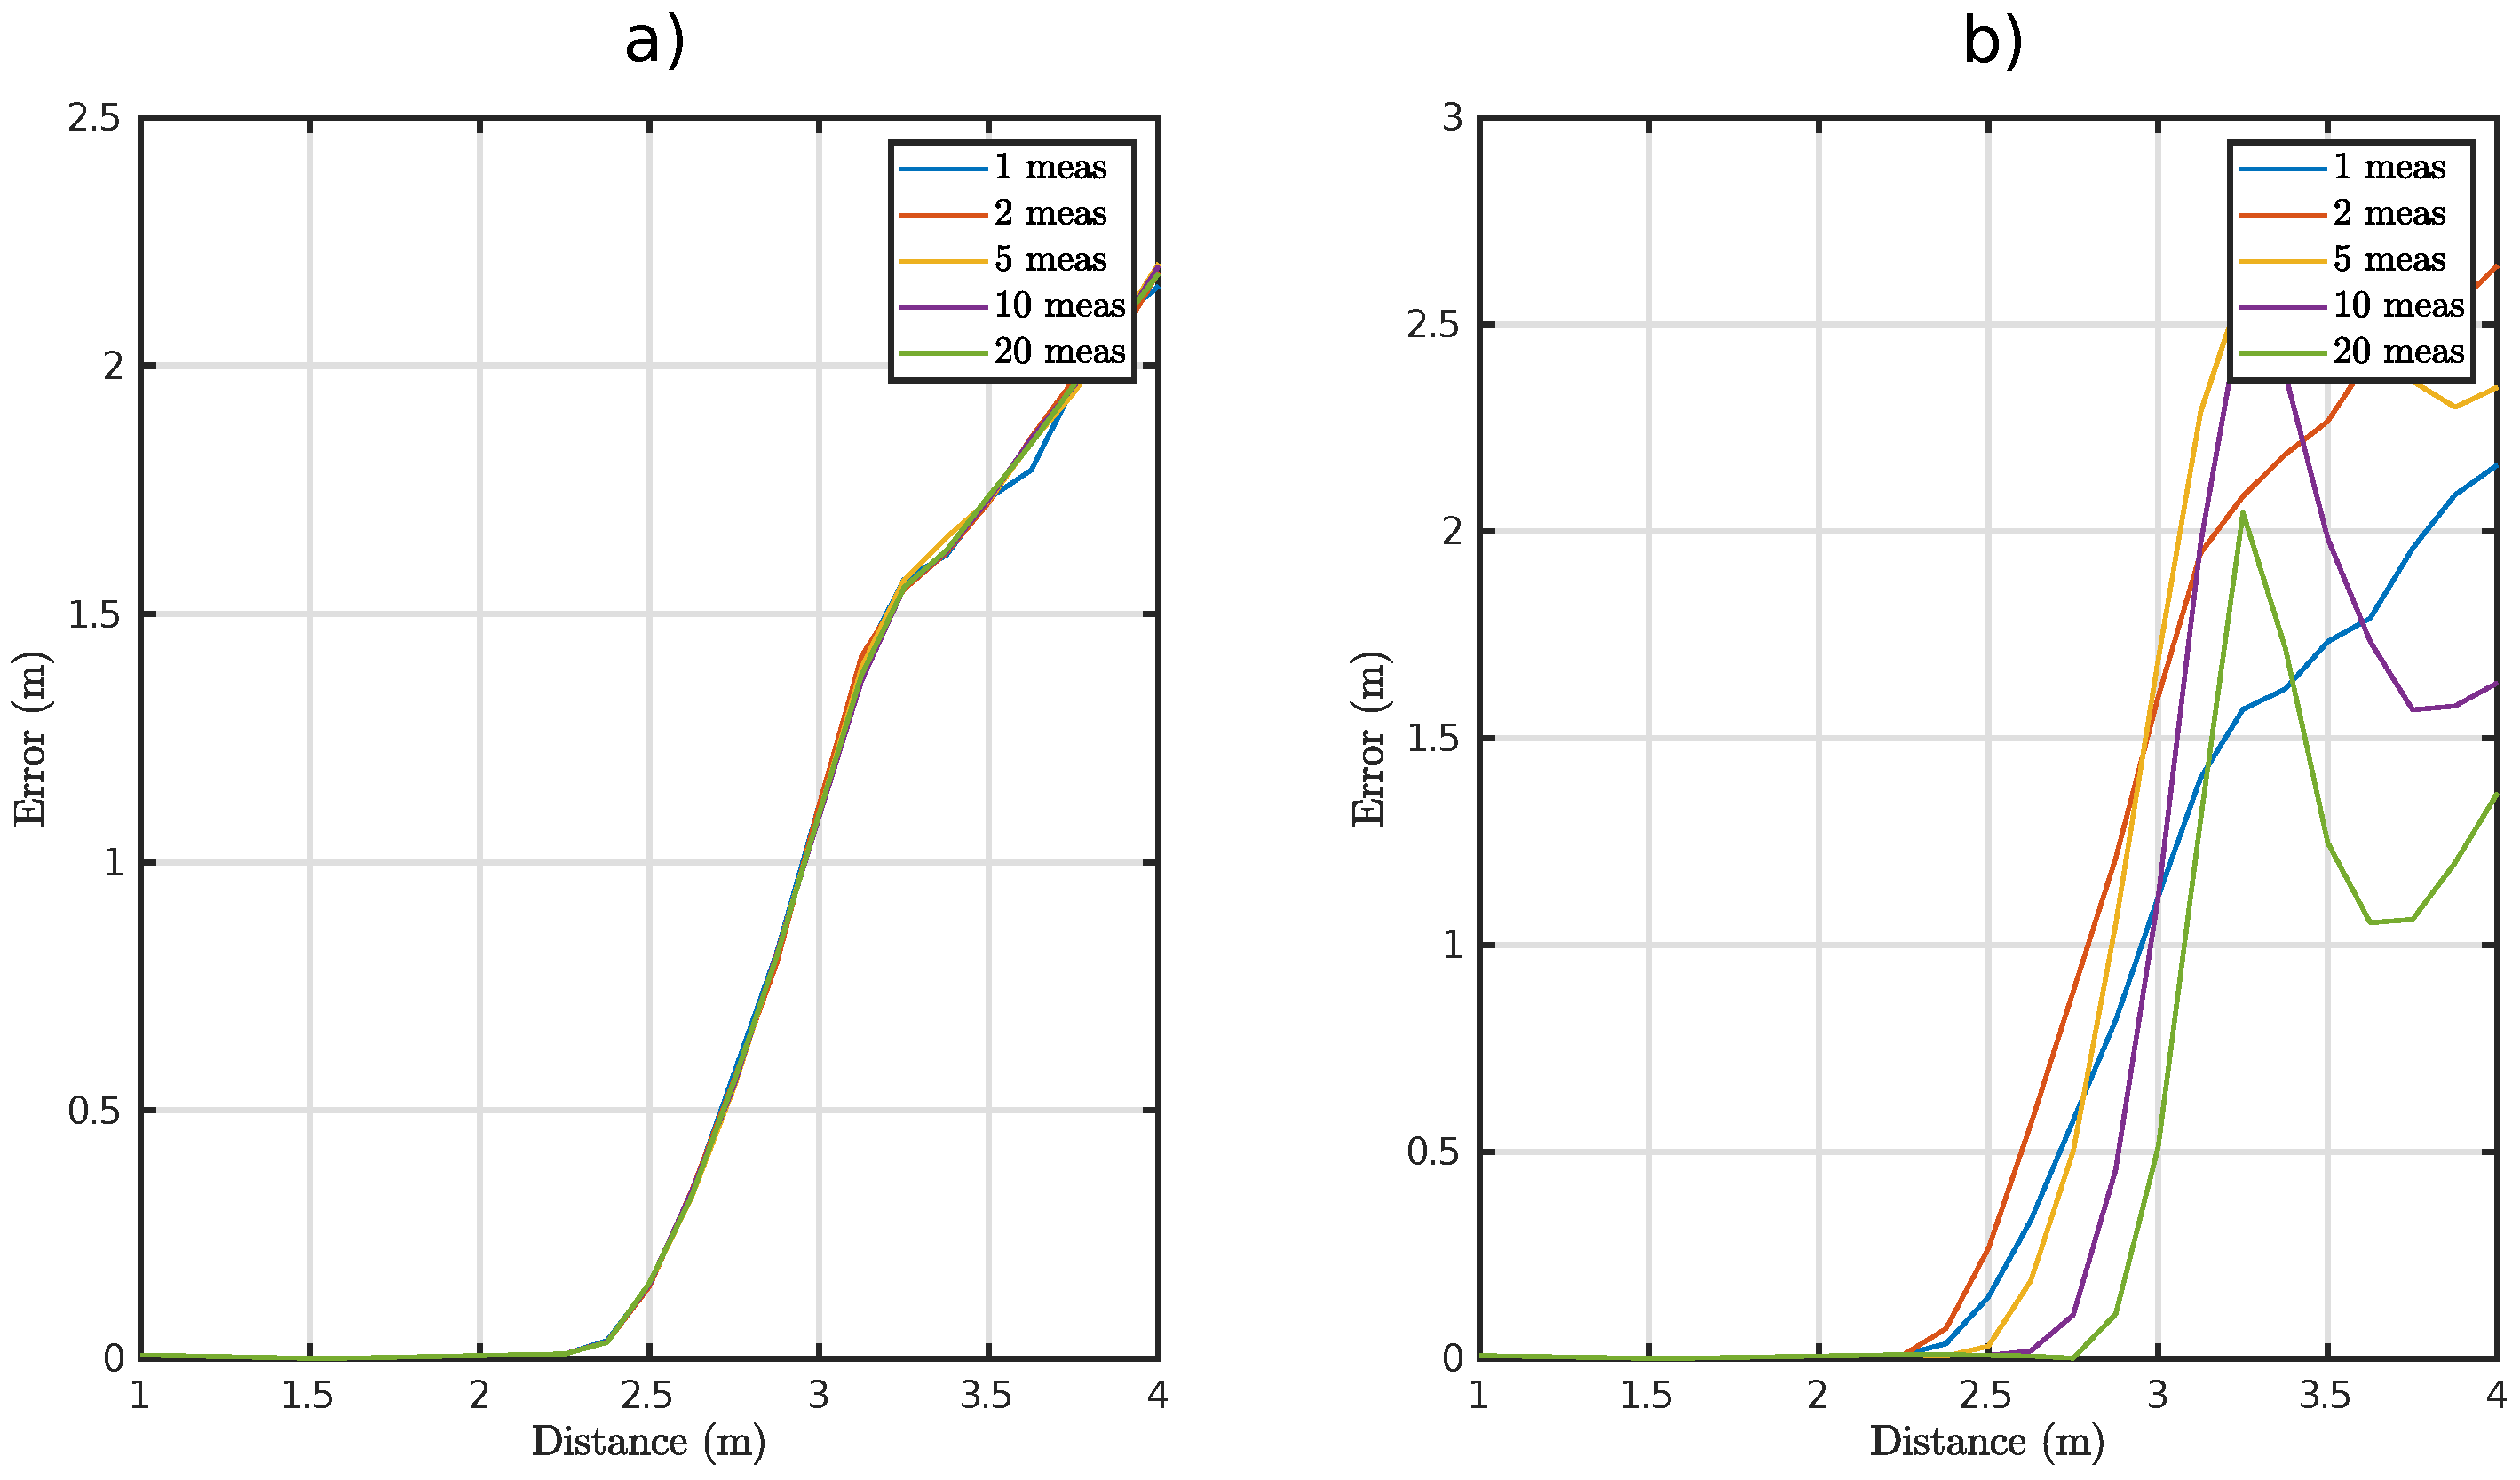
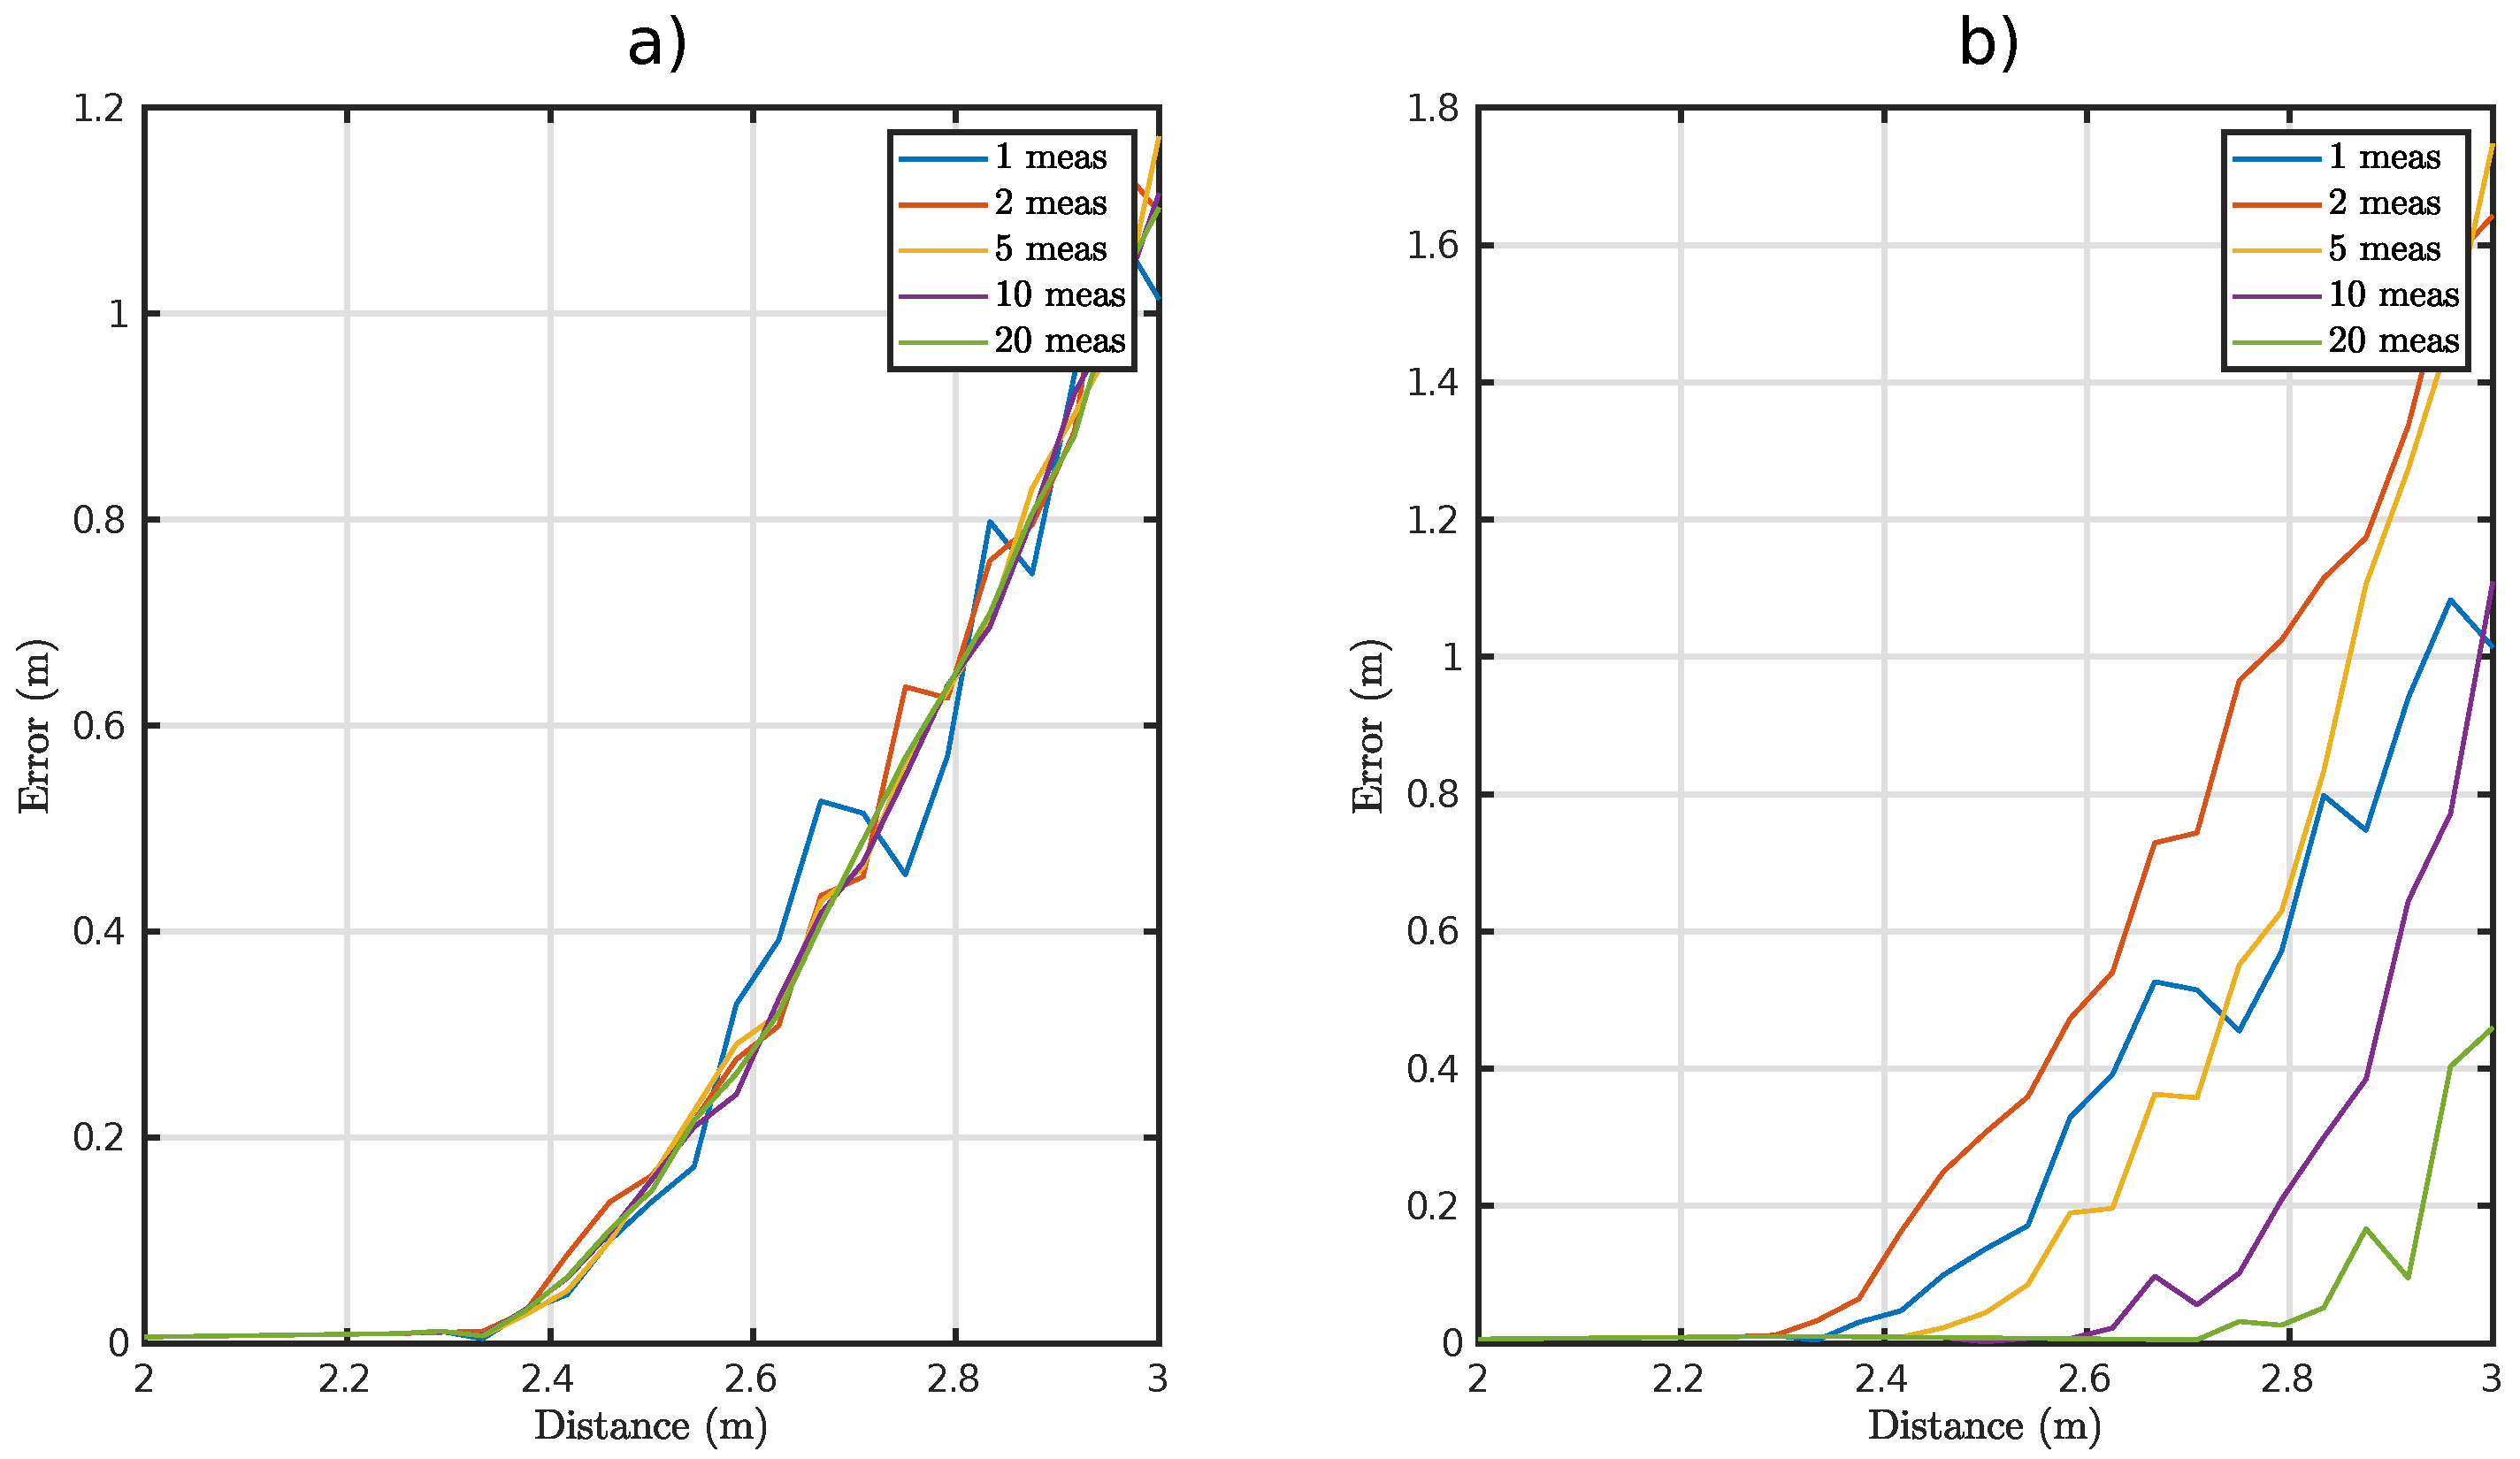
Section 5. Furthermore, it is straightforward to demonstrate that averaging on a set of independent measurements does not eliminate the error but introduces a distance-dependent bias.
From the shape of the error pdf
, the use of the superior mode as an error-mitigation technique is proposed. The improvement on the error performance can be observed in
Figure 12. In the case of the traditional averaging strategy, a higher number of runs does not offer an advantage regarding expected value. However, from the histograms presented in
Figure 11, a smaller variance is expected from the averaging. Regarding the mode-base technique, due to the intrinsic nonlinearity of the statistical mode and the shape of the pdf, both expected value and variance are dramatically reduced. Observing
Figure 12, a significant improvement of the critical distance can be obtained using just 20 measurements, which is translated to acquiring and processing 20 frames.
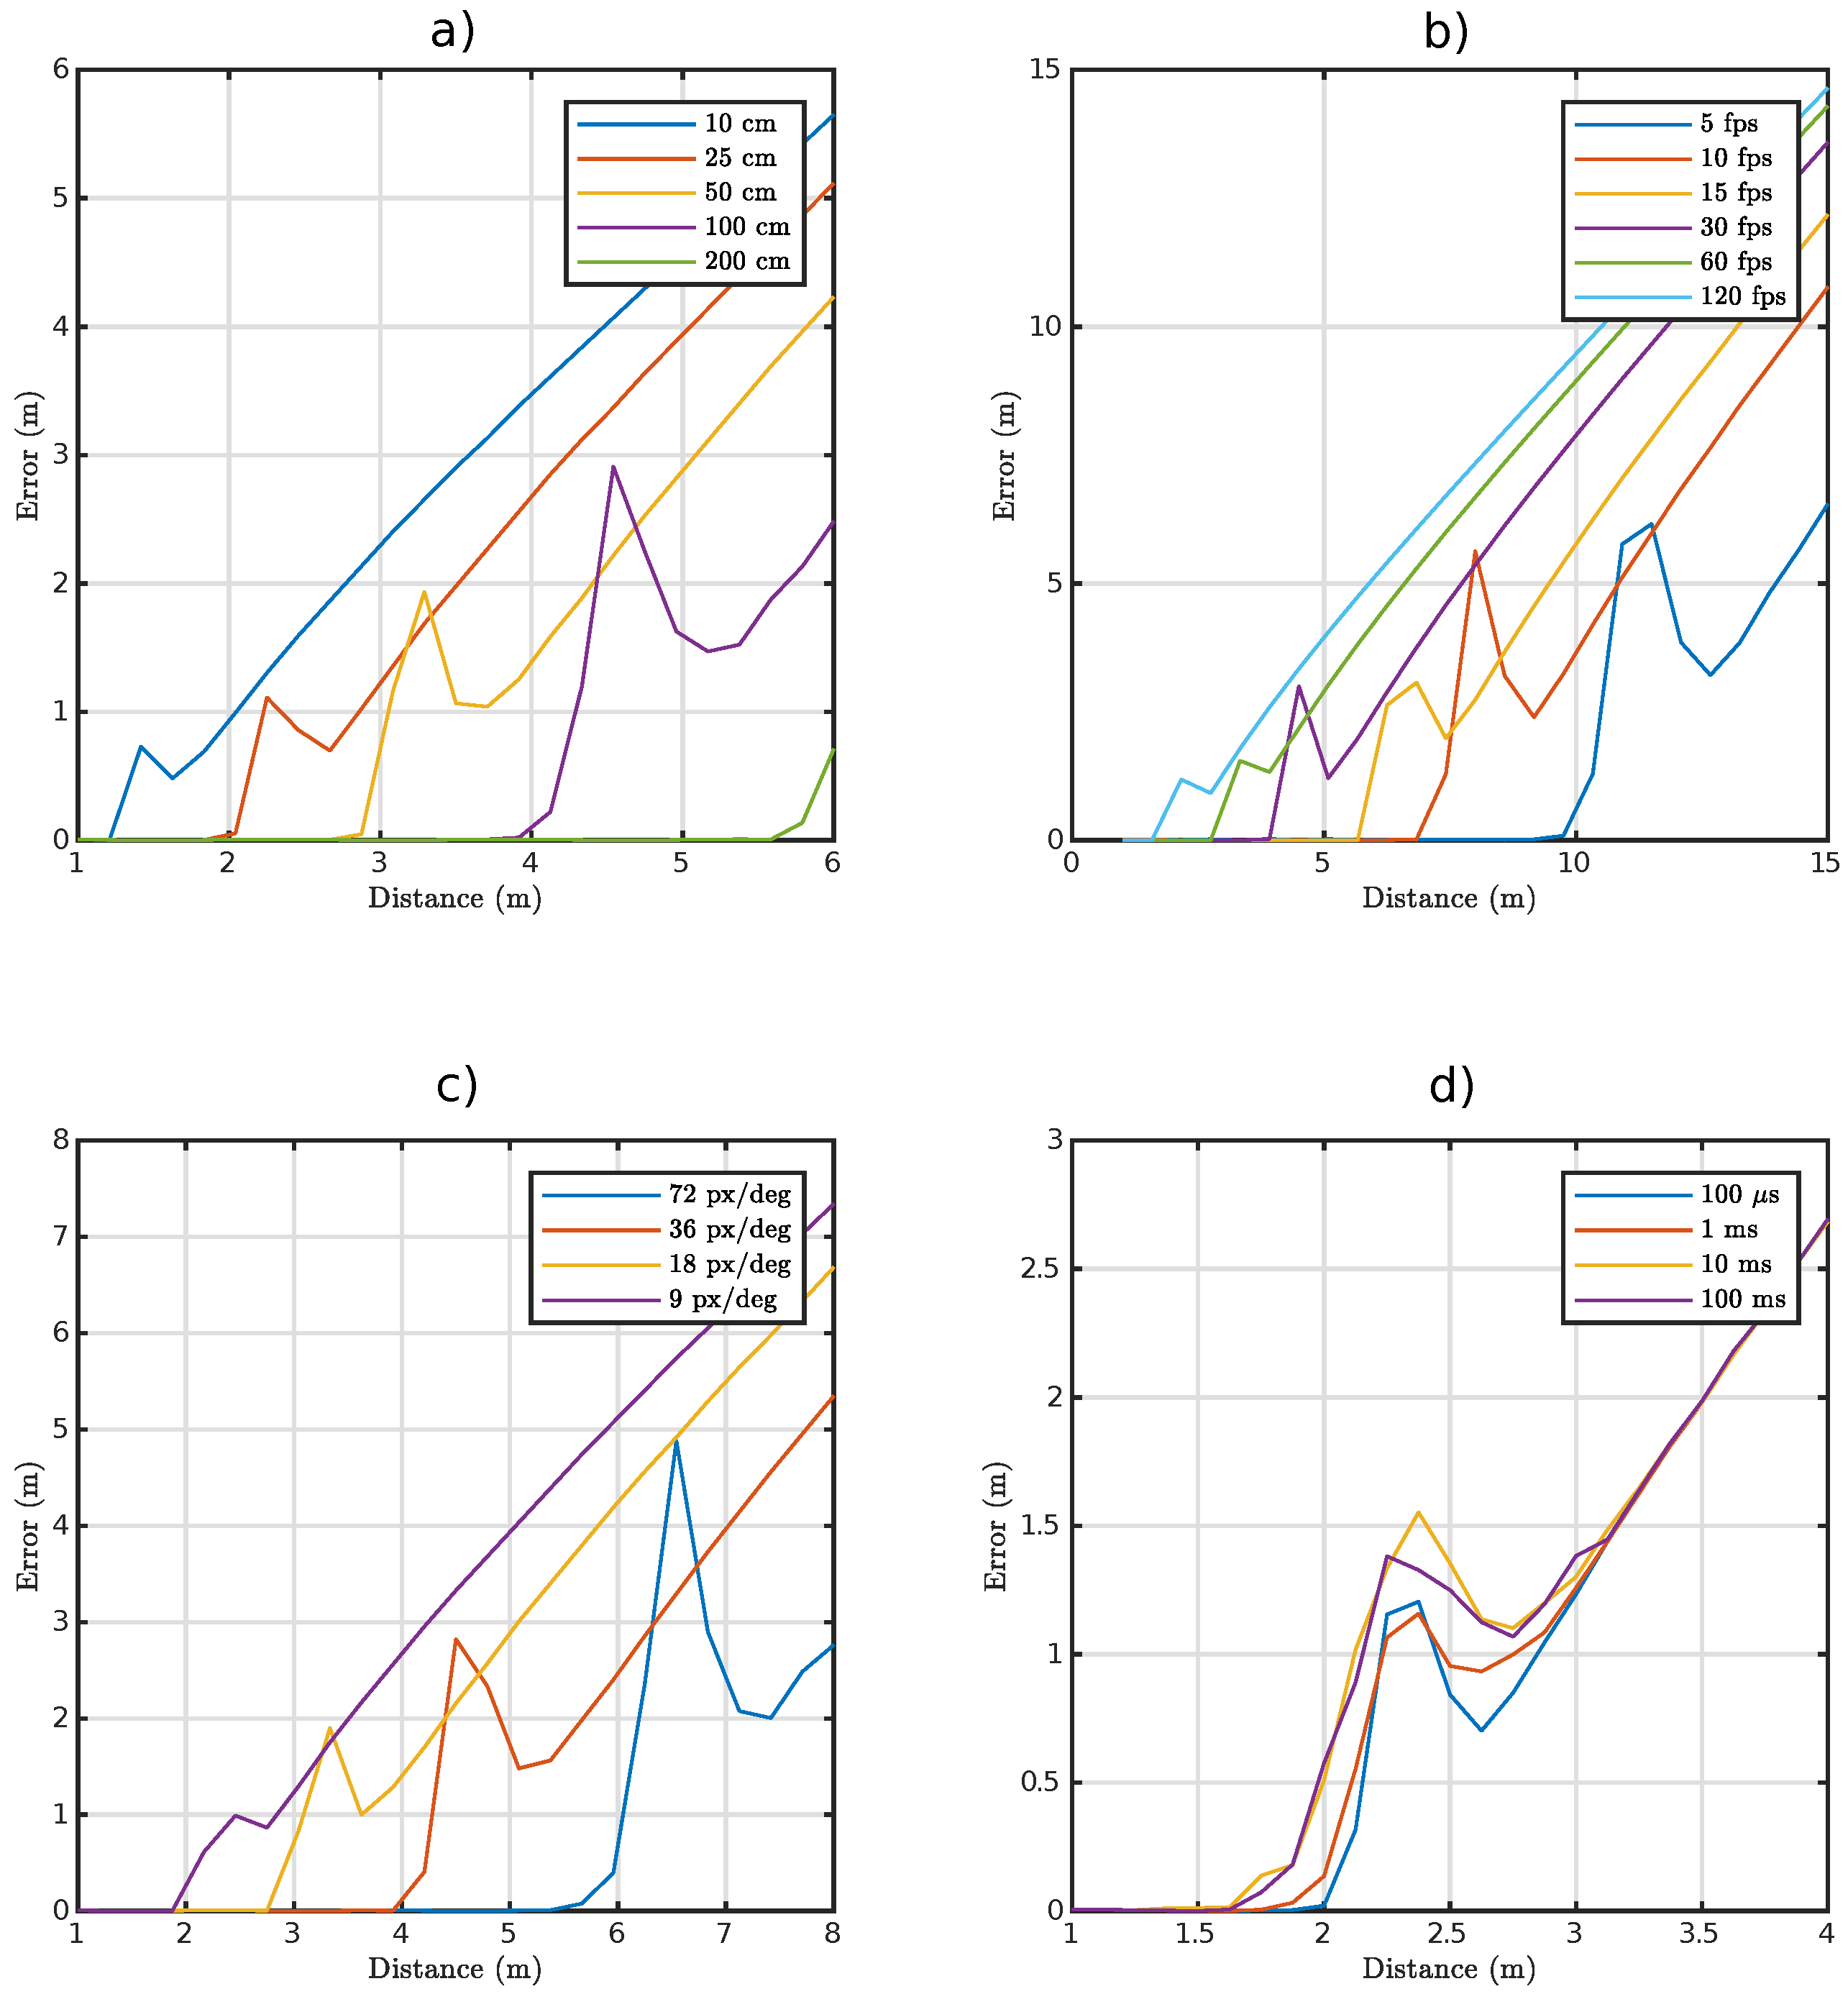
Variations on several parameters were simulated and the results can be observed in
Figure 14. As expected, the bigger the object is, the longer the measured distance can be. This relation is nonlinear and is governed primarily by Equation (
6). In the case of the camera’s capture rate, this relation is inverse. This occurs because the slower the row-reading rate, the smaller an object’s projection on the image sensor can be. However, the uncertainty of the measure would also increase. The angular accuracy (vertical resolution over FOV) has the same impact as the object’s physical size since it affects the projected image in the same manner. Finally, the smaller
is, the more possible acquiring complete pulses within the ROI is (Equation (
6)). Furthermore, significant values of
may lead to a situation in which some frames could present energy-less ROI. This means that no pulse would be allocated inside and, hence, more frames must be acquired with the subsequent increment of the overall measurement time.
Table 3 compares the system’s error performance and complexity with the current state-of-the-art image-based location systems. It can be observed that the use of the proposed TDoA-assisted OCC-based ranging enhances the performance compared to traditional image-based systems. This table shows the performance using the baseline parameters of
Table 2, but they could be pushed further by properly selecting them.
In this work, blooming has been neglected assuming that the irradiance is small enough, but it would affect the error introducing a distance-independent bias and lower bound on . Therefore, the potential effect of blooming could be easily calibrated and compensated.
A possible limitation of the proposed strategy is the possibility of synchronism between emitter and receiver. This occurs when the emitter’s blinking rate is an integer (or close) multiple of the receiver’s capture rate. Then, the acquired frames would not comply with the assumed statistical uncorrelation. To mitigate this harmful effect, a random back-off (e.g., exponential back-off) could be used instead of a fixed .
Finally, the effect of background illumination (sunlight or other light sources) has not been analyzed in this work. Nevertheless, its effects on the measurement performance would be presumably negligible. On the one side, the use of imaging optics maps solid angles to camera pixels, separating the measurement lamp and other illumination sources in the captured frames. This reduces to zero the interference unless the other background sources were overlapped with the ROI. On the other hand, reflections of these background sources (including the sunlight) on the measurement lamp could introduce bias to the perceived signal (the lamp’s projection would present some energy even when is OFF). This effect could reduce the peak-to-peak value of the received signal. Nonetheless, these contributions are first- or second-order reflections, which imply very low energy, and hence very small impact on the system’s performance.


