Article

Study of the Hygrothermal Behavior of Wood Fiber Insulation Subjected to Non-Isothermal Loading

by
Zakaria Slimani
1,
Abdelkrim Trabelsi
1,*,
Joseph Virgone
1 and
Roberto Zanetti Freire
2
1
Univ Lyon, CNRS, INSA-Lyon, Université Claude Bernard Lyon 1, CETHIL UMR5008, F-69621 Villeurbanne, France
2
Industrial and Systems Engineering Graduate Program (PPGEPS), Polytechnic School (EP), Pontifical Catholic University of Parana (PUCPR), Rua Imaculada Conceição 1555, Curitiba 80215-901, Brazil
*
Author to whom correspondence should be addressed.
Appl. Sci. 2019, 9(11), 2359; https://doi.org/10.3390/app9112359
Submission received: 10 May 2019 / Revised: 2 June 2019 / Accepted: 3 June 2019 / Published: 9 June 2019

Abstract

:
Building envelopes are constantly subjected to temperature and moisture gradients. This loading induces a complex response, particularly for highly hygroscopic insulating materials. Latent effects can no longer be neglected for these materials in which heat and moisture transfers are strongly coupled. The purpose of this article is to analyze the behavior of a wood fiber insulation subjected to non-isothermal loading under a vapor concentration gradient. An experimental setup and a mathematical model of hygrothermal transfer were developed to analyze the behavior of the wall. The mathematical model describes the main physical phenomena involved, notably water vapor adsorption and the dependence of thermophysical properties in state variables. The experimental setup developed allows studying a wall under controlled conditions. The temperature and relative humidity profiles within the wall were measured. The evolution of the profiles with time suggests that the adsorption of the water vapor occurs together with the redistribution of liquid water within the envelope. The comparison of the experimental results with the numerical model shows good agreement although the prediction can be improved during the transient phase. The comparisons of these results with a purely diffusive thermal transfer model show the limits of the latter and permit quantifying the latent effects on the total heat transfer.

1. Introduction

The construction sector represents a considerable source of energy saving and greenhouse gas reduction [1]. Thermal regulation is constantly evolving and increasingly reduces energy consumption [2]. Therefore, a type of building is emerging characterized by strong thermal insulation intended to limit losses through the envelope. Under these conditions, large heat fluxes by conduction are considerably reduced but it is no longer possible, to neglect latent effects, especially for strongly hygroscopic materials. Furthermore, we are witnessing renewed interest in low-energy impact materials and especially for plant-based materials such as wood and its derivatives whose strongly hygroscopic nature is known. This interest can also be explained by the moisture buffer effect of this type of material on the hygrothermal behavior of buildings [3,4,5].
The literature includes several analyses of the behavior of plant-based materials, assemblies, and structures which propose experimental data to validate numerical models of Heat, Air and Moisture (HAM) transfer. Roels et al. [6] studied the response of several assemblies composed of wood wool cement board. Experimental results focused on water content discussion. They showed that the theory of Philip and de Vries [7] gave satisfactory results for simulating wetting–drying. Talukdar et al. [8,9] presented a very complete study on a dataset for benchmarking 1D transient heat and moisture transfer models of spruce plywood and cellulose insulation in two parts. The first presented their experimental setup and its calibration, while the second presented experimental, numerical, and analytical results that could be used for benchmarking. Teasdale-St-Hilaire et al. [10] focused on wood-frame wall assemblies wetted by simulated wind-driven rain infiltration. The analysis mainly dealt with the distribution of water content in the wood during drying. Li et al. [11] presented extensive data from a laboratory experimental program in which full-scale wall panels were used for model validation. The latter focused only on water content in a 2D configuration. Piot et al. [12] developed an experimental wooden frame house to provide data for the validation of numerical models for whole building heat, air, and moisture transport. They highlighted the importance of temperature-driven moisture diffusion in the case of exterior hygroscopic paneling. Desta et al. [13] presented experimental data on heat, air, and moisture transfer through a full-scale lightweight building envelope wall under real atmospheric boundary conditions. It was found that if the walls were sufficiently airtight the amount of accumulated moisture in the winter season was limited and dried out in the summer for the given configuration. For the same wall type, Langmans et al. [14] performed exeprimental and numerical study to analyse the hygrothermal consequences of using an exterior air barrier. They highlighted buoyancy effects for high walls (above 2 m). Rafidiarison et al. [15] presented a dataset for validating 1D heat and mass transfer models within building walls with hygroscopic materials. They showed that moisture accumulation was observed in the layer close to the plaster for the wall without Oriented Strand Board (OSB). Latif et al. [16] carried out an in situ experiment on a full-scale timber frame test building to study the hygrothermal performance of wood-hemp composite insulation in timber frame wall panels with and without a vapor barrier. They observed a very low impact on the U-value for the stresses studied.
In the present article, in addition to study the evolution of the water content in a strongly hygroscopic material and proposing data to validate transfer models, we propose a detailed analysis of latent effects in a wood fiber insulation material subjected to non-isothermal conditions under a vapor concentration gradient through experiments and numerical modeling. For the experiment, we opted for a test under laboratory conditions on a wall at intermediate scale between the material-scale and full-scale experiments. The objective is to integrate heterogeneities exceeding the size of samples for the experiments at the material-scale, limiting edge effects and overcoming difficulties of implementation and interpretation linked to full-scale experiments under real conditions. Numerically, we opted for a fine-scale model with heat and moisture (HM) coupling and a purely diffusive thermal transfer model in order to compare them with the experimental observations and to calculate the latent effects and their importance. This work was performed in the framework of the ANR HYGRO-BAT project [17] which aims to propose a methodology to improve hygrothermal design for buildings and was completed in the framework of the COOPER-CEMIRA project intended to estimate the latent effects in very hygroscopic materials.

2. Materials and Methods

2.1. Material

The biosourced material studied in this article is a wood fiber insulation. It can be used for the thermal insulation of different parts of a building (floor/wall, internal/external insulation, etc.). It takes the form of rigid panels to facilitate its assembly on the building site. It also has good phonic insulation properties regarding impact and airborne noises. Its hygrothermal characteristics result from the synthesis of contributions from different laboratories achieved in the framework of the HYGRO-BAT project [17,18]. Several experimental approaches were compared and concluded on reliable values for properties for which the variances observed were quite admissible in view of the uncertainties found for the measures performed. For example, the water vapor adsorption isotherm presented in Figure 1 and Table 1 is the synthesis of results obtained from three different methods: gravimetric (standard EN ISO 12571 [19]), volumetric, and dynamic. Table 2 summarizes the main hygrothermal properties of the material studied.
This material has a high moisture storage capacity with thermal conductivity strongly dependent on water content and temperature. This can lead to variations of 12% in the hygroscopic domain, contrary to only slightly hygroscopic materials such as concrete [20]. In addition, this material has a mean vapor resistance coefficient of 2.73 which indicates that water vapor crosses this material easily.
These hygrothermal properties are the inputs of our heat and moisture transfer model for which any attempt at identification is ruled out when comparing the experimental measures.

2.2. Experimental Setup

The experimental setup proposed permits studying the behavior of a multilayer wall of 1   m 2 under different hygrothermal loadings [21,22]. It is designed to provide experimental observations in order to:
  • Better understand the hygrothermal phenomena involved during the transfer.
  • Obtain sufficient data to validate or build predictive Heat, Air and Moisture transfer models.
  • Characterize transport properties at the wall scale.
To achieve this, the wall studied was placed between two compartments with a volume of 0.5 × 1 × 1   m 3 whose role was to maintain the desired thermal and moisture loadings (see Figure 2). The humidity of compartment 1 was regulated using a Saturated Salt Solution (SSS), while its temperature was regulated by fluid–air exchangers linked to a circulation cryostat. Compartment 2 had two operating modes with natural and forced convection. The first mode was obtained with humidity regulation using the SSS and temperature regulation with a climatic chamber in remote mode. The second mode was obtained directly with the climatic chamber that pulsed treated air parallel to the wall studied at a controlled flowrate. Using the SSS for regulation permits measuring the vapor flowrate exchanged between the air in the compartments and the wall, by monitoring the evolution of the mass of SSS as a function of time. Fans were installed to homogenize the temperature and humidity in each compartment. Heating and cooling powers of regulation systems were sufficiently large to quickly reach the desired temperature. The vapour stream obtained by the SSS were limited. The mass of the used SSS (both compartments were equipped with an adapted balance) for relative humidity control was about 2.5 kg and its exchange surface area was about 0.46 × 0.3 m².
The compartments were composed of two elements, an internal box and an external box that served as a thermal guard. They were made of stainless steel with airtight welds controlled by penetrant testing. Since the two compartments were regulated differently, their designs and compositions were different. Compartment 1 simulating the internal atmosphere was composed from the exterior to the interior of the outer box, of a rigid layer of insulation 60-mm thick; two countercurrent heat exchangers (for more homogenous temperature in the thermal guard) linked to a cryostat and an internal box with a volume of 0.5   m 3 providing an exchange surface of 1   m 2 with the wall studied. Compartment 2 simulating the exterior atmosphere was composed, from the exterior to the interior, of a thin multilayer thermo-reflective insulation; a rigid insulation 80 mm thick; an external box linked to a climatic chamber by insulated ventilation ducts and the internal box.
Temperature, relative humidity and differential pressure sensors were installed in the two compartments to continuously measure the loading applied to the wall studied. Thermo-hygrometers were also installed on the surface and at the core of the wall, at different positions, to obtain the response of the wall to the loading. The data were acquired every minute. Technical details for the whole data acquisition system installed, calibration of the sensors, installation, and qualification of the experimental set-up (airtightness, regulation, test protocol) are presented in [21,22]. Table 3 gives a summary of the hygrothermal operating domain of the experimental setup and the uncertainties on both temperature and relative humidity as a function of the type of sensor.

2.3. Numerical Model

The heat and moisture model developed was based on two conservation equations: energy and moisture (water in liquid and vapor form). The transfer potentials chosen are temperature T and vapor concentration ρ v . The model presented is based on the works of Luikov [23] and on works developed more recently available in [24,25,26,27,28,29].
The general equation describing the transfer of humidity in a porous medium is given by Equation (1), that results from the sum of conservation equations of liquid water and water vapor with diffusion and capillarity as transfer phenomena expressed by the laws of Fick and Darcy, respectively:
ρ m t = · ( J v dif + J l cap )
where ρ m is the moisture content, J v dif is water vapor diffusion flux according to Fick’s law, and J l cap is liquid flow according to Darcy’s law.
For building applications, global air movements are neglected in the case of very low air velocities and low variations of temperature and pressure found in practice [28].
The energy conservation equation (Equation (2)) was obtained from an enthalpy balance by explaining the enthalpies of different phases and elements composing the system. The hypothesis of local equilibrium was chosen with the consequence of equality of temperatures between the different phases and components:
ρ s c p * T t + [ ( c p l J l cap + c p v J v dif ) · ] T = · J q dif L v l · J v dif
where T is the temperature, ρ s is the dry density, J q dif is diffusion heat flux according to Fourier’s law, L v l is the specific latent heat for water and c p is the specific heat capacity. Exponents v ,   l , and * denote, respectively, vapor, liquid and effective state.
Considering the moisture loading in the current study, mainly adsorption not exceeding 88% relative humidity (see Table 4), capillary mouvment in the over hygroscopic range and hysterisis were not taken into account.
The coupled heat and moisture transfer model obtained takes the form of a series of partial differential equations (PDE) that govern all the transfers. These non-linear and coupled PDE are resolved simultaneously using the COMSOL Multiphysics software based on the Finite Elements methods. We chose this environment since it can be used for modeling and resolving a wide range of engineering and research problems, mainly problems in PDE form. It is particularly well-adapted to solving Multiphysics problems in which several phenomena are studied simultaneously as in the case of coupled HAM transfers. The use of such tools is justified because they are capable of solving this type of problem and allow the implementation of reliable and well-defined input data and the choice of meshing. It comprises several solvers adapted to a series of given problems.

2.4. Studied Loading

The hygrothermal stresses chosen in the framework of this study are presented in Table 4. These stresses are applied using the setup presented previously on a single-layer wood fiber insulating wall 8 cm thick. A vapor concentration gradient and a temperature gradient are applied on either side of the wall.
This choice of stresses followed an initial study on the same wall under a vapor concentration gradient [22]. The previous test consisted in placing a wood fiber wall between two atmospheres regulated at 20 °C and a relative humidity of 50% on one side and 70% on the other. This case study highlighted the effects of moisture transfers on the thermal behavior of the wall when the latent effects of heat transfer are dominant. Thus, it was possible to show an increase at the core of the wall in the region of a degree. However, this study under isothermal conditions did not lead to fully defining the behavior of the material and validating the model developed. Following the same line, the choice of stresses in this study provides better understanding of the hygrothermal transfer mechanisms involved and the graduated validation of the model developed. Indeed, the non-isothermal case represents winter type stresses, critical from the standpoint of moisture transfer in the wall. It makes it possible to take into account the impact of the water content of the wall on its thermophysical properties, and thus of the impact on sensible heat transfer. It also allowed evaluating the contribution of latent transfer in relation to sensible transfer when the latter is non-negligible.

3. Results and Discussion

The analysis of the hygrothermal behavior of the wood fiber insulation for the different stresses presented was first done on the basis of the experimental results. The analysis mainly focuses on the contribution of moisture transfer on thermal transfer in the context of a strongly hygroscopic material. We then compared these experimental results with the numerical results obtained from the model developed. This comparison allowed us to perform a critical analysis on the capacity of the model to mirror the behavior of the wall studied. To do this, the wall was subjected to moisture and thermal stress on both sides with a variance in relative humidity of 33% and in temperature of 14 °C. The system starts from an initial undisturbed hygrothermal state at 65% relative humidity and a temperature of 23 °C. The results are presented for different positions as shown in Figure 3.

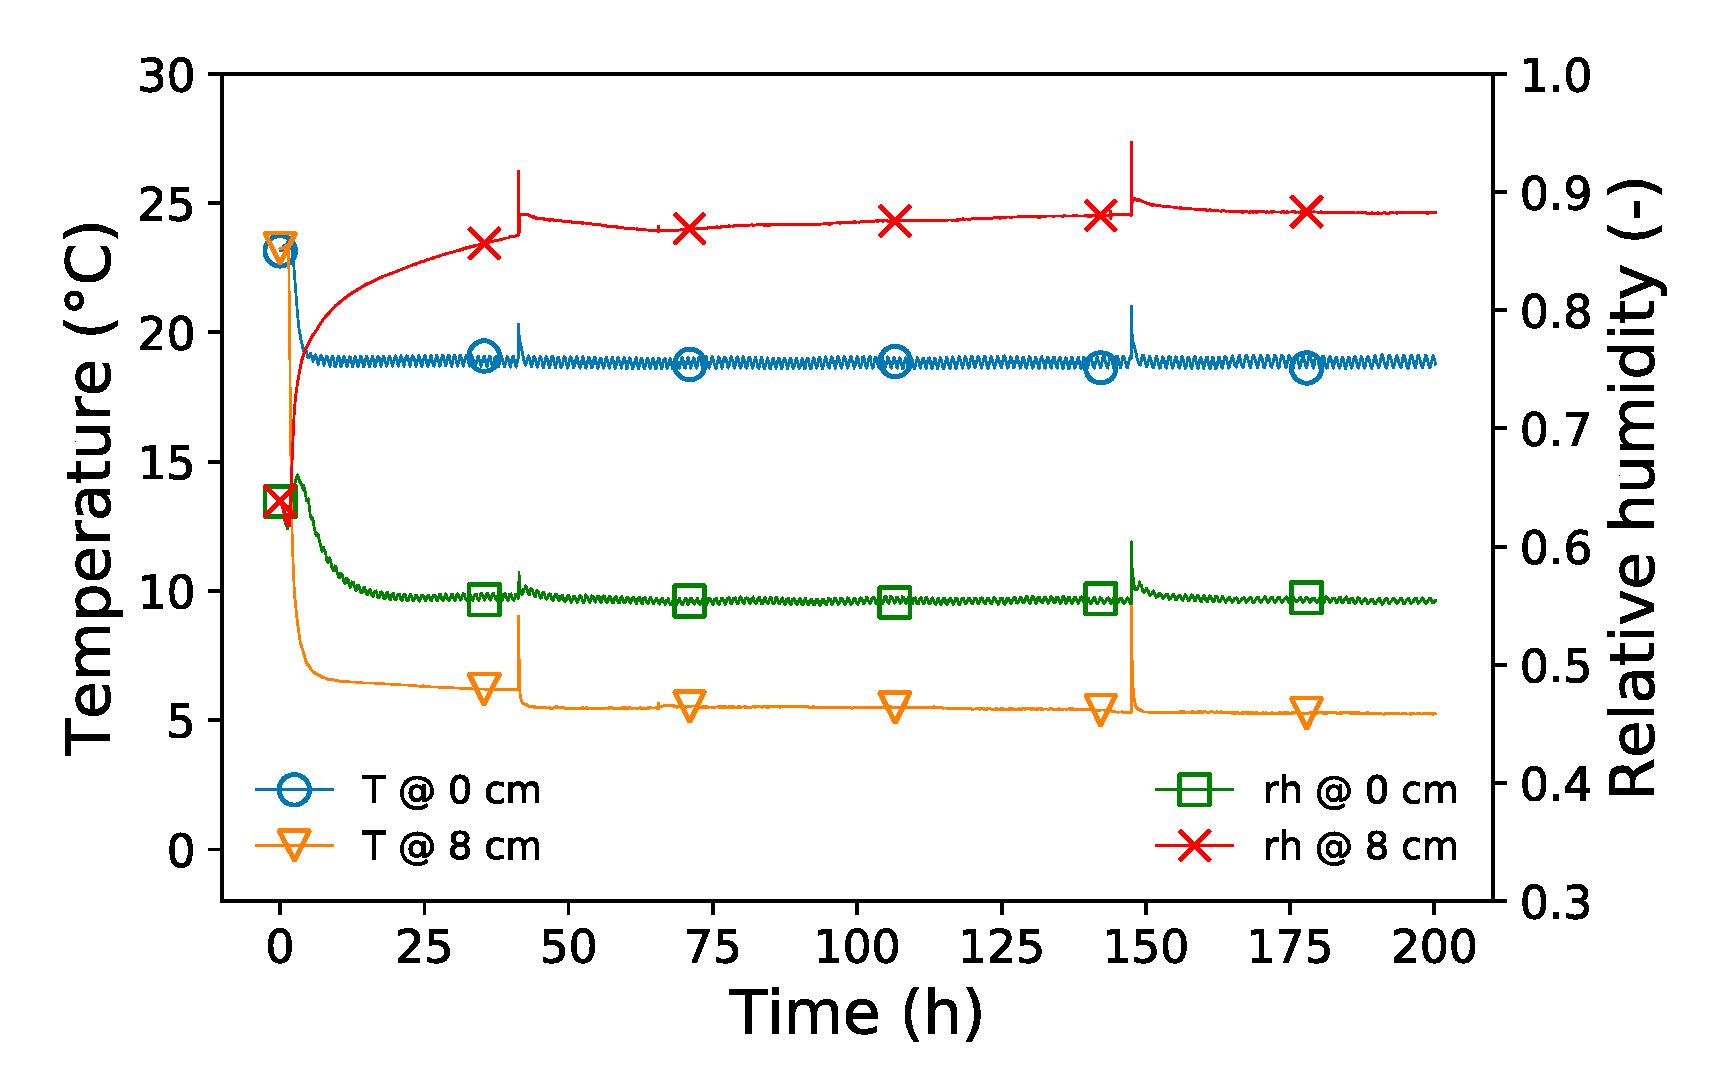
3.1. Experimental Analysis

The regulation system setup provides very stable boundary conditions with a standard deviation over the last 150 h not exceeding 0.75% in relative humidity and 0.14 °C in temperature (cf. Figure 4). The peaks noticed correspond to disturbance linked to the regeneration of the saturated salt solution.
These stresses induce a thermal and moisture response from the envelope, as shown in Figure 5. Regarding the thermal behavior, we observe the development of a thermal gradient leading to an average heat flux of 5.8   W calculated over the last 50 h of the test. This flux was obtained from measures performed with a flux meter installed on the surface of the wall.
The concentration of water vapor in the air occluding the pores (Figure 6), calculated from temperature and relative humidity measures, evolves from an undisturbed state at 13.4   g / m 3 to the development of a vapor concentration gradient in steady state. This gradient induces a flux of vapor through the inner side of the wall (55%, 19 °C) to the outer one (88%, 5 °C).
Under the assumption of local equilibrium, the analysis of the relative humidity profile and the water vapor sorption isotherm permits tracking back to the water content profile illustrated in Figure 7. It shows the redistribution of water in the wall in which water shifts from the inner side of the wall to the outer side. Air looping from hot to cold box under the presented thermal boundary conditions cannot occur due to the low hight of the wall (1 m). Given the amount of water involved and the direction of the vapor flux (from the internal side to the external side), it can be deduced that this shift is due to the migration of water in liquid and vapor form from layers located in the internal side towards those located in the external side.

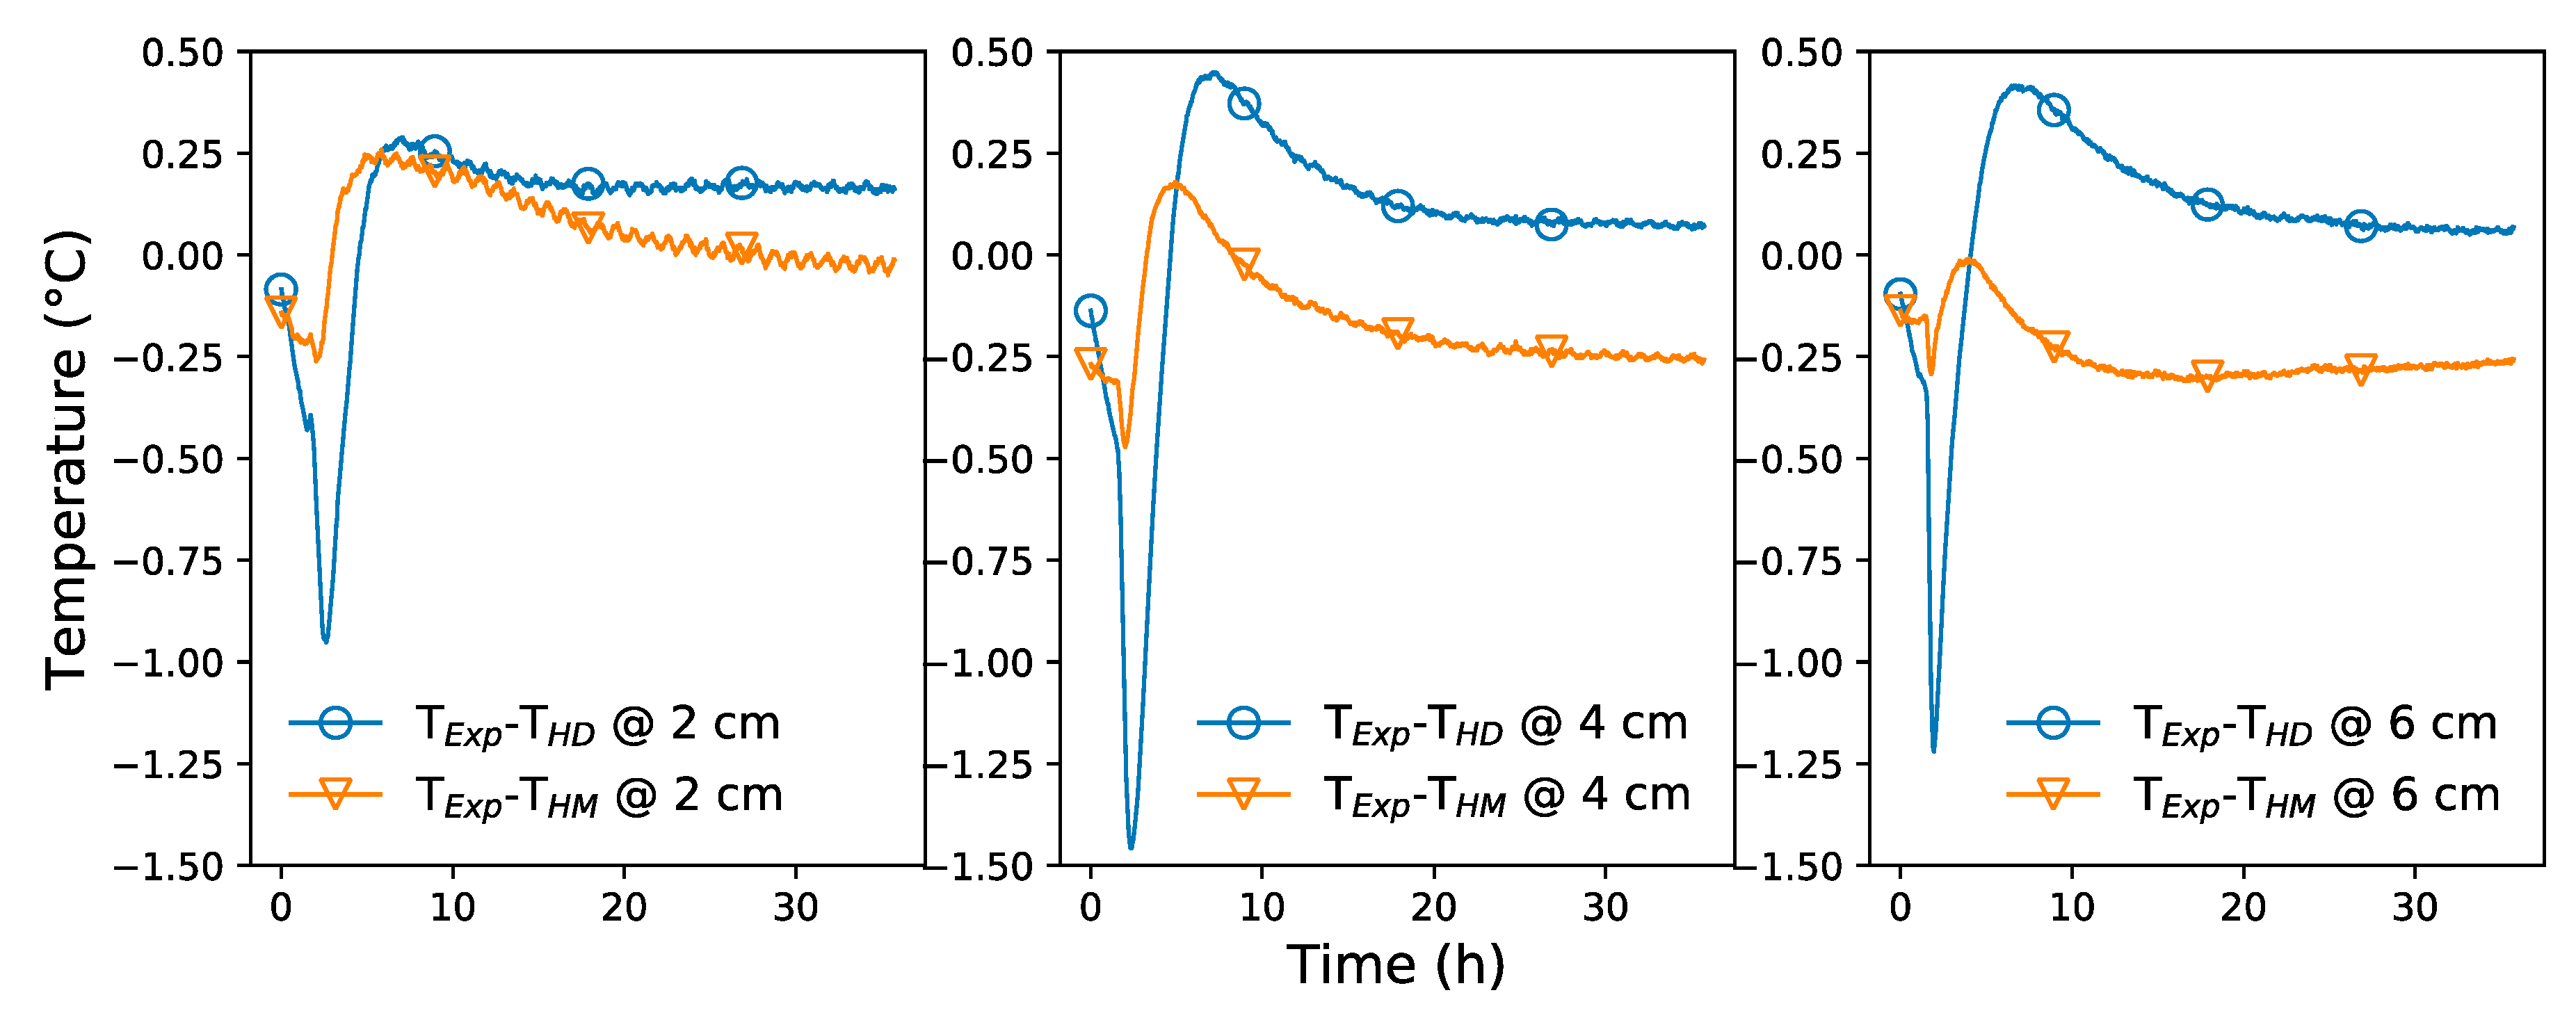
3.2. Comparison of Experimental Results with Numerical Codes

We proceed in this part with the comparison of the results obtained using the experimental test bench under non-isothermal conditions and the results obtained from the numerical simulation of the model developed. The boundary conditions chosen for the simulation were of Dirichlet type and were measured on the surface.
Figure 8 represents the comparison of numerical and experimental results of the evolution of temperature, relative humidity, and vapor concentration as a function of time for different positions. As we observed in the isothermal case [22], the model shows it can reproduce the experimental observation well. The largest variances were observed during the start-up phase.
The temperature absolute deviation does not exceed 0.5 °C which is quite acceptable. The deviations observed for relative humidity and for vapor concentration are more marked during the first hours and then fall until reaching a value lower than 2% after 25 h.
Regarding the heat flux (Figure 9), we observed good correlation between the numerical and experimental results with a correlation coefficient equal to 0.9. The dispersion observed is partially attributed to the tightness of the flux meter to water vapor. This can disturb hygrothermal behavior locally which is not taken into account by the numerical model. The straight line of the linear regression does not go through the origin. This would be due to a systematic measurement error on the thermal flux.
If we analyze temperature evolution in time at different positions (Figure 5), then it is difficult to assess the contribution of heat diffusion and latent effects since these two physical phenomena are concomitant. In order to quantify them and to highlight the latent effects on the total heat transfer, we compared the experimental temperature measures with values obtained by different numerical transfer models (see Figure 10). The first is a “non-linear Heat transfer model, purely Diffusive” named HD where the thermal conductivity of the wall is a function of the water content and the second is the “fully coupled Heat and Moisture transfer model” presented in this article called HM. The deviations represent the difference in temperature between the measurement and the model.
During the first hours, it can be seen that in reality, in comparison to the purely diffusive model, the wall cooled throughout its thickness, then warmed with maximum amplitudes varying from 1.5 °C in the cooling phase to 0.5 °C in the warming phase. This dynamic is attributed to release of water from the wall (evaporation) then water storage (condensation) (see Figure 11). The fall in temperature was more marked at 4 cm from the inner edge where the withdrawal is highest. These results corroborate those obtained in the case of the isotherm where an increase of temperature in the region of degrees was observed, attributed to the adsorption of water vapor [22]. We also observed that, contrary to the purely diffusive model, the hygrothermal one succeeded in capturing the transfer dynamics.

4. Conclusions

Heat and mass transfers in highly hygroscopic materials are coupled with an impact on global heat fluxes. This study performed showed these couplings experimentally and numerically for an insulating wood fiber material under non-isotherm conditions. We were able to highlight the following points:
  • The redistribution of water which took place as the heat gradient developed. The water migrated from the warmest side to the coolest side.
  • The model developed proved efficient at reproducing hygrothermal behavior under non-isothermal stresses.
  • The variances between the measures—model were greater during the start-up phase.
  • The latent effects could be detected and highlighted experimentally and numerically by comparison with the purely diffusive heat model.
The next step to obtaining better understanding of the behavior of wood fiber insulating material will consider the response of walls subject to dynamic stresses that include the effects of thermal and moisture inertia, in order to determine whether the variances between the measures and the model observed in the non-isotherm case propagate and increase.

Author Contributions

Conceptualization, methodology and validation, Z.S., A.T. and J.V.; software, Z.S. and A.T.; formal analysis and investigation, Z.S., A.T., J.V. and R.Z.F.; writing—original draft preparation, Z.S., A.T. and J.V.; writing—review and editing, Z.S., A.T., J.V. and R.Z.F.; supervision and project administration, A.T. and J.V.

Funding

This research was funded by the Agence Nationale de Recherche (ANR), project HYGRO-BAT, ANR-10-HABISOL-005-01 and the Région Auvergne-Rhône-Alpes.

Conflicts of Interest

The authors declare no conflict of interest. The funders had no role in the design of the study; in the collection, analyses, or interpretation of data; in the writing of the manuscript, or in the decision to publish the results.

References

  1. ADEME. Les Chiffres clés du Bâtiment Énergie—Environnement; ADEME: France, 2013. [Google Scholar]
  2. Décret n° 2010-1269 du 26 Octobre 2010 Relatif aux Caractéristiques Thermiques et à la Performance Énergétique des Constructions. France. 2010.
  3. Kuenzel, H.M.; Holm, A.; Sedlbauer, K.; Antretter, F.; Ellinger, M. Moisture Buffering Effect of Interior Linings Made from Wood or Wood Based Products; IBP Report HTB-04/2004/e; Fraunhofer Institute of Building Physics: Holzkirchen, Germany, 2004. [Google Scholar]
  4. Rode, C.; Mendes, N.; Grau, K. Evaluation of Moisture Buffer Effects by Performing Whole-Building Simulations; ASHRAE Transactions: Nashville, TN, USA, 2004; pp. 783–794. [Google Scholar]
  5. Hameury, S. Moisture buffering capacity of heavy timber structures directly exposed to an indoor climate: A numerical study. Build. Environ. 2005, 40, 1400–1412. [Google Scholar] [CrossRef]
  6. Roels, S.; Depraetere, W.; Carmeliet, J.; Hens, H. Simulating non-isothermal water vapour transfer: An experimental validation on multi-layered building components. J. Build. Phys 1999, 23, 17–40. [Google Scholar]
  7. Philip, J.R.; De Vries, D.A. Moisture movement in porous material under temperature gradients. Trans. Am. Geophys. Union 1957, 38, 222–232. [Google Scholar] [CrossRef]
  8. Talukdar, P.; Olutmayin, S.O.; Osanyintola, O.F.; Simonson, C.J. An experimental data set for benchmarking 1-D, transient heat and moisture transfer models of hygroscopic building materials. Part I: Experimental facility and material property data. Int. J. Heat Mass Transf. 2007, 50, 4527–4539. [Google Scholar] [CrossRef]
  9. Talukdar, P.; Olutmayin, S.O.; Osanyintola, O.F.; Simonson, C.J. An experimental data set for benchmarking 1-D, transient heat and moisture transfer models of hygroscopic building materials. Part II: Experimental, numerical and analytical data. Int. J. Heat Mass Transf. 2007, 50, 4915–4926. [Google Scholar] [CrossRef]
  10. Teasdale-St-Hilaire, A.; Derome, D. Comparison of experimental and numerical results of wood-frame wall assemblies wetted by simulated wind-driven rain infiltration. Energy Build. 2007, 39, 1131–1139. [Google Scholar] [CrossRef]
  11. Li, Q.; Rao, J.; Fazio, P. Development of HAM tool for building envelope analysis. Build. Environ. 2009, 44, 1065–1073. [Google Scholar] [CrossRef]
  12. Piot, A.; Woloszyn, M.; Brau, J.; Abele, C. Experimental wooden frame house for the validation of whole building heat and moisture transfer numerical models. Energy Build. 2011, 43, 1322–1328. [Google Scholar] [CrossRef]
  13. Desta, T.Z.; Langmans, J.; Roels, S. Experimental data set for validation of heat, air and moisture transport models of building envelopes. Build. Environ. 2011, 46, 1038–1046. [Google Scholar] [CrossRef]
  14. Langmans, J.; Klein, R.; Roels, S. Numerical and experimental investigation of the hygrothermal response of timber frame walls with an exterior air barrier. J. Build. Phys. 2013, 36, 375–397. [Google Scholar] [CrossRef]
  15. Rafidiarison, H.; Remond, R.; Mougel, E. Dataset for validating 1-D heat and mass transfer models within building walls with hygroscopic materials. Build. Environ. 2015, 89, 356–368. [Google Scholar] [CrossRef]
  16. Latif, E.; Ciupala, M.A.; Tucker, S.; Wijeyesekera, D.C.; Newport, D.J. Hygrothermal performance of wood-hemp insulation in timber frame wall panels with and without a vapour barrier. Build. Environ. 2015, 92, 122–134. [Google Scholar] [CrossRef] [Green Version]
  17. Woloszyn, M.; Le Pierrès, N.; Kedowidé, Y.; Virgone, J.; Trabelsi, A.; Slimani, Z.; Pierre, F. Vers une méthode de conception HYGRO-thermique des BATiments performants: Démarche du projet HYGRO-BAT. In Les Modèles Face aux Résultats Expérimentaux; IBPSA France: Arras, France, 2014; p. 8. [Google Scholar]
  18. HYGRO-BAT. Livrable de la Tâche 1: Caractérisation de la Métrologie et des Matériaux; ANR-10-HABISOL-005-01; ANR: France, 2015. [Google Scholar]
  19. ISO 12571. Hygrothermal Performance of Building Materials and Products—Determination of Hygroscopic Sorption Properties; International Organization for Standardization: Geneva, Switzerland, 2013. [Google Scholar]
  20. Traoré, I. Transferts de Chaleur et de Masse Dans les Parois des Bâtiments à Ossature Bois. Ph.D. Thesis, Henri Poincaré University, Nancy, France, 2011. [Google Scholar]
  21. Slimani, Z. Analyse Expérimentale et Numérique du Comportement Hygrothermique de Parois Fortement Hygroscopiques. Ph.D. Thesis, Université Claude Bernard Lyon, Villeurbanne, France, 2015. [Google Scholar]
  22. Zakaria, S.; Abdelkrim, T.; Joseph, V. Study of hygrothermal behavior of very hygroscopic insulation. In Materials, Systems and Structures in Civil. Engineering Conference segment on Moisture in Materials and Structures; Technical University of Denmark: Lyngby, Denmark, 2016. [Google Scholar]
  23. Luikov, A.V. Heat and Mass Transfer in Capillary-Porous Bodies, 1st ed.; Oxford Pergamon Press: Oxford, UK, 1966. [Google Scholar]
  24. Quenard, D. Adsorption et Transfert D’humidité Dans les Matériaux Hygroscopiques, Approche du Type Percolation et Expérimentation. Ph.D. Thesis, Institut National Polytechnique de Toulouse, Toulose, France, 1989. [Google Scholar]
  25. Hagentoft, C.E.; Kalagasidis, A.S.; Adl-Zarrabi, B.; Roels, S.; Carmeliet, J.; Hens, H.; Adan, O. Assessment method of numerical prediction models for combined heat, air and moisture transfer in building Components: Benchmarks for one-dimensional cases. J. Therm. Envel. Build. Sci. 2004, 27, 327–352. [Google Scholar] [CrossRef]
  26. Qin, M.; Belarbi, R.; Aït-Mokhtar, A.; Nilsson, L.O. Coupled heat and moisture transport in multi-layer walls: Numerical simulation and experimental study. Constr. Build. Mater. 2006, 23, 967–975. [Google Scholar] [CrossRef]
  27. Trabelsi, A. Études Numérique et Expérimentale des Transferts Hygrothermiques Dans les Matériaux Poreux de Construction. Ph.D. Thesis, University of La Rochelle, La Rochelle, France, 2010. [Google Scholar]
  28. Tariku, F.; Kumaran, K.; Fazio, P. Transient model for coupled heat, air and moisture transfer through multilayered porous media. Int. J. Heat Mass Trans. 2010, 53, 3035–3044. [Google Scholar] [CrossRef] [Green Version]
  29. Trabelsi, A.; Slimani, Z.; Virgone, J. Response surface analysis of the dimensionless heat and mass transfer parameters of medium density fiberboard. Int. J. Heat Mass Trans. 2018, 127, 623–630. [Google Scholar] [CrossRef]
Figure 1. Mean adsorption isotherm for wood fiber insulation.
Applsci 09 02359 g001
Figure 2. Experimental test bench: (a) image; (b) sketch.
Applsci 09 02359 g002
Figure 3. Positioning of sensors within the wall.
Applsci 09 02359 g003
Figure 4. Evolution of temperature and relative humidity at the edges of the wall.
Applsci 09 02359 g004
Figure 5. Evolution of temperature and relative humidity at different depths of the wall.
Applsci 09 02359 g005
Figure 6. Evolution of the water vapor concentration at different depths of the wall.
Applsci 09 02359 g006
Figure 7. Profile of water content in the wall after 1 h, 1 day, and 1 week.
Applsci 09 02359 g007
Figure 8. Comparison of measures: the model for temperature, relative humidity, and water vapor concentration at different positions in the wall.
Applsci 09 02359 g008
Figure 9. Comparison of heat flux from the fully coupled Heat and Moisture transfer model (HM) with the experimental heat flux.
Applsci 09 02359 g009
Figure 10. Comparison of measures: models for different positions.
Applsci 09 02359 g010
Figure 11. Evolution of water content calculated from the experimental data and the water vapor adsorption isotherm of the wood fiber insulating material.
Applsci 09 02359 g011
Table 1. Mass water content as a function of relative humidity expressing sorption–desorption curves of wood fiber insulation at 20 °C.
RH (%)01522.5304345606675909397
USorption0.003.104.104.886.066.258.089.1411.2716.7018.1420.26
UDesorption0.003.604.745.616.816.998.739.7411.7917.1518.5820.70
UMean0.003.354.425.256.436.628.409.4411.5316.9218.3620.48
SD-0.860.860.870.890.890.930.940.960.970.980.98
RH: relative humidity (%) and U : mass water content (%). SD: Standard Deviation.
Table 2. Hygrothermal properties of the wood fiber insulation.
Hygrothermal Property (unit)Value
Apparent density (kg/m3)146
Porosity (%)90–99
Water vapor resistance coefficients (-)2.73
Thermal conductivity (W/(m·K)) ( 38 + 0.28 · U + 0.108 · T ) · 10 3
Specific heat (J/(kg·K)) 1103.1 + 11.271 · T
U : mass water content (%) and T   : Temperature (°C).
Table 3. Domain and measurement uncertainties.
MeasurementDomainUncertainty
Temperature (SHT75)5–45 °C0.17 °C
Relative humidity (SHT75)40–90%2%
Temperature (Pt100)5–45 °C0.15 °C
Temperature (thermocouples)5–45 °C0.16 °C
Table 4. Experimental configurations studied.
State VariableInterior AirExterior Air
T (°C)195
RH (%)5588

