Article

Can Large Educational Institutes Become Free from Grid Systems? Determination of Hybrid Renewable Energy Systems in Thailand

1
Department of Interaction Science, Sungkyunkwan University, Seoul 03063, Korea
2
Department of Business Administration, Dongguk University, Gyeongju 38066, Korea
3
Computer Science and Engineering Department, Jaume-I University, 12071 Castellon, Spain
*
Authors to whom correspondence should be addressed.
Appl. Sci. 2019, 9(11), 2319; https://doi.org/10.3390/app9112319
Submission received: 6 May 2019 / Revised: 29 May 2019 / Accepted: 30 May 2019 / Published: 5 June 2019
(This article belongs to the Special Issue Standalone Renewable Energy Systems—Modeling and Controlling)

Abstract

:
In some countries, renewable energy resources have become one of the mainstreams of energy savings and sustainable development. Thailand is one of the major countries to use renewable energy generation facilities in public buildings. In particular, public educational institutes consume large amounts of electricity from the grid. To reduce the electricity dependency on the national grid connection and greenhouse gas emissions, this paper introduces potential optimized solutions of renewable energy generation systems for a public university in Thailand, Chiang Mai University. Based on the simulation results from HOMER software, the potential configuration organized by PV panels, batteries and converters is proposed. The suggested configuration achieves 100% of the renewable fraction with $0.728 of the cost of energy for per electricity. Moreover, the greenhouse gas emissions are significantly reduced. Both the implications and limitations are presented based on simulation results.

1. Introduction

Owing to the considerable social and environmental concerns, environment and energy issues are two of the main motivations of global sustainable development [1]. In particular, certain countries have struggled to achieve two goals, economic growth and energy savings [2]. Among these countries, Thailand is one of the major countries attempting to contribute energy savings [3]. In 2013, approximately 8.58% of the final electricity consumption was produced by total renewable energy resources (14,107 GWh from 164,322 GWh of the final consumption) [4]. Although this share is not insignificant compared to other countries, the electricity generated from renewable energy resources, which are one of the most appropriate to use renewable energy facilities, could be larger than the current amount of renewable energy facilities [5]. Moreover, the majority of renewable energy facilities currently used in Thailand are hydro and biomass facilities (Table 1; [5]). Therefore, solar and wind energy have significant potential.
Moreover, because Thailand which is one of the nations in the United Nations Framework Convention on Climate Change (UNFCCC), agreed the Paris Agreement which presents the Intended Nationally Determined Contribution (INDC), the government of Thailand should attempt to reduce the emission of greenhouse gases (GHG) by utilizing renewable energy resources [6]. Table 2 summarizes key descriptions which are applied to Thailand.
As the initial part of Thailand national government’s contribution, the government has aimed to apply renewable energy facilities in public buildings for energy savings [8]. Among these buildings, public education institutes are required to contribute to energy saving through the installation of renewable and sustainable energy facilities [9].
Currently, Thailand has employed a long-term national energy and electricity planning policy which is called as the Power Development Plan (PDP) from 2015 to 2036 [10]. The majority of PDP considers the production and distribution of renewable energy facilities in Thailand. That is, renewable energy and its facilities are among the top priorities in the successful applications of PDP. Because dependence on fossil fuels can be environmentally and economically unsustainable with notable heavy burdens on the national economy, Thailand’s government hopes to fully revise its national energy systems with renewable energy. Based on the key concept of PDP, the Alternative Energy Development Plan 2015 was introduced and employed for the reduction of dependence on fossil fuels and the promotion of using alternative energy facilities from 7279 MW to 19,635 MW-capacity (2014–2036).
However, only few studies have investigated and explored the potentiality and possibilities of renewable energy facilities in Southeast Asia. Table 3 summaries the findings of previous studies which were conducted in Southeast Asia.
As presented in Table 3 and the findings of previous studies conducted in Southeast Asia, there are notable economic burdens in successfully diffusing renewable energy production facilities. Thus, several nations have attempted to preferentially employ the facilities with the considerations of their public institutions and organizations [17,18].
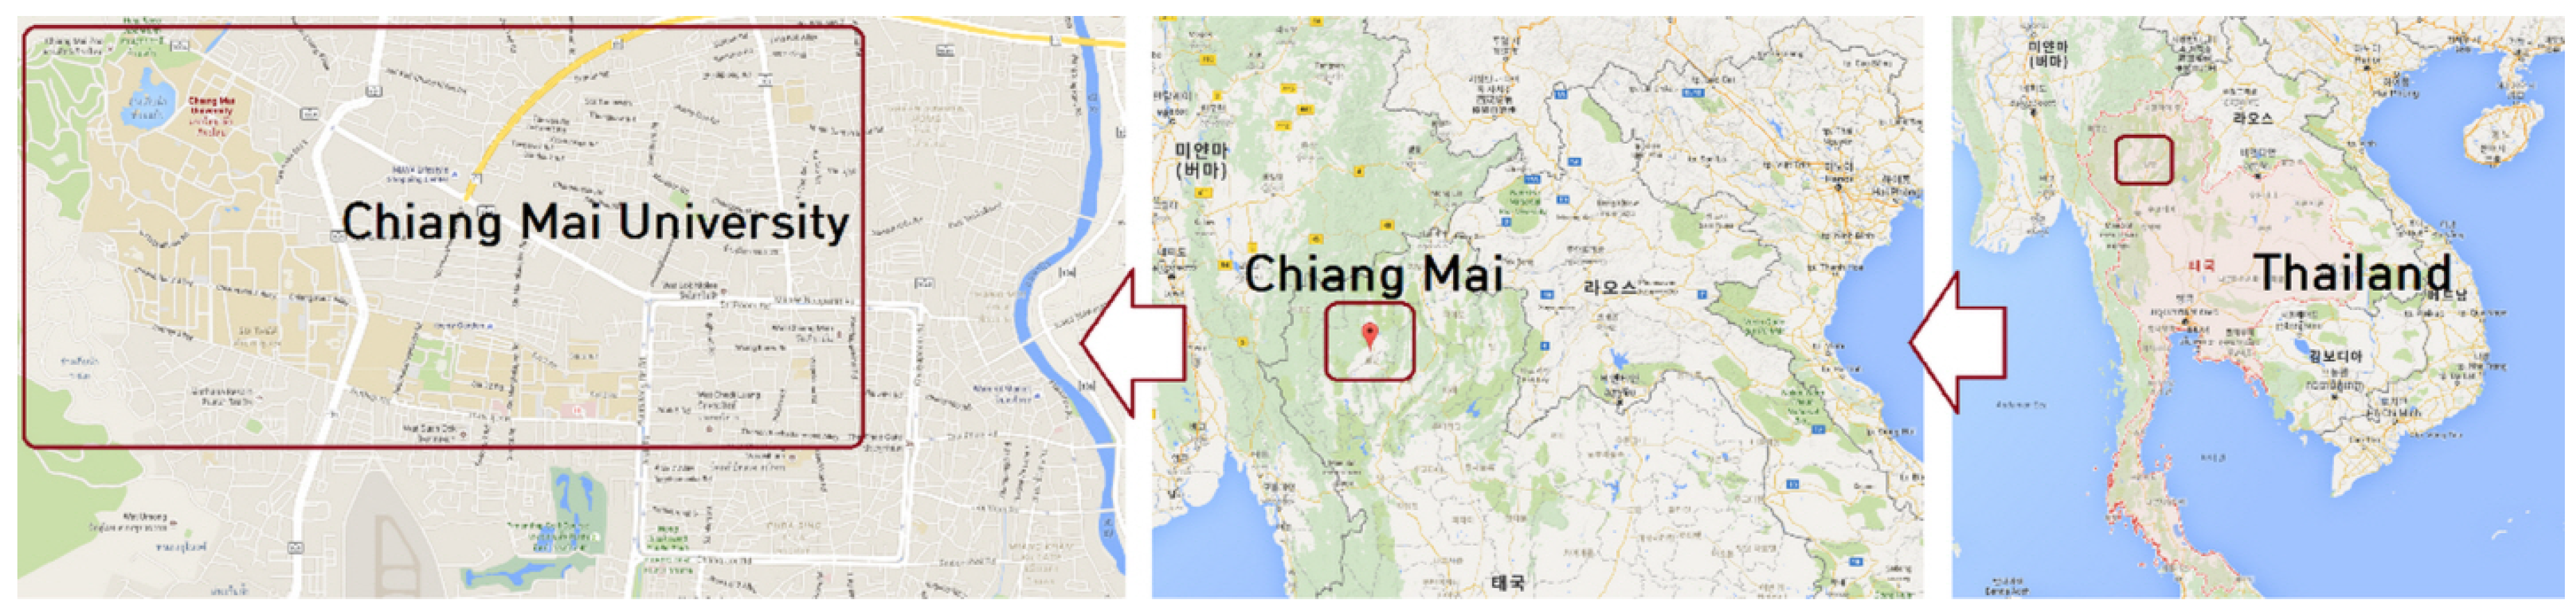
Therefore, the current study introduces the optimal configuration of renewable energy generation systems for Chiang Mai University, which is one of the largest public universities in Thailand. Using HOMER software (Hybrid Renewable and Distributed Generation System), the possible components of the configuration are introduced by reducing the environmental pollution and the dependence on the national grid system. Although there are notable limitations of HOMER software in exploring the feasibility of renewable resources including the needs of time-series datasets, notable time consumption, and certain criteria on converge, HOMER software can consider multiple combinations of different energy-related technologies, provide relatively precise results, and present optimized configurations of energy production systems [19]. That is, the current study aims to respond to the following research questions.
  • Research question 1 What is the optimal renewable electricity production system for Chiang Mai University in Thailand?
  • Research question 2 How much are the amount of greenhouse gas emissions reduced by as a result of using the optimal system for the university?

2. Chiang Mai University

2.1. Location and Facilities

Chiang Mai University is one of the largest universities in Thailand [20]. Because the university is public, “the Energy Conservation Promotion Act of Thailand for government building” should be applied [21]. This means that energy conservation and saving facilities should be constructed for the buildings. Under the act, the establishment of these facilities is fully supported by the government. In the university, there are approximately 170 buildings. Although the university is organized in four separate campuses, the main campus, Suan Sak Campus, has the main electricity demand of the university. The latitude and longitude of the university are 18.80° N and 98.95° E, respectively. This means that the main campus is located approximately 5 km-west from the center of the city. In 2015, approximately 36,000 students and 2500 staff worked in the university. Figure 1 shows the location of Chiang Mai University, Thailand [20].

2.2. Load Information

The current electricity system of Chiang Mai University is operated by the national grid system. The amount of electricity consumed in 2015 was calculated to be 17,654,195 kWh. Because this amount is too heavy to simulate, the current study used the 50% scaled electricity load information for the simulation. Based on the 50% scaled electricity load information, 1385 kW of peak electricity and 19,472 kWh/d of average daily peak electricity were examined. The load factor in 2015 was calculated to be 0.586 (Figure 2).

2.3. Wind Resources

The wind resource datasets of Chiang Mai University were obtained from the Thai Meteorological Department (2014) [22]. Because the height of wind turbines currently operated in Thailand is 25 m, the wind speed at 25 m was considered to be intermediate between that at 50 m and at the ground. Figure 3 shows the monthly average wind speed of the university. The annual average wind speed is 2.507 m/s.

2.4. Solar Resources

The datasets provided by the National Aeronautics and Space Administration (NASA) were used as the information of solar resources in the simulation [23]. Figure 4 presents the annual baseline datasets of the solar resources. Based on the datasets, 0.554 of the annual solar clearness index and 5.257 kWh/m 2 /d of the solar average daily radiation are presented. The definition of solar clearness index is defined as “the ratio of the daily horizontal radiation to the extraterrestrial value” [24].

3. Key Parameters for the Simulation

3.1. Annual Real Interest Rate

To calculate the accurate economic results from the simulation, the annual real interest rate in Thailand should be input in the HOMER simulations [25]. Based on the official introduction of the World Bank, an annual real interest rate of 5.38% was used [26].

3.2. Economic Evaluations

Before the considerations of economic evaluations, the current study only considers the configurations which can achieve 100% of renewable fraction. To evaluate the simulation results, the optimal configurations were ranked by two economic outputs, the cost of energy (COE) and the net present cost (NPC). The COE is referred to as “the average consumed cost in producing 1 kWh from the suggested system” [27]. Moreover, the NPC is “the consumed cost in establishing, operating, maintaining, and replacing the components of the suggested system in the project lifetime” [28,29]. Based on a previous simulation background, the project lifetime was assumed to be 25 years. Other specific economic methods and calculations used in the simulations were employed by the validated examinations introduced by [30].

3.3. Environmental Parameters

Based on the electricity and energy generation information of the traditional grid system, 632 g of CO 2 (carbon dioxide), 2.74 g of SO 2 (sulfur dioxide), and 1.34 g of NO and NO 2 (nitrogen oxides) are reduced when the grid system does not need to generate 1 kWh of electricity.

4. Renewable Electricity Generation Systems

To propose independent renewable electricity generation systems, PV arrays, wind turbines, batteries, and a converter were employed as the possible components for organizing the systems. Table 4 lists the cost specifications of the components used in the simulations based on the cost information of the components in prior studies [27,28,29,30]. HOMER was used to present the optimal configurations of possible renewable electricity generation systems for Chiang Mai University.

5. Results

Table 5 and 
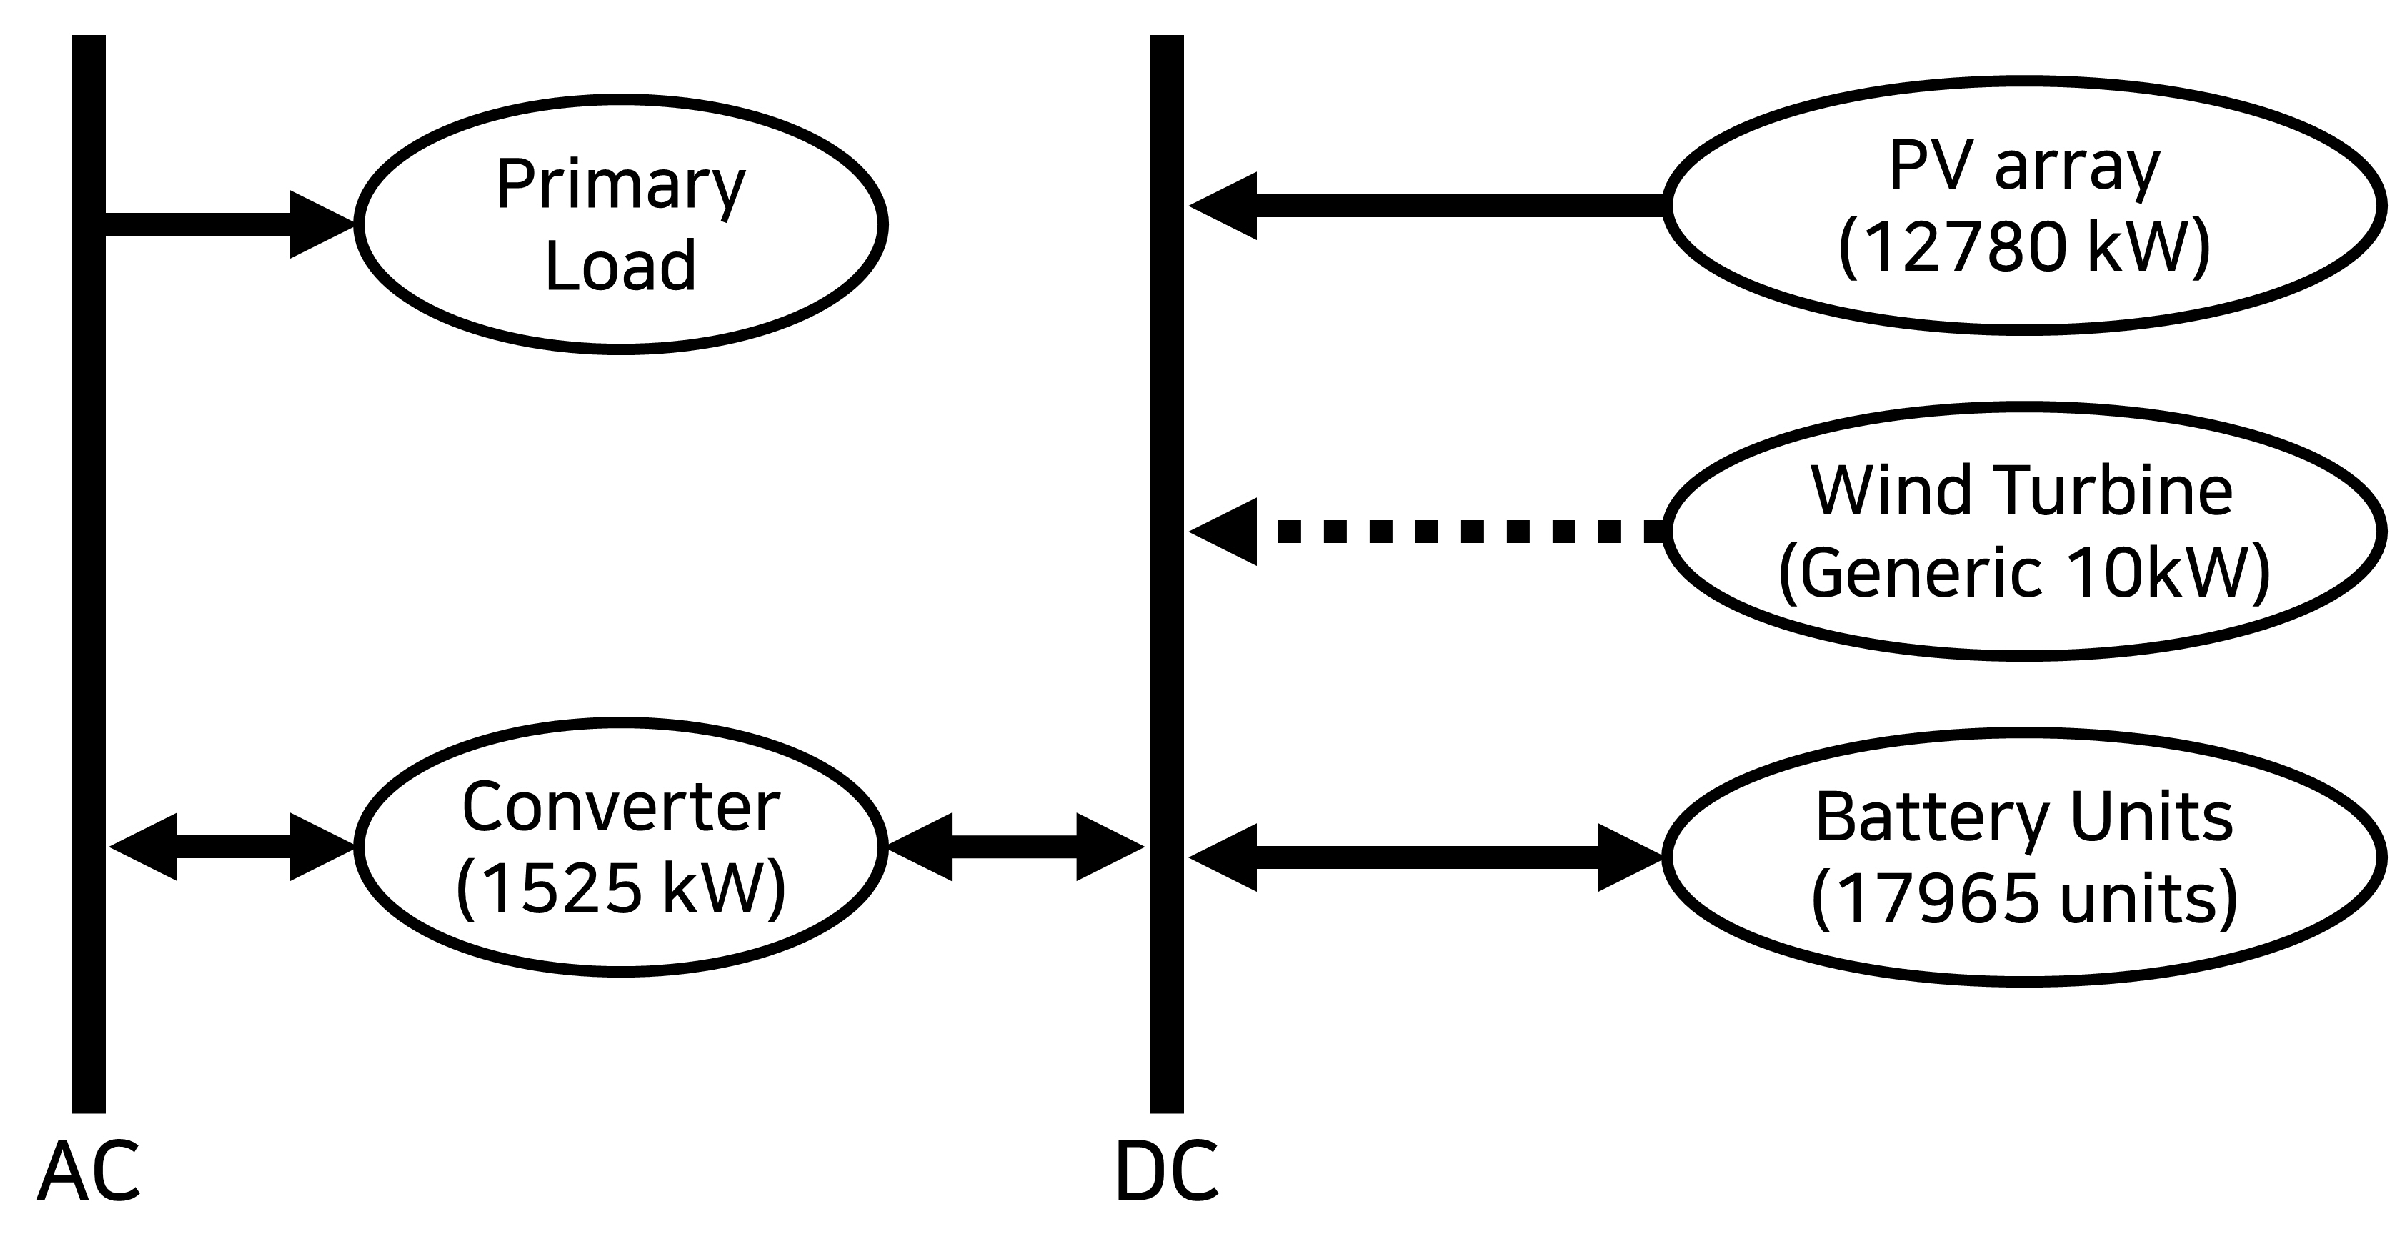
Figure 5 list the optimal configuration composed by PV arrays, wind turbines, a converter, and batteries. Table 6 shows the total and annual costs of the components in the simulation. The combination of 12,780 kW-capacity of the PV arrays, 17,965 battery units with a 1525 kW-capacity of the electric converter is suggested to respond to the electricity demand of Chiang Mai University.
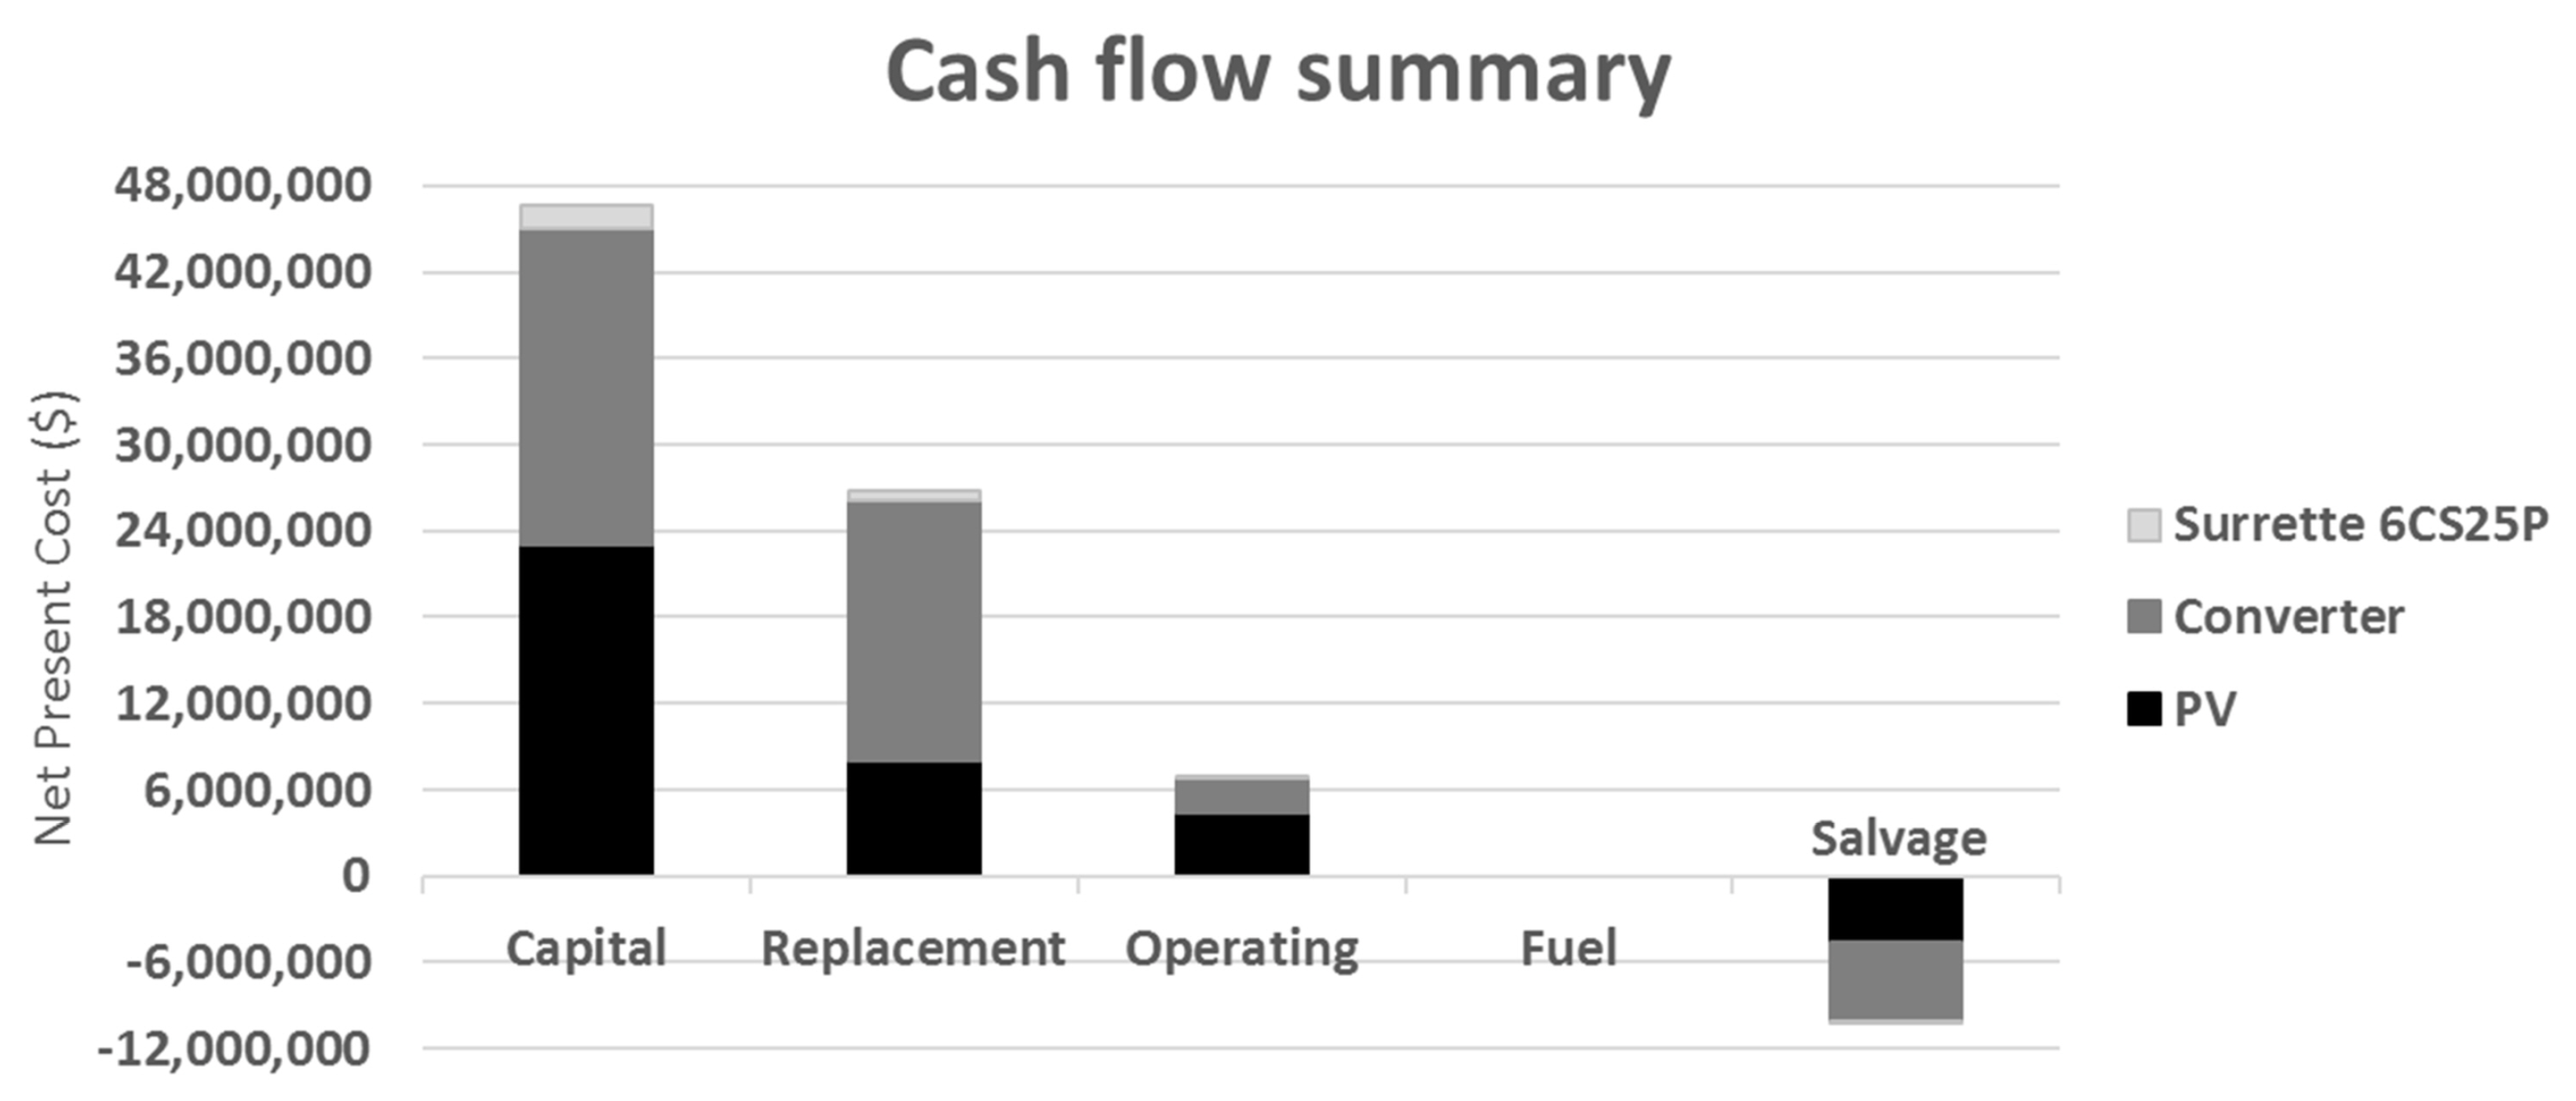
The optimal configuration shows $5,168,399 of the annual costs with $0.728 per kWh of the COE level. The cash flow is introduced in Figure 6. The annual electricity production was estimated to be 20,768,330 kWh. 
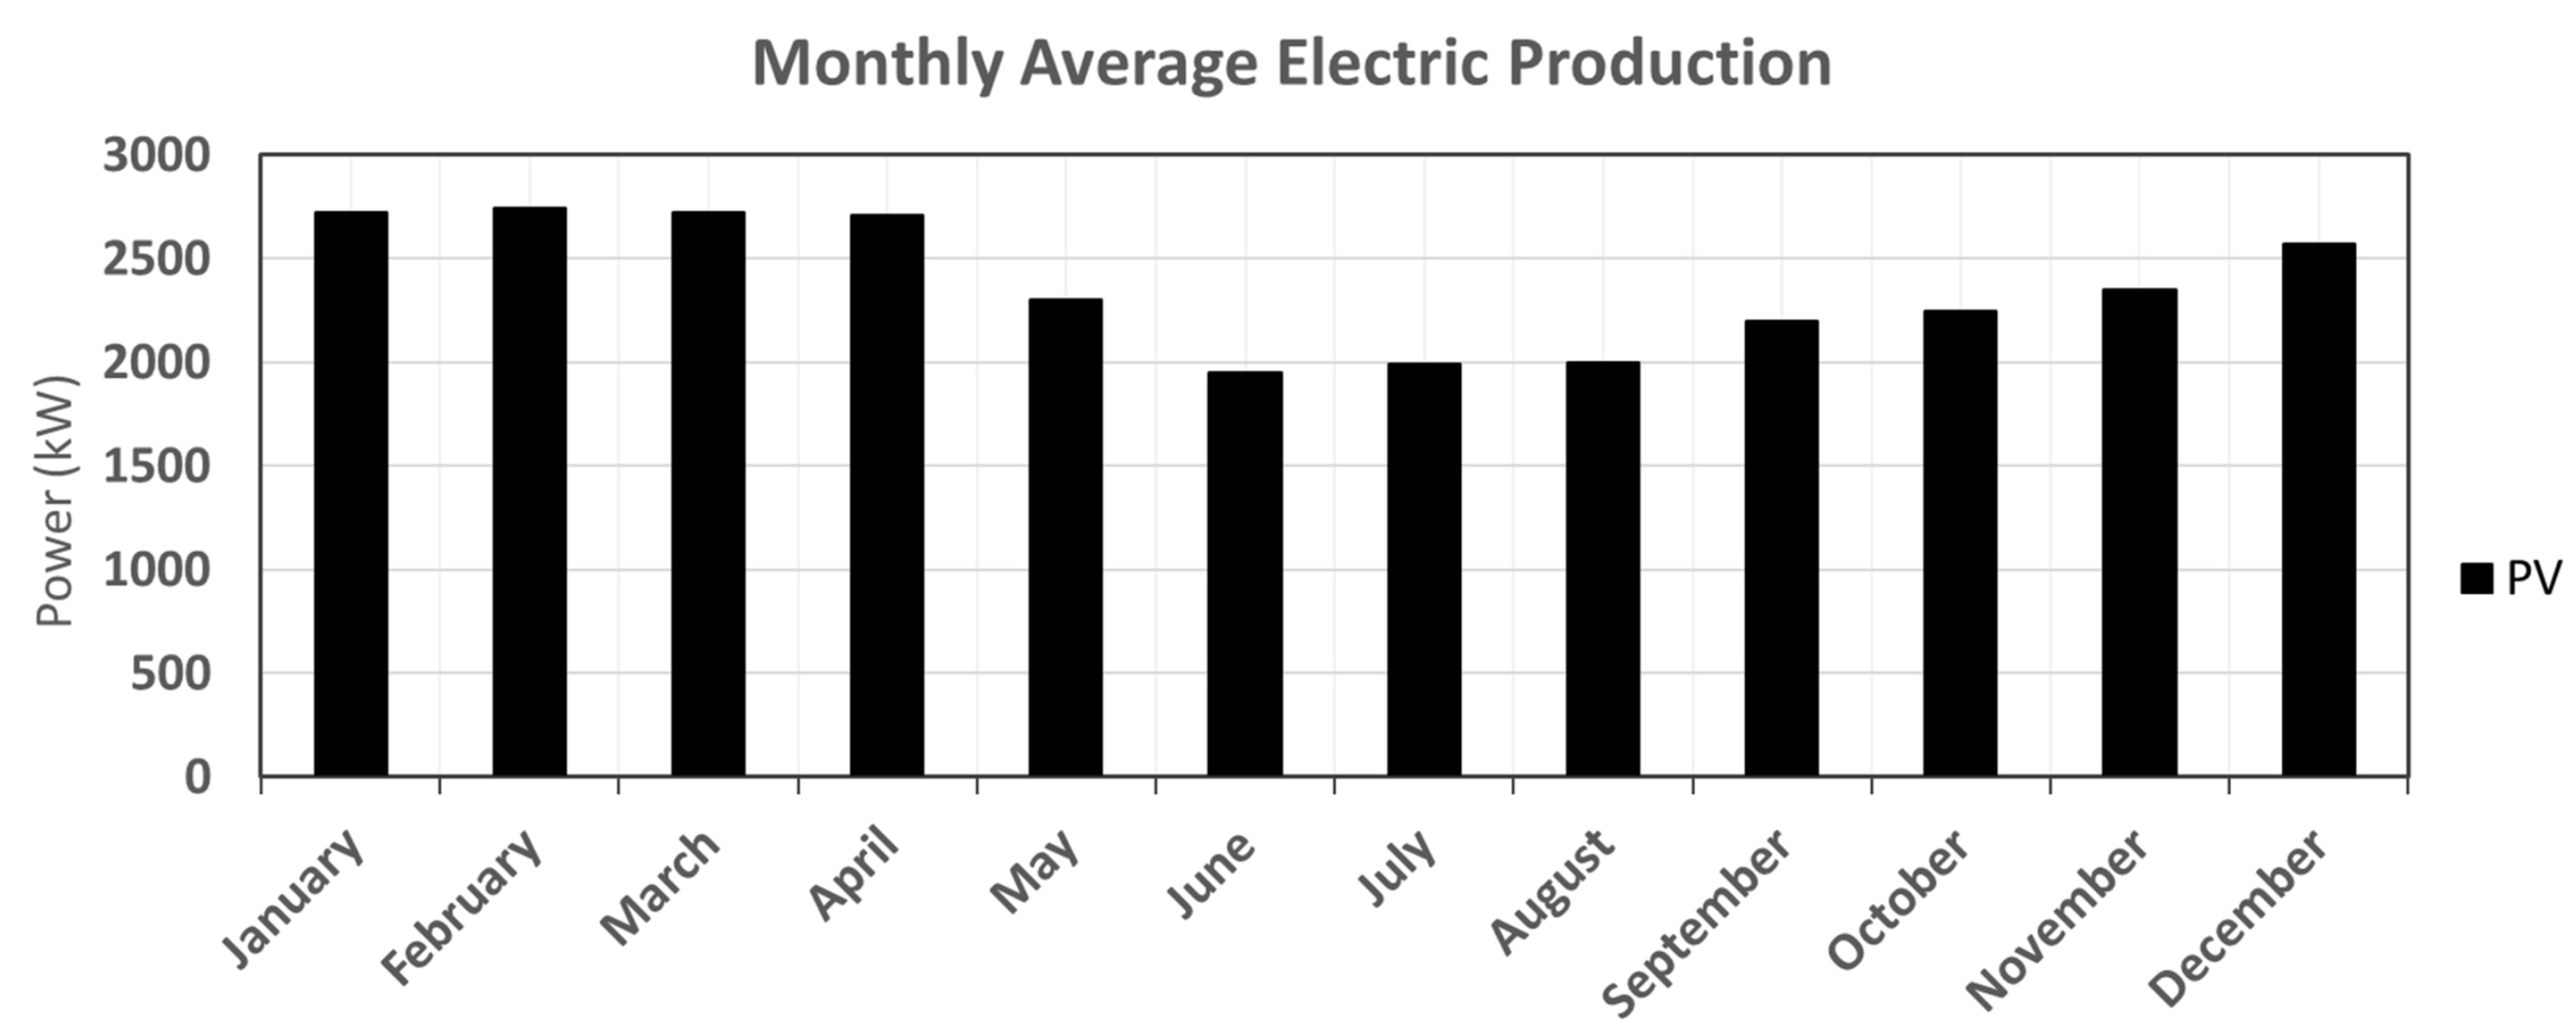
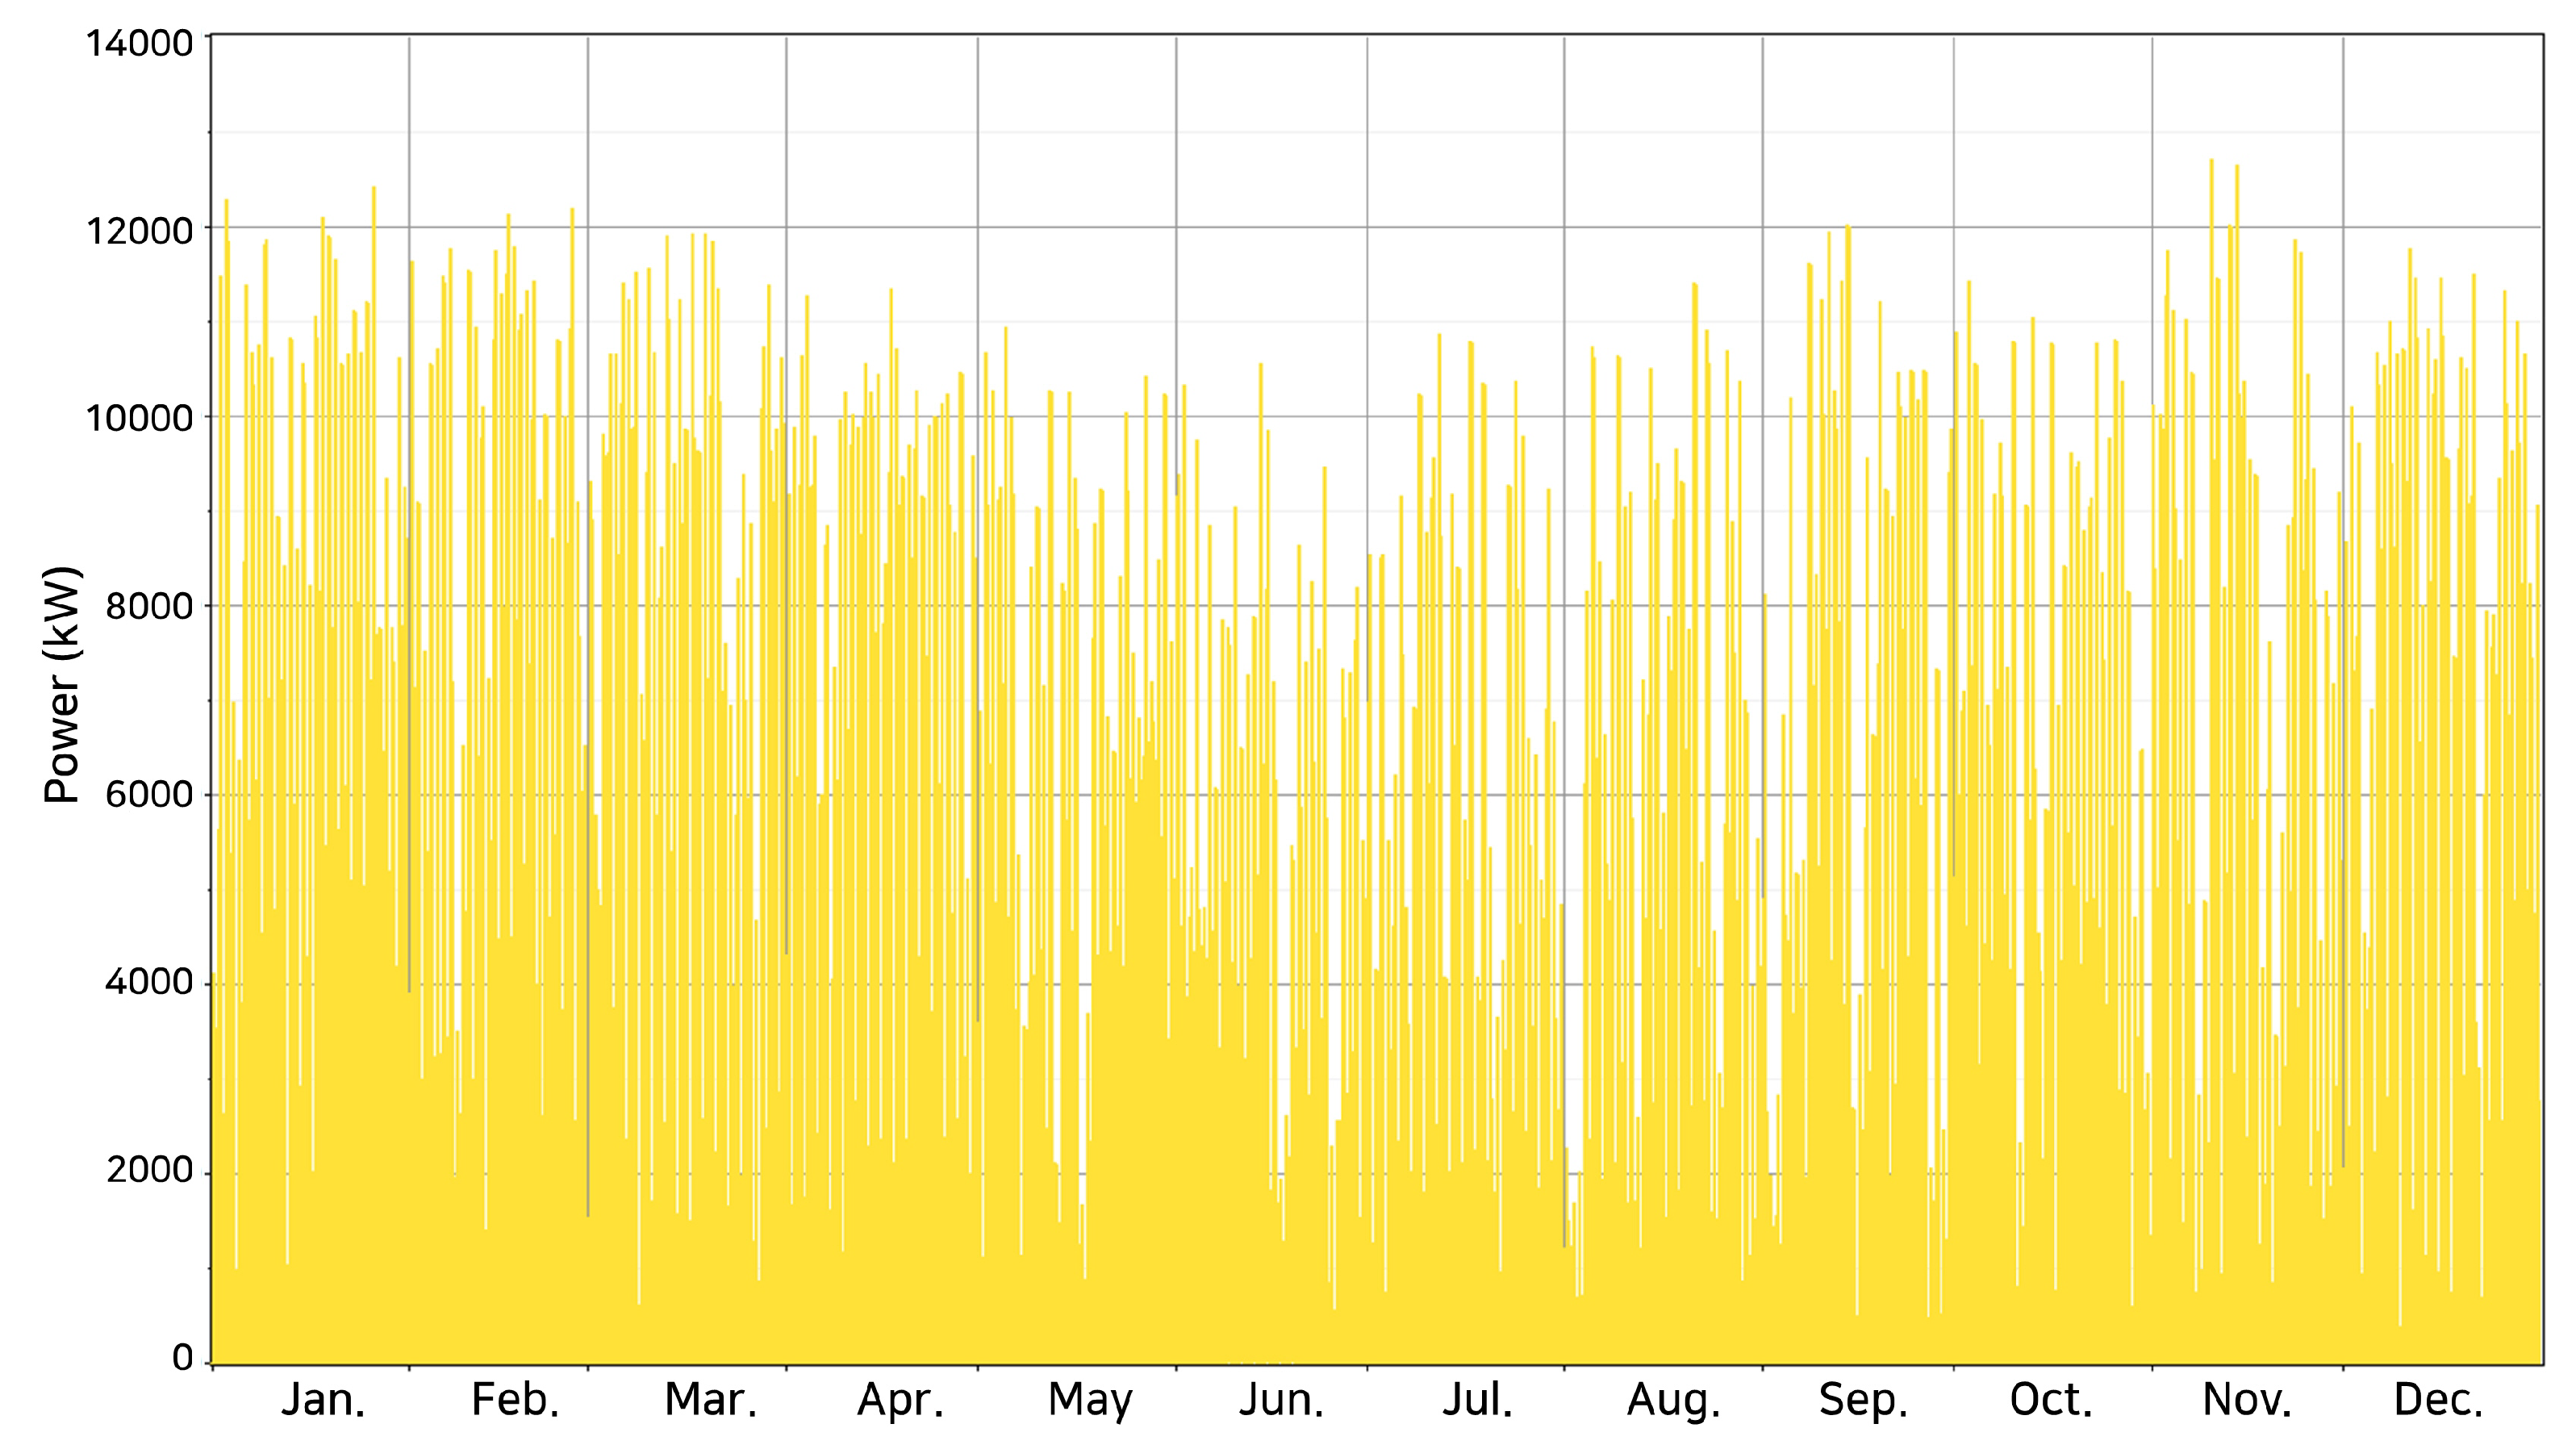
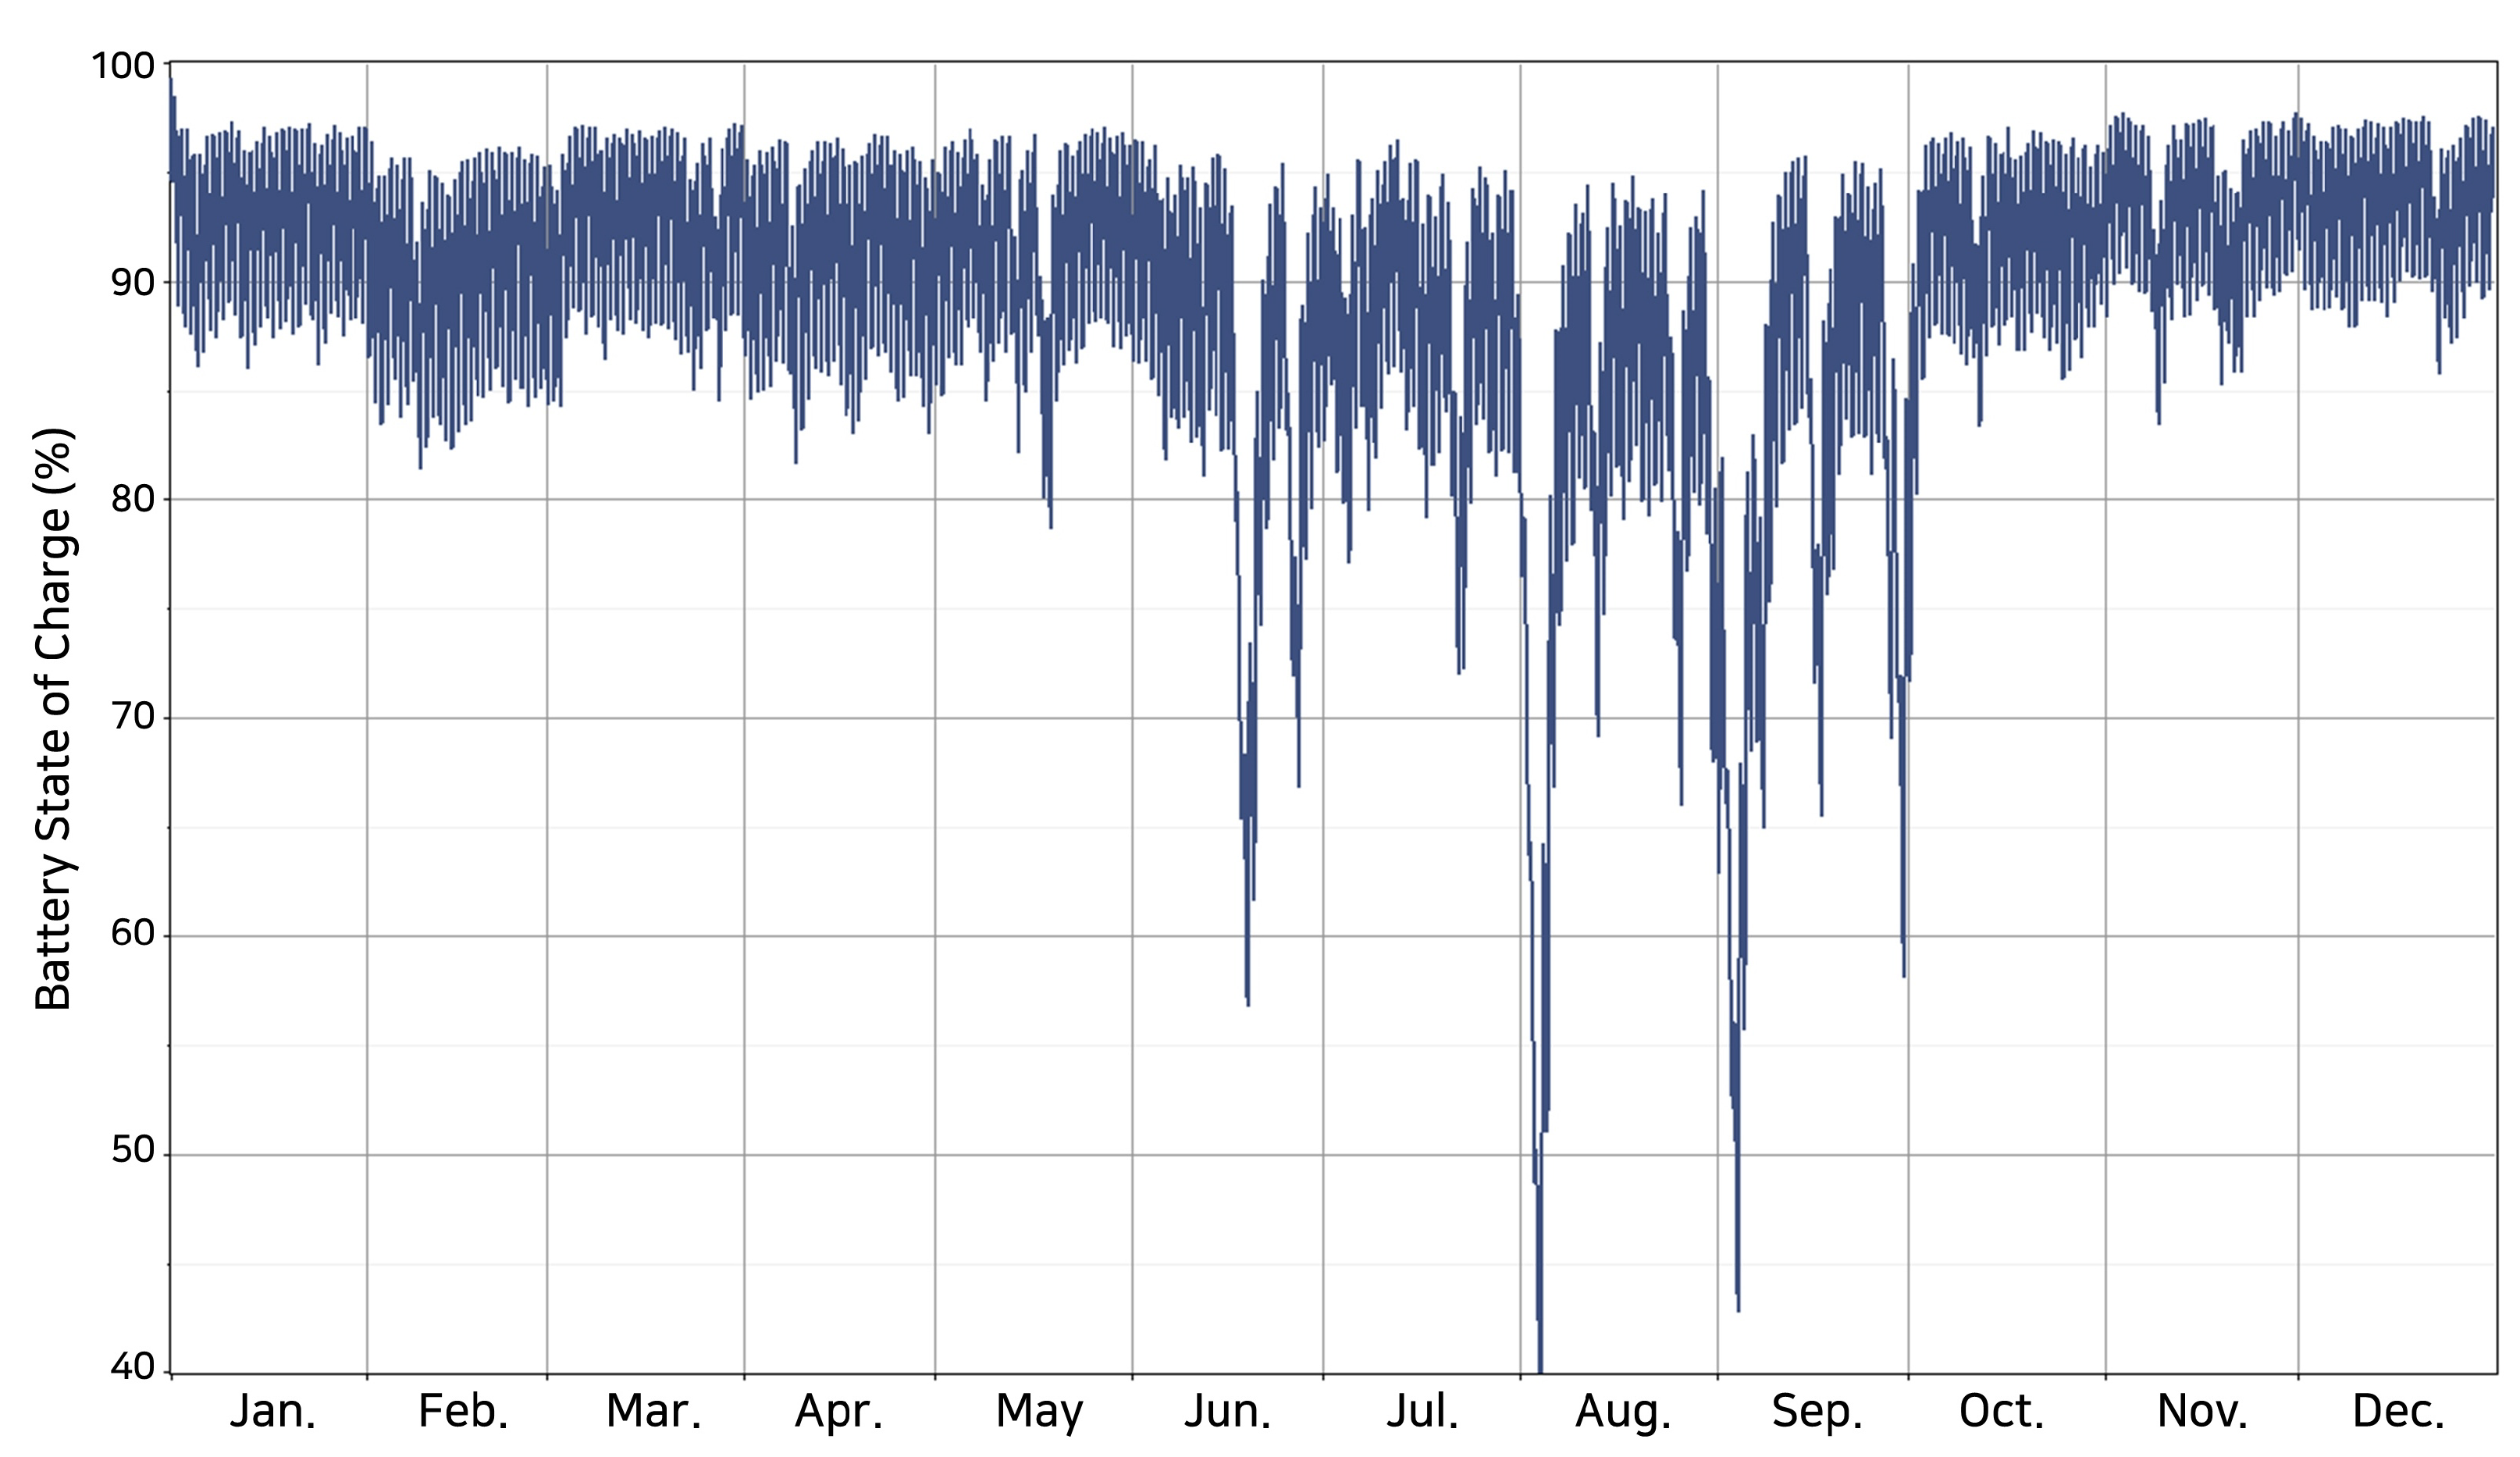
Figure 7 presents the monthly electricity production. The monthly PV power production and battery state of charge are presented in Figure 8 and Figure 9, respectively.
The key findings from the simulation results in the current study could be introduced as follows. First, the combination of PV array-batteries-converter was proposed for Chiang Mai University. Second, the suggested configuration from the simulation shows $70,147,828 of the total NPC level with $0.728 kWh of the COE level. Third, the optimal configuration meets the 100% renewable fraction, because the purpose of this study was to present independent renewable electricity generation systems for Chiang Mai University.
Moreover, there are the notable amounts of the annual reduced environmental pollutants of the proposed configurations, instead of using the current grid system. 4,487,738 kg of CO 2 , 19,456 kg of SO 2 , and 9515 kg of NO and NO 2 cannot be annually emitted by employing the proposed configuration in this study.

6. Discussion and Conclusions

To respond rapidly to the increased electricity demand in countries with sustainable development, and to reduce environmental pollution, several countries have set national plans and policies for renewable energy production facilities [34]. Following this effort, the current study proposes the potential configuration of renewable energy production facilities for Chiang Mai University in Thailand to utilize local renewable resources. Two economic evaluations, COE and NPC, were used to assess the economic feasibility of the configuration. Related to research question 1, the potentially optimal configuration was organized by 12,780 kW-capacity PV array, 17,965 battery units, and 1525 kW-capacity electronic converter.
The configuration, which was composed of a PV array, a converter and batteries with a 5.38% annual real interest rate, achieved a $0.728 per kWh COE with a 100% renewable fraction. The results of the simulation shows the possibility of an eco-friendly campus in Thailand by presenting the potential configuration of renewable energy generation systems for Chiang Mai University. Although the simulation results show heavy initial capital costs, the suggested systems can be practical in allowing the university to be a long-term eco-friendly campus. In addition, because the simulations did not consider the national grid system, which is used as the current electricity system of the university, the suggested systems can achieve greater performance by trading the electricity between the suggested systems and the grid connection. Moreover, using the suggested system shows the significantly reduced environmental pollutants. Related to research question 2, the emissions of greenhouse gas are notably reduced. Moreover, compared to the current electricity system of Chiang Mai University, 179,510 kg of CO 2 , 778 kg of SO 2 , and 381 kg of NO and NO 2 can be annually eliminated when the suggested system is installed and operated. It means that using the suggested system can provide environmental benefits for the university.
Compared to the findings of several previous studies conducted in Southeast Asia [12,14], the simulation results of the current study indicated that the suggested configuration can achieve 100% of renewable fraction with $0.728 per kWh of COE. Considering the suggested configuration of previous studies in Thailand [14], the suggested configuration in the current study excluded the usage of diesel generators. Considering about $0.858 per kWh of COE is provided by the national grid system in Thailand [35], the COE level presented by the suggested system, $0.728 per kWh of COE, is considered as the economical configuration.
This study had several limitations. First, other policies on renewable energy in Thailand were not considered. For example, the Thailand government started to apply feed-in-tariff policies to power production facilities [36,37]. Second, economic theories that can be used in the energy industry were not considered in the simulations. Prior studies found that there are notable economic theories validated in the renewable energy industry [38]. Third, the economic dynamics of developing countries were not considered. Several scholars indicated that the economic dynamics of developing countries can be a main hindrance to diffusing renewable energy facilities [39]. For example, the pay back period with the internal rate of return of the suggested system can be considered. Third, because the amount of electricity considered in Chiang Mai University is significantly heavy to simulate (17,654,195 kWh), the current study employs the 50% scaled electricity load information. Therefore, future studies should extend the findings of the current study by addressing these limitations.

Author Contributions

Conceptualization: E.P. and A.P.d.P.; Methodology: E.P. and S.J.K.; Data Collection and Simulation: E.P. and S.J.K.; Resources and Design: S.J.K.; Writing: E.P. and A.P.d.P.; Validation and Revision: E.P., S.J.K. and A.P.d.P.

Funding

This work was supported by the Ministry of Education of the Republic of Korea and the National Research Foundation of Korea (NRF-2018S1A5A8027730), and by the Dongguk University Research Fund of 2018. In addition, We acknowledge support from Universitat Jaume I (UJI-B2018-74).

Conflicts of Interest

The authors declare no conflict of interest.

References

  1. Abdallah, S.M.; Bressers, H.; Clancy, J.S. Energy reforms in the developing world: Sustainable development compromised? Int. J. Sustain. Energy Plan. Manag. 2015, 5, 41–56. [Google Scholar]
  2. Black, G.; Black, M.A.T.; Solan, D.; Shropshire, D. Carbon free energy development and the role of small modular reactors: A review and decision framework for deployment in developing countries. Renew. Sustain. Energy Rev. 2015, 43, 83–94. [Google Scholar] [CrossRef] [Green Version]
  3. Hu, J.L.; Kao, C.H. Efficient energy-saving targets for APEC economies. Energy Policy 2007, 35, 373–382. [Google Scholar] [CrossRef]
  4. International Energy Agency. Global Renewable Energy, IEA/IRENA Joint Policies and Measures Database, Thailand Statistics. 2015. Available online: http://www.iea.org/policiesandmeasures/renewableenergy/?country=Thailand (accessed on 30 December 2017).
  5. Kumar, S. Assessment of renewables for energy security and carbon mitigation in Southeast Asia: The case of Indonesia and Thailand. Appl. Energy 2016, 163, 63–70. [Google Scholar] [CrossRef]
  6. Chaiyapa, W.; Esteban, M.; Kameyama, Y. Why go green? Discourse analysis of motivations for Thailand’s oil and gas companies to invest in renewable energy. Energy Policy 2018, 120, 448–459. [Google Scholar] [CrossRef]
  7. International Energy Agency. Nationally Determined Contribution (NDC) to the Paris Agreement: Thailand. 2015. Available online: https://www.iea.org/policiesandmeasures/pams/thailand/name-155226-en.php (accessed on 28 May 2019).
  8. Industrial Efficiency Policy Database. TH-3: Thailand 20-Year Energy Efficiency Development Plan (2011–2030) (EEDP). 2011. Available online: http://iepd.iipnetwork.org/policy/thailand-20-year-energy-efficiency-development-plan-2011-2030-eedp (accessed on 30 December 2017).
  9. Ministry of Energy in Thailand. Thailand’s Energy Situation. 2011. Available online: http://www.thailandenergyeducation.com/energy-media/energy-in-thailand (accessed on 30 December 2017).
  10. Aroonrat, K.; Wongwises, S. Current status and potential of hydro energy in Thailand: A review. Renew. Sustain. Energy Rev. 2015, 46, 70–78. [Google Scholar] [CrossRef]
  11. Ali, I.; Shafiullah, G.; Urmee, T. A preliminary feasibility of roof-mounted solar PV systems in the Maldives. Renew. Sustain. Energy Rev. 2018, 83, 18–32. [Google Scholar] [CrossRef]
  12. Hiendro, A.; Kurnianto, R.; Rajagukguk, M.; Simanjuntak, Y.M.; Junaidi. Techno-economic analysis of photovoltaic/wind hybrid system for onshore/remote area in Indonesia. Energy 2013, 59, 652–657. [Google Scholar] [CrossRef]
  13. Kim, H.; Jung, T.Y. Independent solar photovoltaic with Energy Storage Systems (ESS) for rural electrification in Myanmar. Renew. Sustain. Energy Rev. 2018, 82, 1187–1194. [Google Scholar] [CrossRef]
  14. Fung, C.C.; Rattanongphisat, W.; Nayar, C. A simulation study on the economic aspects of hybrid energy systems for remote islands in Thailand. In Proceedings of the 2002 IEEE Region 10 Conference on Computers, Communications, Control and Power Engineering, (TENCOM’02), Beijing, China, 28–31 October 2002; Volume 3, pp. 1966–1969. [Google Scholar]
  15. Lao, C.; Chungpaibulpatana, S. Techno-economic analysis of hybrid system for rural electrification in Cambodia. Energy Procedia 2017, 138, 524–529. [Google Scholar] [CrossRef]
  16. Halabi, L.M.; Mekhilef, S.; Olatomiwa, L.; Hazelton, J. Performance analysis of hybrid PV/diesel/battery system using HOMER: A case study Sabah, Malaysia. Energy Convers. Manag. 2017, 144, 322–339. [Google Scholar] [CrossRef]
  17. Aunphattanasilp, C. From decentralization to re-nationalization: Energy policy networks and energy agenda setting in Thailand (1987–2017). Energy Policy 2018, 120, 593–599. [Google Scholar] [CrossRef]
  18. Carfora, A.; Pansini, R.V.; Romano, A.; Scandurra, G. Renewable energy development and green public policies complementarities: The case of developed and developing countries. Renew. Energy 2018, 115, 741–749. [Google Scholar] [CrossRef]
  19. Okedu, K.E.; Uhunmwangho, R. Optimization of renewable energy efficiency using HOMER. Int. J. Renew. Energy Res. 2014, 4, 421–427. [Google Scholar]
  20. Chiang Mai University. The Overview of Chiang Mai University. 2016. Available online: http://www.cmu.ac.th/index_eng.php (accessed on 30 December 2017).
  21. Thailand Government. The Energy Conservation Promotion Act. 2016. Available online: www.eppo.go.th/images/law/ENG/nation2.pdf (accessed on 30 December 2017).
  22. Thai Meteorological Department. Weather Forecast. 2017. Available online: http://www.tmd.go.th/en (accessed on 30 December 2017).
  23. National Aeronautics and Space Administration. POWER Project Data Sets. 2018. Available online: https://power.larc.nasa.gov/ (accessed on 30 December 2018).
  24. Braun, J.E. Reducing energy costs and peak electrical demand through optimal control of building thermal storage. ASHRAE Trans. 1990, 96, 876–888. [Google Scholar]
  25. Park, E.; Kwon, S.J. Towards a Sustainable Island: Independent optimal renewable power generation systems at Gadeokdo Island in South Korea. Sustain. Cities Soc. 2016, 23, 114–118. [Google Scholar] [CrossRef]
  26. YCharts. Thailand Real Interest Rate. 2016. Available online: https://ycharts.com/indicators/thailand_real_interest_rate (accessed on 30 December 2017).
  27. Park, E.; Kwon, S.J. Solutions for optimizing renewable power generation systems at Kyung-Hee University’s Global Campus, South Korea. Renew. Sustain. Energy Rev. 2016, 58, 439–449. [Google Scholar] [CrossRef]
  28. Yoo, K.; Park, E.; Kim, H.; Ohm, J.Y.; Yang, T.; Kim, K.J.; Chang, H.J.; del Pobil, A.P. Optimized renewable and sustainable electricity generation systems for Ulleungdo Island in South Korea. Sustainability 2014, 6, 7883–7893. [Google Scholar] [CrossRef]
  29. Park, E.; Kwon, S.J. Renewable electricity generation systems for electric-powered taxis: The case of Daejeon metropolitan city. Renew. Sustain. Energy Rev. 2016, 58, 1466–1474. [Google Scholar] [CrossRef]
  30. Dursun, B. Determination of the optimum hybrid renewable power generating systems for Kavakli campus of Kirklareli University, Turkey. Renew. Sustain. Energy Rev. 2012, 16, 6183–6190. [Google Scholar] [CrossRef]
  31. Hamad, A.A.; Alsaad, M.A. A software application for energy flow simulation of a grid connected photovoltaic system. Energy Convers. Manag. 2010, 51, 1684–1689. [Google Scholar] [CrossRef]
  32. Acosta, J.L.; Combe, K.; Djokic, S.Ž.; Hernando-Gil, I. Performance assessment of micro and small-scale wind turbines in urban areas. IEEE Syst. J. 2012, 6, 152–163. [Google Scholar] [CrossRef]
  33. Lau, K.Y.; Yousof, M.; Arshad, S.; Anwari, M.; Yatim, A. Performance analysis of hybrid photovoltaic/diesel energy system under Malaysian conditions. Energy 2010, 35, 3245–3255. [Google Scholar] [CrossRef]
  34. Omer, A.M. Energy, environment and sustainable development. Renew. Sustain. Energy Rev. 2008, 12, 2265–2300. [Google Scholar] [CrossRef]
  35. Piyasil, P. Electricity Pricing in the Residential Sector of Thailand. 2015. Available online: http://www.meconproject.com/wp-content/uploads/report/[Task%206-Electricity%20pricing%20in%20the%20residential%20sector]%20Thailand%20country%20report.pdf (accessed on 28 May 2019).
  36. International Energy Agency. Feed-in Tariff for Distributes Solar Systems. 2013. Available online: http://www.iea.org/policiesandmeasures/pams/thailand/name-43052-en.php (accessed on 30 December 2017).
  37. International Energy Agency. Feed-in Tariff for Very Small Power Producers (VSPP). 2014. Available online: http://www.iea.org/policiesandmeasures/pams/thailand/name-146463-en.php (accessed on 30 December 2017).
  38. Hong, S.; Chung, Y.; Woo, C. Scenario analysis for estimating the learning rate of photovoltaic power generation based on learning curve theory in South Korea. Energy 2015, 79, 80–89. [Google Scholar] [CrossRef]
  39. Ghosh, S. The New Wave: Renewable Energy and Global Energy Economics. 2015. Available online: https://www.linkedin.com/pulse/new-wave-renewable-energy-global-economics-sam-ghosh (accessed on 30 December 2017).
Figure 1. The location of Chiang Mai University (created by the authors).
Applsci 09 02319 g001
Figure 2. Monthly seasonal electricity load profile of Chiang Mai University (created by the authors).
Applsci 09 02319 g002
Figure 3. Wind resource information of Chiang Mai University (created by the authors).
Applsci 09 02319 g003
Figure 4. Solar resource information of Chiang Mai University (created by the authors).
Applsci 09 02319 g004
Figure 5. The suggested configuration (created by the authors).
Applsci 09 02319 g005
Figure 6. Summary of cash flow in the suggested configuration (created by the authors).
Applsci 09 02319 g006
Figure 7. Monthly production of electricity from the suggested configuration (created by the authors).
Applsci 09 02319 g007
Figure 8. Monthly PV power production of the suggested configuration (created by the authors).
Applsci 09 02319 g008
Figure 9. Monthly battery state of charge of the suggested configuration (created by the authors).
Applsci 09 02319 g009
Table 1. Current status of electricity production from renewable energy facilities in Thailand [5].
SourcesAmount (GWh)Share
Primary solid biofuels614143.50%
Hydro574840.70%
Solar PV10807.70%
Biogases5393.80%
Wind3052.20%
Municipal waste2932.10%
Geothermal1-
Solar thermal<1.0-
Tide, wave, ocean<1.0-
Table 2. Key points which are applied to Thailand in the Paris Agreement [6,7].
ItemDescriptions
Greenhouse gas emissions20% reduction of GHG emissions compared to the projected BAU (business-as-usual) target in 2030
Global average temperature increaseBelow 2 celcius degrees
National renewable energy targets to respond the Paris agreement30% of total energy consumption from renewable energy resources in 2036
Table 3. Examples of the suggested configuration of renewable energy production systems in Southeast Asia.
RegionsYearConfigurationCost and Renewable Fraction
Maldives [11]2018PV-diesel generator-battery$0.245 per kWh of COE (cost of energy) and 30% of renewable fraction
Indonesia [12]2013PV-wind turbine-battery$0.751 per kWh of COE and 100% of renewable fraction
Myanmar [13]2018PV-diesel generator-battery$0.193–$1.830 per kWh of COE
Thailand [14]2002PV-diesel generator-battery$0.589 per kWh of COE and 36.9% of renewable fraction
Cambodia [15]2017PV-diesel generator-battery$0.377 per kWh of COE and 13.0% of renewable fraction
Malaysia [16]2017PV-battery$1.220 per kWh of COE and 100% of renewable fraction
Table 4. Detailed economic and technical information of the components in the simulation [27,28,29,30] (O&M cost: Operation & Management cost; created by the authors).
ComponentsSizeCapital Cost ($)Replacement Cost ($)O&M Cost ($ per Year)Lifetime (Years)Considered CapacityOthers
PV array1.0 kW1800180025200−25,000 kW (5 kW-capacity steps)
  • Derating factor: 80%
  • Ground reflectance: 20% [31]
Wind turbine2 units29,00029,000400150−100 units (2-unit steps)
  • Type: Generic 10 kW turbine
  • Hub height: 25 m [32]
Battery1 unit1229122910− (hour -oriented)0−30,000 units (5-unit steps)
  • Nominal capacity: 1156 Ah and 6.94 kWh
  • Round trip efficiency: 80%
  • Nominal voltage: 6 V
  • Lifetime throughput: 9645 kWh [33]
Converter1.0 kW80080010150−2500 kW (5 kW-capacity steps)
  • Efficiency: 90%
Table 5. Optimal configuration for Chiang Mai University (created by the authors).
ComponentsIndexComponentsIndex
PV array12,780 kWInitial capital cost$46,607,984
Wind turbine0 unitOperating cost$1,734,385 per year
Battery17,965 unitsTotal net present cost$70,147,848
Converter1525 kWCost of energy$0.728 per kWh
Renewable fraction100%
Table 6. Total and annual costs of the optimal configuration (created by the authors).
CategoryComponentCapital ($)Replacement ($)O&M ($)Salvage ($)Total ($)
Total costPV array23,004,0008,065,6514,336,400−4,654,89530,751,156
Batteries22,078,98418,050,2682,438,292−5,460,54337,106,988
Converter1,525,000694,860206,980−137,1492,289,690
System46,607,98426,810,7796,981,672−10,252,58670,147,848
Annual costPV array1,694,904594,266319,500−342,9662,265,704
Batteries1,626,7501,329,919179,650−402,3252,733,993
Converter112,36051,19615,250−10,105168,701
System3,434,0131,975,382514,400−755,3975,168,399

