Article

Solids Content of Black Liquor Measured by Online Time-Domain NMR

1
FiberLaboratory, South-Eastern Finland University of Applied Sciences, Vipusenkatu 10, FI-57200 Savonlinna, Finland
2
Valmet Automation Inc., Kehräämöntie 3, FI-87400 Kajaani, Finland
*
Author to whom correspondence should be addressed.
Appl. Sci. 2019, 9(10), 2169; https://doi.org/10.3390/app9102169
Submission received: 14 April 2019 / Revised: 14 May 2019 / Accepted: 22 May 2019 / Published: 27 May 2019
(This article belongs to the Special Issue Applications of Low Field Magnetic Resonance)

Abstract

:
Black liquor, a valuable by-product of the pulp production process, is used for the recovery of chemicals and serves as an energy source for the pulp mill. Before entering the recovery unit, black liquor runs through several stages of evaporation, wherein the solids content (SC) can be used to control the evaporation effectiveness. In the current study, the time-domain nuclear magnetic resonance (TD-NMR) technique was applied to determine the SC of black liquor. The TD-NMR system was modified for flowing samples, so that the black liquor could be pumped through the system, followed by the measurement of the spin-spin relaxation rate, R2. A temperature correction was also applied to reduce deviations in the R2 caused by the sample temperature. The SC was calculated based on a linear model between the R2 and the SC values determined gravimetrically, where good agreement was shown. The online TD-NMR system was tested at a pulp mill for the SC estimation of weak black liquor over seven days without any fouling, which demonstrated the feasibility of the method in a harsh industrial environment. Therefore, the potential of the TD-NMR technology as a technique for controlling the black liquor evaporation process was demonstrated.

1. Introduction

Black liquor is a major by-product of chemical pulp production [1]. It helps to establish economically effective pulp mills, because during the chemical recovery cycle, black liquor is used as an energy source for the pulp mills, as well as the source for inorganic process chemical recovery and reuse [1,2,3,4].
In the case of the kraft process of turning wood into wood pulp, the cellulose fibers are separated from other components during digestion in aqueous solutions of sodium hydroxide and sodium sulfide at elevated temperatures and pressure [1,2]. Expended cooking liquor is called black liquor, and it contains organic and inorganic compounds, as well as water [1,5,6]. The organic part is characterized by the degradation products of wood, such as lignin, polysaccharides (mainly hemicelluloses and carboxylic acids), and extractives (i.e., resins and fatty acids) [1,5]. The inorganic part is mainly composed of soluble sodium salts [6]. There are also non-processing elements, which include, for example, potassium, chlorine, calcium, aluminum, silicon and iron ions, and these may originate from the initial raw materials, process water, make-up chemicals, waste streams, and/or equipment corrosion [1,4,7]. The chemical composition of black liquor is dependent on the origin of the raw fiber material and thus determines its physical properties. These properties include density, viscosity, rheological behavior, calorific heating value, and boiling point rise [1]. Understanding the physical properties of black liquor helps in predicting its behavior in the subsequent recovery processing [1]. The solids content (SC), or total SC, is one of the key parameters used to control the evaporation process, and it is used to estimate its efficiency.
The analytical techniques of the process can be characterized by the method of measurement as off-line, at-line, in-line, or online types [8,9]. In the off-line methods, the samples are collected from the process and are analyzed in the laboratory. For the at-line techniques, the analyses are made in close proximity to the process. Whilst for the online processes, the analytical equipment is connected to the process line, for example, using a bypass loop [9]. The sample is automatically delivered to the probe. Finally, using the in-line techniques, the analytical instruments do not require any sampling or connecting lines to transfer the sample [9]. These probes can be directly immersed into the process, wherein optical probes are typically used in the in-line techniques [9].
Traditionally, measurement of the SC is performed gravimetrically by drying at 105 °C [10] until a constant weight is reached. Although the technique is simple and robust, it is also time-consuming [2] and requires several sample preparation steps [2], such as the dilution of concentrated liquors and the addition of sand to the samples. Consequently, this gravimetric method is rarely automated or implemented in the online monitoring. Other methods, such as thermogravimetric analysis, differential scanning calorimetry, and multiple headspace extraction gas chromatography, have shown reliable results and were proposed as alternatives to the traditional methods of SC measurement [2,11]. Despite allowing much shorter analysis times, these off-line techniques are considered costly.
Online and in-line measurements of the physical properties of different constituents in the kraft pulping process can be performed using optical methods, such as refractometry [12] and Fourier transform near-infrared spectroscopy (FT-NIRS) [13,14]. The main disadvantage of such methods is that the probes of the optical devices require regular cleaning. Fouling and a consequent reduction in the efficiency of the evaporators and the measuring equipment may occur due to scaling formation [2,6]. Another way to control the process of evaporation online is to measure the density or viscosity of the black liquor. Online viscometers have been tested in pilot mills, and an overview of their performances is provided in References [15,16]. However, there is still a need for an online viscometer that can be installed permanently in the mill [17].
Few papers have been devoted to the application of time-domain nuclear magnetic resonance (TD-NMR), for the analysis of black liquor [15,16,18]. Citing the revealed correlations between several NMR relaxation parameters (Free Induction Decay (FID) magnitudes, spin-lattice T1, and spin-spin T2 relaxation times) and SC and viscosity [15,18], TD-NMR has been considered a potential industrial soft sensor for the viscosity and SC determination of black liquor [15,18]. However, a general relationship between the NMR relaxation times and the viscosity of black liquors originating from different pulps has not been found [15,18]. On the other hand, a general correlation between the FID magnitude and SC for several different pulps has been revealed in a narrow range of SCs [18], although to the authors’ best knowledge, there have been no further investigations of this finding.
Although the TD-NMR technique has not often been applied for online or in-line process analysis and control, the potential for online TD-NMR use has been shown in the laboratory [19] and in harsh industrial environments like mines [20]. TD-NMR systems for the online measurements of onboard ship fuel and for the online characterization of animal slurry have also been proposed [21,22]. In the current work, the objective was to demonstrate the feasibility of online TD-NMR use in industrial environments and to apply the TD-NMR for the measurement of the SC of black liquor.

2. Materials and Methods

2.1. Process and Samples

Typically, in the kraft processes of wood, the black liquor initially obtained after digestion goes through multiple effect evaporators, where the SC is gradually increased due to water evaporation. Black liquors at different evaporation stages have different SCs and these can be classified as weak, intermediate, half-strong, or strong black liquors. Weak black liquor has the lowest SC of about 15–20%, whilst strong black liquor has the highest SC of approximately 65–75% [1,2,3,6], even reaching up to 80–85% [4]. Strong black liquor is the final concentrated liquor that is sent to a kraft recovery boiler for energy production and chemical recovery.
In the current work, we investigated samples of weak, intermediate, and half-strong black liquors that were collected at different process stages in a pulp mill. Strong black liquor was not included in the study because its properties, such as high viscosity and temperatures, made it difficult to pump through the online TD-NMR system. The SCs of the collected black liquors were determined gravimetrically after drying at 105 °C until a constant weight was reached:
SC = w dry / w s 100 % ,
where SC is the solids content expressed as a%, and wdry and ws are the weights of the dried solids and initial sample, respectively.

2.2. NMR Measurements

2.2.1. TD-NMR System

The online TD-NMR measuring system was developed based on a commercial TD-NMR analyzer as in Reference [23]. A schematic overview of the online TD-NMR system is given in Figure 1. It consists of an electronic part and an NdFeB magnet system with a probe and a pump. The 1H resonance frequency of the system was 26 MHz at 30 °C. The NMR probe was modified for the flowing samples using a Teflon tube with a 9 mm inner diameter. The electronic part included an NMR spectrometer, a compact computer, control units for the temperature of the magnet system, and temperature sensors. The sample temperature sensor was connected to the outer surface of the Teflon tube near to the NMR measuring volume.
A peristaltic pump with thermoplastic silicon pipes was used to pump the samples through the system. Solenoid valves were installed within the inlet and outlet of the TD-NMR measuring system to avoid unnecessary movements of the sample during the measurements. The samples of black liquor were pumped from the pipes connected to the process batches and then returned back to the process after measurements.

2.2.2. Measurements and Data Analysis

The Carr-Purcell-Meiboom-Gill (CPMG) sequence [24,25] was applied for the NMR magnetization decay measurements. The durations of the 90° and 180° pulses for the 1H were 4 µs and 8 µs, respectively. The relaxation delay was 5 s, and the number of scans was equal to 4. The echo time was 3 ms, and the number of echoes was 600. The resonance frequency was tuned before each CPMG sequence was run.
As in the chosen settings, the NMR magnetization decays revealed only one component, and the NMR parameters were fitted to the decays using a mono-exponential function:
A ( t ) = A 0 e ( R 2 t ) + c 0 ,
where A0 is the maximal signal magnitude, R2 is the spin-spin relaxation rate, and c0 is the signal baseline. R2 is the inverse of the spin-spin relaxation time T2.

2.3. Relative Standard Deviation

The relative standard deviation (RSD) was calculated as the ratio of the standard deviation (SD) to the mean value ( x ¯ ) of the data xi:
R S D = S D x ¯ 100 % ,
S D = 1 n ( x i x ¯ ) 2 n 1 ,
where n is the number of data points.

3. Results

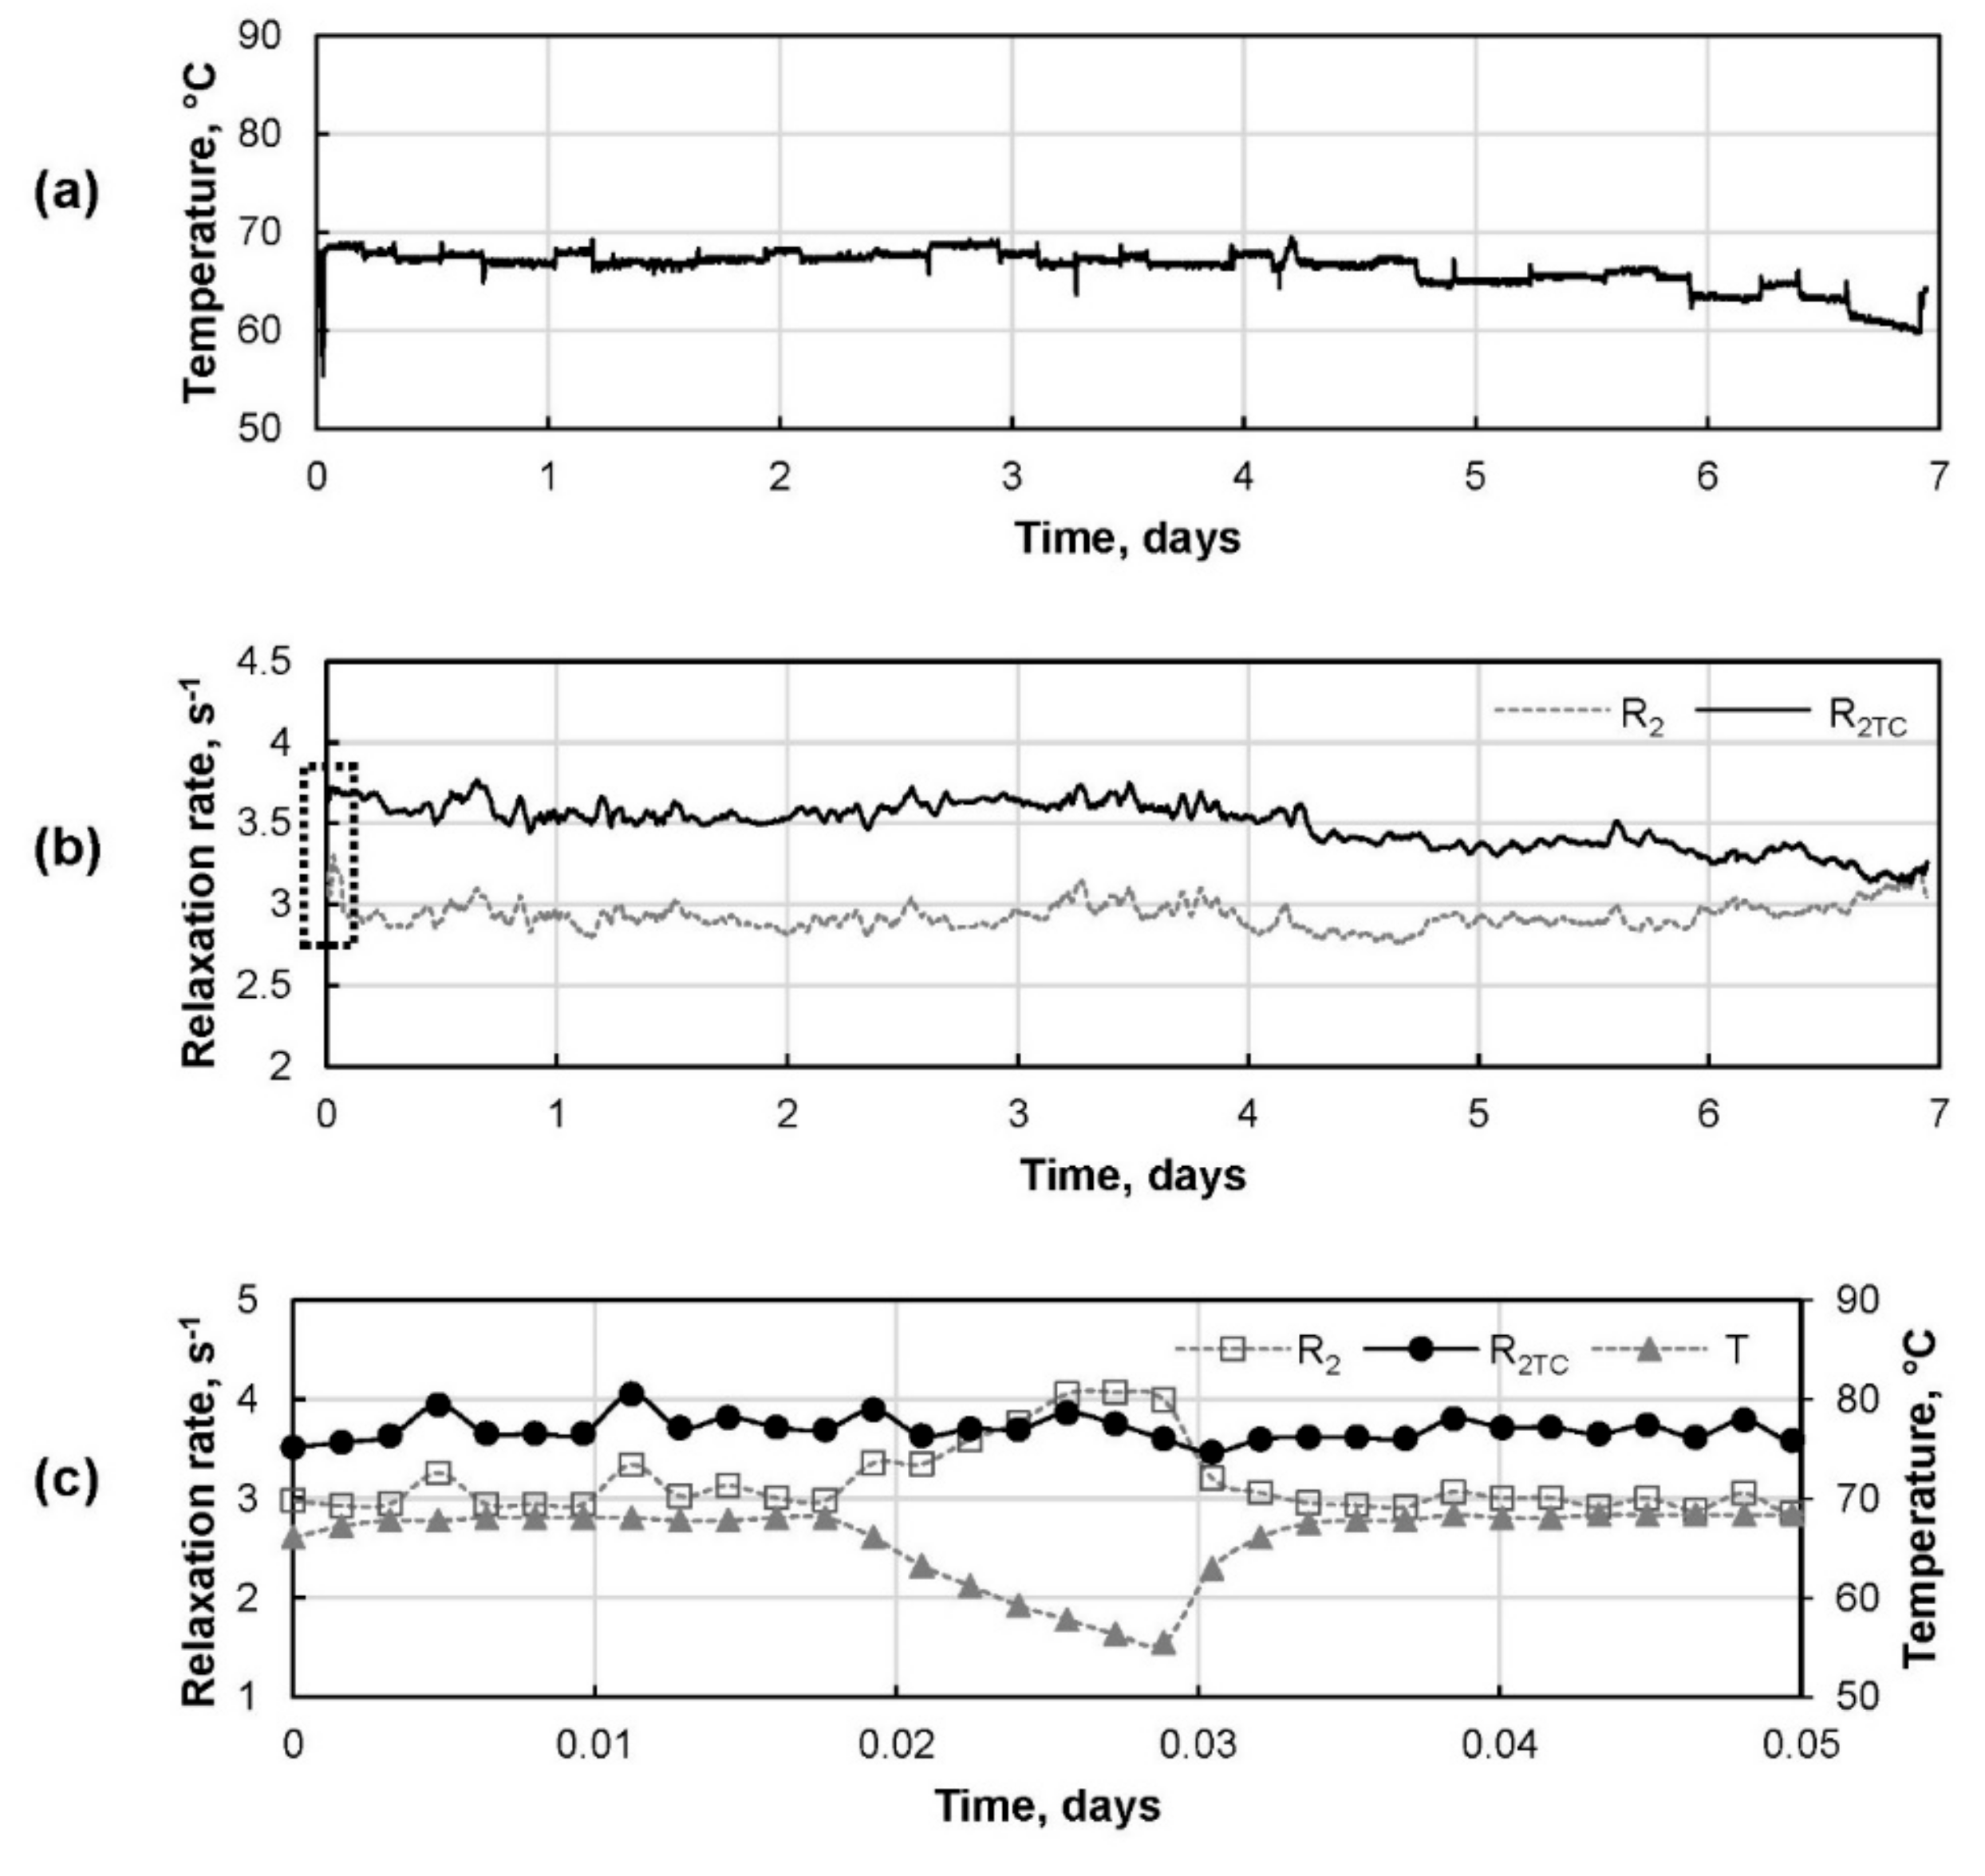
3.1. Temperature Correction

A sample of each black liquor was pumped into the magnet system once, and the relaxation rates R2 and the sample temperatures were measured during the sample cooling (Figure 2). Samples of the weak, intermediate, and half-strong black liquor were originated from different process stages and they had different process temperatures. The obtained dependences of the R2 on the temperature T were described empirically by linear equations:
R 2 = a T + b ,
where a is the slope and b is the intercept.
The temperature correction of the measured spin-spin relaxation rate R2 was described by the model:
R 2 T C ( T r e f ) = R 2 a ( T T r e f ) ,
where R2TC is the temperature-corrected spin-spin relaxation rate, Tref is the reference temperature, R2 is the measured spin-spin relaxation rate, a is the parameter in Table 1, and T is the measured sample temperature.
The average SC values, measurement temperatures T, and spin-spin relaxation rates R2TC corrected to Tref = 60 °C for the weak, intermediate, and half-strong black liquors are given in Table 2.

3.2. Solids Content Estimation

The relationship between the SC and ln(R2TC) of the samples of black liquor was described by a linear function with a correlation coefficient r that was equal to 0.9997:
SC = 14.21∙ln(R2TC) + 3.05,
where R2TC represents the temperature-corrected values from Table 2. The SC as a function of ln(R2TC) is shown in Figure 3.

3.3. Online Test

The temperatures and the NMR spin-spin relaxation rates of the weak black liquor were measured continuously using an online TD-NMR system in a pulp mill for seven days. The temperature correction in Equation (6) was applied to these data. The reference temperature Tref was 60 °C. A moving average was also used for these data sets to smooth out the short-term fluctuations. The curves are shown in Figure 4a,b, where we observed that T and R2 are changing, especially at the beginning and after the fourth day of the online test. A demonstration of the temperature correction at the beginning of the online test is given in Figure 4c. The deviation in the R2 value in Figure 4c was mainly caused by the temperature change. In Figure 4c, no moving average was used. Then, using the temperature-corrected R2TC values, the estimation of the SC was performed using Equation (7). A one-hour moving average was applied to the SC values, and the SD values were calculated within each hour using the moving data. The resulting SCs and SDs of the weak black liquor are given in Figure 5.

4. Discussion

The SC is a key physical parameter of black liquor, where online measurement is important to control the process of its evaporation in a pulp mill. In the current work, the approach proposed for SC determination was based on the TD-NMR, which is a non-invasive, non-destructive, rapid, and robust technology that is suitable for online use.
According to the Bloembergen–Purcell–Pound (BPP) theory [26], the NMR relaxation rates are dependent on the temperature of the sample. To neglect the effect of temperature on the measured spin-spin relaxation rates R2, a temperature correction can be performed as has been done, for example, by Webb et al. [27]. Figure 2 shows that the R2 of black liquors is linearly dependent on the temperature T. The applied temperature correction effectively compensates for the deviations in the measured R2 values, as shown in Figure 4.
The estimation of the SC was based on the linear correlation between the temperature-corrected ln(R2TC) values and the SC that was measured gravimetrically in the laboratory (Figure 3). As only one component was discovered in the measured NMR decays, it was assumed that the measured R2 was the result of a fast exchange of the 1H of water and the dissolved solids in the black liquor. The correlation found between the SC and the ln(R2TC) was explained by the dependence of the viscosity of the black liquor on the SC [1,6], and of the R2 on the viscosity of liquids [18,19,26,28]. It has been shown in References [15,18] that the spin-spin relaxation times T2, as well as the spin-lattice relaxation times T1, correlated well with the viscosity of the black liquors. However, creating a general model between the NMR parameters and viscosity of the black liquors was restricted by the dependence of the NMR relaxation times on the chemical composition, concentration of metal ions in the black liquors, and the non-Newtonian behavior of strong black liquor [15,18]. The properties of black liquor from obtained each mill were different and dependent on a variety of factors [4]. Therefore, the models for the calculation of the physical parameters should be recalibrated for various pulp mills.
In the current work, we measured the R2 of a black liquor of constant composition and checked how the TD-NMR system performed in a mill. Since the pH of the black liquors was high (for weak black liquor it was approximately 12), the paramagnetic metals that could be present in black liquors should be precipitated, and thus, they would not affect the NMR relaxation. Measurements were made using stopped flow, as such the flow rate and geometry did not influence the R2 values [19,20,29].
The online TD-NMR measuring system was installed in a pulp mill, and measurements of the spin-spin relaxation rates R2 and the estimation using Equation (7) of the SCs of weak black liquor were made continuously over seven days (Figure 5). The SCs and SDs were calculated based on a one-hour moving average to smooth out the short-term fluctuations. The average of ten relative standard deviations (RSDs) calculated for twelve repeated R2 measurements of the same sample by the TD-NMR was 0.72%. The reported RSD of the standard method was 0.46% for a repeated SC analysis of the same sample [10]. Thus, the TD-NMR provides the same order of accuracy of R2 measurements as the standard method.
The approach of estimating the SC of black liquor using the online TD-NMR is fast and almost gives the results in real-time. In contrast, the standard method for SC determination [10] is time consuming and cannot be performed online. Measuring the viscosity of black liquor is one way to control the process, although it is usually conducted offline, it requires sample gathering and additional calculations based on the calibration of the viscosity with the temperature. Online viscometers have been tested in pilot mills [15,16]; however, there are no such devices that can be installed permanently in the mills [17]. Optical methods, such as refractometry and NIRS, can be used at the pulp mills for the online analysis of constituents in the kraft process. However, the probes of the optical devices require continuous cleaning because of fouling. In contrast to the optical methods, TD-NMR is non-fouling, as the sample flows through the pipe and does not have any direct contact with the probe.
The online TD-NMR system has previously been demonstrated to be useful in liquid fuel analysis [19,30]. Online measurements of the R2 have shown the same order of accuracy as the R2 measured conventionally in NMR tubes. The system was also used to perform online measurements of water during heavy metal precipitation in a real mine [20], where the environmental conditions were rather harsh.
To the best of the authors’ knowledge, the implementation of the TD-NMR in online measurements of black liquor at a pulp mill was carried out for the first time. TD-NMR and compact NMR spectroscopy are being considered for use as industrial sensors in the near future, owing to their many advantages, such as their non-fouling, non-destructive, rapid, and robust properties. However, some challenges still need to be overcome, including the pre-polarization time, cost of implementation, and low sensitivity [31,32]. The results prove that TD-NMR may be used as a sensor in industrial processes, which is highly in demand given the current trends in digitalization and implementation of the Industrial Internet of Things [33]. The proposed system can be considered as an intelligent measurement system that can help to more efficiently control the evaporation of black liquor and the pulping process.

5. Conclusions

In the current work, the NMR spin-spin relaxation rate R2 was used to analyze the SC of black liquor. A temperature correction was applied to minimize the deviations in R2 caused by the temperature. Online continuous measurements of weak black liquor were made over seven days, wherein the feasibility of using the online TD-NMR system in the industrial environment of a pulp mill was demonstrated. The technique used is non-destructive and non-invasive, and it provides rapid and robust measurements with a similar accuracy of measurements as the SC determination using the standard method. It can be concluded that TD-NMR is a promising technology citing its industrial applications, and also that the online TD-NMR system can potentially be used as an industrial sensor, for example, to control the process of black liquor evaporation.

Author Contributions

Conceptualization, E.N., P.J., M.H., and Y.H.; Formal analysis, E.N. and Y.H.; Investigation, E.N. and Y.H.; Methodology, E.N. and Y.H.; Supervision, Y.H.; Visualization, E.N.; Writing—original draft, E.N.; Writing—review & editing, E.N., P.J., M.H., and Y.H.

Funding

This research was funded by the Centre for Economic Development, Transport and the Environment (ELY Centre) for South Savo (Finland), European Regional Development Fund (ERDF), Suur-Savon Energiasäätiö sr and partner companies, grant number A73842.

Acknowledgments

The authors are grateful for the financial support from the Centre for Economic Development, Transport and the Environment (ELY Centre) for South Savo (Finland), European Regional Development Fund (ERDF), Suur-Savon Energiasäätiö sr and partner companies.

Conflicts of Interest

The authors declare no conflict of interest.

References

  1. Cardoso, M.; Domingos de Oliveira, É.; Passos, M.L. Chemical composition and physical properties of black liquors and their effects on liquor recovery operation in Brazilian pulp mills. Fuel 2009, 88, 756–763. [Google Scholar] [CrossRef]
  2. Leite, B.S.; Andreuccetti, M.T.; Leite, S.A.; d’Angelo, J.V. TG and DSC analyses of eucalyptus black liquor as alternative methods to estimate solids content. J. Therm. Anal. Calorim. 2013, 112, 1539–1544. [Google Scholar] [CrossRef]
  3. Vähä-Savo, N. Behavior of Black Liquor Nitrogen in Combustion—Formation of Cyanate. Ph.D. Thesis, Åbo Akademi University, Åbo, Finland, 2014. [Google Scholar]
  4. Tran, H.; Vakkilainnen, E.K. The kraft chemical recovery process. Tappi. 2008. Available online: http://www.tappi.org/content/events/08kros/manuscripts/1-1.pdf (accessed on 29 November 2018).
  5. Gullichsen, J.; Paulapuro, H. Forest product chemistry. In Papermaking Science and Technology; (series of 19 books); Gullichsen, J., Paulapuro, H., Eds.; Fapet Oy: Helsinki, Finland, 2000; Book 3; pp. 58–104. [Google Scholar]
  6. Andreuccetti, M.; Leite, B.; d’Angelo, J. Eucalyptus black liquor—Density, viscosity, solids and sodium sulfate contents revisited. O PAPEL 2011, 72, 52–57. [Google Scholar]
  7. Manskinen, K.; Nurmesniemi, H.; Pöykiö, R. Total and extractable non-process elements in green liquor dregs from the chemical recovery circuit of a semi-chemical pulp mill. Chem. Eng. J. 2011, 166, 954–961. [Google Scholar] [CrossRef]
  8. Blümich, B.; Singh, K. Desktop NMR and its applications from materials science to organic chemistry. Angew. Chem. Int. Ed. 2018, 57, 6996–7010. [Google Scholar] [CrossRef]
  9. Dalitz, F.; Cudaj, M.; Maiwald, M.; Guthausen, G. Process and reaction monitoring by low-field NMR spectroscopy. Progr. Nucl. Magnet. Resonance Spectrosc. 2012, 60, 52–70. [Google Scholar] [CrossRef] [PubMed]
  10. T650 om-89 TAPPI. Test Method: Solids Content of Black Liquor, T650 om-89; TAPPI Press: Peachtree Corners, GA, USA, 1989. [Google Scholar]
  11. Xin, L.-P.; Chai, X.-S.; Hu, H.-C.; Barnes, D. A novel method for rapid determination of total solid content in viscous liquids by multiple headspace extraction gas chromatography. J. Chromatogr. A 2014, 1358, 299–302. [Google Scholar] [CrossRef] [PubMed]
  12. Kopra, R.; Kari, E.; Harinen, M.; Tirri, T.; Dahl, O. Improving brown stock washing by on-line measurement—Mill investigations. O PAPEL 2012, 73, 79–85. [Google Scholar]
  13. Kester, M.; Trung, T.; Leclerc, D.; Carver, J. On-line determination of kraft liquor constituents by Fourier-Transform Near Infrared Spectroscopy. J. Pulp Paper Sci. 2004, 30, 121–128. [Google Scholar]
  14. Trung, T.; Allison, B. Advanced online process analyzer for chemical recovery and pulp mill control. O PAPEL 2015, 76, 47–56. [Google Scholar]
  15. Fricke, A.; Crisalle, O. Development of Viscometers for Kraft Black Liquor. Final Report—Phases I, II, IIA, and III. DOE/GO/10564-F; Chemical Engineering Department, University of Florida: Gainesville, FL, USA, 1999. [Google Scholar]
  16. Alabi, S. Development and Implementation of an Online Kraft Black Liquor Viscosity Soft Sensor. Ph.D. Thesis, University of Canterbury, Canterbury, New Zealand, 2010. [Google Scholar]
  17. Alabi, S.; Williamson, C.; Lee, J. Viscosity models for New Zealand black liquor at low solids concentrations. Asia Pac. J. Chem. Eng. 2010, 5, 619–625. [Google Scholar] [CrossRef]
  18. Draheim, E.J.; Ragauskas, A.J. NMR Studies Part 2: Investigation of process analytical NMR techniques for the pulp and paper industry. J. Wood Chem. Technol. 1997, 17, 287–296. [Google Scholar] [CrossRef]
  19. Nikolskaya, E.; Hiltunen, Y. Molecular properties of fatty acid mixtures estimated by online time-domain NMR. Appl. Magn. Reason. 2019, 50, 159–170. [Google Scholar] [CrossRef]
  20. Nikolskaya, E.; Liukkonen, M.; Kankkunen, J.; Hiltunen, Y. A non-fouling online method for monitoring precipitation of metal ions in mine waters. IFAC PapersOnLine 2015, 48–17, 98–101. [Google Scholar] [CrossRef]
  21. Sørensen, M.; Vinding, M.; Bakharev, O.; Nesgaard, T.; Jensen, O.; Nielsen, N. NMR sensor for onboard ship detection of catalytic fines in marine fuel oils. Anal. Chem. 2014, 86, 7205–7208. [Google Scholar] [CrossRef] [PubMed]
  22. Sørensen, M.K.; Jensen, O.; Bakharev, O.N.; Nyord, T.; Nielsen, N.C. NPK NMR Sensor: Online monitoring of nitrogen, phosphorus, and potassium in animal slurry. Anal. Chem. 2015, 87, 6446–6450. [Google Scholar] [CrossRef]
  23. Resonance Systems. Available online: http://www.nmr-design.com (accessed on 29 November 2018).
  24. Carr, H.; Purcell, E. Effects of diffusion on free precession in nuclear magnetic resonance experiments. Phys. Rev. 1954, 94, 630–638. [Google Scholar] [CrossRef]
  25. Meiboom, S.; Gill, D. Modified spin-echo method for measuring nuclear relaxation times. Rev. Sci. Instrum. 1958, 29, 688–691. [Google Scholar] [CrossRef]
  26. Bloembergen, N.; Purcell, E.; Pound, R. Relaxation effects in nuclear magnetic resonance absorption. Physical Rev. 1948, 73, 679–712. [Google Scholar] [CrossRef]
  27. Webb, B.; Widek, T.; Neumayer, B.; Bruguier, C.; Scheicher, S.; Sprenger, H.; Grabherr, S.; Schwark, T.; Stollberger, R. Temperature dependence of viscosity, relaxation times (T1, T2) and simulated contrast for potential perfusates in post-mortem MR angiography (PMMRA). Int. J. Legal Med. 2017, 131, 739–749. [Google Scholar] [CrossRef]
  28. Robinson, M.D.; Cistola, D.P. Nanofluidity of fatty acid hydrocarbon chains as monitored by benchtop time-domain nuclear magnetic resonance. Biochemistry 2014, 53, 7515–7522. [Google Scholar] [CrossRef]
  29. Raunio, J.; Nikolskaya, E.; Hiltunen, Y. On-line monitoring of cationic starch gelatinization and retrogradation by 1H NMR-relaxometry. Nord. Pulp Paper Res. J. 2018, 33, 625–631. [Google Scholar] [CrossRef]
  30. Nikolskaya, E.; Hiltunen, Y. Determination of carbon chain lengths of fatty acid mixtures by time domain NMR. Appl. Magn. Reson. 2018, 49, 185–193. [Google Scholar] [CrossRef]
  31. Colnago, L.A.; Andrade, F.D.; Souza, A.A.; Azeredo, R.B.V.; Lima, A.A.; Cerioni, L.M.; Osán, T.M.; Pusiol, D.J. Why is inline NMR rarely used as industrial sensor? Challenges and opportunities. Chem. Eng. Technol. 2014, 37, 191–203. [Google Scholar] [CrossRef]
  32. Meyer, K.; Kern, S.; Zientek, N.; Guthausen, G.; Maiwald, M. Process control with compact NMR. Trends Anal. Chem. 2016, 83, 39–52. [Google Scholar] [CrossRef]
  33. Maiwald, M.; Gräßer, P.; Wander, L.; Zientek, N.; Guhl, S.; Meyer, K.; Kern, S. Strangers in the night—Smart process sensors in our current automation landscape. Proceedings 2017, 1, 628. [Google Scholar] [CrossRef]
Figure 1. Schematic overview of the online time-domain nuclear magnetic resonance (TD-NMR) measuring system.
Applsci 09 02169 g001
Figure 2. R2 measured for the weak (triangles), intermediate (squares), and half-strong (circles) black liquor samples at different temperatures.
Applsci 09 02169 g002
Figure 3. Solids content (SCs) as a function of the spin-spin relaxation rates ln(R2TC) corrected to Tref = 60 °C for the black liquor samples.
Applsci 09 02169 g003
Figure 4. Data measured for the weak black liquor in the online test: (a) Sample temperature; (b) Measured R2 values and values of the R2TC corrected to Tref = 60 °C, after applying a one-hour moving average; (c) Temperature correction at the beginning of the test (dotted rectangle in Figure 4b): measured R2 (squares), values of the R2TC corrected to Tref = 60 °C (circles), and the sample temperature T (triangles).
Applsci 09 02169 g004
Figure 5. Estimated solids content (SC) shown by a black line, and standard deviations (SD) shown by the grey lines. Average SCs and SDs were estimated within one hour, using moving data.
Applsci 09 02169 g005
Table 1. Slopes a and Pearson correlation coefficients r from the linear Equation (5) for the weak, intermediate, and half-strong black liquors.
Samplea, (°C·s)−1r
Weak−0.088−0.9937
Intermediate−0.305−0.9842
Half-strong−0.465−0.9978
Table 2. Average values of the solids content (SC), measurement temperatures (T), and spin-spin relaxation rates R2TC corrected to Tref = 60 °C for several black liquor samples.
SampleSC, %T, °CR2TC (60 °C), s−1
Weak20.7367.963.46
Weak21.4766.953.72
Intermediate31.5760.677.26
Half-strong43.4673.8117.35

