Article

Probability of Abnormal Indoor Air Exposure Categories Compared with Occupants’ Symptoms, Health Information, and Psychosocial Work Environment

1
Department of Civil Engineering, Aalto University, 02150 Espoo, Finland
2
Finnish Institute of Occupational Health, Healthy Workspaces, P.O. Box 18, 00032 Työterveyslaitos, Finland
*
Author to whom correspondence should be addressed.
Appl. Sci. 2019, 9(1), 99; https://doi.org/10.3390/app9010099
Submission received: 29 November 2018 / Revised: 20 December 2018 / Accepted: 21 December 2018 / Published: 28 December 2018
(This article belongs to the Special Issue Indoor Air Quality)

Abstract

:
Indoor air problems are complicated and need to be approached from many perspectives. In this research, we studied the association of four-level categorisation of the probability of abnormal indoor air (IA) exposure with the work environment-related symptoms, group-level health information and psychosocial work environment of employees. We also evaluated the multiprofessional IA group assessment of the current indoor air quality (IAQ) of the hospital premises. We found no statistical association between the four-level categorisation of the probability of abnormal IA exposure and the employees’ perceived symptoms, health information, and perceived psychosocial work environment. However, the results showed a statistical association between perceived symptoms and man-made vitreous fibre sources in ventilation. Furthermore, extensive impurity sources in the premises increased the employees’ contact with health services and their perceived symptoms. The employees perceived stress and symptoms in all categories of abnormal IA exposure, which may be related to IAQ or other factors affecting human experience. Prolonged process management may influence users’ experiences of IAQ. The results suggest that an extensive impurity source in premises does not always associate with the prevalence of perceived symptoms. We conclude that indoor air questionnaires alone cannot determine the urgency of the measures required.

1. Introduction

To assess the health significance, urgency, and extent of required indoor air quality (IAQ) measures, property owners and occupational health and safety professionals need reliable information on the buildings’ conditions and impurity sources. Information is also needed regarding the experiences and health of the users of the premises, and on the cooperation in indoor air (IA) solution processes. When all the factors affecting the IAQ problem have been properly assessed, the degree, timing, and possible prioritisation of measures can be decided on. Properly timed and targeted measures have important implications for the economy, health, and well-being. IAQ problems can be controlled and good IAQ achieved if (i) the factors affecting the indoor environment are under control, (ii) the indoor environment is perceived as good and healthy [1,2,3], and (iii) good practices are in place for maintaining the indoor environment and solving indoor air (IA) problems [3,4].
IAQ problems are often the result of many different factors and their interaction or complex combination. In addition to moisture and mould damage, several other factors and their interactions, such as material emissions [5], ventilation deficiencies [6], system impurities [7], outdoor and soil impurities [8], human activities in the premises [9], IA temperature, and dry air [10] can cause IAQ problems. Office-type buildings have no established measurement methods for all IA pollutants, and no health-based limit values for most of them [2,11].
Several IA pollutant sources can cause symptoms and harm to the users of premises. A recent review concluded that the greater the presence of moisture and mould damage in the premises, the greater the risk of respiratory health effects [11]. Man-made vitreous fibres (MMVF) in the ventilation system may cause upper respiratory irritation and skin symptoms among users of the premises [5,12,13,14]. Volatile organic compounds (VOC) from building materials may cause sensory irritation [5,7]. IAQ problems may also affect sick leaves and work efficiency [15].
It has been estimated that predictive property management reduces the IAQ-related symptoms of premises users [16], and some evidence shows that repairing moisture and mould damage and removing contaminants from buildings can reduce respiratory symptoms [17,18] and improve work efficiency [19].
In addition to IAQ factors, several other factors at workplaces, such as stress, poor cooperation, heavy workload, and individual factors may also affect perceived IAQ and play a role in IAQ problems [20,21]. These problems should be examined from a wider perspective, and experience of the users of the premises and the psychosocial environment should be considered [20,21,22,23]. It has been suggested that good practices for solving complex or prolonged IAQ problems are well organised and involve long-term multiprofessional cooperation between experts [23,24].
The aim of this study was to test the use of the holistic approach in determining the urgency of the measures required from the perspective of building health. It can be divided into the following sub-aims: (i) to evaluate the relation between the four-level categorised probability of abnormal IA exposure and employees’ work environment-related symptoms, group-level health information, and psychosocial work environment, (ii) to assess the relation between ventilation system deficiencies and employees’ work environment-related symptoms and (iii) to evaluate the impact of prolonged IAQ problem solution processes on perceived IAQ.
This paper uses the term probability of abnormal IA exposure, which means a comprehensive method of categorising the results of building and ventilation system research. The method used to assess the probability of abnormal IA exposure is presented in our earlier study [25].

2. Materials and Methods

2.1. Materials

This study is based on two research and development projects conducted at the Finnish Institute of Occupational Health (FIOH). These projects were carried out between February 2013 and April 2014, in 27 hospital buildings (studied area altogether about 130,000 m2), which form a unified building complex located in two Finnish hospital districts. Background information on the buildings’ earlier history and documents revealed that parts of the buildings had IAQ problems. We investigated altogether 111 building floors or sections and selected forty building floors or sections on which to focus in more detail, from the premises in which both the IA questionnaire and the assessment of probability of abnormal IA exposure were carried out. We also conducted the building investigations and abnormal IA exposure assessments were still carried out in building premises that were not workplaces or were not in use. The oldest building was built around 1902 and the newest in 2010. One half of the buildings (48%) were built between the 1940s and 1950s. All of them were of stone or different combinations of stone materials and were mostly multistorey and divided between many hospital department areas and hospital functions. Some of the buildings had been repaired in several different stages and these renovations varied greatly. The ventilation system of the buildings was mostly mechanical extract and supply ventilation. However, several different ventilation systems and machines served different parts of the building. The maintenance, repair, reliability, and age of the ventilation systems varied considerably across the floors or sections of even one building.
The same IA researcher group conducted all the building research and ventilation system assessments. All the data were analysed by the same multi-professional group of experts, which comprised IA researchers, a civil engineer, an occupational health physician, a microbiologist, and a ventilation and building health specialist.

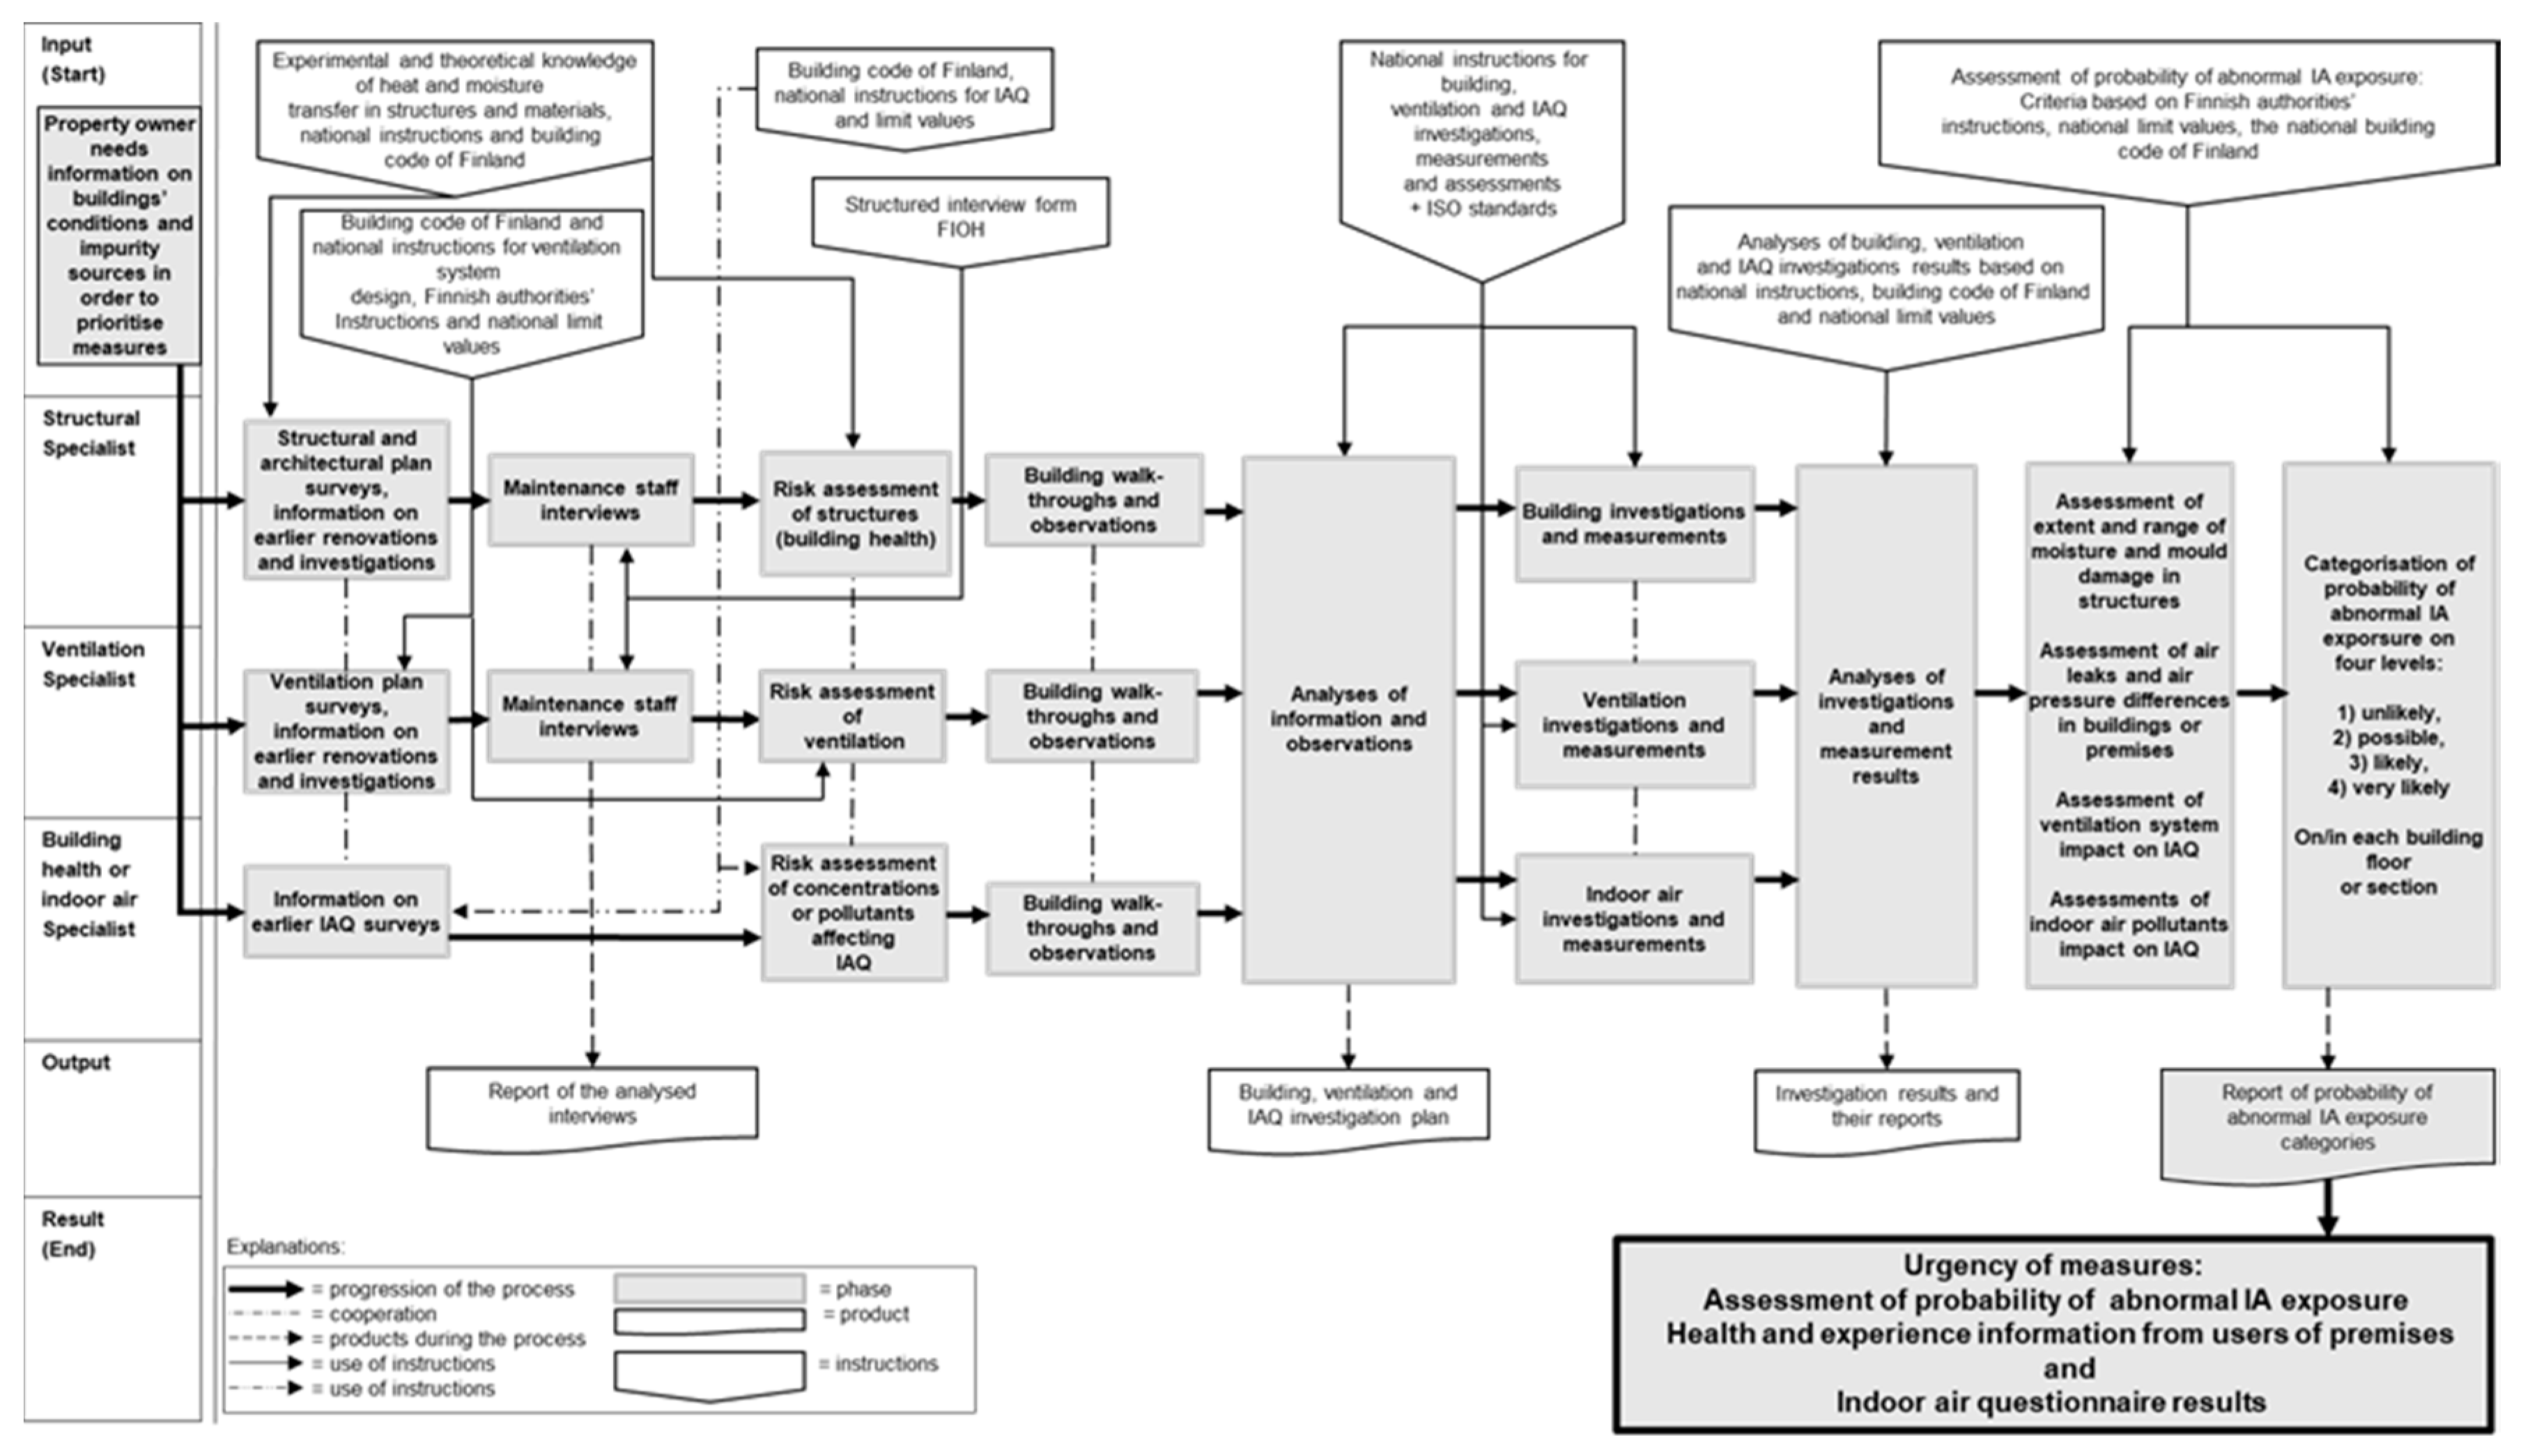
2.2. Assessment of Probability of Abnormal IA Exposure

We carried out systematic building examinations that covered (i) structural and architectural plan surveys, (ii) maintenance staff interviews, (iii) examinations and openings of high-risk building structures, (iv) moisture- and mould-damaged range and severity authentications, (v) assessments of ventilation systems, (vi) assessments of air leaks from or through damaged structures, (vii) assessments of air pressure differences, and (viii) assessments of other IA pollutants or pollutant sources in the buildings [25] (Figure 1). We collected building investigation and IAQ measurement results and used a four-level categorisation method to assess the probability of abnormal IA exposure [25] (Figure 1).
We collected categorised parameters for the final assessment of the probability of abnormal IA exposure. This probability was categorised as: (1) probability of abnormal IA exposure unlikely, (2) probability of abnormal IA exposure possible, (3) probability of abnormal IA exposure likely, and (4) probability of abnormal IA exposure very likely [25] (Table 1). In cases of moisture and mould damage, air leaks from or through damaged structures to IA must be examined simultaneously with indoor negative pressure. In the main criteria for assessing the probability of abnormal IA exposure, the predominant IA impurity source is a determining criterion. The probability of abnormal IA exposure arises when the national limit values (IAQ, material samples, ventilation) are exceeded, structures or systems have found damaged, or IAQ pollutant sources that are known to affect indoor air quality and building health are found [25]. The national maximum limit values for IA concentrations, microbial growth on building material, MMVF and asbestos in dust, and specific detailed methods for evaluating building and ventilation conditions and IAQ are presented in our earlier research [25].

2.3. Employees’ Experiences of Indoor Air Quality and Psychosocial Work Environment

To study the users’, i.e., employees’ experiences of the work premises, work environment-related symptoms and psychosocial work environment, we used FIOH’s validated and frequently used IA questionnaire, which is based on Örebro’s [27] indoor climate questionnaire [28,29]. To study perceived stress, we used a validated single-item measure of stress symptoms [30]: “Stress means a situation in which a person feels tense, restless, nervous or anxious or is unable to sleep at night because his/her mind is troubled all the time. Do you feel this kind of stress these days?”. The response options were: (1) not at all, (2) just a little, (3) some, (4) quite a lot, and (5) very much. In the analyses, we combined the levels (1) not at all and (2) just a little into one level, and levels (4) quite a lot and (5) very much into one level.
We sent the questionnaire to 3608 hospital employees, of whom 2669 responded. The total response rate was 74%, with a range of 51% to 93%. The surveys were conducted in the spring from February to April and in the autumn in November, in 2013. We selected 40 IA questionnaire groups for the study, totaling 1558 respondents. The selected IA questionnaire groups were in premises in which the probability of abnormal IA exposure assessment had already been performed. The employees did not know the results of the assessment prior to responding to the IA questionnaires. This is a questionnaire-based study, in which participation was voluntary and performed no intervention on individuals, according to Finnish legislation it did not require ethics committee handling.

2.4. Group-Level Information from Occupational Health Services and Multiprofessional Indoor Air Group

We obtained information on the assessment of the group-level health of employees from occupational health services (OHS). The information covered employees’ health from 43 building sections or floors. The group-level information from the OHS did not contain information on how many employees had work environment-related health symptoms in the building sections or on the floors. In the survey, we used short forms to ask about the following issues in relation to employees’ health: (i) case of new onset asthma or aggravation of existing asthma, (ii) having to change workroom because of IAQ and work environment-related symptoms, (iii) increased amount of employee visits to OHS due to IAQ-related issues, and (iv) increased sickness absences due to respiratory symptoms. The hospital’s multiprofessional IA group also provided information on the estimated duration of the IAQ problem solution on every building floor or section.

2.5. Statistical Analyses

Statistical analyses were carried out using IBM SPSS Statistics program 25.0 with a statistically significant level of p < 0.05. The statistical analysis used weighted averages of group response rates. The Mann–Whitney U test studied the differences between the probability of abnormal IA exposure categories (unlikely, possible, likely, and very likely) and the employees’ complaints about their work environment-related symptoms and psychosocial work environment. This test also compared the difference between the two groups’ (yes/no) ventilation adequacy, ventilation MMVF sources, ventilation moisture problems, and expired ventilation lifespan and the employees’ complaints about their work environment-related symptoms. Fisher’s exact test studied the relation between the weekly work environment-related symptoms experienced by the employees and the categorised group-level information on employee health. The group-level health information was categorised as ‘yes’ and ‘no’ as follows: case of new onset asthma or aggravation of existing asthma, having to change workroom or workplace because of work environment-related symptoms, increased amount of employee visits to OHS, and increased sickness absences due to respiratory symptoms.

3. Results

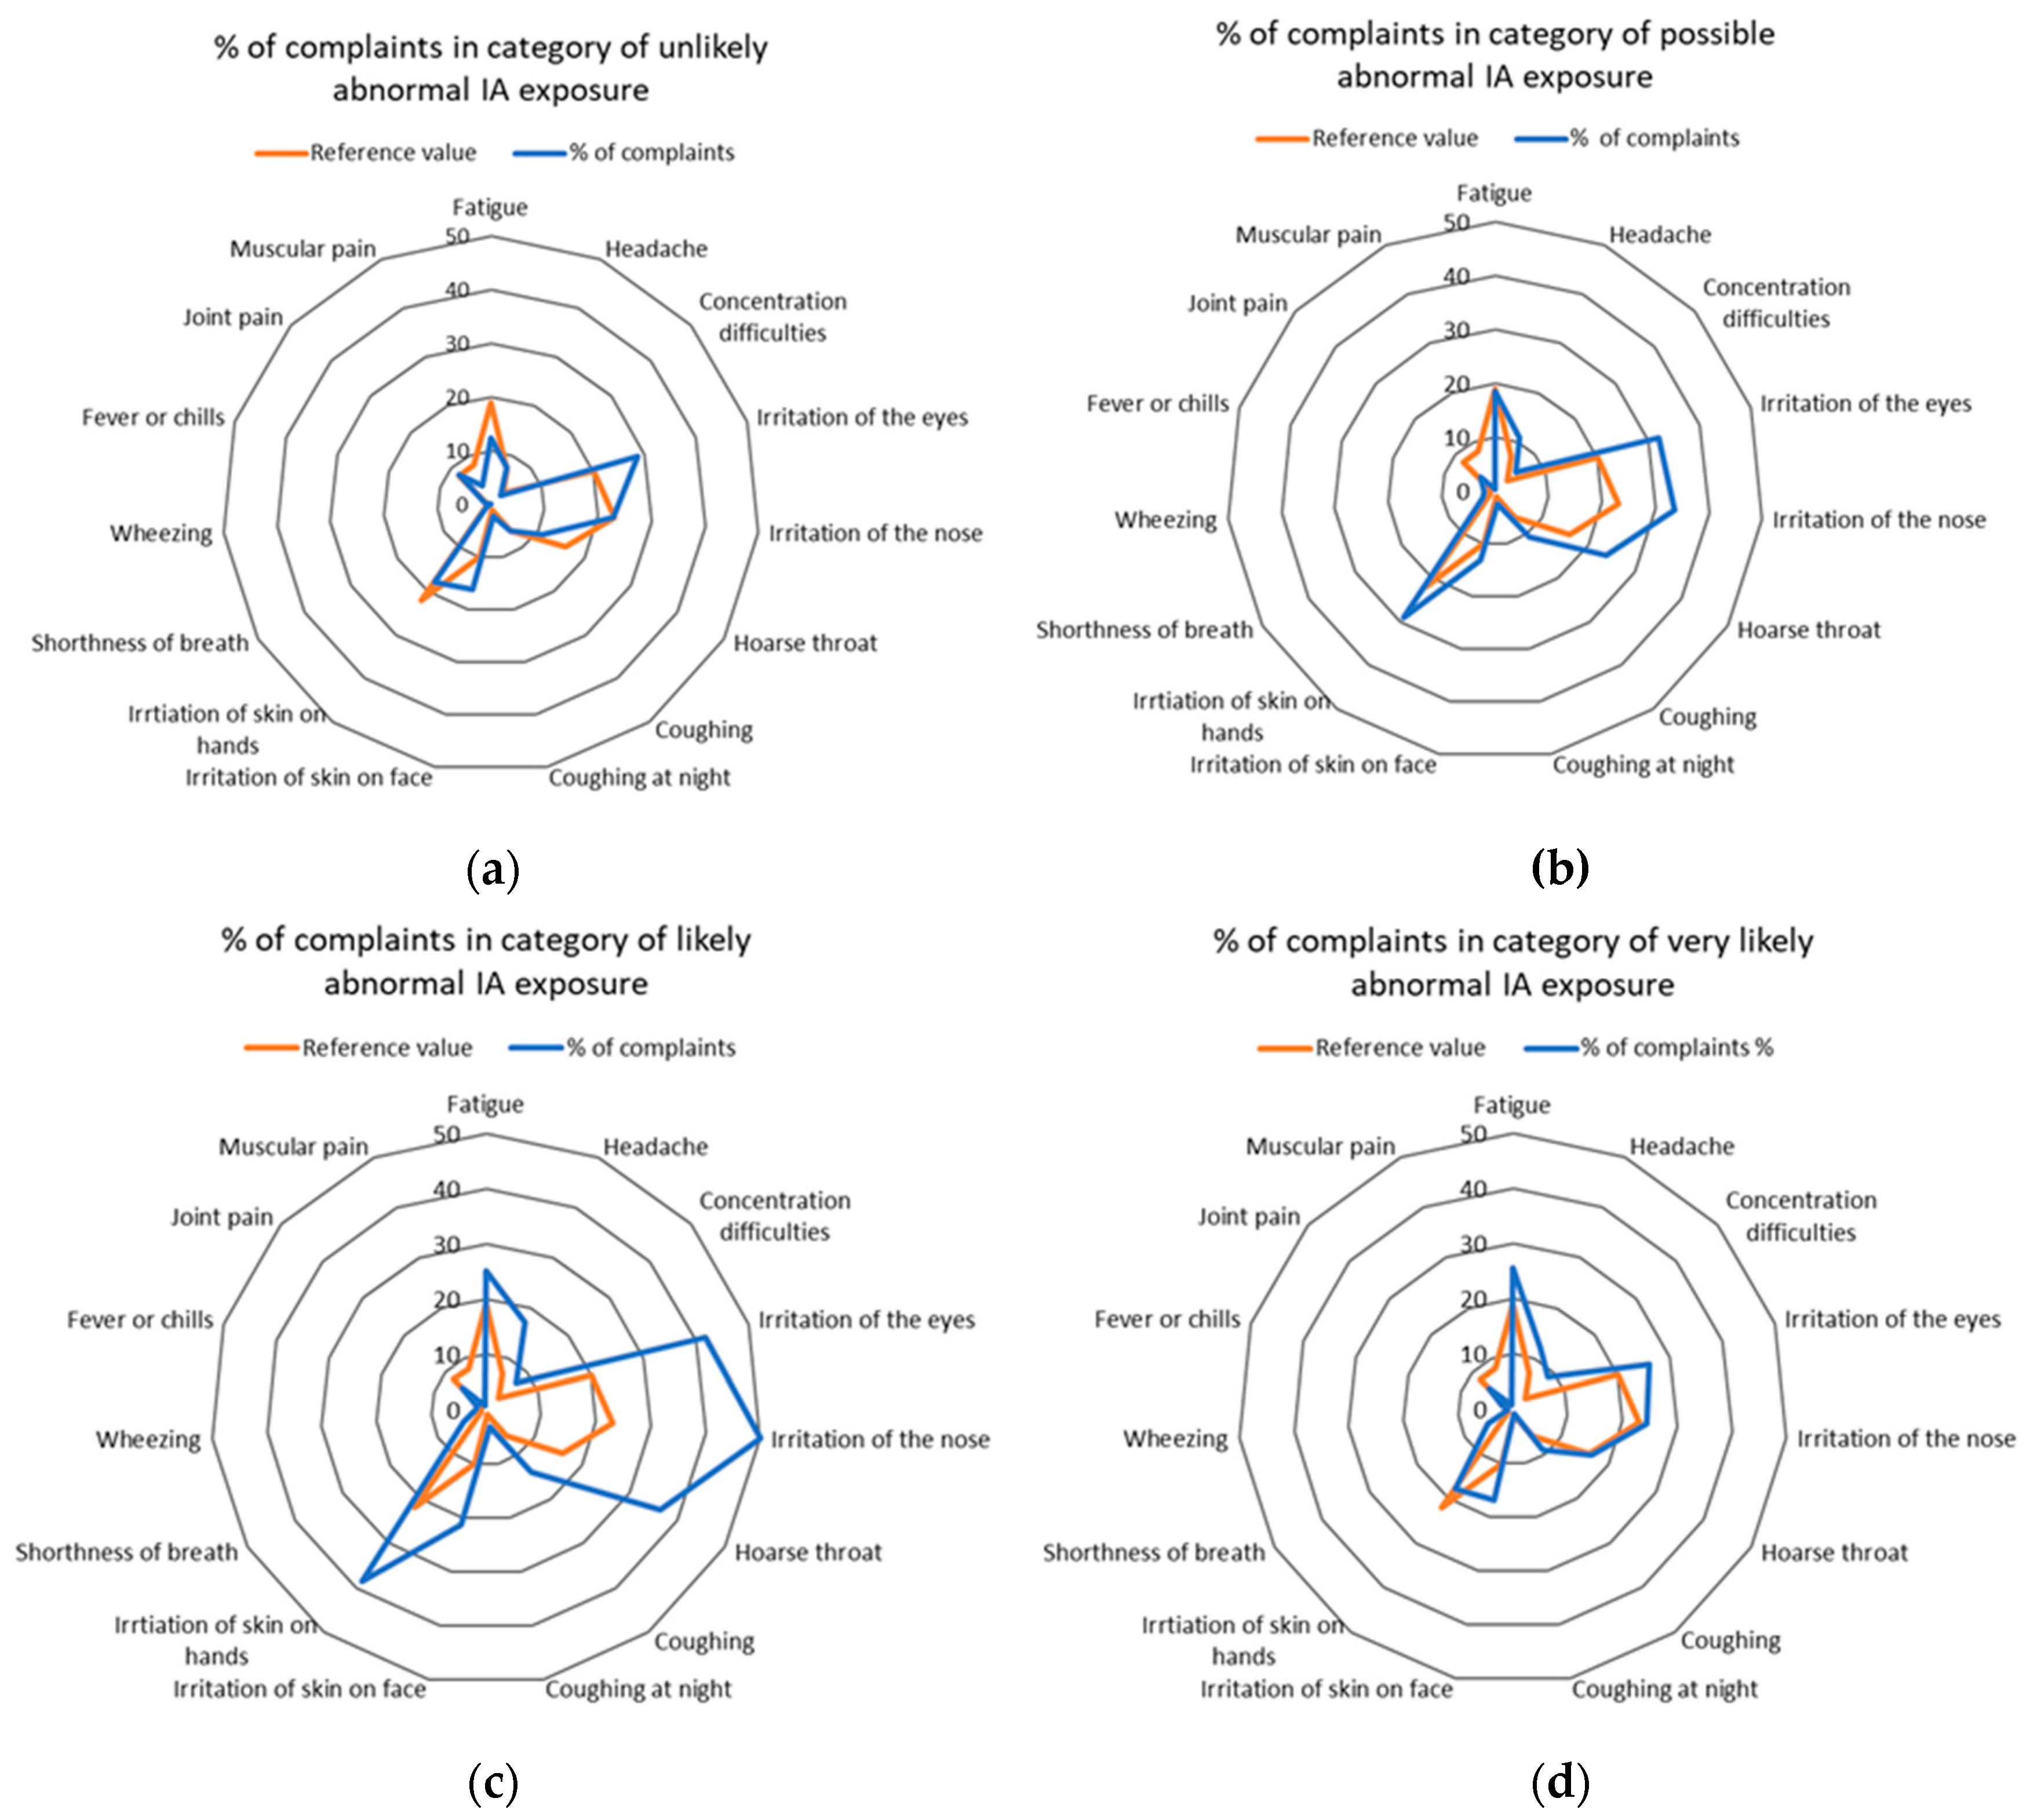
Probability of Abnormal IA Exposure and Employees’ Experience

All building floors or sections (total 111) were investigated and we were able to assess the probability of abnormal IA exposure on or in 95 building floors or sections. In the case of forty building floors or sections, the assessment of the probability of abnormal IA exposure and IA questionnaire could both be conducted in the same areas (the IA questionnaire group was located in the area that was assessed as belonging to an abnormal IA exposure category). The probability of abnormal IA exposure was assessed as unlikely for 5% (n = 2), possible for 40% (n = 16), likely for 45% (n = 18), and very likely for 10% (n = 4) of the selected forty floors or sections of the buildings. In the likely and very likely categories, these floors or sections had wide moisture and mould damage in their structures together with air leaks from damaged materials to the IA and often had a detected MMVF source in the ventilation system as well as ventilation deficiencies (Table 2 and criteria in Table 1). These categories also had other impurity sources (Table 1), but moisture and mould damage in the building structures were dominant. The higher (more abnormal) the assessed category of probability of abnormal IA exposure, the more insufficient the ventilation was, the more often the lifespan of the ventilation system was exceeded and the more often MMVF sources were detected in the ventilation system from the categories likely and very likely (and not from unlikely category) (Table 2).
The perceived weekly work environment-related symptoms among the employees exceeded the corresponding number of weekly work environment-related symptoms in FIOH’s reference data [28,29] (Figure 2). Even in premises in which the building research showed no source of contamination, some employees perceived weekly symptoms more than those in FIOH’s reference data [28,29] (Figure 3). An analysis of the differences between the probability of abnormal IA exposure categories (unlikely, possible, likely, very likely) and the employees’ weekly perceived work environment-related symptoms (headaches, concentration difficulties, irritation of the eyes and nose, irritation of the skin on the face and hands, hoarse throat, coughing, coughing at night, shortness of breath, wheezing, fever or chills, joint pain, and muscular pain revealed no statistically significant differences (Table 3).
As regards the IA questionnaire results, most of the employees (88%) felt that their work was often stimulating and interesting, 74% believed they would receive help from their colleagues if needed, 21% often had the opportunity to influence their own work and working conditions, and 53% had no feelings of stress. A heavy workload was reported by 14% of the employees, which is below FIOH’s reference value [28]. Stress was reported by 16% of the employees and 4% believed that they would not get help from colleagues if needed. Stress and lack of help from colleagues were perceived more often than in FIOH’s comparable reference data [28]. Stress was perceived more often than in FIOH’s reference data in every category of abnormal IA exposure (Table 4). Most often, stress was perceived in premises in which the probability of abnormal IA exposure was estimated as being unlikely (Table 4). An analysis of the differences between the probability of abnormal IA exposure categories (unlikely, possible, likely, very likely) and the employees’ perceived psychosocial work environment and stress revealed no statistically significant differences.
In addition, an analysis of the differences between the probability of abnormal IA exposure categories’ (unlikely, possible, likely, very likely) and the employees’ group-level health information (obtained from OHS) revealed no statistically significant differences. However, the more abnormal the probability of the IA exposure category, the more employees contacted OHS due to IAQ-related issues from the categories possible, likely and very likely (Table 5).
The results show a statistical association between detected MMVF sources in ventilation systems and perceived work environment-related symptoms and a statistical association between ventilation system age and perceived work environment-related symptoms (Table 6). The hospital’s multiprofessional IA group estimated the duration of the IAQ problem solution process on every building floor or in each section, and the attempts to solve the indoor air problems in the unlikely, possible, likely, and very likely categories had lasted a year or more (Table 7). The hospital’s multiprofessional IA group also estimated ‘No IAQ problems’ in premises in which the research group had assessed the probability of abnormal IA exposure as being possible and likely (Table 7).
For each building floor or section, we looked at all the collected data (results of assessed probability of abnormal IA exposure, IA questionnaires results, group-level health information and IA group information) at the same time. The most urgent measures were required for floors or sections on/in which the probability of abnormal IA exposure was likely or very likely, the health information (Table 5) and IA questionnaire results (Figure 3a–d) indicated health problems, and solutions were delayed (Table 7).

4. Discussion

The detailed examination of the buildings and the four-level categorisation of the probability of abnormal IA exposure made it easier to organise the outcomes and obtain a clear picture of the many factors affecting the IAQ of the buildings and premises. The strength of our research was its multiprofessional approach, which took into account the employees’ perceived work environment-related symptoms and health information, multiprofessional IA group information and the results of the technical building investigations.
According to previous studies, observed indoor mould and moisture damage indicates an increased health risk, and the greater the mould and moisture damage, the more prevalent respiratory symptoms in adults [11]. This study found no statistically significant differences between the four-level categories and employees’ perceived work environment-related symptoms, perceived psychosocial environment, or OHS group-level information on employees’ health. However, extensive impurity sources in the premises increased some employees’ perceived work-related symptoms. Our earlier study [31] shows that all the symptoms perceived by the employees were very similar to the work-related symptoms examined in this study. The results showed a statistical association between MMVF sources in ventilation systems and perceived IAQ and work environment-related symptoms. Other studies have achieved similar results [5,14]. In addition, the age of the ventilation system was associated with perceived symptoms. The more the probability of abnormal IA exposure was estimated to differ, the more prevalent were ventilation system deficiencies and the MMVF sources in the ventilation system. Therefore, IAQ problems were usually affected by impurities from both the building and ventilation, which shows that many IAQ factors can affect perceived symptoms.
Employees perceived more work environment-related symptoms and stress and lack of social support from colleagues than those reported in FIOH’s comparative data from (damaged and nondamaged) hospital buildings, a result which may be related to the poor condition of the buildings or other factors affecting the human experience. On the other hand, the amount of employee contact with OHS increased due to IAQ and work environment-related issues in all the categories of the probability of abnormal IA exposure. An earlier study has shown an association between symptoms and work strain [21], the psychosocial work environment [4,32], and individual factors (e.g., gender, age) [21,33]. The risk of experiencing the workplace as harmful has shown to be higher among employees who report mould problems than those who report ventilation problems in workplaces [34].
In our research, symptoms were common, stress was high, and the amount of contact with OHS in IAQ and work environment-related issues was great on floors or in sections in which the category of abnormal IA exposure was assessed as being unlikely and building floors or sections that were undamaged. Workers in non-damaged buildings have also shown to have IAQ and work environment-related symptoms [29,33]. Overall, the employees perceived stress in every category of abnormal IA exposure more than the amount reported in FIOH’s reference data [28]. On the other hand, the employees often perceived their work as stimulating and interesting in all categories of the probability of abnormal IA exposure. An earlier study has also shown that hospital employees find their work more interesting and stimulating than office workers [28,32]. As the buildings and the factors affecting IAQ have been carefully studied, the building technology and IAQ alone may not explain the prevalence of the perceived work environment-related symptoms and the stress and the amount of IAQ- and work environment-related contact with OHS. These issues may also be partly affected by other factors influencing human experience, such as work-related and organizational factors not investigated in this study, or individual human factors.
Based on the IA group’s information, attempts to solve the indoor air problems in several buildings had lasted more than a year. The IA group’s evaluation of no IAQ problems in the premises often contradicted our building investigation results. One reason for these prolonged problem-solving processes may be that building-related problems or impurity sources have been unclear or building investigations incomplete. An earlier study also had similar findings [4]. Prolonged or unclear problem-solving processes may have increased health concerns and distrust of the problem-solving process and influenced the IAQ-related experience of employees. Thus, careful decision-making procedures are important, especially when people feel threatened by IAQ-related risks [34].
The employees did not know the results of the assessment of the probability of abnormal IA exposure prior to responding to the IA questionnaires, which contributes to the reliability of the study. The differences between previous studies and our research results may result from differences in the building research methods. Many studies are based on observations of visible damage or indications of damage, and hidden damage has remained unclear [11]. Our study was very detailed, and we also investigated hidden damage, in addition other pollutant sources. Possible limitations of our research may be that our data concerned only a small number of buildings with no IAQ problems or impurities affecting IAQ, which may have affected data distribution. Due to this, we had no reliable comparison survey of damaged and nondamaged buildings or premises. The method for assessing the probability of abnormal IA exposure is very pragmatic and is always based on strong technical expertise in building technology and IAQ. In addition, the criteria for the probability of abnormal IA exposure recommend taking into account many impurity sources in a building, based on national instructions, regulations and limit values in the field of the built environment and IAQ. However, the assessment also involves a researcher’s subjective view. OHS’ information was collected at group-level, and as the results were analysed categorically, they may not have provided sufficiently accurate results. In addition, the questions concerning the psychosocial work environment were quite limited in the IA questionnaire. They covered qualitative and quantitative workload, opportunities to influence one’s working conditions, and social support at work. Although these are essential factors in the light of the stress theory, they fail to provide a comprehensive picture of the psychosocial work environment. The questionnaire did not include, for instance, factors such as organizational changes and questions concerning leadership.
The probability of abnormal IA exposure provides us with a holistic picture of the many factors affecting the IAQ of buildings and premises. In this case, the most urgent measures could have been identified more easily and holistically. Moreover, in the premises that needed the most urgent repairs, employee contact with OHS was increased, and the employees’ perceived work environment-related symptoms indicated poor IAQ. On the other hand, in the premises in which no technical problems were found, the employees still perceived more work environment-related symptoms and stress than those reported in FIOH’s reference data. Thus, IAQ problems should always be analysed from many perspectives; (i) the building’s technical condition, (ii) perceived IAQ and psychosocial work environment, (iii) OHS information, and (iv) measures for solving IAQ problems, which may all affect the experience of IAQ problems. Indoor air questionnaires can serve as a parallel method with technical investigations in the building.

5. Conclusions

The four-level categorisation of the probability of abnormal IA exposure provides a comprehensive and systematic way of ranking building sectors from the perspective of building health. The method is based on national instructions for building and ventilation investigations, building codes, and limit values, and is therefore systematic and partially established. Thus, it can be applied in different environments. The method may also be used in other countries (with similar environments to that in Finland), if the national instructions, limit values, and building codes are taken into account and applied. The method enabled the holistic identification of the most urgent measures. This may help property owners allocate resources for proper repairs and also help OHS identify employees’ IAQ and work environment-related symptoms. The results suggest that the extensive impurity source in premises does not always associate with the prevalence of perceived IAQ and work environment-related symptoms. Therefore, the solution to the IAQ problem is more specific when technical survey results, the health and experience information of the users of the premises, as well as the problem solution process are taken into account. The results also suggest that IA questionnaires alone cannot determine the urgency of the measures required. Possible limitations of our research are that the study was only conducted in hospital buildings and premises. Limitations may be that our data concerned only a small number of buildings with no IAQ problems or impurities affecting IAQ: this may have affected data distribution. The method for assessing the probability of abnormal IA exposure is, however, very pragmatic and always based on strong technical expertise in building technology and IAQ. Further studies should assess the probability of abnormal IA exposure in different work environments (e.g., offices), and the associations between the probability of abnormal IA exposure categories with perceived IAQ and the health of employees. They should also assess the impact of the IAQ solution process perceived IAQ. The results of further studies may possibly validate the method.

Author Contributions

K.T. wrote the paper and analysed the data; S.L. and K.K. contributed to the study design and data analysis and participated in writing the paper; M.L. contributed to the data analyses and participated in writing the paper; H.S. was the principal supervisor of the work and participated in writing the paper.

Funding

This research received no external funding.

Acknowledgments

The authors acknowledge the contribution of Leena Aalto, Veli-Matti Pietarinen; Ulla-Maija Hellgren, Jouko Remes and Pauliina Toivio and all co-workers in building research.

Conflicts of Interest

The authors declare no conflict of interest.

Abbreviations

The following abbreviations are used in this manuscript:
FIOHFinnish Institute of Occupational Health
IAIndoor air
IAQIndoor air quality
OHSOccupational health service
PAHPolycyclic aromatic hydrocarbon
VOCVolatile organic compound

References

  1. Frontczak, M.; Wargocki, P. Literature survey on how different factors influence human comfort in indoor environments. Build. Environ. 2011, 46, 922–937. [Google Scholar] [CrossRef]
  2. WHO. Dampness and Mould—Who Guidelines for Indoor Air Quality; World Health Organisation: Geneva, Switzerland, 2009. [Google Scholar]
  3. Lappalainen, S.; Lahtinen, M.; Palomaki, E.; Korhonen, P.; Niemelä, R.; Reijula, K. Comprehensive procedure for solving indoor environment problems. In Proceedings of the NAM Nordic Work Environment Meeting, Espoo, Finland, 31 August–2 September 2009; p. 93. [Google Scholar]
  4. Lahtinen, M.; Huuhtanen, P.; Kahkonen, E.; Reijula, K. Psychosocial dimensions of solving an indoor air problem. Indoor Air 2002, 12, 33–46. [Google Scholar] [CrossRef] [PubMed]
  5. Salonen, H.; Lappalainen, S.; Riuttala, H.; Tossavainen, A.; Pasanen, P.; Reijula, K. Man-made vitreous fibers in office buildings in the helsinki area. J. Occup. Environ. Hyg. 2009, 6, 624–631. [Google Scholar] [CrossRef] [PubMed]
  6. Sundell, J.; Levin, H.; Nazaroff, W.W.; Cain, W.S.; Fisk, W.J.; Grimsrud, D.T.; Gyntelberg, F.; Li, Y.; Persily, A.K.; Pickering, A.C.; et al. Ventilation rates and health: Multidisciplinary review of the scientific literature. Indoor Air 2011, 21, 191–204. [Google Scholar] [CrossRef] [PubMed]
  7. Wolkoff, P.; Wilkins, C.K.; Clausen, P.A.; Nielsen, G.D. Organic compounds in office environments—Sensory irritation, odor, measurements and the role of reactive chemistry. Indoor Air 2006, 16, 7–19. [Google Scholar] [CrossRef] [PubMed]
  8. Airaksinen, M.; Pasanen, P.; Kurnitski, J.; Seppänen, O. Microbial contamination of indoor air due to leakages from crawl space: A field study. Indoor Air 2004, 14, 55–64. [Google Scholar] [CrossRef] [PubMed]
  9. Nevalainen, A.; Täubel, M.; Hyvärinen, A. Indoor fungi: Companions and contaminants. Indoor Air 2015, 25, 125–156. [Google Scholar] [CrossRef]
  10. Nordström, K.; Norbäck, D.; Akselsson, R. Effect of air humidification on the sick building syndrome and perceived indoor air quality in hospitals: A four month longitudinal study. Occup. Environ. Med. 1994, 51, 683–688. [Google Scholar] [CrossRef]
  11. Mendell, M.J.; Kumagai, K. Observation-based metrics for residential dampness and mold with dose–response relationships to health: A review. Indoor Air 2017, 27, 506–517. [Google Scholar] [CrossRef]
  12. Hellgren, U.-M.; Hyvärinen, M.; Holopainen, R.; Reijula, K. Perceived indoor air quality, air-related symptoms and ventilation in finnish hospitals. Int. J. Occup. Med. Environ. Health 2011, 24, 48–56. [Google Scholar] [CrossRef]
  13. Redlich, C.; Sparer, J.; Cullen, M.R. Sick-building syndrome. Lancet 1997, 349, 1013–1016. [Google Scholar] [CrossRef]
  14. Schneider, T. Dust and fibers as a cause of indoor environment problems. Scand. J. Work. Environ. Health 2008, 33, 10–17. [Google Scholar]
  15. Milton, D.K.; Glencross, P.M.; Walters, M.D. Risk of sick leave associated with outdoor air supply rate, humidification, and occupant complaints. Indoor Air 2000, 10, 212. [Google Scholar] [CrossRef] [PubMed]
  16. Cox-Ganser, J.; Rao, C.; Park, J.; Schumpert, J.; Kreiss, K. Asthma and respiratory symptoms in hospital workers related to dampness and biological contaminants. Indoor Air 2009, 19, 280–290. [Google Scholar] [CrossRef] [PubMed]
  17. Mendell, M.; Brennan, T.; Lee, H.; Odom, J.D.; Offerman, F.J.; Turk, B.H.; Wallingford, K.M.; Diamond, R.C.; Fisk, W.J. Causes and prevention of symptom complaints in office buildings. Facilities 2006, 24, 436–444. [Google Scholar] [CrossRef]
  18. Sauni, R.; Verbeek, J.H.; Uitti, J.; Jauhiainen, M.; Kreiss, K.; Sigsgaard, T. Remediating buildings damaged by dampness and mould for preventing or reducing respiratory tract symptoms, infections and asthma. Cochrane Database Syst. Rev. 2015, 76, 1. [Google Scholar] [CrossRef] [PubMed]
  19. Wargocki, P.; Lagercrantz, L.; Witterseh, T.; Sundell, J.; Wyon, D.P.; Fanger, P.O. Subjective perceptions, symptom intensity and performance: A comparison of two independent studies, both changing similarly the pollution load of an office. Indoor Air 2002, 12, 74. [Google Scholar] [CrossRef]
  20. Brauer, C.; Mikkelsen, S. The influence of individual and contextual psychosocial work factors on the perception of the indoor environment at work: A multilevel analysis. Int. Arch. Occup. Environ. Health 2010, 83, 639–651. [Google Scholar] [CrossRef]
  21. Magnavita, N. Work-related symptoms in indoor environments: A puzzling problem for the occupational physician. Int. Arch. Occup. Environ. Health 2015, 88, 185–196. [Google Scholar] [CrossRef]
  22. Finell, E.; Haverinen-Shaughnessy, U.; Tolvanen, A.; Laaksonen, S.; Karvonen, S.; Sund, R.; Saaristo, V.; Luopa, P.; Ståhl, T.; Putus, T.; et al. The associations of indoor environment and psychosocial factors on the subjective evaluation of indoor air quality among lower secondary school students: A multilevel analysis. Indoor Air 2017, 27, 329–337. [Google Scholar] [CrossRef]
  23. Lahtinen, M.; Lappalainen, S.; Reijula, K. Multiprofessional teams resolving indoor-air problems-emphasis on the psychosocial perspective. Scand. J. Work. Environ. Health 2008, 34, 30–34. [Google Scholar]
  24. Carrer, P.; Wolkoff, P. Assessment of indoor air quality problems in office-like environments: Role of occupational health services. Int. J. Environ. Res. Public Health 2018, 15, 741. [Google Scholar] [CrossRef] [PubMed]
  25. Tähtinen, K.; Lappalainen, S.; Karvala, K.; Remes, J.; Salonen, H. Association between four-level categorisation of indoor exposure and perceived indoor air quality. Int. J. Environ. Res. Public Health 2018, 15, 679. [Google Scholar] [CrossRef] [PubMed]
  26. Finnish Ministry of the Environment, Department of Built Environment. D2 the National Building Code of Finland, Health. Indoor Climate and Ventilation of Buildings, Regulations and Guidelines; Department of Built Environment: Helsinki, Finland, 2012.
  27. Andersson, K. Epidemiological approach to indoor air problems. Indoor Air 1998, 8, 32–39. [Google Scholar] [CrossRef]
  28. Hellgren, U.-M.; Palomaki, E.; Lahtinen, M.; Riuttala, H.; Reijula, K. Complaints and symptoms among hospital staff in relation to indoor air and the condition and need for repairs in hospital buildings. Scand. J. Work Environ. Health 2008, 34, 58–63. [Google Scholar]
  29. Reijula, K.; Sundman-Digert, C. Assessment of indoor air problems at work with a questionnaire. Occup. Environ. Med. 2004, 61, 33–38. [Google Scholar] [PubMed]
  30. Elo, A.-L.; Leppänen, A.; Jahkola, A. Validity of a single-item measure of stress symptoms. Scand. J. Work Environ. Health 2003, 29, 444–451. [Google Scholar] [CrossRef] [Green Version]
  31. Tähtinen, K.; Lappalainen, S.; Karvala, K.; Salonen, H. A comprehensive approach to evaluating the urgency of iaq measures. In Proceedings of the 15th Conference of the International Society of Indoor Air Quality & Climate (ISIAQ), Philadelphia, PA, USA, 22–27 July 2018. [Google Scholar]
  32. Lahtinen, M.; Sundman-Digert, C.; Reijula, K. Psychosocial work environment and indoor air problems: A questionnaire as a means of problem diagnosis. Occup. Environ. Med. 2004, 61, 143. [Google Scholar] [CrossRef]
  33. Bakke, J.; Moen, B.; Wieslander, G.; Norbäck, D. Gender and the physical and psychosocial work environments are related to indoor air symptoms. J. Occup. Environ. Med. 2007, 49, 641–650. [Google Scholar] [CrossRef]
  34. Finell, E.; Seppälä, T. Indoor air problems and experiences of injustice in the workplace: A quantitative and a qualitative study. Indoor Air 2018, 28, 125–134. [Google Scholar] [CrossRef]
Figure 1. Process for assessing the probability of abnormal indoor air (IA) exposure [25].
Applsci 09 00099 g001
Figure 2. In the buildings assessed for probability of abnormal IA exposure, weekly work environment-related symptoms (n = 1558) were perceived more often than in the Finnish Institute of Occupational Health’s (FIOH) comparable reference data [28].
Applsci 09 00099 g002
Figure 3. Perceived work environment-related symptoms of users of premises in assessment of probability of abnormal IA exposure categories, compared to FIOH reference data [28] (a) unlikely (n = 61), (b) possible (n = 618), (c) likely (n = 760), (d) very likely (n = 118).
Applsci 09 00099 g003
Table 1. Main criteria and categories for assessing probability of abnormal IA exposure in buildings.
CategoriesMain Criteria for Assessing Probability of Abnormal IA Exposure in Buildings.
UnlikelyNo moisture or mould damage in structures. No air leaks from or through damaged structures. Ventilation system can be controlled by indoor pressure difference from the building envelope. Room acoustic materials and ventilation system have no man-made vitreous fibres (MMVF) sources. Indoor air quality corresponds to national reference values and guidelines set for the premises.
PossibleMould-damaged structure type is not widespread in building and repairs are easily definable (less than 1 m2). A few or single air leaks from or through damaged structures or from surrounding premises. Room acoustic materials or ventilation system have MMVF sources and fibres may end up in the indoor air or on surfaces.1 Concrete floor has extensive moisture, which can cause water vapour damage to permeable floor coating (emissions).1 Indoor air quality does not correspond to national reference values or the guidelines set for the premises, and an indoor air impurity source has been identified.1
LikelyBuilding or premises have widespread mould-damaged structure. Repairs are significant and affect a large part of the (one) structure of the building or premises, e.g., whole base floor structure. There is recurrent damage in the type of structure. Air leaks from or through damaged structures or from surrounding premises and moisture or mould-damaged materials are regular and recurrent in the structure, occasionally there is negative pressure in the premises and/or air-tightness is risky. Indoor air quality does not correspond to national reference values or the guidelines set for the premises, and an indoor air impurity source has been identified.1 Creosote has been used in the structure and air leaks into the indoor air from the structure. There is also a notable smell of creosote (e.g., naphthalene) in the indoor air.1
Very likelyThe building or premises has a great deal of extensive mould damage in several structures. The extent of repairs is significant and affects several structures in the building or premises e.g., whole façade and whole base floor. There is recurrent damage in the type of the structures. Air leaks from or through damaged structures are regular and recurrent, negative pressure is significant in the premises and/or air-tightness is very risky. Indoor air quality does not correspond to national reference values or the guidelines set for the premises, and an indoor air impurity source has been identified.1 Creosote has been used in the structures and air leaks into the indoor air from the structures. In addition, concentrations of polycyclic aromatic hydrocarbons (PAH) or separate components exceed the set national values and guidelines.1 Dust sample tests have found asbestos fibres in the premises, and the pollution source has been defined.1 Indoor radon concentrations exceed the set national values and guidelines (400 Bq/m3 [26]).1
1 The assessment must take into account the extent and impact of the problem and impurity source.
Table 2. Ventilation survey findings are included in all the sections or floors in which probability of abnormal IA exposure was assessed (95 floors or sections). (All building floors or sections (111) were investigated and we were able to assess the probability of abnormal IA exposure on or in 95 building floors or sections.).
Assessed Probability of Abnormal IA Exposure on/in Building Floors or Sections
(n = 95)
Lifespan of Ventilation System Had Been Exceeded
n (%)
Insufficient Ventilation
n (%)
MMVF (Man-Made Vitreous Fibres) Source in Ventilation System
n (%)
Moisture Problem in Ventilation System
n (%)
Unlikely (n = 7)7 (100)3 (43)3 (43)0 (0)
Possible (n = 39)23 (59)22 (56)12 (31)6 (15)
Likely (n = 37)26 (70)24 (65)26 (70)15 (41)
Very likely (n = 12)10 (83)9 (75)9 (75)1 (8)
Table 3. An analysis of the differences between the probability of abnormal IA exposure categories (unlikely, possible, likely, very likely) and the employees’ weekly perceived work environment-related symptoms.
Variable (Weekly Symptoms)Unlikely 1
n = 2
(p-Value)
Possible 2
n = 16
(p-Value)
Likely 3
n = 18
(p-Value)
Very Likely 4
n = 4
Fatigue1 vs. 2 (0.673)2 vs. 3 (0.220)3 vs. 4 (0.609)
1 vs. 3 (0.257)2 vs. 4 (0.570)
1 vs. 4 (0.355)
Headache1 vs. 2 (0.778)2 vs. 3 (0.157)3 vs. 4 (0.481)
1 vs. 3 (0.208)2 vs. 4 (0.777)
1 vs. 4 (0.643)
Concentration difficulties1 vs. 2 (0.672)2 vs. 3 (0.233)3 vs. 4 (1.000)
1 vs. 3 (0.165)2 vs. 4 (0.507)
1 vs. 4 (0.064)
Irritation of the eyes1 vs. 2 (0.888)2 vs. 3 (0.262)3 vs. 4 (0.125)
1 vs. 3 (0.378)2 vs. 4 (0.777)
1 vs. 4 (0.814)
Irritation of the nose1 vs. 2 (0.779)2 vs. 3 (0.073)3 vs. 4 (0.061)
1 vs. 3 (0.130)2 vs. 4 (0.925)
1 vs. 4 (0.643)
Hoarse, dry throat1 vs. 2 (0.399)2 vs. 3 (0.101)3 vs. 4 (0.061)
1 vs. 3 (0.130)2 vs. 4 (0.508)
1 vs. 4 (1.000)
Coughing1 vs. 2 (0.481)2 vs. 3 (0.147)3 vs. 4 (0.287)
1 vs. 3 (0.378)2 vs. 4 (0.636)
1 vs. 4 (0.355)
Coughing at night1 vs. 2 (0.941)2 vs. 3 (0.652)3 vs. 4 (0.237)
1 vs. 3 (0.792)2 vs. 4 (0.289)
1 vs. 4 (0.411)
Irritation of skin on face1 vs. 2 (0.260)2 vs. 3 (0.133)3 vs. 4 (0.551)
1 vs. 3 (1.000)2 vs. 4 (0.508)
1 vs. 4 (1.000)
Irritation of skin on hands1 vs. 2 (0.888)2 vs. 3 (0.152)3 vs. 4 (0.349)
1 vs. 3 (0.378)2 vs. 4 (0.705)
1 vs. 4 (1.000)
Shortness of breath1 vs. 2 (0.562)2 vs. 3 (0.508)3 vs. 4 (0.663)
1 vs. 3 (0.509)2 vs. 4 (0.502)
1 vs. 4 (0.355)
Wheezing1 vs. 2 (0.374)2 vs. 3 (0.342)3 vs. 4 (0.275)
1 vs. 3 (0.178)2 vs. 4 (0.600)
1 vs. 4 (0.480)
Fever or chills1 vs. 2 (0.352)2 vs. 3 (0.308)3 vs. 4 (1.000)
1 vs. 3 (0.736)2 vs. 4 (0.562)
1 vs. 4 (0.623)
Muscular pain1 vs. 2 (1.000)2 vs. 3 (0.161)3 vs. 4 (0.932)
1 vs. 3 (0.44)2 vs. 4 (0.298)
1 vs. 4 (1.000)
Joint pain1 vs. 2 (0.324)2 vs. 3 (0.283)3 vs. 4 (0.898)
1 vs. 3 (0.900)2 vs. 4 (0.570)
1 vs. 4 (0.643)
Other work environment-1 vs. 2 (0.176)2 vs. 3 (0.099)3 vs. 4 (0.831)
related symptoms1 vs. 3 (0.074)2 vs. 4 (0.288)
1 vs. 4 (0.060)
Statistically significant level of p < 0.05.
Table 4. Perceived psychosocial work environment and stress according to probability of abnormal IA exposure categories (unlikely, possible, likely, very likely).
Question on Psychosocial Work EnvironmentUnlikely
n = 61
(%)
Possible
n = 619
(%)
Likely
n = 763
(%)
Very Likely
n = 118
(%)
FIOH’s Reference Value
%
Do you regard your work as interesting and stimulating?
Yes, often52 (88.1)540 (87.5)684 (89.9)102 (86.4)82
Yes, sometimes7 (11.9)66 (10.7)61 (8.0)11 (9.3)16
No, seldom or rarely0 (0)11 (1.8)16 (2.0)5 (4.2)0
Do you have too much work?
Yes, often12 (20.7)95 (15.5)98 (12.9)15 (12.7)20
Yes, sometimes36 (62.1)360 (58.7)489 (64.4)71 (60.2)64
No, seldom or rarely10 (17.2)158 (25.8)172 (22.7)32 (27.1)16
Do you have opportunities to influence your working conditions?
Yes, often38 (32.8)120 (19.5)161 (21.2)38 (32.8)21
Yes, sometimes61 (52.6)335 (54.3)379 (49.9)61 (52.6)51
No, seldom or rarely17 (14.7)162 (26.3)220 (29.0)17 (14.7)28
Do your fellow workers help you with work-related problems?
Yes, often33 (55.9)463 (75.2)569 (74.8)83 (70.3) 79
Yes, sometimes24 (40.7)129 (20.9)171 (22.5)28 (23.7)19
No, seldom or rarely2 (3)24 (3.9)21 (2.8)7 (5.9)2
Do you feel stress?
Quite a lot or very much15 (26.3)92 (15.1)105 (15.0)16 (14.0)10
Some12 (21.1)181 (29.7)243 (32.4)40 (35.1)28
Not at all or just a little 30 (52.6)337 (55.2)403 (53.7)58 (50.9)63
Table 5. IAQ-related group-level health information on employees (obtained from OHS), according to building floors or sections in which probability of abnormal IA exposure categories (unlikely, possible, likely, very likely) were assessed.
IAQ-Related Health InformationUnlikely
n = 2
(%)
Possible
n = 16
(%)
Likely
n = 20
(%)
Very likely
n = 5
(%)
Some employees have new asthma or aggravation of previous asthma 1
Yes2 (100)5 (31)5 (25)3 (60)
No0 (0)10 (63)14 (70)2 (40)
No information0 (0)1 (6)1 (5)0 (0)
Some employees have changed work premises or work places due to IAQ-related symptoms 1
Yes1 (50)4 (25)4 (20)2 (40)
No1 (50)11 (69)16 (80)3 (60)
No information0 (0)1 (6)0 (0)0 (0)
The amount of employee contacts with OHS due to IAQ-related issues has increased 1
Yes2 (100)5 (31)10 (50)3 (60)
No0 (0)10 (63)10 (50)2 (40)
No information0 (0)1 (6)0 (0)0 (0)
The amount of sickness absence due to respiratory symptoms has increased 1
Yes1 (50)4 (25)8 (40)1 (20)
No0 (0)7 (44)11 (55)3 (60)
No information1 (50)5 (31)1 (5)1 (20)
1 Group-level health information does not contain information on how many employees have IAQ-related health symptoms on building floors or in sections or the assessed categories. IAQ: indoor air quality; OHS: occupational health services.
Table 6. Statistical significance of differences (p-value) between weekly reported work environment-related symptoms and ventilation factors (yes/no) studied.
Perceived Work Environment-Related Symptoms WeeklyRespondents N = 1558
n
Technical Lifespan of Ventilation System Had Been ExceededMoisture Problem in Ventilation SystemMMVF Source in Ventilation SystemInsufficient Ventilation or Ventilation System Did Not Match Purposes of Facilities
Fatigue532NSNS0.005NS
Headache 2660.035NS0.002NS
Concentration difficulties1640.049NS0.005NS
Irritation of the eyes5590.014NS0.006NS
Irritation of the nose6560.003NS0.001NS
Hoarse, dry throat4750.001NS0.0010.025
Coughing2250.016NS0.022NS
Coughing at night500.008NSNSNS
Irritation of skin on face373NSNSNSNS
Irritation of skin on hands5080.035NS0.003NS
Shortness of breath640.045NSNSNS
Wheezing320.001NSNS0.044
Fever or chills42NSNSNSNS
Muscular pain1600.027NS0.003NS
Joint pain1930.039NSNSNS
Other work environment-related symptoms750.005NS0.0010.027
NS: not significant. Statistically significant level of p < 0.05.
Table 7. Estimated duration of IAQ problems on each building floor or in each section studied.
Estimated Duration of IAQ Problems: Number of CasesUnlikely
(n = 2)
Possible
(n = 16)
Likely
(n = 18)
Very Likely
(n = 4)
No IAQ problems1760
Duration of IAQ problems less than a year0240
Duration of IAQ problems one year or more1784

