Experimental Investigation of the Creep Behaviour of Coal by Monitoring Changes of Acoustic Properties


Abstract
:1. Introduction
2. Experimental Procedures
3. Results and Discussion
3.1. Creep Behaviour of Coal
3.2. Changes in Acoustic Wave Properties
4. Implications and Future Work
5. Conclusions
- (1)
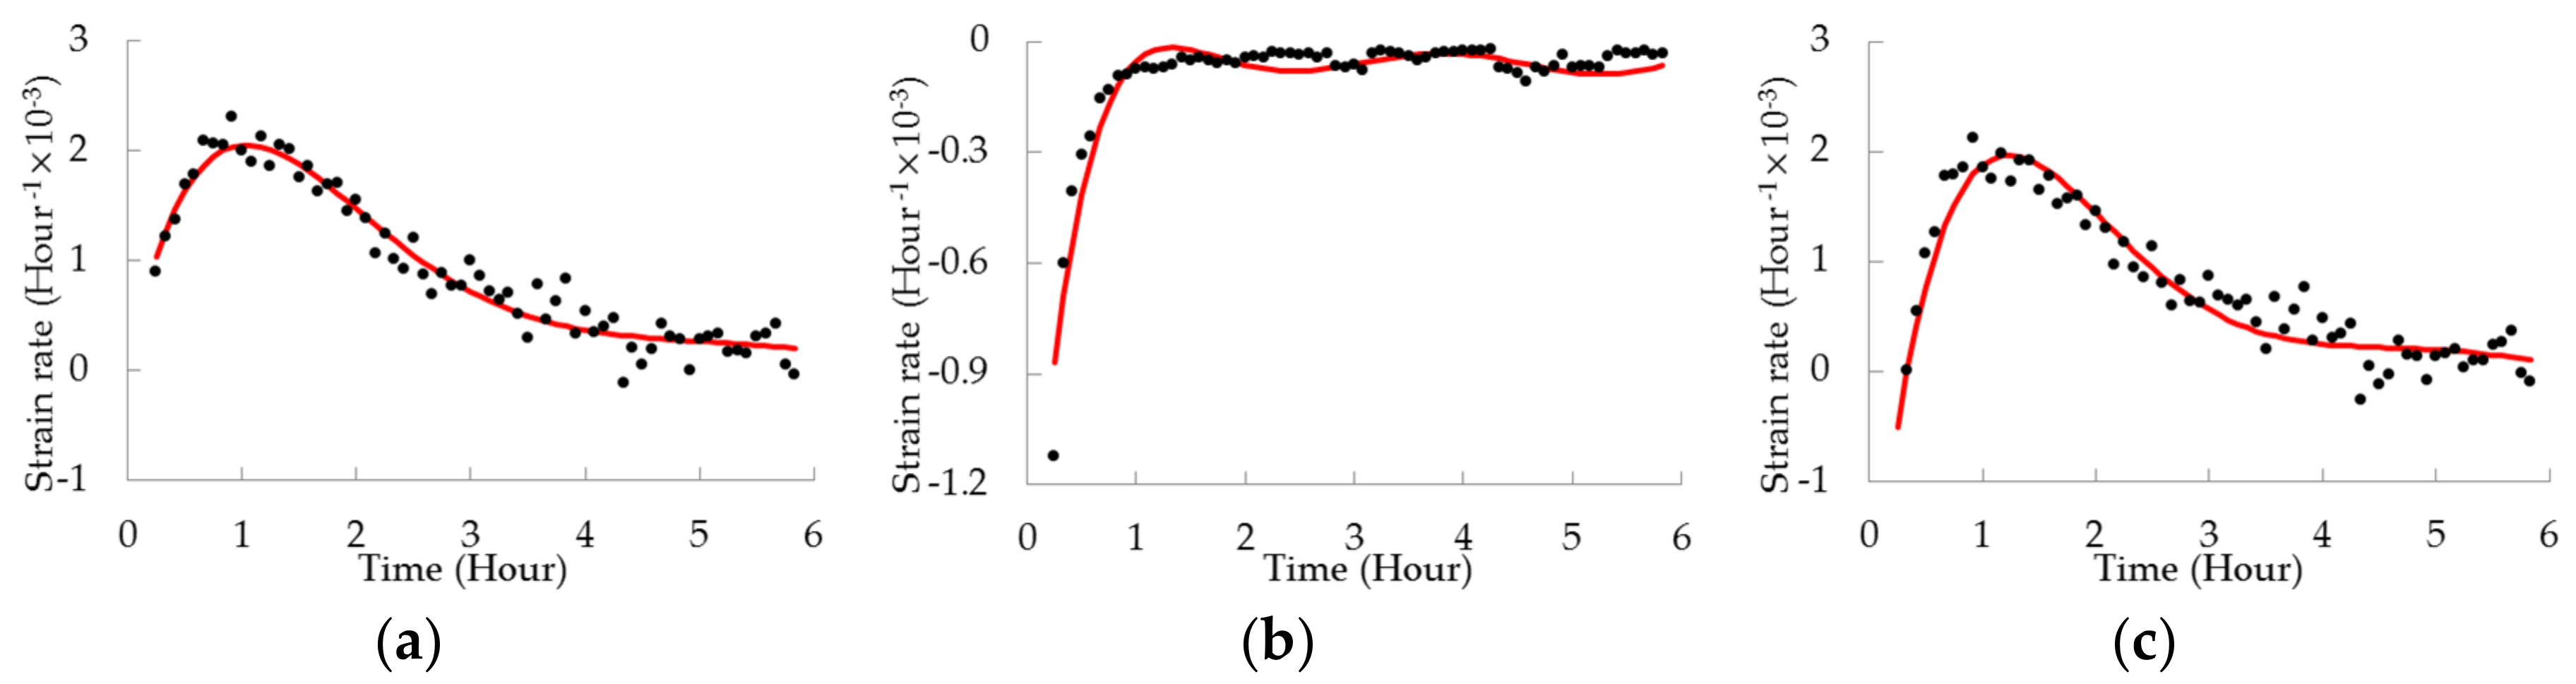
- The pronounced inhomogeneity of coal induces considerable irregularities in creep strain data collected during the increase of stress level. These flawed data highlight the shortcomings of conventional strain–time relationship experiments for deciphering the mechanisms that control creep.
- (2)
- The mechanical response of samples under creep compression is a result of competition between compaction and cracking, in which the cracking deteriorates the structure and increases the ultrasonic attenuation, whilst the compaction causes the densification along axial axis and reduces attenuation.
- (3)
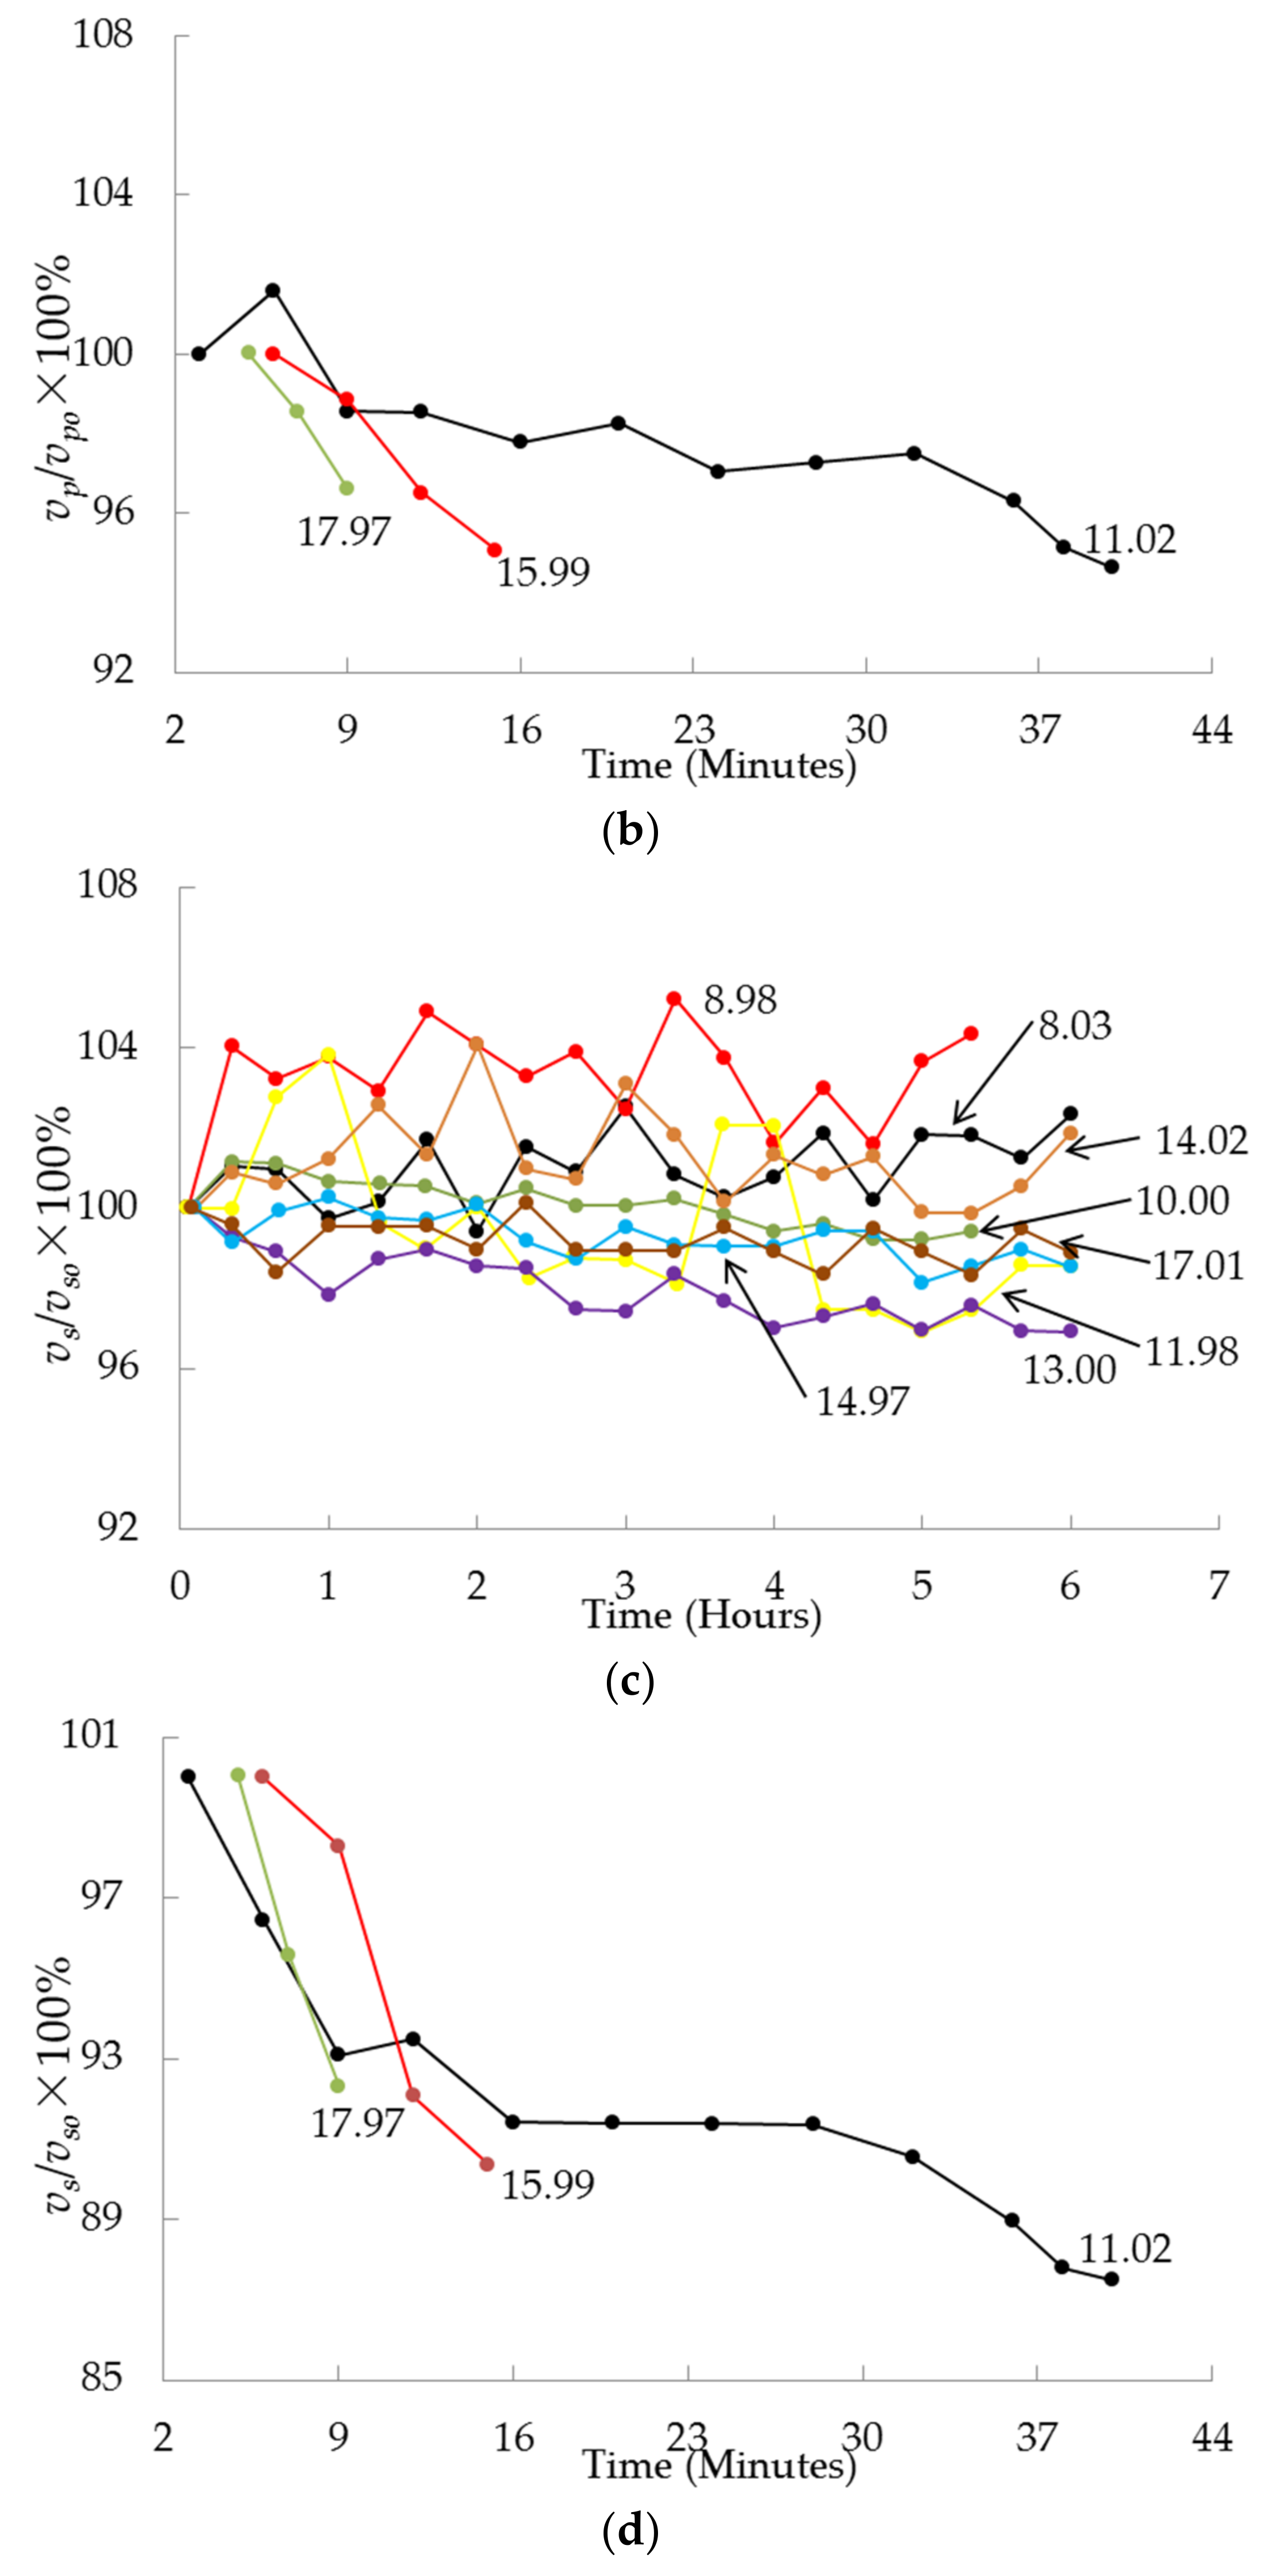
- Long-term creep involves multiple structural deformations that alter the internal structure of sample, thus resulting in fluctuation of the ultrasonic velocities and the dynamic moduli.
- (4)
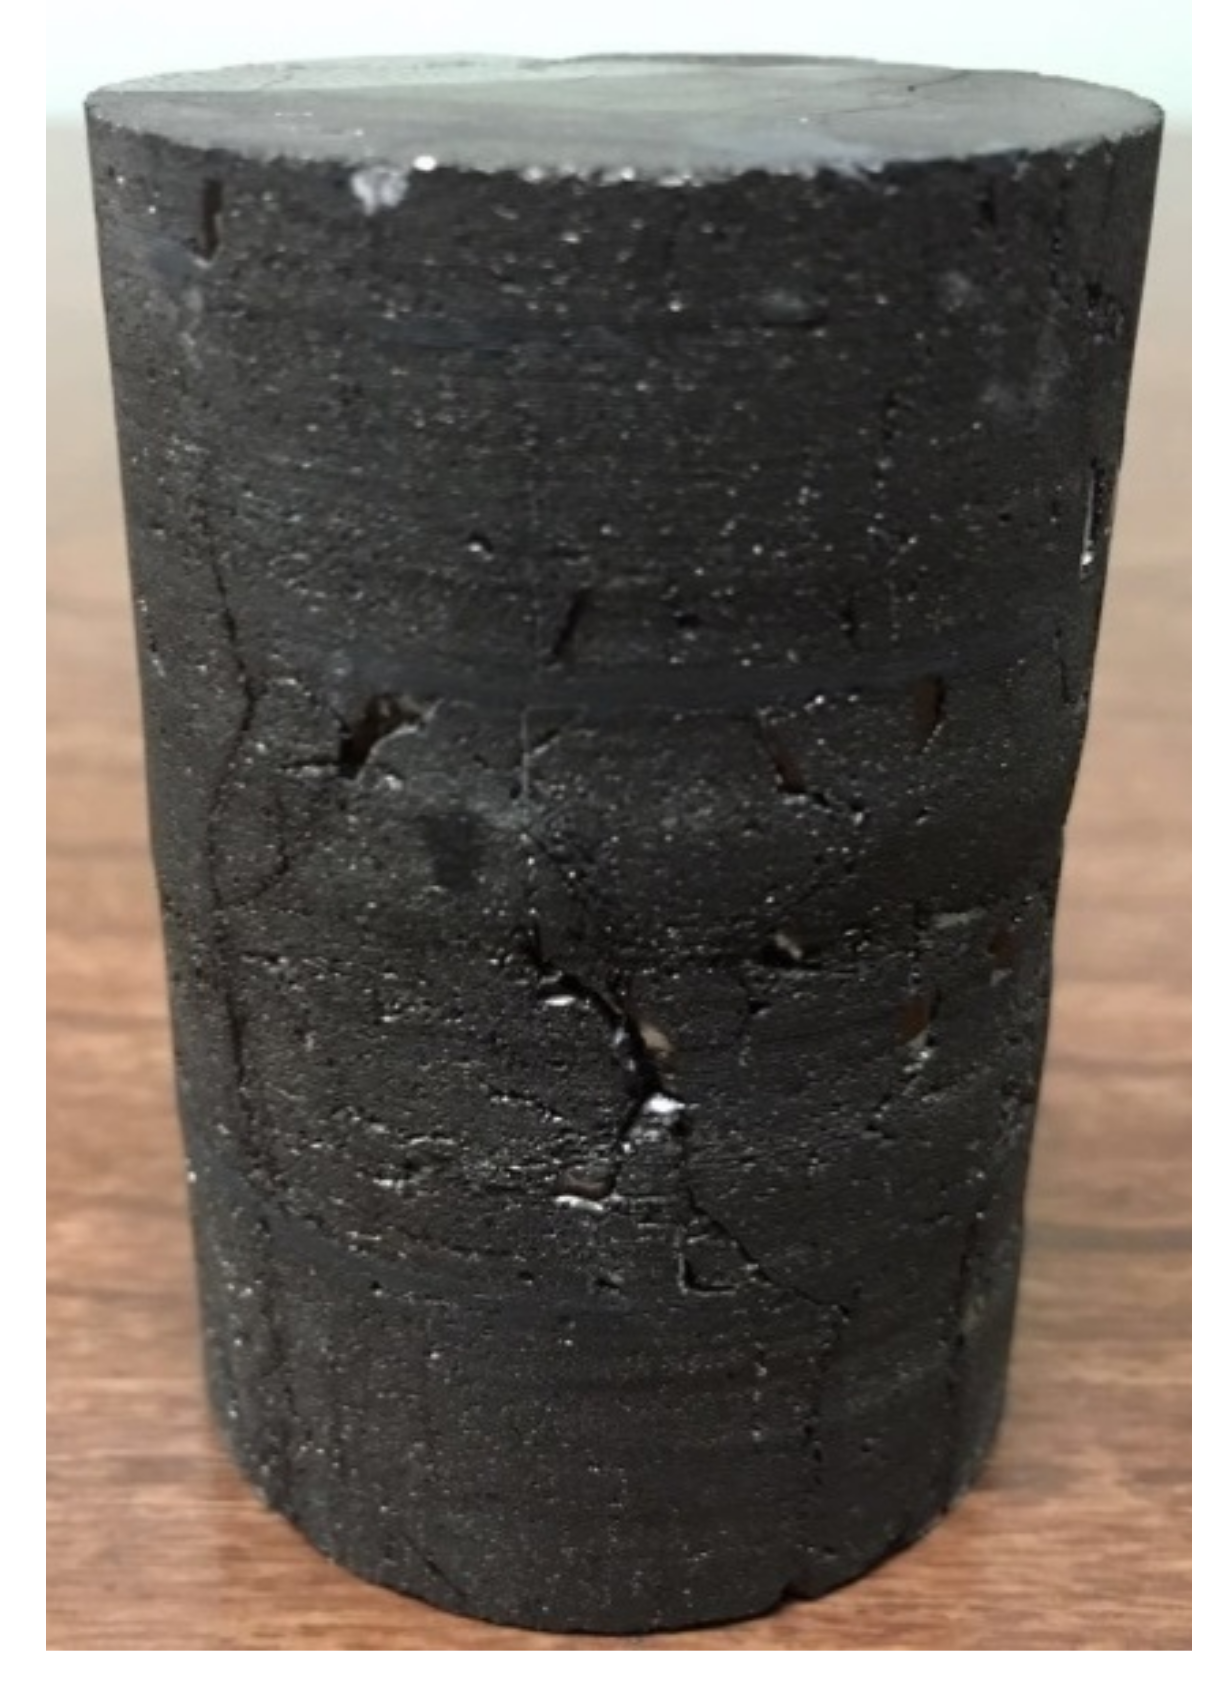
- During uploading phase of short term creep, vertical cracks develop and transform the sample into a structure consisting of separated columns. Further deterioration of the coal increases the possibility of tensile and shear failure of individual columns, which can trigger the violent collapse of an already fragile structure.
Acknowledgments
Author Contributions
Conflicts of Interest
References
- International Energy Agency. World Energy Outlook 2017; Organisation for Economic Co-Operation and Development (OECD): Paris, France, 2017. [Google Scholar]
- Liang, M.; Fang, X. Application of Fiber Bragg Grating Sensing Technology for Bolt Force Status Monitoring in Roadways. Appl. Sci. 2018, 8, 107. [Google Scholar] [CrossRef]
- He, M.C.; Xie, H.P.; Peng, S.P.; Jiang, Y.D. Study on rock mechanics in deep mining engineering. Chin. J. Rock Mech. Eng. 2005, 24, 2803–2813. (In Chinese) [Google Scholar]
- Li, T.; Cai, M.F.; Cai, M. A Review of Mining-Induced Seismicity in China. Int. J. Rock Mech. Min. Sci. 2007, 44, 1149–1171. [Google Scholar] [CrossRef]
- Ma, Z.; Gu, R.; Huang, Z.; Peng, G.; Zhang, L.; Ma, D. Experimental Study on Creep Behavior of Saturated Disaggregated Sandstone. Int. J. Rock Mech. Min. Sci. 2014, 66, 76–83. [Google Scholar] [CrossRef]
- Hatt, W.K. Notes on the Effect of Time Element in Loading Reinforced Concrete Beams; ASTM: Philadelphia, PA, USA, 1907. [Google Scholar]
- Washa, G.W.; Fluck, P.G. Plastic Flow (Creep) of Reinforced Concrete Continuous Beams. ACI Struct. J. 1956, 52, 549–561. [Google Scholar]
- Dragon, A.; Mroz, Z. A Continuum Model for Plastic Brittle Behavior of Rock and Concrete. Int. J. Eng. Sci. 1979, 17, 121–137. [Google Scholar] [CrossRef]
- Altoubat, S.A.; Lange, D.A. Creep, Shrinkage, and Cracking of Restrained Concrete at Early Age. ACI Mater. J. 2001, 98, 323–331. [Google Scholar]
- Yuan, Y.; Wan, Z.L. Prediction of Cracking within Early-Age Concrete due to Thermal, Drying and Creep Behavior. Cem. Concr. Res. 2002, 32, 1053–1059. [Google Scholar] [CrossRef]
- Benboudjema, F.; Meftah, F.; Torrenti, J.M. Interaction between Drying, Shrinkage, Creep and Cracking Phenomena in Concrete. Eng. Struct. 2005, 27, 239–250. [Google Scholar] [CrossRef]
- Bažant, Z.P.; Hauggaard, A.B. Microprestress-Solidification Theory for Concrete Creep I: Aging and Drying Effects. J. Eng. Mech. 1997, 123, 1188–1194. [Google Scholar] [CrossRef]
- Bažant, Z.P.; Prasannan, S. Solidification Theory for Concrete Creep. I: Formulation and II. Verification and Application. J. Eng. Mech. 1997, 123, 1691–1725. [Google Scholar] [CrossRef]
- Bažant, Z.P. Prediction of Concrete Creep Effects Using Age-Adjusted Effective Modulus Method. J. Am. Concr. Inst. 1972, 69, 212–217. [Google Scholar]
- Bažant, Z.P.; Najjar, L.J. Comparison of Approximate Linear Methods for Concrete Creep. J. Struct. Div. 1973, 99, 1851–1874. [Google Scholar]
- Glanville, W.H. Studies in Reinforced Concrete: The Creep or Flow of Concrete under Load; HM Stationery Office: Richmond, UK, 1930. [Google Scholar]
- Shrestha, K.M.; Chen, B.C.; Chen, Y.F. State of the Art of Creep of Concrete Filled Steel Tubular Arches. KSCE J. Civ. Eng. 2011, 15, 145–151. [Google Scholar] [CrossRef]
- Maslov, G.N. Thermal Stress States in Concrete Masses, with Account of Concrete Creep. Izvestia Nauchno-Issledovatel’skogo Instituta Gidrotechniki 1940, 28, 175–188. [Google Scholar]
- Bažant, Z.P.; Baweja, S. Creep and Shrinkage Prediction Model for Analysis and Design of Concrete Structures: Model B3. ACI Spec. Publ. 2000, 194, 1–84. [Google Scholar]
- Bažant, Z.P.; Osman, E. Double Power Law for Basic Creep of Concrete. Matériaux Constr. 1976, 9, 3–11. [Google Scholar] [CrossRef]
- Griggs, D. Creep of Rocks. J. Geol. 1939, 47, 225–251. [Google Scholar] [CrossRef]
- Carter, N.L.; Hansen, F.D. Creep of Rocksalt. Tectonophysics 1983, 92, 275–333. [Google Scholar] [CrossRef]
- Cruden, D.M.; Masoumzadeh, S. Accelerating Creep of the Slopes of a Coal Mine. Rock Mech. Rock Eng. 1987, 20, 123–135. [Google Scholar] [CrossRef]
- Scott Duncan, E.J.; Lajtai, E.Z. The Creep of Potash Salt Rocks from Saskatchewan. Geotech. Geol. Eng. 1993, 11, 159–184. [Google Scholar] [CrossRef]
- Drescher, K.; Handley, M.F. Aspects of Time-Dependent Deformation in Hard Rock at Great Depth. J. S. Afr. Inst. Min. Metall. 2003, 103, 325–336. [Google Scholar]
- Fabre, G.; Pellet, F. Creep and Time-Dependent Damage in Argillaceous Rocks. Int. J. Rock Mech. Min. Sci. 2006, 43, 950–960. [Google Scholar] [CrossRef]
- Heap, M.J.; Baud, P.; Meredith, P.G.; Bell, A.F.; Main, I.G. Time-Dependent Brittle Creep in Darley Dale Sandstone. J. Geophys. Res. Solid Earth 2009, 114, 1–22. [Google Scholar] [CrossRef]
- Zhou, H.W.; Wang, C.P.; Han, B.B.; Duan, Z.Q. A Creep Constitutive Model for Salt Rock Based on Fractional Derivatives. Int. J. Rock Mech. Min. Sci. 2011, 48, 116–121. [Google Scholar] [CrossRef]
- Yang, D.; Bornert, M.; Chanchole, S.; Wang, L.; Valli, P.; Gatmiri, B. Experimental Investigation of the Delayed Behavior of Unsaturated Argillaceous Rocks by Means of Digital Image Correlation Techniques. Appl. Clay Sci. 2011, 54, 53–62. [Google Scholar] [CrossRef]
- Yang, D.S.; Chen, L.F.; Yang, S.Q.; Chen, W.Z.; Wu, G.J. Experimental Investigation of the Creep and Damage Behavior of Linyi Red Sandstone. Int. J. Rock Mech. Min. Sci. 2014, 72, 164–172. [Google Scholar] [CrossRef]
- Mishra, B.; Verma, P. Uniaxial and Triaxial Single and Multistage Creep Tests on Coal-Measure Shale Rocks. Int. J. Coal Geol. 2015, 137, 55–65. [Google Scholar] [CrossRef]
- Bikong, C.; Hoxha, D.; Shao, J.F. A Micro-Macro Model for Time-Dependent Behavior of Clayey Rocks due to Anisotropic Propagation of Microcracks. Int. J. Plast. 2015, 69, 73–88. [Google Scholar] [CrossRef]
- Zhang, Y.; Shao, J.; Xu, W.; Jia, Y. Time-Dependent Behavior of Cataclastic Rocks in a Multi-Loading Triaxial Creep Test. Rock Mech. Rock Eng. 2016, 49, 3793–3803. [Google Scholar] [CrossRef]
- Boukharov, G.N.; Chanda, M.W.; Boukharov, N.G. The Three Processes of Brittle Crystalline Rock Creep. Int. J. Rock Mech. Min. Sci. Geomech. Abstr. 1995, 32, 325–335. [Google Scholar] [CrossRef]
- Jaeger, J.C.; Cook, N. Fundamentals of Rock Mechanics; Blackwell Pub.: Malden, MA, USA, 2007. [Google Scholar]
- Kang, J.; Zhou, F.; Liu, C.; Liu, Y. A Fractional Non-Linear Creep Model for Coal Considering Damage Effect and Experimental Validation. Int. J. Non-Linear Mech. 2015, 76, 20–28. [Google Scholar] [CrossRef]
- Scholz, C.H. Mechanism of Creep in Brittle Rock. J. Geophys. Res. 1968, 73, 3295–3302. [Google Scholar] [CrossRef]
- Pomeroy, C.D. Creep in Coal at Room Temperature. Nature 1956, 178, 279. [Google Scholar] [CrossRef]
- Kaiser, P.K.; Morgenstern, N.R. Time-Dependent Deformation of Small Tunnels-II. Typical Test Data. Int. J. Rock Mech. Min. Sci. 1981, 18, 141–152. [Google Scholar] [CrossRef]
- Yang, S.Q.; Xu, P.; Ranjith, P.G. Damage Model of Coal under Creep and Triaxial Compression. Int. J. Rock Mech. Min. Sci. 2015, 80, 337–345. [Google Scholar] [CrossRef]
- Bieniawski, Z.T.; Bernede, M.J. Suggested Methods for Determining the Uniaxial Compressive Strength and Deformability of Rock Materials: Part 1. Suggested Method for Determination of the Uniaxial Compressive Strength of Rock Materials. Int. J. Rock Mech. Min. Sci. 1979, 16, 135–140. [Google Scholar] [CrossRef]
- Sammonds, P.R.; Ayling, M.R.; Meredith, P.G.; Murrell, S.A.F.; Jones, C. A laboratory investigation of acoustic emission and elastic wave velocity changes during rock failure under triaxial stresses. In Proceedings of the ISRM International Symposium, Pau, France, 30 August–2 September 1989. [Google Scholar]
- Ayling, M.R.; Meredith, P.G.; Murrell, S.A.F. Microcracking during Triaxial Deformation of Porous Rocks Monitored by Changes in Rock Physical Properties, I. Elastic-Wave Propagation Measurements on Dry Rocks. Tectonophysics 1995, 245, 205–221. [Google Scholar] [CrossRef]
- Fortin, J.; Guéguen, Y.; Schubnel, A. Effects of Pore Collapse and Grain Crushing on Ultrasonic Velocities and Vp/Vs. J. Geophys. Res. Solid Earth 2007, 112, 1–16. [Google Scholar] [CrossRef]
- Guéguen, Y.; Palciauskas, V. Introduction to the Physics of Rocks; Princeton University Press: Princeton, NJ, USA, 1994; pp. 159–167. [Google Scholar]
- Al-Shayea, N.A. Effects of Testing Methods and Conditions on the Elastic Properties of Limestone Rock. Eng. Geol. 2004, 74, 139–156. [Google Scholar] [CrossRef]
- Martínez-Martínez, J.; Benavente, D.; García-del-Cura, M.A. Comparison of the Static and Dynamic Elastic Modulus in Carbonate Rocks. Bull. Eng. Geol. Environ. 2012, 71, 263–268. [Google Scholar] [CrossRef]
- Hallbauer, D.K.; Wagner, H.; Cook, N.G.W. Some Observations Concerning the Microscopic and Mechanical Behaviour of Quartzite Specimens in Stiff, Triaxial Compression Tests. Int. J. Rock Mech. Min. Sci. Geomech. Abstr. 1973, 10, 713–726. [Google Scholar] [CrossRef]
- Kim, Y.-S.; Tatsuoka, F.; Ochi, K. Deformation Characteristics at Small Strains of Sedimentary Soft Rocks by Triaxial Compression Tests. Geotechnique 1994, 44, 461–478. [Google Scholar] [CrossRef]
- Peng, R.; Ju, Y.; Wang, J.G.; Xie, H.; Gao, F.; Mao, L. Energy Dissipation and Release During Coal Failure Under Conventional Triaxial Compression. Rock Mech. Rock Eng. 2014, 48, 509–526. [Google Scholar] [CrossRef]
- Martínez-Martínez, J.; Benavente, D.; García-del-Cura, M.A. Spatial Attenuation: The Most Sensitive Ultrasonic Parameter for Detecting Petrographic Features and Decay Processes in Carbonate Rocks. Eng. Geol. 2011, 119, 84–95. [Google Scholar] [CrossRef]
- Gatelier, N.; Pellet, F.; Loret, B. Mechanical Damage of an Anisotropic Porous Rock in Cyclic Triaxial Tests. Int. J. Rock Mech. Min. Sci. 2002, 39, 335–354. [Google Scholar] [CrossRef]


| Creep Stress (MPa) | Axial Strain Rate (per hour) | Radial Strain Rate (per hour) | Volumetric Strain Rate (per hour) |
|---|---|---|---|
| 8.03 | 1.59 × 10⁻⁴ | −1.08 × 10⁻⁵ | 1.38 × 10⁻⁴ |
| 8.98 | 2.53 × 10⁻⁴ | −1.26 × 10⁻⁴ | 1.04 × 10⁻⁶ |
| 10.00 | 3.29 × 10⁻⁵ | −6.35 × 10⁻⁵ | −9.41 × 10⁻⁵ |
| 11.02 | 1.92 × 10⁻³ | −4.91 × 10⁻³ | −7.89 × 10⁻³ |
| 11.98 | 1.06 × 10⁻⁴ | −2.27 × 10⁻⁵ | 6.07 × 10⁻⁵ |
| 13.00 | 2.11 × 10⁻⁴ | −2.32 × 10⁻⁵ | 1.65 × 10⁻⁴ |
| 14.02 | 2.49 × 10⁻⁴ | −4.47 × 10⁻⁵ | 1.60 × 10⁻⁴ |
| 14.97 | 1.36 × 10⁻⁴ | −9.59 × 10⁻⁵ | −3.02 × 10⁻⁶ |
| 15.99 | 5.63 × 10⁻³ | −2.54 × 10⁻² | −4.53 × 10⁻² |
| 17.01 | 1.85 × 10⁻⁴ | −4.01 × 10⁻⁵ | 1.04 × 10⁻⁴ |
| 17.97 | 4.66 × 10⁻³ | −5.23 × 10⁻² | −1.00 × 10⁻¹ |
| Time (Minutes) | Change in P-Wave Velocity (100%) | Change in S-Wave Velocity (100%) | ||||
|---|---|---|---|---|---|---|
| 11.02 MPa | 15.99 MPa | 17.97 MPa | 11.02 MPa | 15.99 MPa | 17.97 MPa | |
| 3 | 100.0 | - | - | 100.0 | - | - |
| 5 | - | - | 100.0 | - | - | 100.0 |
| 6 | 101.6 | 100.0 | - | 96.5 | 100 | - |
| 7 | - | - | 98.5 | - | - | 95.6 |
| 9 | 98.5 | 98.8 | 96.6 | 93.1 | 98.3 | 92.3 |
| 12 | 98.5 | 96.5 | 93.5 | 92.1 | ||
| 15 | - | 95.1 | - | 90.4 | ||
| 16 | 97.8 | 91.4 | ||||
| 20 | 98.3 | 91.4 | ||||
| 24 | 97.0 | 91.4 | ||||
| 28 | 97.3 | 91.4 | ||||
| 32 | 97.5 | 90.6 | ||||
| 36 | 96.3 | 89.0 | ||||
| 38 | 95.1 | 87.8 | ||||
| 40 | 94.6 | 87.5 | ||||
| Creep Stress (MPa) | Static Modulus (GPa) |
|---|---|
| 8.03 | 1.31 |
| 8.98 | 1.29 |
| 10.00 | 1.89 |
| 11.02 | 1.63 |
| 11.98 | 1.82 |
| 13.00 | 1.89 |
| 14.02 | 1.58 |
| 14.97 | 2.25 |
| 15.99 | 2.04 |
| 17.01 | 2.43 |
| 17.97 | 3.49 |
© 2018 by the authors. Licensee MDPI, Basel, Switzerland. This article is an open access article distributed under the terms and conditions of the Creative Commons Attribution (CC BY) license (http://creativecommons.org/licenses/by/4.0/).
Share and Cite
Yang, S.; Zhang, N.; Feng, X.; Kan, J. Experimental Investigation of the Creep Behaviour of Coal by Monitoring Changes of Acoustic Properties. Appl. Sci. 2018, 8, 633. https://doi.org/10.3390/app8040633
Yang S, Zhang N, Feng X, Kan J. Experimental Investigation of the Creep Behaviour of Coal by Monitoring Changes of Acoustic Properties. Applied Sciences. 2018; 8(4):633. https://doi.org/10.3390/app8040633
Chicago/Turabian StyleYang, Sen, Nong Zhang, Xiaowei Feng, and Jiaguang Kan. 2018. "Experimental Investigation of the Creep Behaviour of Coal by Monitoring Changes of Acoustic Properties" Applied Sciences 8, no. 4: 633. https://doi.org/10.3390/app8040633