Article

The Optical Barcode Detection and Recognition Method Based on Visible Light Communication Using Machine Learning

School of Automation Science and Engineering, South China University of Technology, Guangzhou 510640, China
*
Author to whom correspondence should be addressed.
Appl. Sci. 2018, 8(12), 2425; https://doi.org/10.3390/app8122425
Submission received: 1 October 2018 / Revised: 2 November 2018 / Accepted: 13 November 2018 / Published: 29 November 2018
(This article belongs to the Special Issue Advanced Intelligent Imaging Technology)

Abstract

:
Visible light communication (VLC) has developed rapidly in recent years. VLC has the advantages of high confidentiality, low cost, etc. It could be an effective way to connect online to offline (O2O). In this paper, an RGB-LED-ID detection and recognition method based on VLC using machine learning is proposed. Different from traditional encoding and decoding VLC, we develop a new VLC system with a form of modulation and recognition. We create different features for different LEDs to make it an Optical Barcode (OBC) based on a Complementary Metal-Oxide-Semiconductor (CMOS) senor and a pulse-width modulation (PWM) method. The features are extracted using image processing and then support vector machine (SVM) and artificial neural networks (ANN) are introduced into the scheme, which are employed as a classifier. The experimental results show that the proposed method can provide a huge number of unique LED-IDs with a high LED-ID recognition rate and its performance in dark and distant conditions is significantly better than traditional Quick Response (QR) codes. This is the first time the VLC is used in the field of Internet of Things (IoT) and it is an innovative application of RGB-LED to create features. Furthermore, with the development of camera technology, the number of unique LED-IDs and the maximum identifiable distance would increase. Therefore, this scheme can be used as an effective complement to QR codes in the future.

1. Introduction

The Internet of Things (IoT) is an important part of the new generation of information technology. As the name suggests, the IoT technology aims to build a set of networks in which each object is connected. The IoT is widely used in network convergence through intelligent sensing, recognition technology, and ubiquitous computing and other communication sensing technologies [1]. The most widely used form of IoT is the quick response code (QR code) of different objects [2]. However, when the QR code is outdoors, especially in dark and distant conditions, the QR code scanning is difficult to implement. This limits the wider application of 2-D code access technology. Therefore, the market is in urgent need of access technology that can meet the specific environmental needs. The visible light communication (VLC) becomes the preferred technology.
A lot of research in the field of VLC has been done in recent years [3,4,5,6,7]. By modulating the frequency of light-emitting diodes (LEDs) up to several hundred MHz, which is undetectable to the human eyes [8,9], this is the basis for using VLC as access technology. Furthermore, there are a lot of advantages of VLC. First, the visible part of the electromagnetic spectrum is unlicensed and unregulated, and LEDs are more energy efficient than other radio transmitters [10]. Second, the line of sight (LOS) property ensures secrecy in the process of information transmission [11]. Lastly, it is well known that LEDs have been widely used, so VLC is easy to popularize.
It is attractive to make the VLC as a supplement to traditional QR codes due to its advantages. In Ref. [12], a security system that is built using a barcode-based VLC system between smart phones is proposed. The results show that the system achieves a high level of security. However, the transmitter of the system uses LEDs in a smartphone, which leads to uneven light output, and the error rate increases due to the “blooming” effect of image sensors caused by uneven light output. In Ref. [13], Chen et al. use LED panel lights to reduce the possibility of overexposure and avoid the blooming effect of the camera. This method achieves good performance in the symbol error rate (SER) test. However, the effective transmission distance is too short (about 4 cm), and when the distance is large, the data packet may be partially lost.
In fact, VLC can be divided into two modes: one is photodiode-based (PD-based) and the other is image-sensor based [14,15,16]. A PD-based VLC system works by receiving the light intensity of different LEDs. It is low cost but it is not stable. With the interference of the background light or the reflection of the wall, performance would deteriorate. In the VLC system based on an image sensor, the LED projection of the image is taken as the foreground and the ambient light as the background. The image processing method makes it easy to extract the foreground and reduce the interference of ambient light. Therefore, it is different from the method based on PD since ambient light does not directly affect the captured images of the LED projection. In addition, with the popularization of smart phones, VLC based on an image sensor can be conveniently applied. Smartphones generally have cameras with a CMOS sensor but no PD. Therefore, comparing two modes of the VLC system, the image-sensors are more suitable to supplement QR code scanning technology. In our previous work [17], we proposed an LED-ID detection and identification method based on image-sensors-based VLC for indoor visible light positioning (VLP). However, only 1035 unique IDs were implemented under the same brightness condition. This was far from meeting the requirements of the supplementary technique for QR code.
Therefore, in this paper, we propose Optical Bar Code (OBC), which is an entirely new VLC system that is different from the traditional 0–1 digital encoding and decoding. We adopted the method of image feature extraction and innovatively used machine learning to build classifiers. We used RGB-LED as the transmitter and modulated each LED with a variable frequency, duty-ratio, and phase difference of three input signals of red (R), green (G), and blue (B) diodes using pulse-width modulation (PWM) method so that different LEDs would have six different features: the number of the R, G, and B image’s bright stripes (3); the area of the LED image; the skewing of the R, G, and B images’ stripes (1); and the ratio of the bright stripe’s width to both the bright and dark stripes’ width (duty-ratio of the bright stripes). Once the LED image is captured by a CMOS image sensor, an image processing method is used to extract the features of RGB-LED-ID. In order to use the extracted features to identify the LED-ID, a linear support vector machine (SVM) and a Back Propagation (BP) neural network are used. By off-line training for the classifiers and online recognition of LED-ID, the system proposed can detect and identify LED-ID well. As the experimental result shows, the proposed method could label roughly 1.05 × 10⁷ unique LED-ID with more than 95% recognition. The maximum distance could reach to 6 m, which is greater than the QR code and scheme in Ref. [13]. It can meet that requirement of a supplementary technique for QR codes. Besides, with the upgrading of camera technology, the number of the recognizable LEDs would also increase and LEDs with larger luminous areas can significantly increase the maximum distance. As an LED-to-camera communication technology, this is the first application of VLC in the field of IoT.
The OBC we proposed can be used in many scenes. In the field of mobile payment, the security of payment can be increased. Furthermore, it is convenient to use in dark and distant conditions, reducing the queuing time at the time of payment. In the outdoor advertising field, the OBC can also be used. Limited by the size of the billboard, the product information displayed on the billboard is simple. If the OBC is used, people interested in the product can scan the billboard through the smartphone to get the details of the product. These are just two examples of OBC applications, but many more are available.
The remainder of this paper is organized as follows: The background is described in Section 2. The system principle is in Section 3. Experiments and analysis are shown in Section 4. Finally, in Section 5, the conclusion is provided.

2. Background

2.1. Using a CMOS Sensor in VLC

2.1.1. Rolling Shutter Mechanism

For a Charge Coupled Device (CCD) sensor, the whole sensor is exposed simultaneously, and the data of all pixels are recorded simultaneously. This mechanism is called the global shutter mechanism of CCD sensors which is illustrated in Figure 1a. On the other hand, for a CMOS sensor, each row in the CMOS sensor is activated sequentially, which means that the data readout and exposure are performed row by row. When the exposure of the row is over, the read out for a row of data is given immediately. Finally, all scanlines captured at different times are combined to form images. This is the mechanism of the CMOS sensor we learned of from Refs. [18,19,20], which is called the rolling shutter mechanism. The rolling shutter mechanism of CMOS sensors is illustrated in Figure 1b. The rolling shutter mechanism of the CMOS sensor, which opens and closes during exposure to LED light, will lead to CMOS image sensor captures on the bright stripes and dark stripes.

2.1.2. Camera Requirement

The camera has many performance indicators that affect the images they capture. When a camera is used as a receiver in the VLC system, the two most important characteristics are exposure time and International Organization for Standardization (ISO).
• Exposure Time
The exposure time is a time horizon that the camera shutter is open for to allow light into the photodiode matrix. The exposure duration determines how long a pixel collects photons. Pixels in the light irradiation accumulate charge until saturation.
LED is not only used as a transmitter, but also in many cases as a light source in the indoor environment, so the intensity of the LED is very high and the charge of the pixels is saturated in a short time. When the pixel charge is saturated, the charge will spill over to the nearest pixel if it continues to irradiate, resulting in the accumulation and saturation of the charge in the near pixel. Therefore, if the exposure time is too long, the width of the bright stripe will increase, and the reception will be affected. Especially when we use RGB-LED, this effect is more obvious. Incorrect doping of color will greatly increase the error of detection and recognition.
• ISO
In digital cameras, ISO indicates the speed of photosensitivity of the CCD or CMOS photosensitive elements. The higher the ISO value, the stronger the photosensitive ability of the photosensitive component. The higher the ISO, the fewer photons that a pixel needs to reach saturation. This means that the probability of the saturation pixel in the same exposure time increases, resulting in the width of the bright stripe in the captured image not normally increasing such that recognition rate will be reduced.

2.2. Avoiding Flicker and Keeping the Light White

Human eyes perceive objects around them by projecting images onto the retina. The brain needs a certain amount of time to process the received pictures, and our visual system cannot respond to the stimulus of the changes in front of the eyes, causing a delay in the observation of brightness or color changes. If intermittent stimuli appear below a certain frequency, our visual system can perceive changes (the effect is called flicker). Above the frequency at which the flicker effect ceases is called the flicker fusion threshold [21]. The flicker frequency of our LEDs are above 100 Hz, greater than the threshold, so the naked eye cannot see the flicker.
The most common and universal light in our lives is white light. The LEDs we are discussing here are used for both communication and general lighting in many cases. In general lighting, people generally have difficulty in accepting colored lights. Therefore, it is necessary to discuss the maintenance of white light in color modulation.
In the process of perceiving objects around us, our eyes go through a process called the sum of time. In the process, the eye accumulates photons until it is saturated. This period is called the tc:
ζ = I t ( t t c )
I is the intensity of the stimulus (LED project’s color stimulus in our case), and t c is the critical duration. With the increase of t, once the threshold is reached, additional stimulus light will not be perceived by the visual system. The perception of color by the human eye is the average of the stimulus within the critical duration. According to Bloch’s law, the color Ψ is
ψ = I R ( t ) d t + I G ( t ) d t + I B ( t ) d t t
where I R ( t ) , I G ( t ) , and I B ( t ) are the intensity functions of red, green, and blue light, respectively. For RGB-LED, if the three colors are emitted at the same ratio, the human eye will perceive the white light in the critical duration for the sum of the time. This is illustrated in Figure 2.

3. System Principle

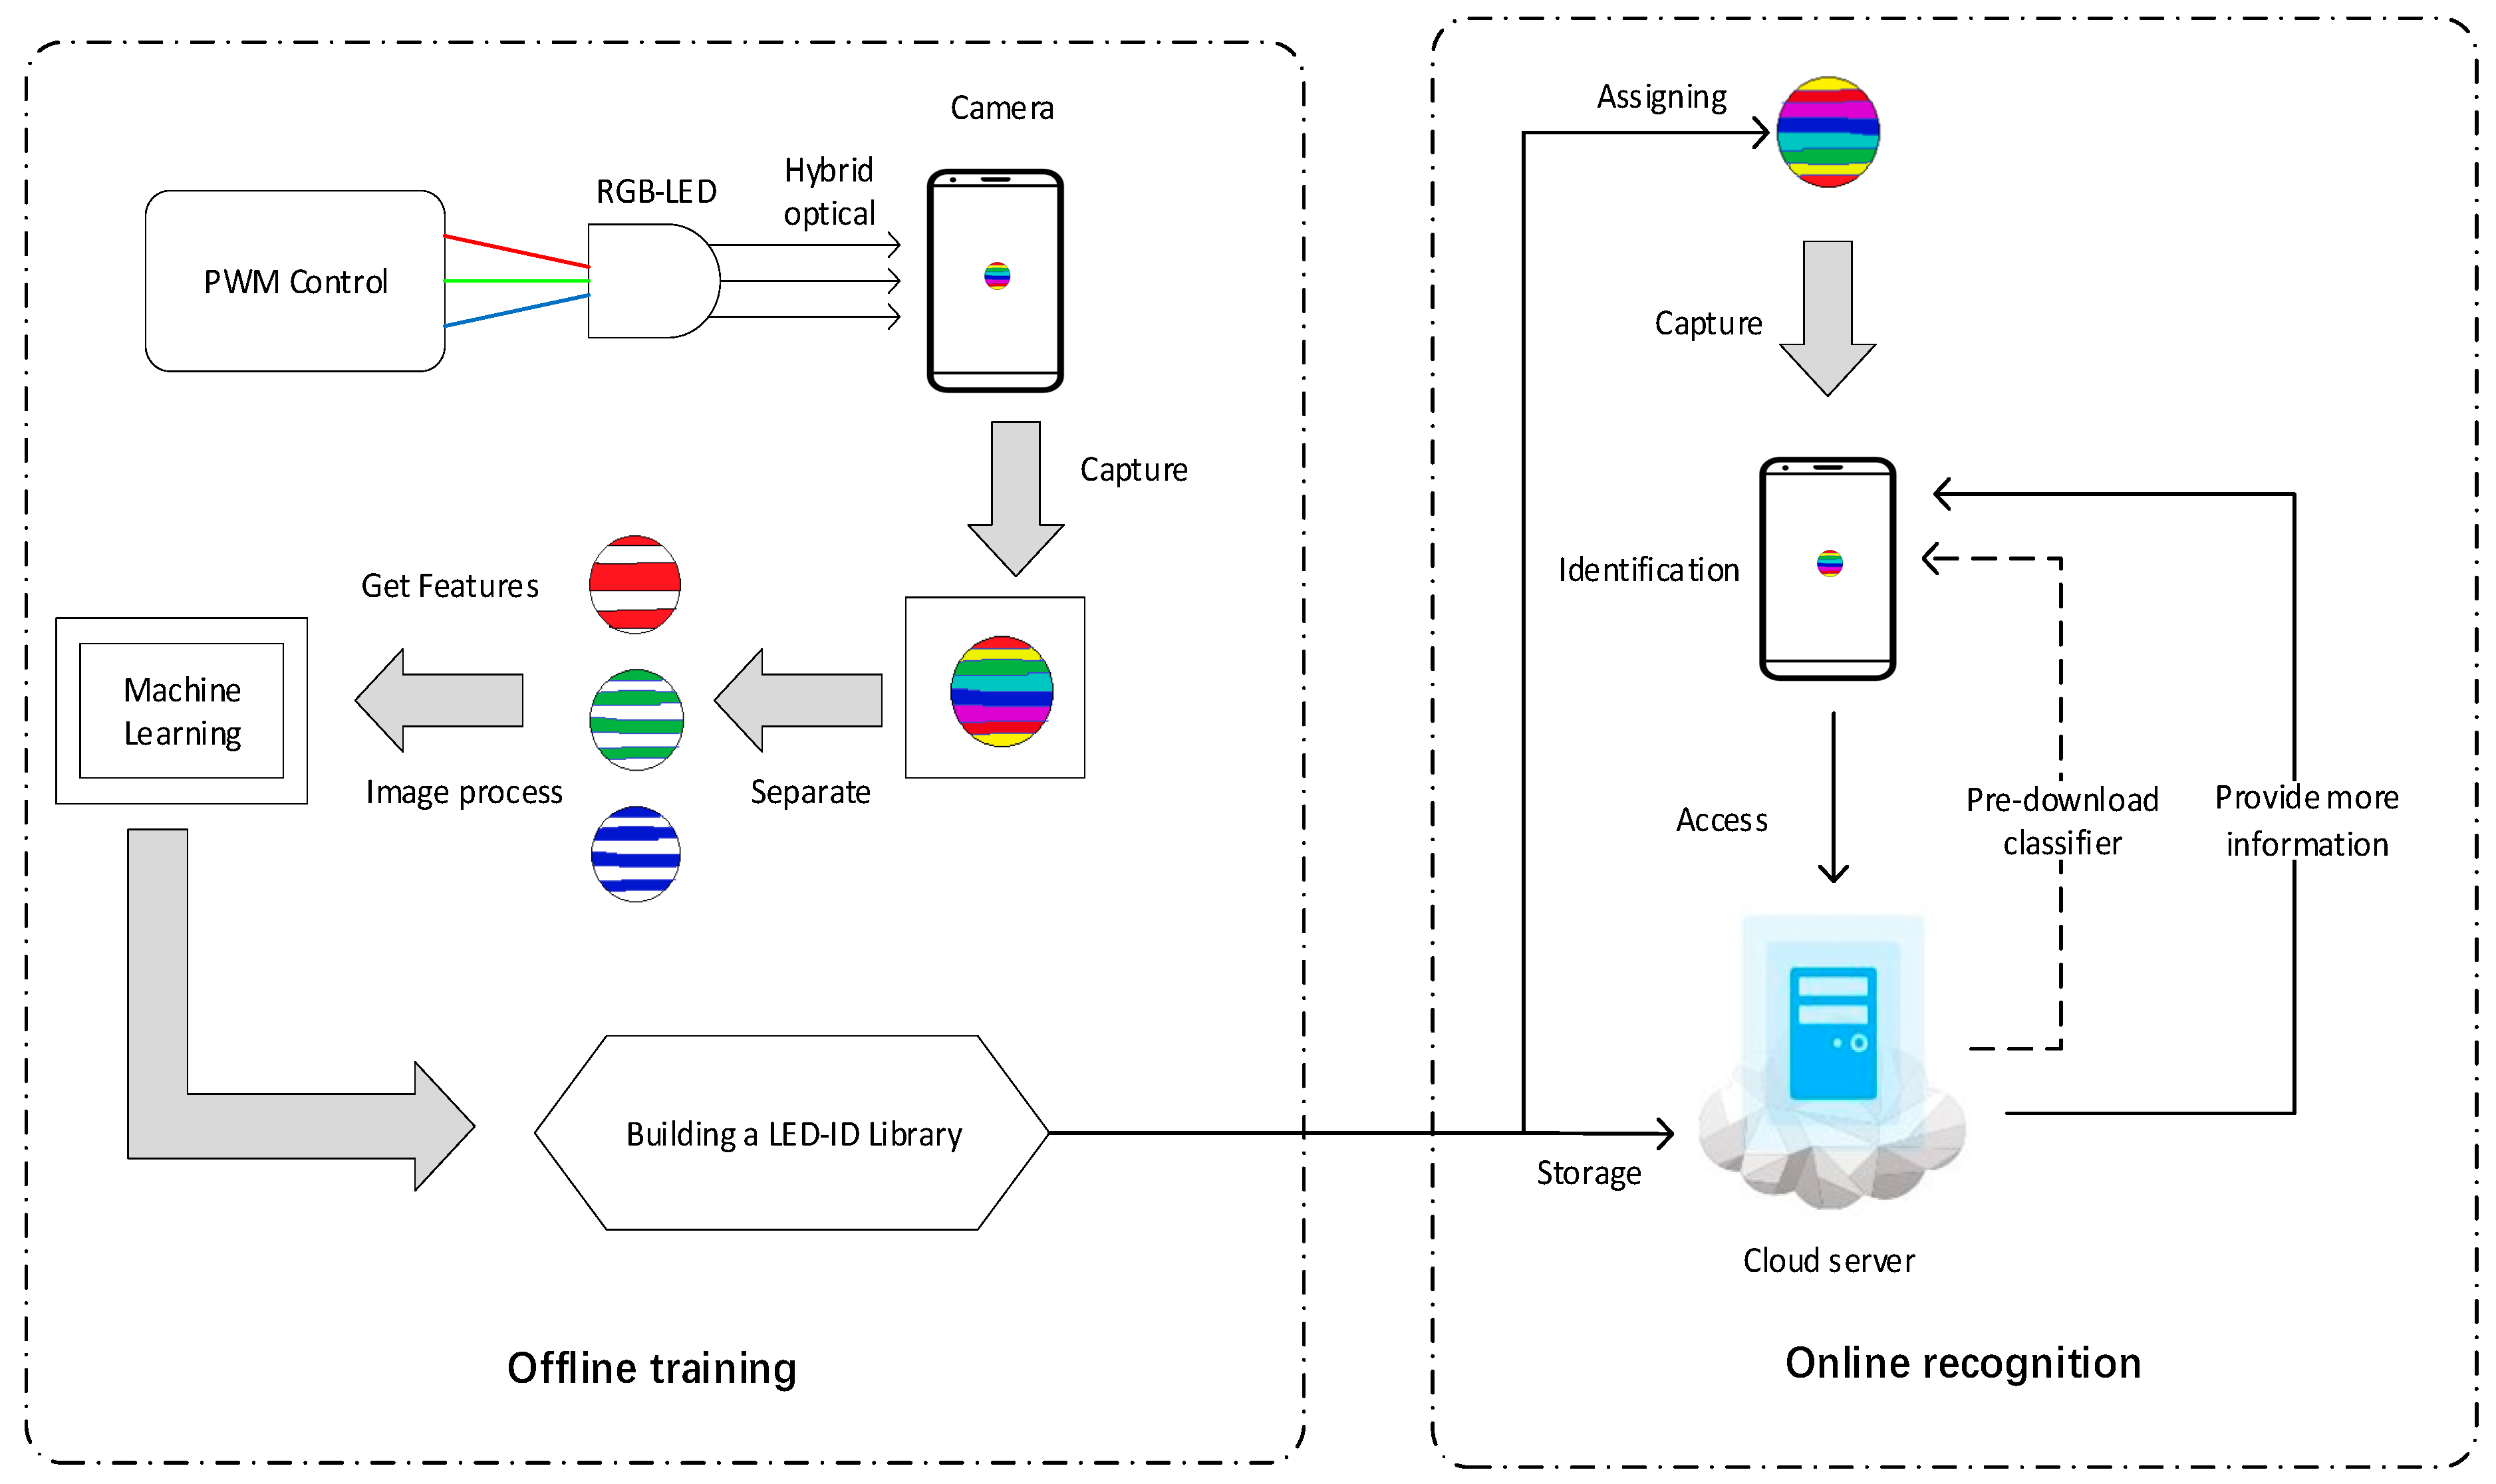
3.1. Method Overview

We provide a brief overview of the system first. In the offline training phase, at the transmitter, Pulse Width Modulation (PWM)is used to control three red, green, and blue diodes of the RGB-LED. Then, the light emitted by the red, green, and blue diodes is mixed in RGB-LED light bulbs to become white light. At the receiver, smartphone cameras can be used. The LED project image is captured with stripes by the CMOS sensor because of the rolling shutter mechanism. Due to special modulation, different LED project stripe images have different features, so we can call them the LED-IDs. Then, we use image processing technology to extract features to facilitate counting and extracting. In the process of image processing, the color LED projection is separated into three channels: R, G, and B. Next, according to our selected features, feature data will be extracted through image processing such as binarization, edge detection, etc. Then, according to the acquired feature data, a machine learning algorithm is applied to build the classifier. At last, exploring the boundary and completing the construction of the LED-ID library is done.
In the online training phase: First, when setting up the system, select the appropriate ID from the LED-ID library according to the required number and modulate the LED with the parameters of ID pairs in the library. The web page or other information corresponding to the ID is stored in the cloud server. Once the user’s achievement is recognized, the cloud content can be downloaded from the network. The schematic diagram of the method is given in Figure 3. What is more, in practical applications, the receiving end is not necessarily a cellphone camera, but also an on-board camera, a robot camera, etc.
In the next part of this section, we will select six representative RGB-LED-IDs to illustrate signal modulation, image processing, classifier establishment, and the online identification of our system.

3.2. LED Modulation

Pulse width modulation (PWM) is a very effective technique to control analog circuits by the digital transmission of microprocessors. It is widely used in many fields from measurement and communication to power control and transformation.
For RGB-LEDs, three pulse signals are generated to control the red, green, and blue diodes of the RGB-LEDs, respectively, using PWM. Then, the three diodes will produce a cumulative color. According to the rolling shutter mechanism of a CMOS sensor, the number of bright stripes on the LED project could be changed by changing the modulation frequency of the LED, and the duty-ratio of bright stripes could be changed by changing the duty-ratio of the pulse. In addition, by controlling the start time of the three pulses that input red, green, and blue diodes in a scheme, the three PWM signals have a phase difference. At the receiver, the captured LED images are separated into three R, G, and B images, and the stripes of three different colors in the same exposure period are different.
The images of different LEDs modulated by PWM with different frequency, duty-ratio, and phase difference are shown in Figure 4 and Figure 5. Furthermore, their modulated schemes at the emitter are shown in Figure 6.
In Figure 6, the phase difference and duty-ratio of R, G, and B signals in (a) and (b) are the same but the frequencies are different. In (c) and (d), the three signals have the same frequency and phase difference, but they are different in duty-ratio. Examples (e) and (f) have the same frequency and duty-ratio, but the phase difference is different. The naked eye cannot clearly distinguish the specific differences of these color images in some cases, so we extract the features of LED-IDs through image processing for the convenience of the show, which is shown in Figure 4.
As for (f) and (g), they are different from others in that the frequency of the R, G, and B signals are different from each other in a scheme that is shown in Figure 5.

3.3. RGB-LED-ID Feature Extraction and Selection

As the distance between the LED and camera increases, the area of LED projection on the CMOS sensor will decrease. For the same LED project, the width of the stripe will not change due to the fixed scanning frequency of the sensor. As the area of the LED projection on the CMOS sensor decreases, the number of stripes will decrease (Figure 7). The relative position relations of the stripes can be easily obtained after decomposing the image according to the three channels of R, G, and B, and it does not change with distance.
Therefore, in this paper, we choose six features: the area of the LED projection, the number of each color’s stripes, duty-ratio of the bright stripe, and the defined skewing coefficients. The steps of the RGB-LED-ID feature extraction and selection are given in Figure 8.

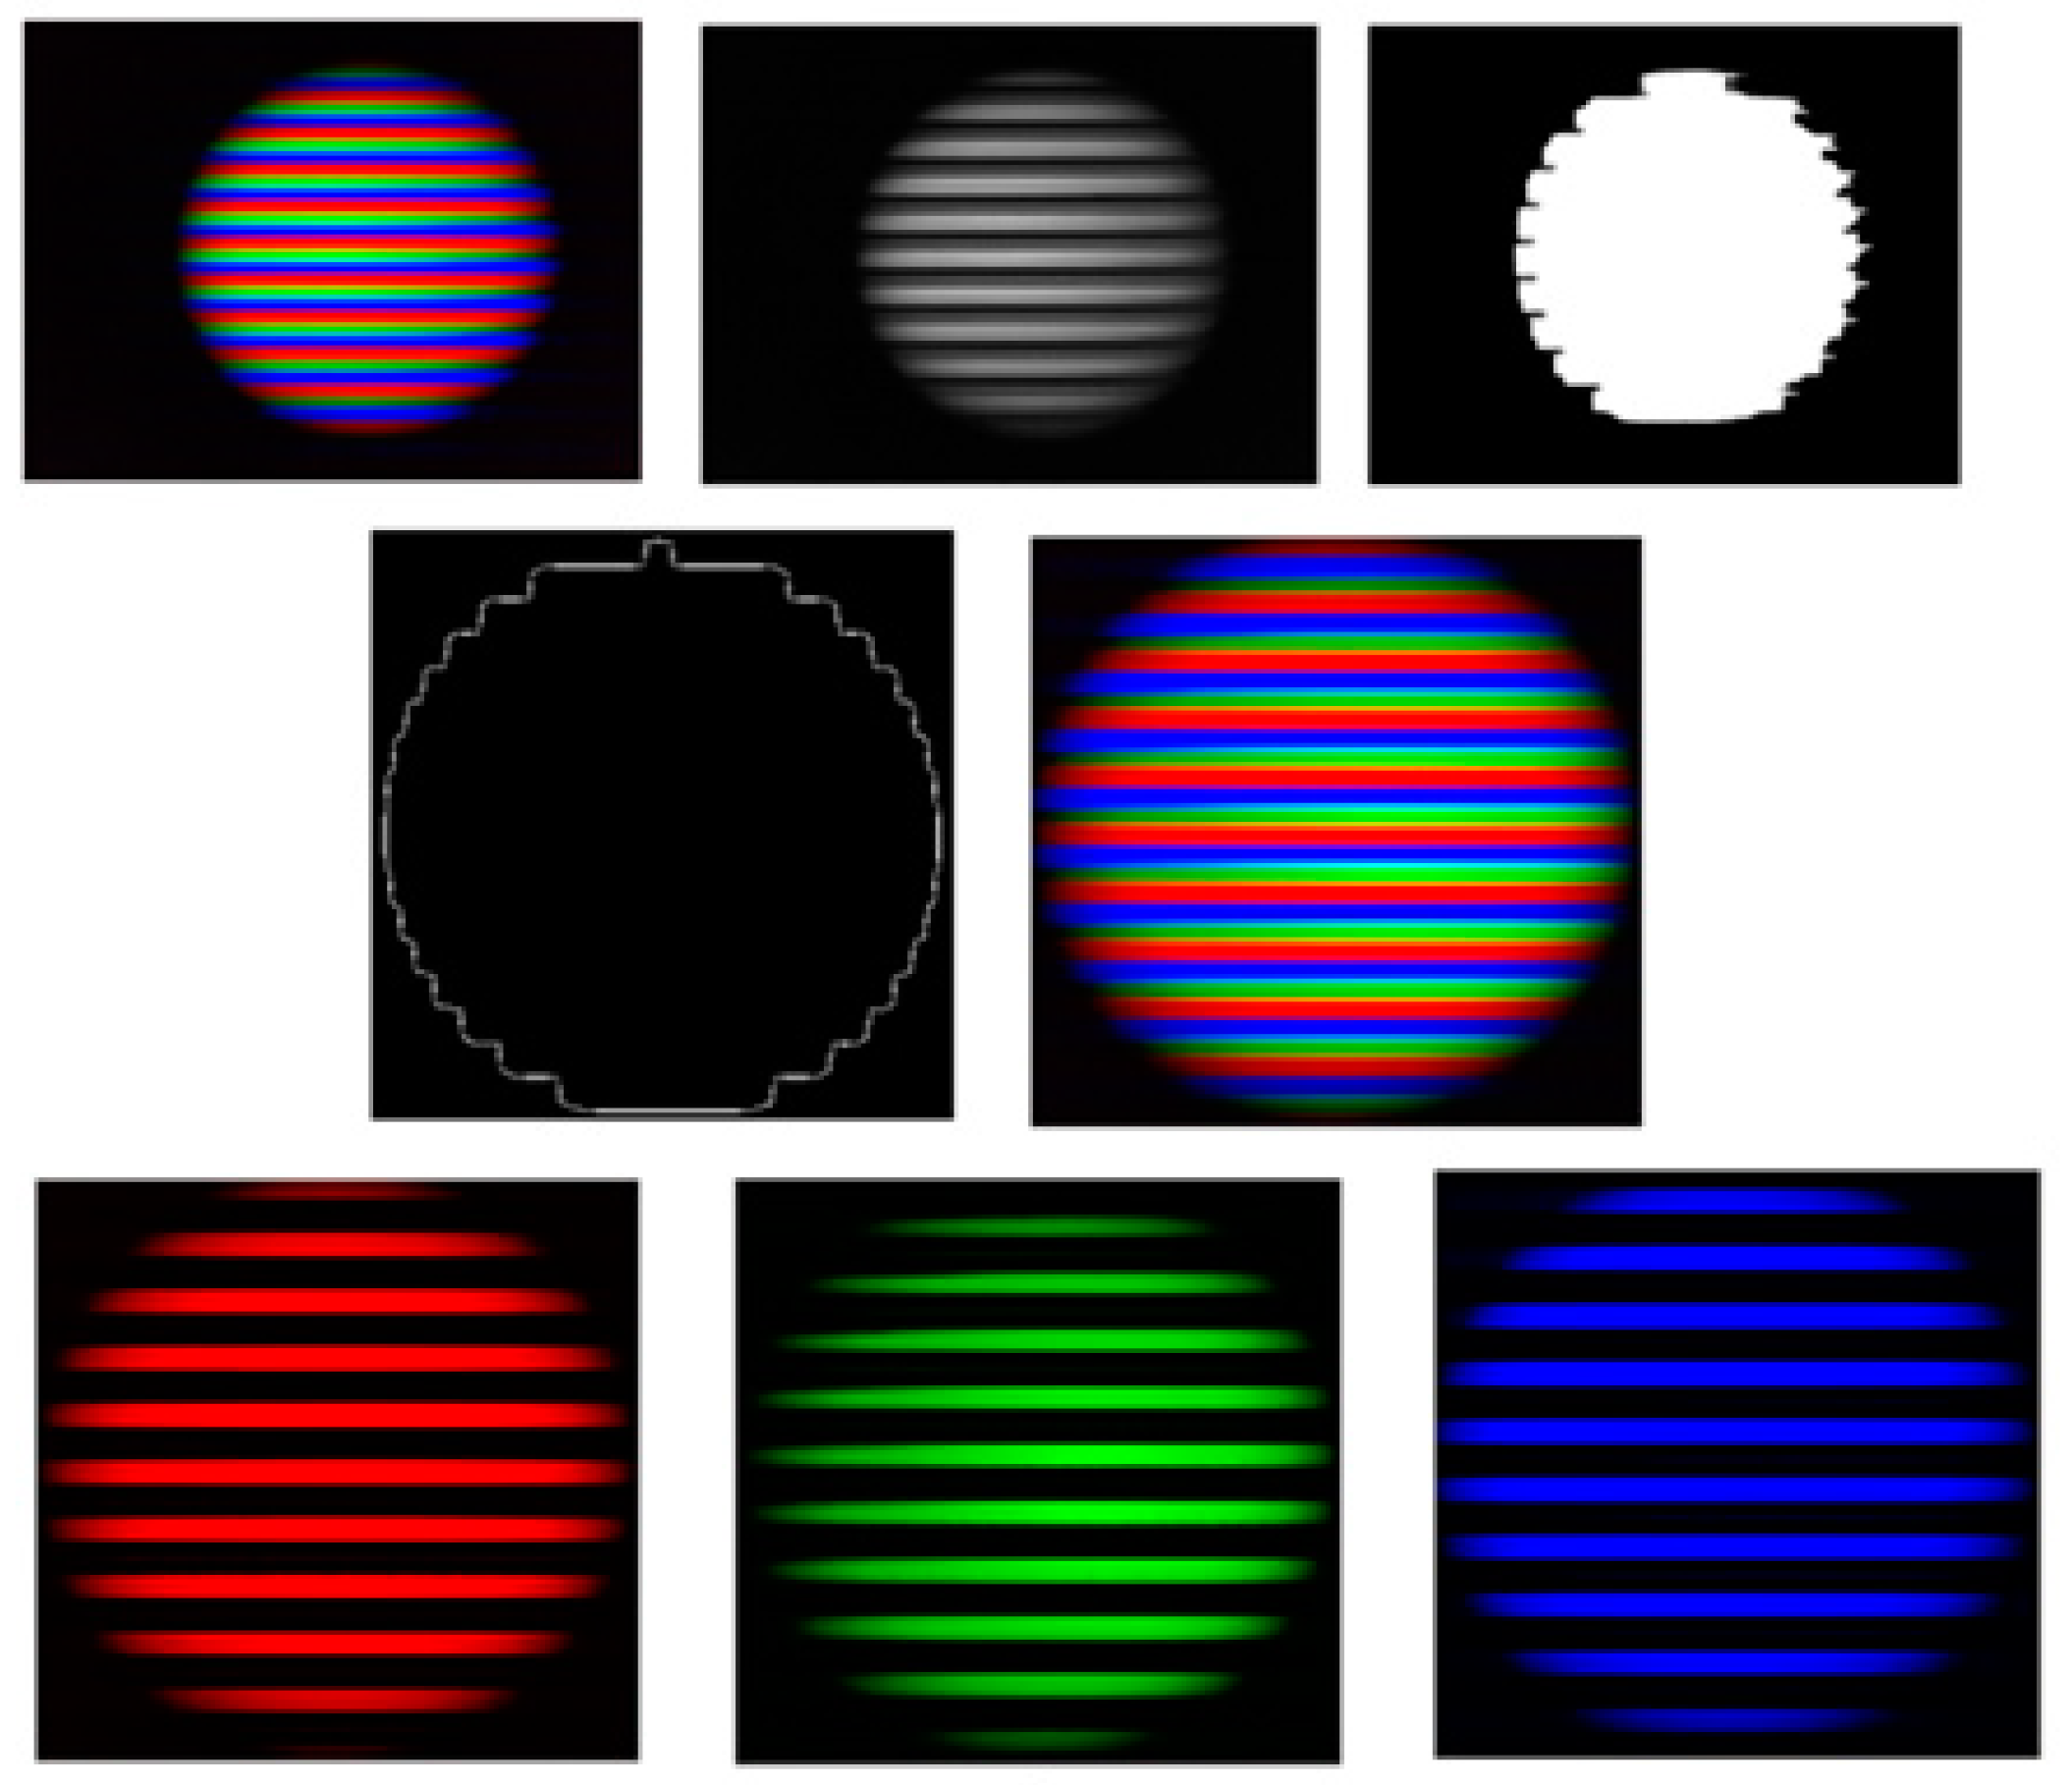
3.3.1. Step 1: Edge Detection and LED Segmentation

The CMOS sensor may capture an image containing multiple LEDs or an LED far away from the receiver, so we need to segment out the region of interest that the LED project is just centered on for further feature extraction. To achieve this goal, the whole image is transformed into a gray image first. After that, the threshold-based method is used to get binary images. Then, to make the LED project region form a connected domain, a morphologically-closed operation is used, and edge detection is done using a Canny operator to get the edge of the LED. Next, the edge of the LED is used to intercept the region of interest in the original image. Lastly, the image is separated according to the R, G, and B three channels. At this point, preprocessing is completed, as shown in Figure 9.

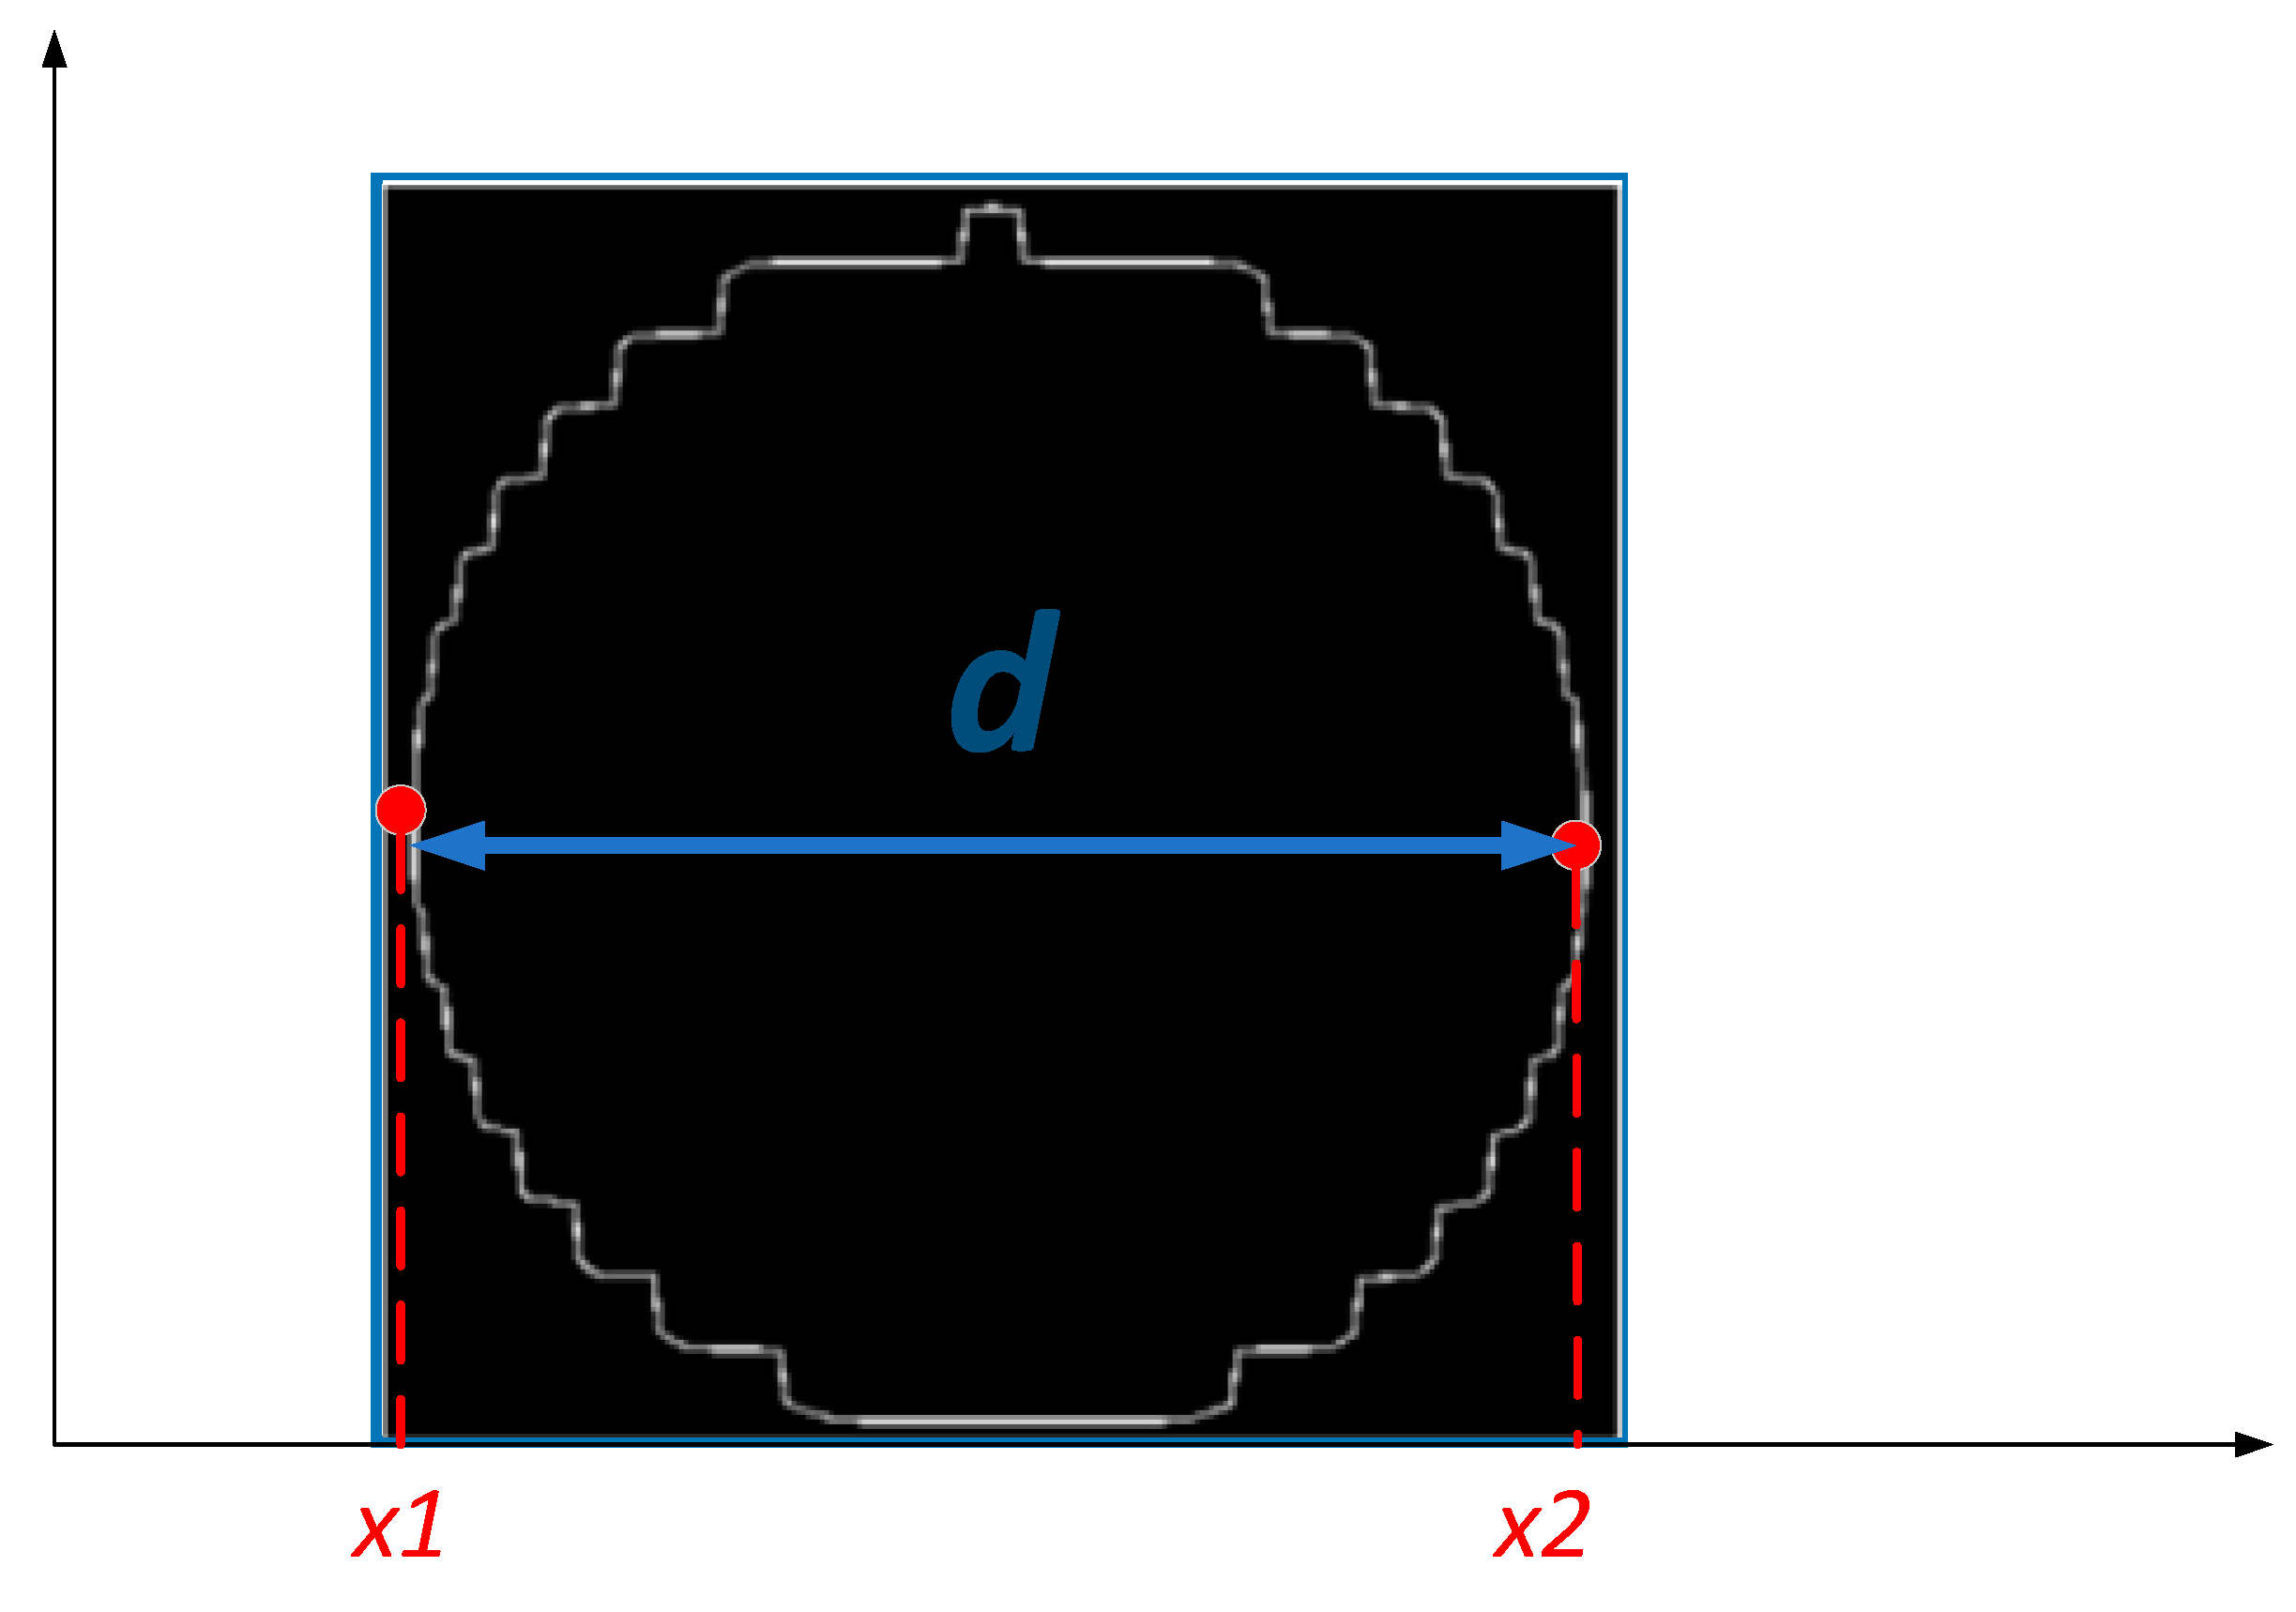
3.3.2. Step 2: Get the Area of the LED Project

In the preprocessing, we get the edge of LED project. Therefore, it is easy to get the area of the LED project. As shown in Figure 10, assuming that the coordinates of the leftmost point on the edge is ( x 1 , y ˜ ) , and the rightmost coordinate is ( x 2 , y ˜ ) , then the diameter of the LED projection is:
d = x 2 x 1
Thus, the area of the LED projection can be calculated using:
s = π ( d 2 ) 2

3.3.3. Step 3: Get the Duty-Ratio of the Bright Stripe Counting

In a binary image, each pixel value is 1 or 0. Set up a vertical and downward detection vector through the image center. If 1 is detected, the pixel is in the bright stripe. Conversely, if 0 is detected, the pixel is in the dark fringe. Furthermore, record the number of 1 and 0 detected during the test. It is easy to get the number of R, G, and B image stripes in this process. The number of R, G, and B image stripes is three features in our case, which is shown in Figure 11.

3.3.4. Step 4: Get the Skewing

The three images obtained from the separation are placed in the same coordinate system, which is shown in Figure 12. Set a vertical and downward vector passing through the image center. In the first image (R), the ordinate of the center line of the i th stripe that intersects this vector is d 1 . In the second image (G), the ordinate of the center line of the last stripe that intersects this vector is d 2 in (0, d 1 ). In the third image (B), the ordinate of the center line of the i th stripe that intersects this vector is d 3 in (0, d 2 ). Order:
λ i = d 1 d 2 d 1 d 3
In order to reduce the error, again, take the vector vertical downward. In the first image (R), the ordinate of the center line of the j th stripe that intersects this vector is d 3 . In the second image (G), the ordinate of the center line of the first stripe that intersects this vector is d 2 in (0, d 3 ). In the third image (B), the ordinate of the center line of the first stripe that intersects this vector is d 1 in (0, d 2 ). Order:
λ j = d 3 d 2 d 3 d 1
The skewing coefficient is defined as:
k λ = i = 2 m λ i + j = 2 n λ j m + n
In general, m, n > 5 in the above equation, but if the number of stripes is small due to a low frequency or a long distance, m, n and i, j can be reduced simultaneously.
Moreover, for LED5 and LED6, the number of image stripes separated by the receiver is different due to the different frequencies of the three channels at the transmitter. In this case, periodic chaos exists when the phase difference is extracted. Therefore, in the system composed of a transmitter like LED5 or LED6, only five effective features except skewing can be extracted.
The above is the process of feature extraction. However, there is a situation that needs to be considered: when the natural light or other non-system light in the environment is very strong, the contrast between the bright and dark stripes of the LED project in the image captured by the sensor will be reduced. This problem can be solved based on our previous work [16]. An algorithm named contrast limited adaptive histogram equalization (CLAHE) was proposed in Ref. [16]. It can enhance the contrast of the image itself when there is interference from external light.

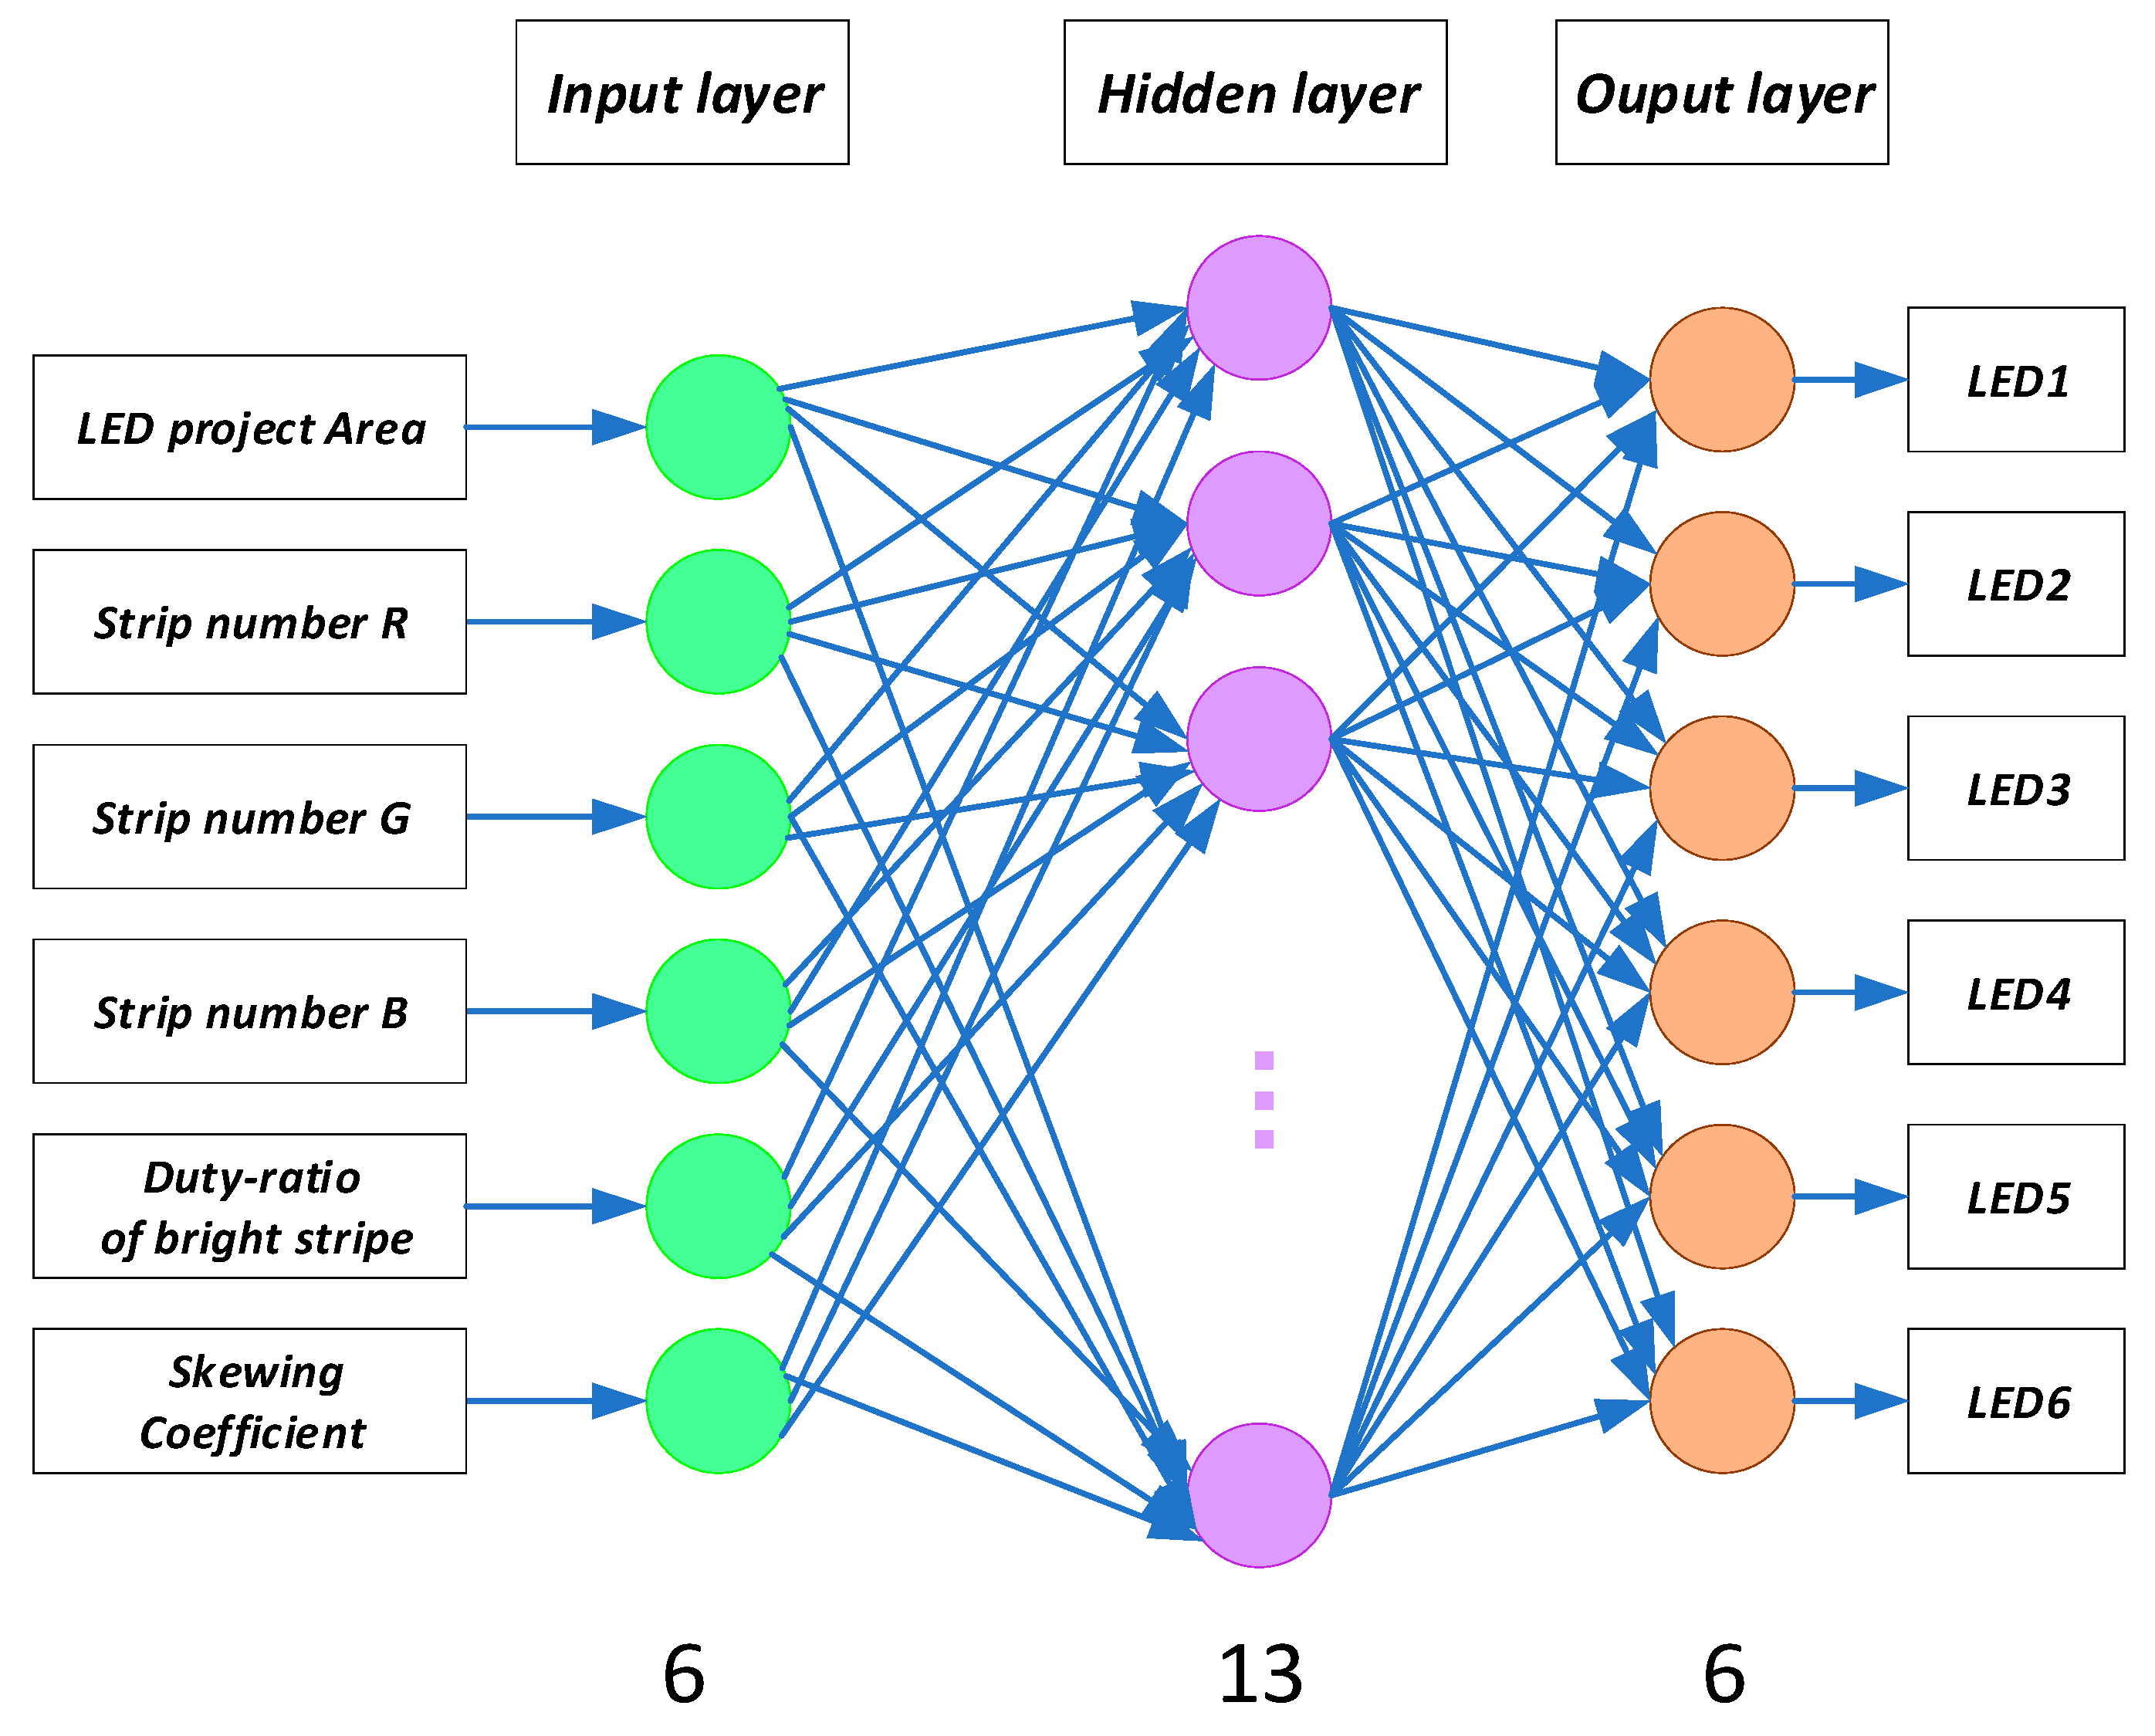
3.4. LED Recognition

Machine Learning

We extracted six features, so the feature space is six-dimensional space; that is, all test set data are in a six-dimensional space (data from a system similar to LED5 and LED6 is five-dimensional). Furthermore, in our case, for two different LEDs, data is linearly separable. To achieve the recognition of RGB-LED-IDs, in the machine learning field, there are two typical linear classifiers that can be used in this case: a linear support vector machine (SVM) and a back propagation network (BP-network).
Select training samples and test samples: 150 groups of LED-ID images taken at different distances were selected, where 120 groups were used as training samples, and the other 30 groups were used as test samples. Part of the input data and classification are shown in Table 1.
• Support Vector Machine
SVM is based on the concept of decision planes that define decision boundaries. A decision plane is one that separates between a set of objects having different class memberships. For the linearly separable samples, the optimal classification hyperplane can separate the instances into two categories [22]. We briefly introduce the mathematical principles of SVM as follows: For a two-class case, let the xi, i = 1,2, …, n, (n = 4 in our case) be the feature vectors of the training set x. The general SVM classification can be described as a mathematical optimization problem:
arg min w , b 1 2 w 2 s . t . y i ( w T x i + b ) 1
Once more, the goal is to find a hyperplane that classifies all the training vectors correctly:
f ( x ) = w T x + b
where w determines the direction of hyperplane, which has the same dimension of x, w T represents the transpose of w, and b determines the exact position of the hyperplane in space. Such a hyperplane is not unique, therefore we define the geometrical margin as:
z = | f ( x ) | w
which represents the geometrical distance from the samples to the hyperplane. To get the optimal hyperplane, we aim to maximize Z. Since the value of | f ( x ) | can be changed by scaling w and b, when we make it equal to 1, the solution we have to find is to search the maximum 1 w .
With the help of a Laplace operator, the problem is:
f ( x ) = i = 1 n y i α i x , x i + b
where y i is the corresponding class indicator of xi (+1 for w1, −1 for w2), α i is the Lagrange multiplier, and x , x i represents the vector inner product. A schematic diagram of the SVM classification is shown in Figure 13.
• BP-Network
Artificial neural networks (ANNs) also known as neural networks (NNs), which are based on the physiological research results regarding the brain, is a mathematical model of a simulation of a biological neural network to process information, to simulate certain mechanisms of the brain, to achieve some aspect of function. Self-organizing competitive neural networks and BP neural networks are usually used for classification and pattern recognition [23]. In our case, the BP neural network classifier is designed to classify the different LED-IDs.
Initialize the network: A random initial value of connection weights and thresholds between the nodes of each layer is established between (−1, 1), which is usually generated by random functions.
Given an input vector X k = ( x 1 k , x 2 k , , x m k ) T and expected output vector P k = ( p 1 , p 2 , , p n ) T , for network learning, the number of neurons in the input layer and output layer is m and n respectively. The number of hidden neurons has great influence on the prediction accuracy of a BP neural network.
At present, l = 2n + 1 is usually used to calculate the number of hidden layer nodes.
Calculate the output of the hidden layer and output layer using:
y j = f ( i w j i x i θ j ) = f ( n e t j )
z l = f ( i v j i y i θ l ) = f ( n e t l )
In the formula, y j is the output of hidden layer; w j i is the weights between input and hidden layer; x i is the input layer; θ j is the threshold of hidden layer; z l is the output of output layer; v j i is the weights between the hidden and output layer; θ l is the threshold of output layer; and f is excitation function of S type, f ( x ) = 1 1 e x .
The error of the output node is:
E = 1 2 l ( t l f ( j v l j f ( i w j i x i θ l ) ) 2
In the formula, t l is the expected output value of the output node.
By modifying the weights and thresholds from the output layer, the error back propagation to modify the weights of each layer to minimize network error, as follows:
w j i ( k + 1 ) = w j i ( k ) + η δ j x i
θ j ( k + 1 ) = θ j ( k ) + η δ j
In the formula, η is the learning coefficient, and δ j is the node error.
In general, three layers of the BP network can be done in any mode of classification; thus, we chose the three layers of the BP network in our case. There are six types of feature data, so n = 6. According to l = 2n + 1, the number of neurons in the hidden layer is 13. Therefore, a 6-13-6 BP network is structured, which is shown in Figure 14.

4. Experiment and Analysis

In this section, we elaborate on the experiment and analysis of the framework proposed by us. The RGB-LED we used were normal RGB-LEDs (9W). We programmed them with a laptop and used an STM32F407 (Xingyi Electronic Technology Co., Ltd., Guangzhou, China) to transmit signals. The three output ports of the STM32 respectively controlled the three diodes in the RGB-LED. In the receiver subsystem, a Samsung’s Galaxy S8(Designed by Samsung, Seongnam, Korea; Made in China, Huizhou Samsung Electronics Co., Ltd., Huizhou) camera was used to capture the image data, and then the captured image was processed by using the MATLAB software (Developed by MathWorks, Natick, MA, USA) in a computer with the proposed system. The relevant parameters are shown in Table 2.

4.1. Frequency and the Bright Stripe’s Duty-Ratio Detection Error Analysis

When the modulation of the frequency of the LEDs increases, the stripe will become dense at the same distance, which means the error of duty ratio of bright stripe is large. If the duty ratio of the strip can be correctly extracted, the number of the strip can be accurately obtained. However, accurate identification of the number of bright stripes does not guarantee the exact duty cycle. Therefore, in the case of a duty-ratio of 50%, we swept the frequency from 0.1 to 10 kHz in 500 Hz steps and evaluated the ability of the duty-ratio regarding bright stripe detection.
On the other hand, the performance of different modulation frequencies varied greatly at different distances. In practical applications, distance should match the appropriate frequency as far as possible. Therefore, it is necessary to explore the relationship between distance, frequency, and recognition rate.
The relationship between the transmission frequency and the absolute value of the bright stripe’s duty-ratio recognition is shown in Figure 15.
As can be seen from Figure 15, when the system is used in practice, the transmitter with a relatively low frequency should be preferred when the receiver is close to the transmitter, and the transmitter with a relatively high frequency should be preferred when the receiver is far away from the transmitter. Moreover, it can be seen that 8 kHz is a high frequency critical point; higher than 8 kHz, and the recognition rate has dropped dramatically, and the system will fail.

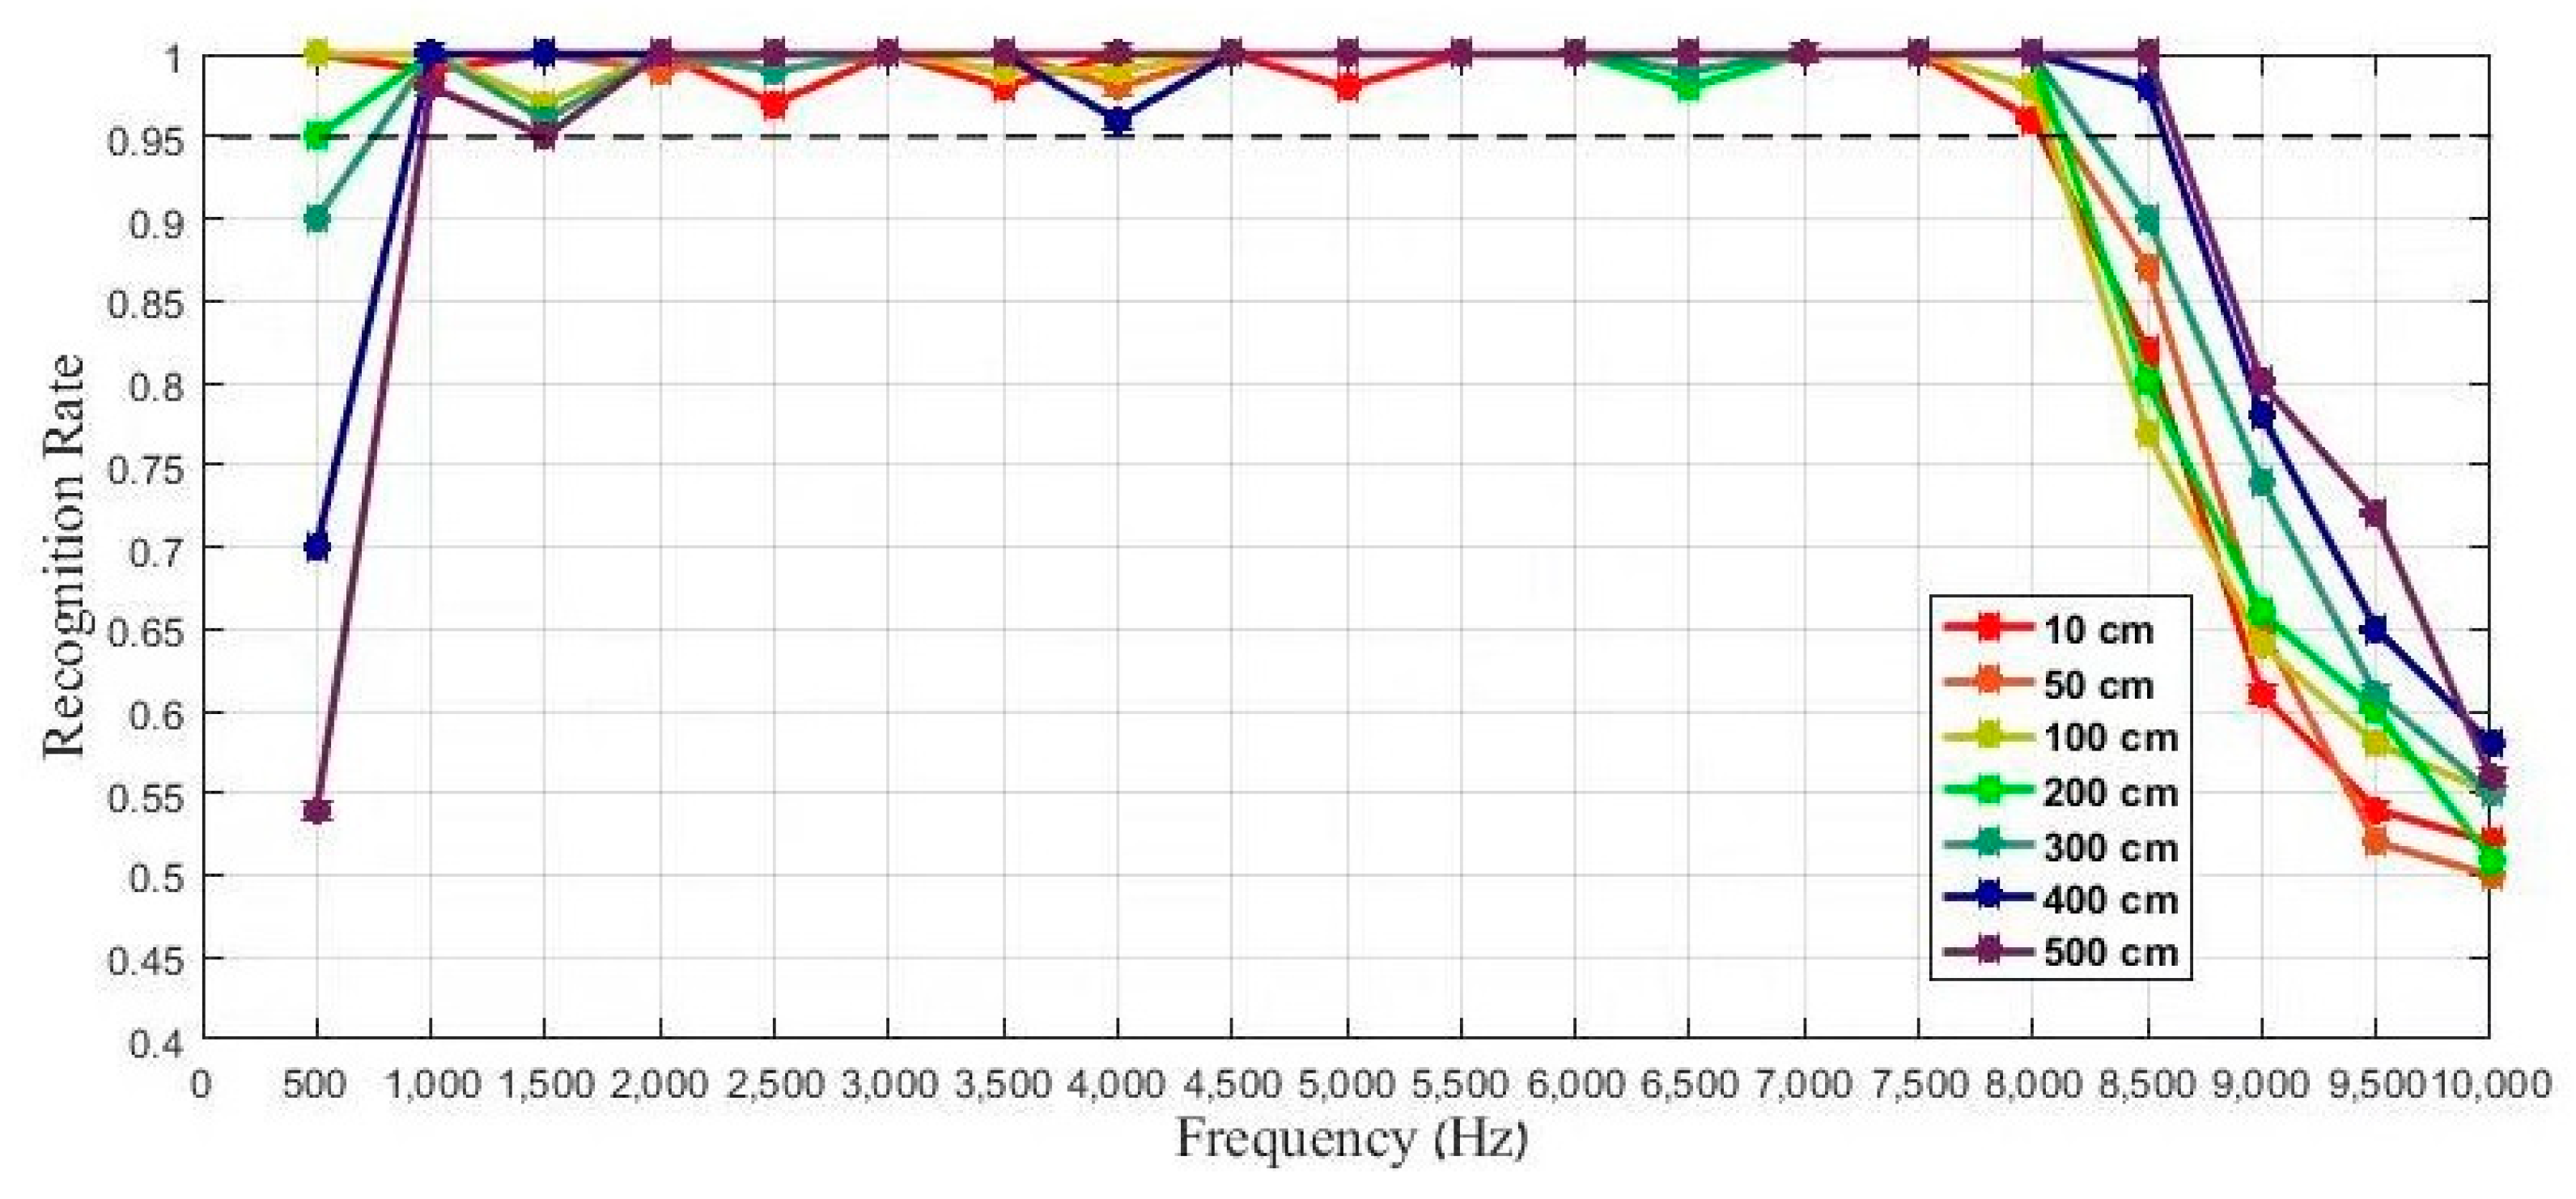
4.2. Frequency Resolution and LED-ID Recognition Analysis

At the same distance, with the increase of frequency, the number of stripes increases. Increasing the number of stripes also causes the stripes to become dense. Therefore, the accuracy of feature extraction will be reduced, which will affect the classifier’s training and recognition. This section tests the impact of different frequency resolution on the LED-ID recognition rate, and the experimental results are as follows.
When the minimum frequency resolution was smaller than a certain critical value, both of the recognition rates for ANN and SVM dropped sharply. We can see from Figure 16 that this critical value is 50 Hz.

4.3. Skewing Resolution and LED-ID Recognition Analysis

A modern color camera system is based on Bayer filter, where the color information recorded by the camera is estimated according to certain rules [24], so there is always some error when we take the skewing of the images. When the phase difference of the input signal at the transmitter is too small, it will seriously affect the feature detection and recognition. This section tests the impact of different phase different resolution on the LED-ID recognition rate. For ease of understanding, instead of using the skewing coefficient as the transverse axis, we use the phase difference of the transmitter signal as the transverse axis. The experimental results are given in Figure 17.
It can be seen from Figure 17 that the recognition rate of ANN and SVM decreased greatly when the phase difference resolution was less than 20°.Because 360 ° 20 ° = 18 , there are A 18 3 = 4698 different combinations of species caused by phase differences of the transmitter signal.
Through experiments 4.1–4.3, and the conclusion of experiment 3.1~3.2 in our previous work in Ref. [17], which illustrates that the detection accuracy of the bright stripe’s duty-ratio would not affect the training of classifiers, we can know the proposed scheme of LED recognition. With a modulation bandwidth of 0.1 to 8 kHz, frequency resolution of 60 Hz, and nine different duty-ratios in each frequency, this could offer roughly 8000 100 50 × 9 × A 18 3 = 6,680,556 unique LED-ID and systems with different transmission frequencies for three channels can offer roughly A 158 3 = 3,869,736 ( 8000 100 50 = 158 ) different unique LED-IDs. The total is about 1.05 × 10⁷ . This amount is far greater than our previous work in Ref. [17]. It can meet the quantity requirement of a complement technology of QR code, and with the development of camera technology, the proposed method would provide more channels for LED recognition.

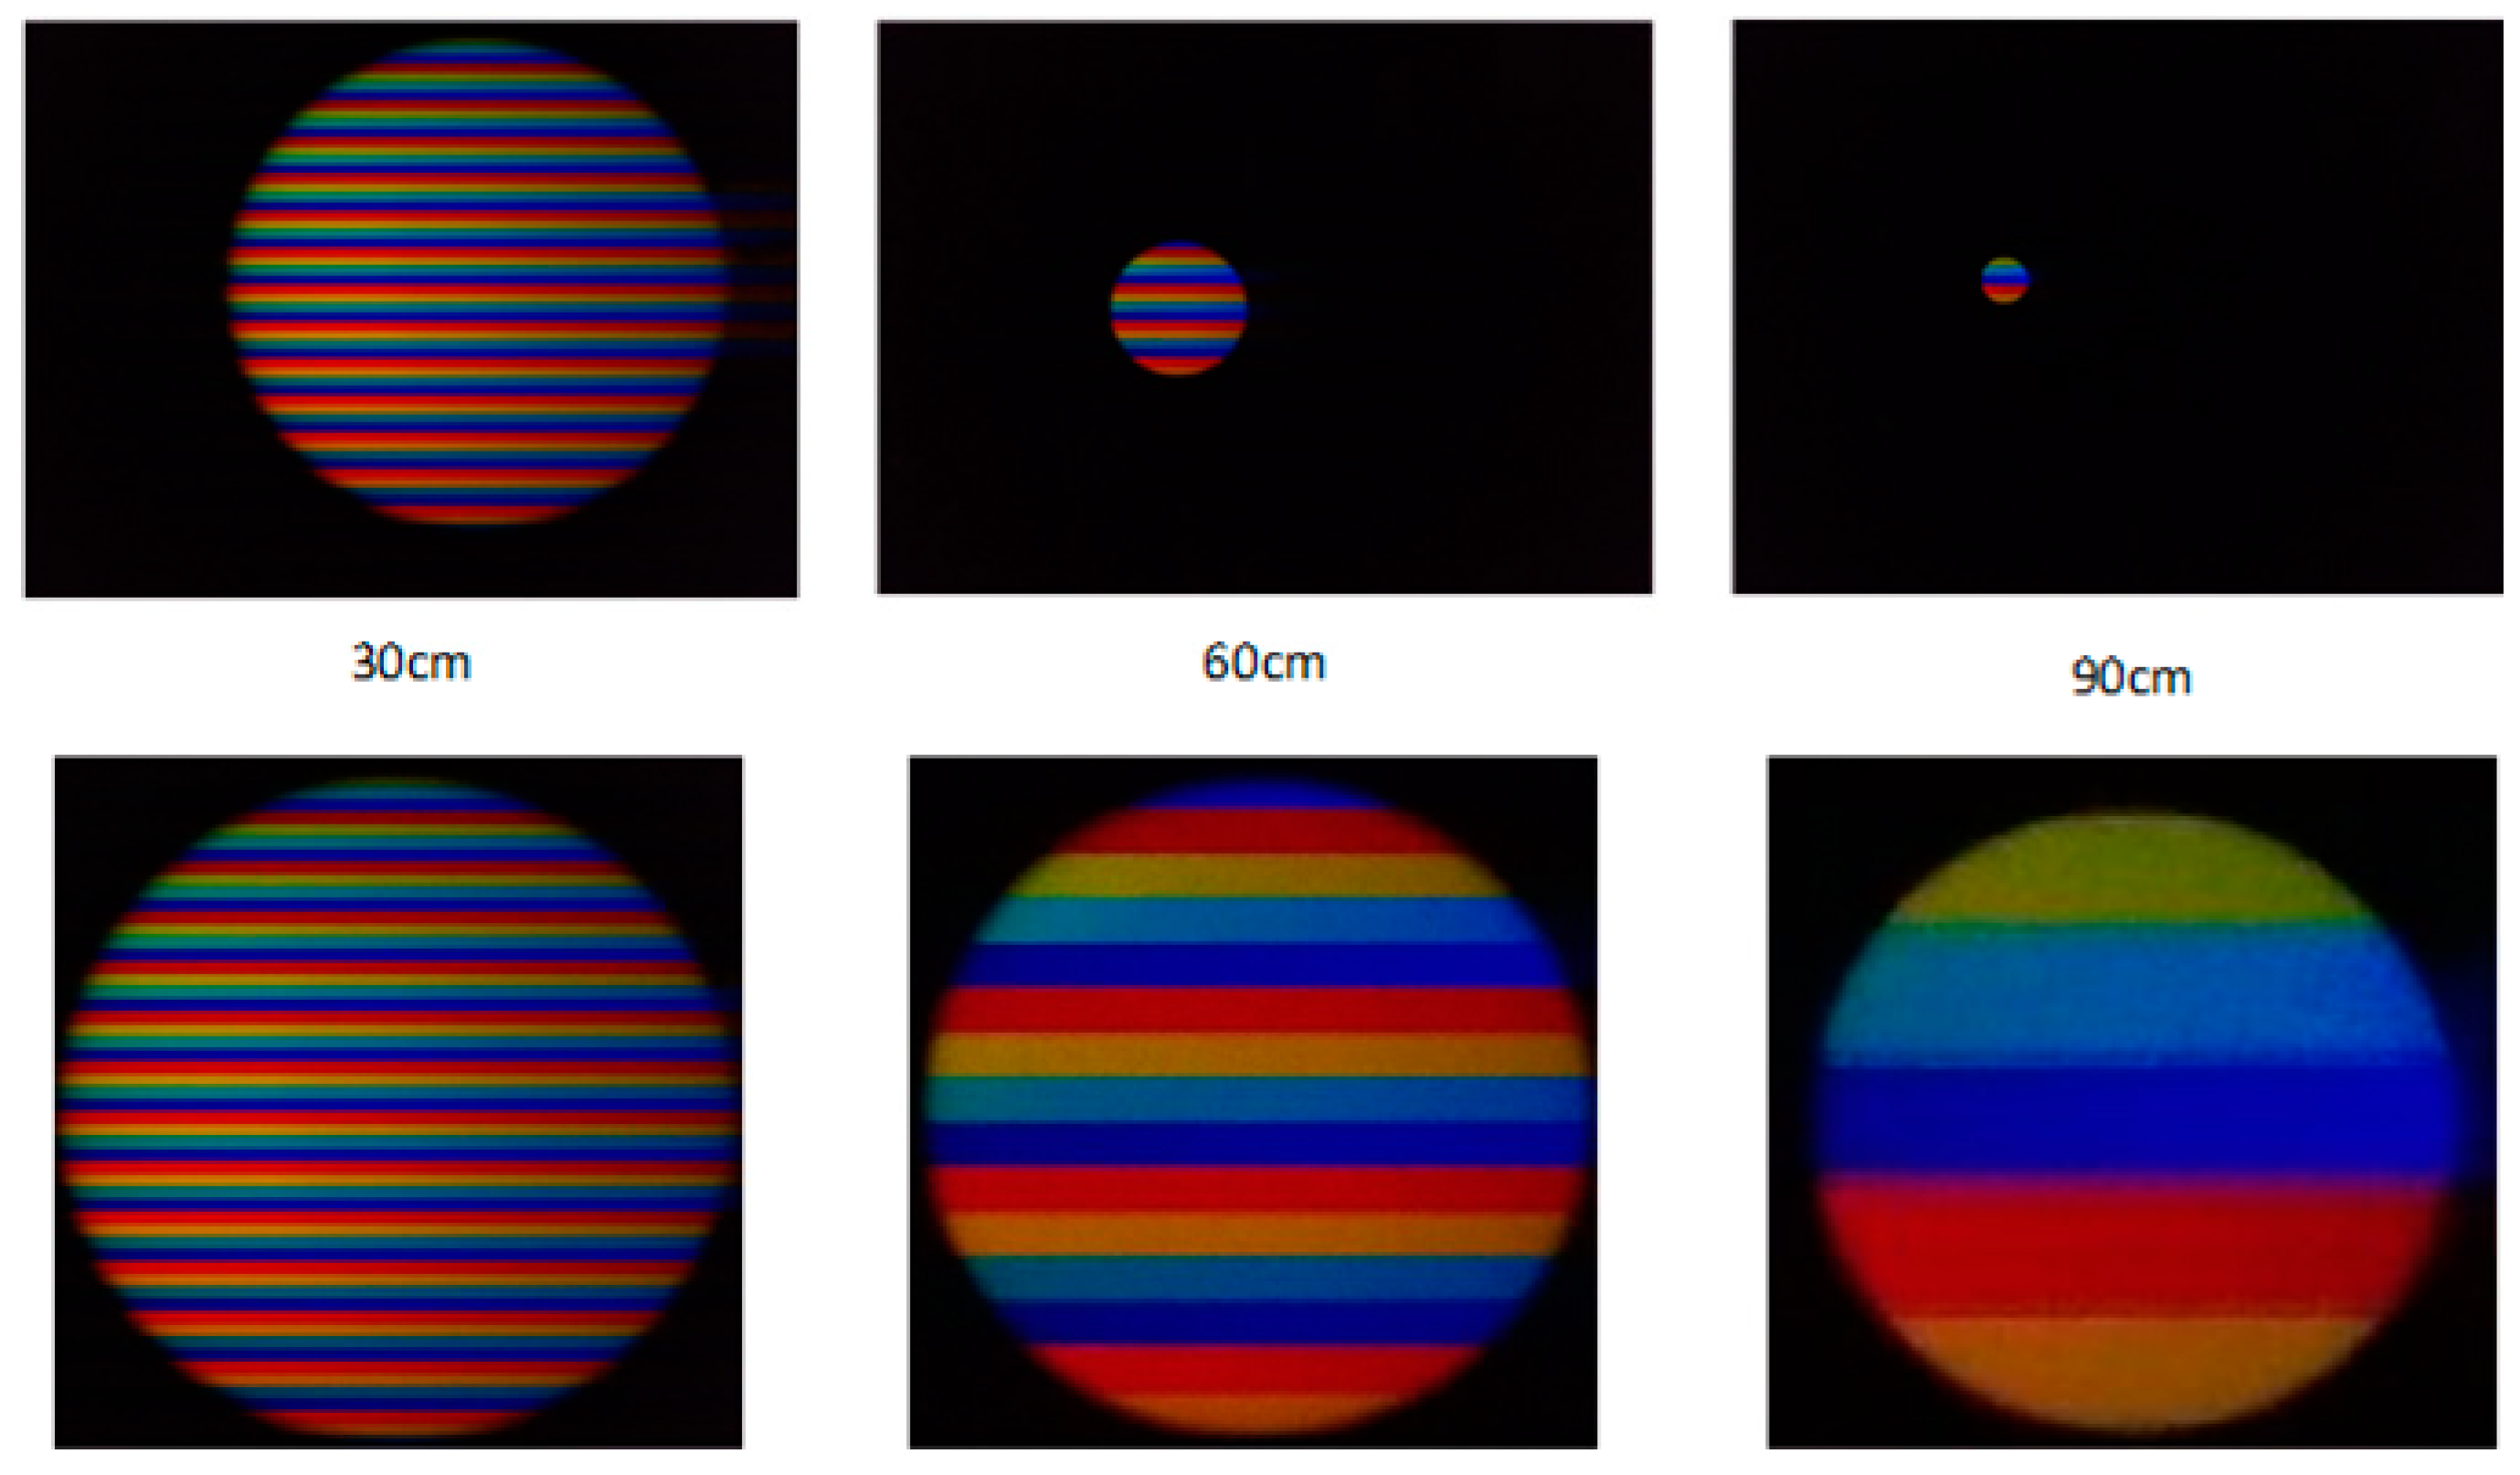
4.4. Comparison Experiment of Recognition Distance with QR Code

Compared with QR codes, one of the prominent advantages of OBC is the long effective distance. In this section, by increasing the distance between the receiver and transmitter, we compared the performance of OBC and QR codes whose area is the same as the LED’s luminous area. The recognition rate data of QR code is obtained from the scanning function of QR code in many Applications in the smartphone used in the experiment. Under the condition of no magnification, scanning within 5 s is considered a successful recognition. The result is shown as Figure 18.
As shown in the Figure 18, when the distance is greater than 3.5 m, the recognition rate of QR code drops sharply and almost loses the recognition ability, but the OBC still maintains a high recognition rate at 6 m.

4.5. Contrast Experiment with QR Code in Dark Condition

Another advantage of OBC over QR codes is that it can work well in the dark. We still use the QR code in the previous section. We tested and compared the performance of OBC and QR codes under different lighting conditions, we did experiments in the room with the indoor light source switched off completely, and recorded the recognition rate at different times, which are shown in Figure 19.
It can be seen from Figure 19 that the dark condition completely beats the QR code.
Through experiments 4.4–4.5, we can conclude that the OBC is superior in distant and dark conditions. It is feasible to use it as a complementary technique for QR code.
Figure 20 is the receiver platform we use.

4.6. Comprehensive Analysis

To simulate the real environment, a comprehensive experiment was designed to explore the combined effects of above parameters. We randomly selected 20 LED-IDs that we used in the previous section to explore the effect of each feature on recognition rate. The feature data of these LED-IDs is shown in Table 3. A total of 120 groups were used as training samples, and the other 30 groups were used as test samples for each class.
The average training time was 2.304 s and the total image processing/classifying time was 9.47 ms. The recognition rate of these LED-IDs is shown in Figure 21. It can be seen from Figure 21 that the recognition rate of most LED-IDs was 100%.
This was undertaken in a laboratory scenario. In the future, the system can be applied to more extensive scenarios. Although the system needs pre-training, the user can specify the number of LED-IDs needed and then extracts them from the LED-ID library we have built. The cost is not very high in this way, but it can achieve a fairly satisfactory recognition rate and robustness. At the same time, we can see that the total processing/classifying time was very short when the system was in use, reaching the millisecond level. Last, there is no need to pay too much attention to training time, because users will use trained classifiers.
What is more, our system can be implemented in many large-scale scenarios, not just in the lab. First of all, in the field of fast payment, scanning a QR code to pay is widely used now. However, it also has some limitations. In dark and distant conditions, it will fail. OBC with a longer effective distance can reduce the queuing time for payments in some cases. Then, in the field of future autopiloting, we can use our system for traffic control. When the vehicle arrives at the designated node, the onboard camera captures the OBC and downloads the road information on the cloud server to perform the corresponding operation. In the outdoor advertising field, the system can also be used. Because the area of an advertising light board is limited, it cannot accommodate a lot of information, and it is limited to static information. By loading our OBC in the advertising light board, you can link to other web pages for more information. Additionally, in the field of indoor positioning, GPS tends to show weakness. Many scholars have proposed localization algorithms based on visible light communication in recent years [24,25,26]. However, these high-precision algorithms cannot be correctly labeled LED. It is rare to see the work of LED calibration in this field. Our system can solve this problem well.

5. Conclusions

In this paper, an optical bar code (OBC) detection and recognition method based on visible light communication using machine learning is proposed as a complement to QR code technology. To provide a high robustness, widely used LED-ID identification scheme and a huge number of unique LED-ID, we translated the problem into an OBC recognition problem in the machine learning field using RGB-LEDs as the transmitters. A variable frequency, duty-ratio, and phase difference PWM method was employed to create different features for different LEDs. Therefore, in the feature space, the features of different LED-IDs are linearly separable. Once the proposed image processing method realized the feature extraction and selection of LED-IDs, an ANN or SVM could be used to identify LED-IDs.
As the experiment result shows, the proposed scheme could offer roughly 1.05 × 10⁷ unique LED-IDs with a greater than 95% LED-ID recognition rate. Moreover, the number can be more by using LEDs of different shapes and combining shape recognition. The effective working distance of the system could reach up to 6 m, which is significantly farther than QR code. Furthermore, with the upgrade of the camera technology, the proposed method would offer more unique LED-ID and the maximum distance between the transmitter and receiver would also increase. Therefore, the OBC can be applied as a complement to QR code technology.

Author Contributions

Conceptualization, G.W.; Data curation, L.J.; Investigation, L.J.; Software, L.J.; Writing—original draft, L.J.

Funding

This work supported by National Undergraduate Innovative and Entrepreneurial Training Program (No. 201810561195, No. 201810561218, No. 201810561219, No. 201810561217), Special Funds for the Cultivation of Guangdong College Students’ Scientific and Technological Innovation (“Climbing Program” Special Funds) (pdjh2017b0040, pdjha0028), Guangdong science and technology project (2017B010114001).

Conflicts of Interest

The authors declare no conflict of interest.

References

  1. Castillo, A.; Thierer, A.D. Projecting the Growth and Economic Impact of the Internet of Things. Soc. Sci. Electron. Publ. 2015, 39, 40–46. [Google Scholar] [CrossRef]
  2. Marktscheffel, T.; Gottschlich, W.; Popp, W.; Werli, P.; Fink, S.D.; Bilzhause, A.; de Meer, H. QR code based mutual authentication protocol for Internet of Things. In Proceedings of the World of Wireless, Mobile and Multimedia Networks, Coimbra, Portugal, 21–24 June 2016; pp. 1–6. [Google Scholar]
  3. Tsiropoulou, E.E.; Gialagkolidis, I.; Vamvakas, P.; Papavassiliou, S. Resource allocation in visible light communication networks: NOMA vs OFDMA transmission techniques. In Proceedings of the International Conference on Ad-Hoc Networks and Wireless, Lille, France, 4–6 July 2016; pp. 32–46. [Google Scholar]
  4. Singhal, C.; De, S. (Eds.) Resource allocation in next-generation broadband wireless access networks; Springer: Cham, Germany, 2017. [Google Scholar]
  5. IGI Global, Bykhovsky, Dima, and Shlomi Arnon. Multiple access resource allocation in visible light communication systems. J. Lightw. Technol. 2014, 32, 1594–1600. [Google Scholar] [CrossRef]
  6. Kim, W.-C.; Bae, C.-S.; Jeon, S.-Y.; Pyun, S.-Y.; Cho, D.-H. Efficient resource allocation for rapid link recovery and visibility in visible-light local area networks. IEEE Trans. Consum. Electron. 2010, 56, 524–531. [Google Scholar] [CrossRef]
  7. Jovicic, A.; Li, J.; Richardson, T. Visible light communication: Opportunities, challenges and the path to market. IEEE Commun. Mag. 2013, 51, 26–32. [Google Scholar] [CrossRef]
  8. Karunatilaka, D.; Zafar, F.; Kalavally, V.; Parthiban, R. LED Based Indoor Visible Light Communications: State of the Art. IEEE Commun. Surv. Tutor. 2015, 17, 1649–1678. [Google Scholar] [CrossRef]
  9. Zheng, D.; Chen, G.; Farrell, J.A. Joint measurement and trajectory recovery in visible light communication. IEEE Trans. Control Syst. Technol. 2017, 25, 247–261. [Google Scholar] [CrossRef]
  10. Fang, J.; Yang, Z.; Long, S.; Wu, Z.; Zhao, X.; Liang, F.; Jiang, Z.L.; Chen, Z. High-speed indoor navigation system based on visible light and mobile phone. IEEE Photon. J. 2017, 9, 8200711. [Google Scholar] [CrossRef]
  11. Zhang, B.; Ren, K.; Xing, G.; Fu, X.; Wang, C. SBVLC: Secure barcode-based visible light communication for smartphones. IEEE Trans. Mobile Comput. 2016, 15, 432–446. [Google Scholar] [CrossRef]
  12. Chen, H.-W.; Wen, S.S.; Liu, Y.; Fu, M.; Weng, Z.C.; Zhang, M. Optical camera communication for mobile payments using an LED panel light. Appl. Opt. 2018, 57, 5288–5294. [Google Scholar] [CrossRef] [PubMed]
  13. Cai, Y.; Guan, W.; Wu, Y.; Xie, C.; Chen, Y.; Fang, L. Indoor high precision three-dimensional positioning system based on visible light communication using particle swarm optimization. IEEE Photon. J. 2017, 9, 7908120. [Google Scholar] [CrossRef]
  14. Guan, W.; Wu, Y.; Xie, C.; Chen, H.; Cai, Y.; Chen, Y. High-precision approach to localization scheme of visible light communication based on artificial neural networks and modified genetic algorithms. Opt. Eng. 2017, 56, 106103. [Google Scholar] [CrossRef]
  15. Guan, W.; Wu, Y.; Xie, C.; Fang, L.; Liu, X.; Chen, Y. Performance analysis and enhancement for visible light communication using CMOS sensors. Opt. Commun. 2018, 410, 531–545. [Google Scholar] [CrossRef]
  16. Xie, C.; Guan, W.; Wu, X.; Fang, L.; Cai, Y. The LED-ID Detection and Recognition Method based on Visible Light Positioning using Proximity Method. IEEE Photon. J. 2018, 10, 1–16. [Google Scholar] [CrossRef]
  17. Danakis, C.; Afgani, M.; Povey, G.; Underwood, I.; Haas, H. Using a CMOS camera sensor for visible light communication. In Proceedings of the 2012 IEEE Globecom Workshops, Anaheim, CA, USA, 3–7 December 2012; pp. 1244–1248. [Google Scholar]
  18. Liu, Y. Decoding mobile-phone image sensor rolling shutter effect for visible light communications. Opt. Eng. 2016, 55, 016103. [Google Scholar] [CrossRef]
  19. Chow, C.W.; Shiu, R.J.; Liu, Y.C.; Liu, Y.; Yeh, C.H. Non-flickering 100 m RGB visible light communication transmission based on a CMOS image sensor. Opt. Express 2018, 26, 7079. [Google Scholar] [CrossRef] [PubMed]
  20. Landis, C. Determinants of the critical flicker-fusion threshold. Physiol. Rev. 1954, 34, 259–286. [Google Scholar] [CrossRef] [PubMed]
  21. Chen, P.; Yuan, L.; He, Y.; Luo, S. An improved SVM classifier based on double chains quantum genetic algorithm and its application in analogue circuit diagnosis. Neurocomputing 2016, 211, 202–211. [Google Scholar] [CrossRef]
  22. Liu, Y. The BP neural network classification method under Linex loss function and the application to face recognition. In Proceedings of the International Conference on Computer and Automation Engineering, Singapore, 26–28 February 2010; pp. 592–595. [Google Scholar]
  23. Hu, P.; Pathak, P.H.; Feng, X.; Fu, H.; Mohapatra, P. ColorBars: Increasing data rate of LED-to-camera communication using color shift keying. In Proceedings of the 11th ACM Conference on Emerging Networking Experiments and Technologies, Heidelberg, Germany, 1–4 December 2015; pp. 1–13. [Google Scholar]
  24. Neild, A.; Armstrong, J.; Wang, T.Q.; Armstrong, J. Position Accuracy of Time-of-Arrival Based Ranging Using Visible Light with Application in, Indoor Localization Systems. J. Lightw. Technol. 2013, 31, 3302–3308. [Google Scholar]
  25. Sertthin, C.; Tsuji, E.; Nakagawa, M.; Kuwano, S.; Watanabe, K. A Switching Estimated Receiver Position Scheme for Visible Light Based Indoor Positioning System. In Proceedings of the International Symposium on Wireless Pervasive Computing, Melbourne, VIC, Australia, 11–13 February 2009; pp. 1–5. [Google Scholar]
  26. Fu, M.; Zhu, W.; Le, Z.; Manko, D. Improved visible light communication positioning algorithm based on image sensor tilting at room corners. IET Commun. 2018, 12, 1201–1206. [Google Scholar] [CrossRef]
Figure 1. Sketch maps of the (a) global shutter of the CCD sensor, and (b) rolling shutter of the CMOS sensor.
Applsci 08 02425 g001
Figure 2. Average color perceived by the eye in a critical duration.
Applsci 08 02425 g002
Figure 3. System overview.
Applsci 08 02425 g003
Figure 4. Different LED images captured using a CMOS sensor (1).
Applsci 08 02425 g004
Figure 5. Different LED images captured using a CMOS sensor (2).
Applsci 08 02425 g005
Figure 6. The modulated scheme. (a)–(h) corresponds to the modulation sequence of LED1~LED6.
Applsci 08 02425 g006
Figure 7. The number of stripes varies with distance.
Applsci 08 02425 g007
Figure 8. Processing of LED features extraction.
Applsci 08 02425 g008
Figure 9. Image preprocessing.
Applsci 08 02425 g009
Figure 10. The diameter of LED project.
Applsci 08 02425 g010
Figure 11. Get the duty-ratio of the bright stripes and the number of stripes.
Applsci 08 02425 g011
Figure 12. Calculate the skewing.
Applsci 08 02425 g012
Figure 13. An example of a linearly separable two-class problem with two possible linear classifiers.
Applsci 08 02425 g013
Figure 14. BP network structure of LED-ID classification and recognition.
Applsci 08 02425 g014
Figure 15. The recognition rate at different distances with different frequencies.
Applsci 08 02425 g015
Figure 16. The recognition rate with different frequency resolution.
Applsci 08 02425 g016
Figure 17. The recognition rate with different skewing resolution.
Applsci 08 02425 g017
Figure 18. Recognition distance compare with QR code.
Applsci 08 02425 g018
Figure 19. Contrast experiment with QR code in dark condition.
Applsci 08 02425 g019
Figure 20. LED transmitter platform.
Applsci 08 02425 g020
Figure 21. The result of the comprehensive test.
Applsci 08 02425 g021
Table 1. Part of the input data and classification.
Input DataClassification
Area (Pixel2)Num RNum GNum BDu-Ra (%)Skewing
290,3332220.500000.357542LED1
1,089,8845440.500860.352153
2,949,8327770.501840.347941
281,5634440.500560.348947LED2
1,205,79491080.501490.349574
3,048,7411819190.500450.358974
269,7022230.250050.350205LED3
1,075,1314460.250860.354964
3,056,4847780.254640.358711
298,0242220.500580.684783LED4
1,270,7614450.502640.676787
3,218,4877770.504840.673067
307,7789420.501540LED5
950,33116840.501560
3,166,775291480.518990
266,0337430.502940LED6
1,027,878131170.501540
2,853,2222016100.500000
Table 2. Parameter of the Experiment.
ParameterValue
The focal length (mm)4.25
ApertureF1.7
Resolution 4032 × 2448
Exposure time (s)1/28,310
ISO100
The diameter of the LED downlight (cm)6
The power of each LED (W)9
Current of each LED (mA)85
Table 3. The parameters of different OBCs.
ClassFrequency (Hz)Skewing Coefficient (°)Distance (cm)Duty-Ratio (%)
15000.252025
210000.254025
320000.256025
430000.258025
540000.3510050
650000.3512050
760000.3514050
870000.3516050
980000.3518050
1010000.3520050
1110000.52050
1210000.52050
1310000.52050
1410000.752050
1510000.752075
1610000.7510075
1710000.7510075
181000110075
191000110075
201000110075

