Article

Microstructure Analysis of Modified Asphalt Mixtures under Freeze-Thaw Cycles Based on CT Scanning Technology

College of Transportation, Jilin University, Changchun 130025, China
*
Author to whom correspondence should be addressed.
Appl. Sci. 2018, 8(11), 2191; https://doi.org/10.3390/app8112191
Submission received: 30 September 2018 / Revised: 2 November 2018 / Accepted: 5 November 2018 / Published: 8 November 2018
(This article belongs to the Special Issue Asphalt Materials)

Abstract

:
The modifiers NTC (nano-TiO2/CaCO3) and BF (basalt fiber) were adopted to modify a base matrix asphalt mixture. The base matrix asphalt mixture and three kinds of modified asphalt mixture under F–T (freeze–thaw) cycles were scanned by computed tomography. The air voids and morphological changes of asphalt mixture were summarized by image processing technology, and the development process of F–T damage to asphalt mixture was explained from a micro-view. The porosity of NTC-modified asphalt mixture changed little, and the void distribution between base matrix asphalt mixture and NTC-BF (nano-TiO2/CaCO3 and basalt fiber) composite modified asphalt mixture was more uniform. The macro-pores in the asphalt mixture under 15 F–T cycles began to connect gradually, and the pore characteristics also changed. The number and shape of the pores changed under 15 F–T cycles. According to the state characteristics, the change amplitude of the pore characteristics of matrix asphalt mixture and NTC-BF composite modified asphalt mixture were the most stable under F–T cycles.

1. Introduction

Increasingly heavy traffic volumes require ongoing improvements in the performance of asphalt pavement. In order to achieve this goal, many measures have been taken, one of which is the modification of asphalt mixture. Tests show that the modification of asphalt mixture with nano-materials and basalt fibers can significantly improve and prolong pavement performance. Rutting and fatigue tests of nano-modified asphalt mixtures were carried out by Shafabakhsh and Ani [1]. The results showed that the addition of nano-TiO2 can improve the adhesion and toughness of asphalt mixture, and improve the rutting resistance and fatigue life of asphalt mixtures significantly. Three kinds of inorganic nanoparticles, including titanium dioxide, were used to improve the performance of asphalt mixture. The microstructure of nano-modified asphalt mixture was studied with computed tomography (CT) scanning and scanning electron microscopy. The aging resistance of nano-modified asphalt was studied with the Fourier transform infrared spectroscopy and viscoelasticity test. The durability of the asphalt mixture was improved significantly by nano-particles [2]. Sadeghnejad et al. used nano-materials as modifiers to improve the performance of hot-mix asphalt mixture. Through a rutting test, indirect tensile test and indirect tensile fatigue test of nano-modified asphalt mixture, it was found that nano-TiO2 significantly improved the mechanical properties of stone mastic asphalt (SMA) [3]. Basalt fiber, lignin fiber and polyester fiber were used by Zheng et al. to modify asphalt mixture and their high temperature stability, water stability and low temperature crack resistance were evaluated. The experimental results showed that basalt fiber is better than lignin fiber and polyester fiber in improving the performance of asphalt mixture [4]. The results showed that basalt fiber can significantly improve the crack resistance of asphalt mortar [5]. Improvement of the tensile strength of asphalt mixture by basalt fiber was evaluated by a splitting test. The results showed that basalt fiber can significantly improve the tensile strength of asphalt mixture [6]. Celauro and Pratico, studying the improvement effect of basalt fiber on an asphalt surface layer, found that basalt fiber-modified asphalt has better performance in resisting permanent deformation and increasing pavement friction [7]. The fatigue life of modified asphalt was also evaluated. The results showed that basalt fiber could improve the low temperature performance of asphalt mixture [8]. Zheng et al. found that under the coupling of chloride ion erosion and a freeze–thaw (F–T) cycle, the low temperature flexural and fatigue properties of basalt fiber-modified asphalt mixture were obviously improved over those of ordinary asphalt mixture [9].
Because of climate influence in seasonally frozen areas, asphalt pavement will be affected by the frost heave force when the water in the pores freezes, and water loss when the pore water is thawed, leading to a continuous decline in the performance of the asphalt pavement. Badeli et al. studied the frost resistance, fatigue performance and durability of asphalt pavement in the Quebec area. It was found that the addition of fiber improved the frost resistance and fatigue performance of asphalt pavement [10,11]. Éric et al. studied the water sensitivity and degradability of glass aggregate asphalt mixture under F–T cycles in cold regions [12]. Xu et al. studied the durability of rubber particle-modified asphalt mixture during F–T cycles. The results showed that the splitting tensile strength decreased, and the void increased with the increase of rubber particle content and the same F–T cycles [13]. Linares et al. used three kinds of viscoelastic constitutive equations to determine the relaxation modulus of asphalt mixture. The experimental results showed that the Prony series is the most accurate method for predicting the relaxation modulus of asphalt mixture during F–T cycles [14]. Wei et al. studied the mechanical properties of asphalt pavement under F–T cycles. The results showed that the compressive strength and elastic modulus of asphalt pavement decreased with the increase in cycles, and the rate of degradation slowed after eight cycles [15].
The performance of asphalt mixture is closely related to the adsorption of asphalt, the content of pore distribution in the framework and the structure of the asphalt mixture. Research on the development process of volume and its morphology and distribution characteristics can provide a valuable experimental basis for further understanding the damage mechanism and performance evolution law of asphalt mixtures. By analyzing the homogeneity index of asphalt mixtures, the weak position of the internal structure of the specimens can be judged. The void condition of three gradation types (AC, SMA and OGFC) is compared, and an accurate void prediction method for asphalt mixtures is established [16,17]. Zhang et al. have studied different asphalt mixtures (AC-13, AC-16, AC-20 and SMA-13). The results show that SMA-13 asphalt mixture has better compaction performance and high temperature stability than AC-13 asphalt mixture, AC-13 asphalt mixture has better high temperature stability and compaction performance than the AC-16 and AC-20 mixtures [18]. The results show that there is a linear relationship between the equivalent diameter of micro-voids and the properties of materials [19]. Castillo et al. created a finite element model of asphalt mixture structure randomly. The mechanical properties of the model were evaluated by viscoelastic constitutive relation. The effects of aggregate gradation and void fraction on the mechanical properties of the asphalt mixture were studied [20]. Wei et al. studied the void ratio, indirect tensile strength and indirect tensile stiffness modulus of modified asphalt mixture under a F–T cycle. The results showed that diatomite and SBS could reduce the void ratio of asphalt mixture [21].
In recent years, graphics processing technology has been widely used in engineering research. The method of obtaining material microstructure data by accurate processing, identification and detailed statistical analysis of the obtained graphics has been adopted by many road material researchers. Xu et al. obtained a nondestructive image of asphalt mixture samples through X-ray tomography, then extracted the parameters such as voids, average void size, connectivity porosity and void number by digital image processing technology, and established the relationship between information entropy and pore structure [22]. The internal microstructure of the specimens was established by linear tomography, and the three-dimensional model was processed using digital image processing technology. The shape and distribution of the voids and the expansion of voids were obtained. The mechanism of high temperature damage of asphalt mixture was studied [23]. Wang et al. analyzed the dispersion of recycled rubber asphalt mixture by CT and IPP image processing software. The microstructure of the asphalt mixture was studied [24]. Guo et al. carried out F–T cycle experiments on three kinds of asphalt mixture. The distribution of interstitial space and changes in the internal structure of the asphalt mixture samples were analyzed by X-ray tomography and image processing technology during F–T cycles.
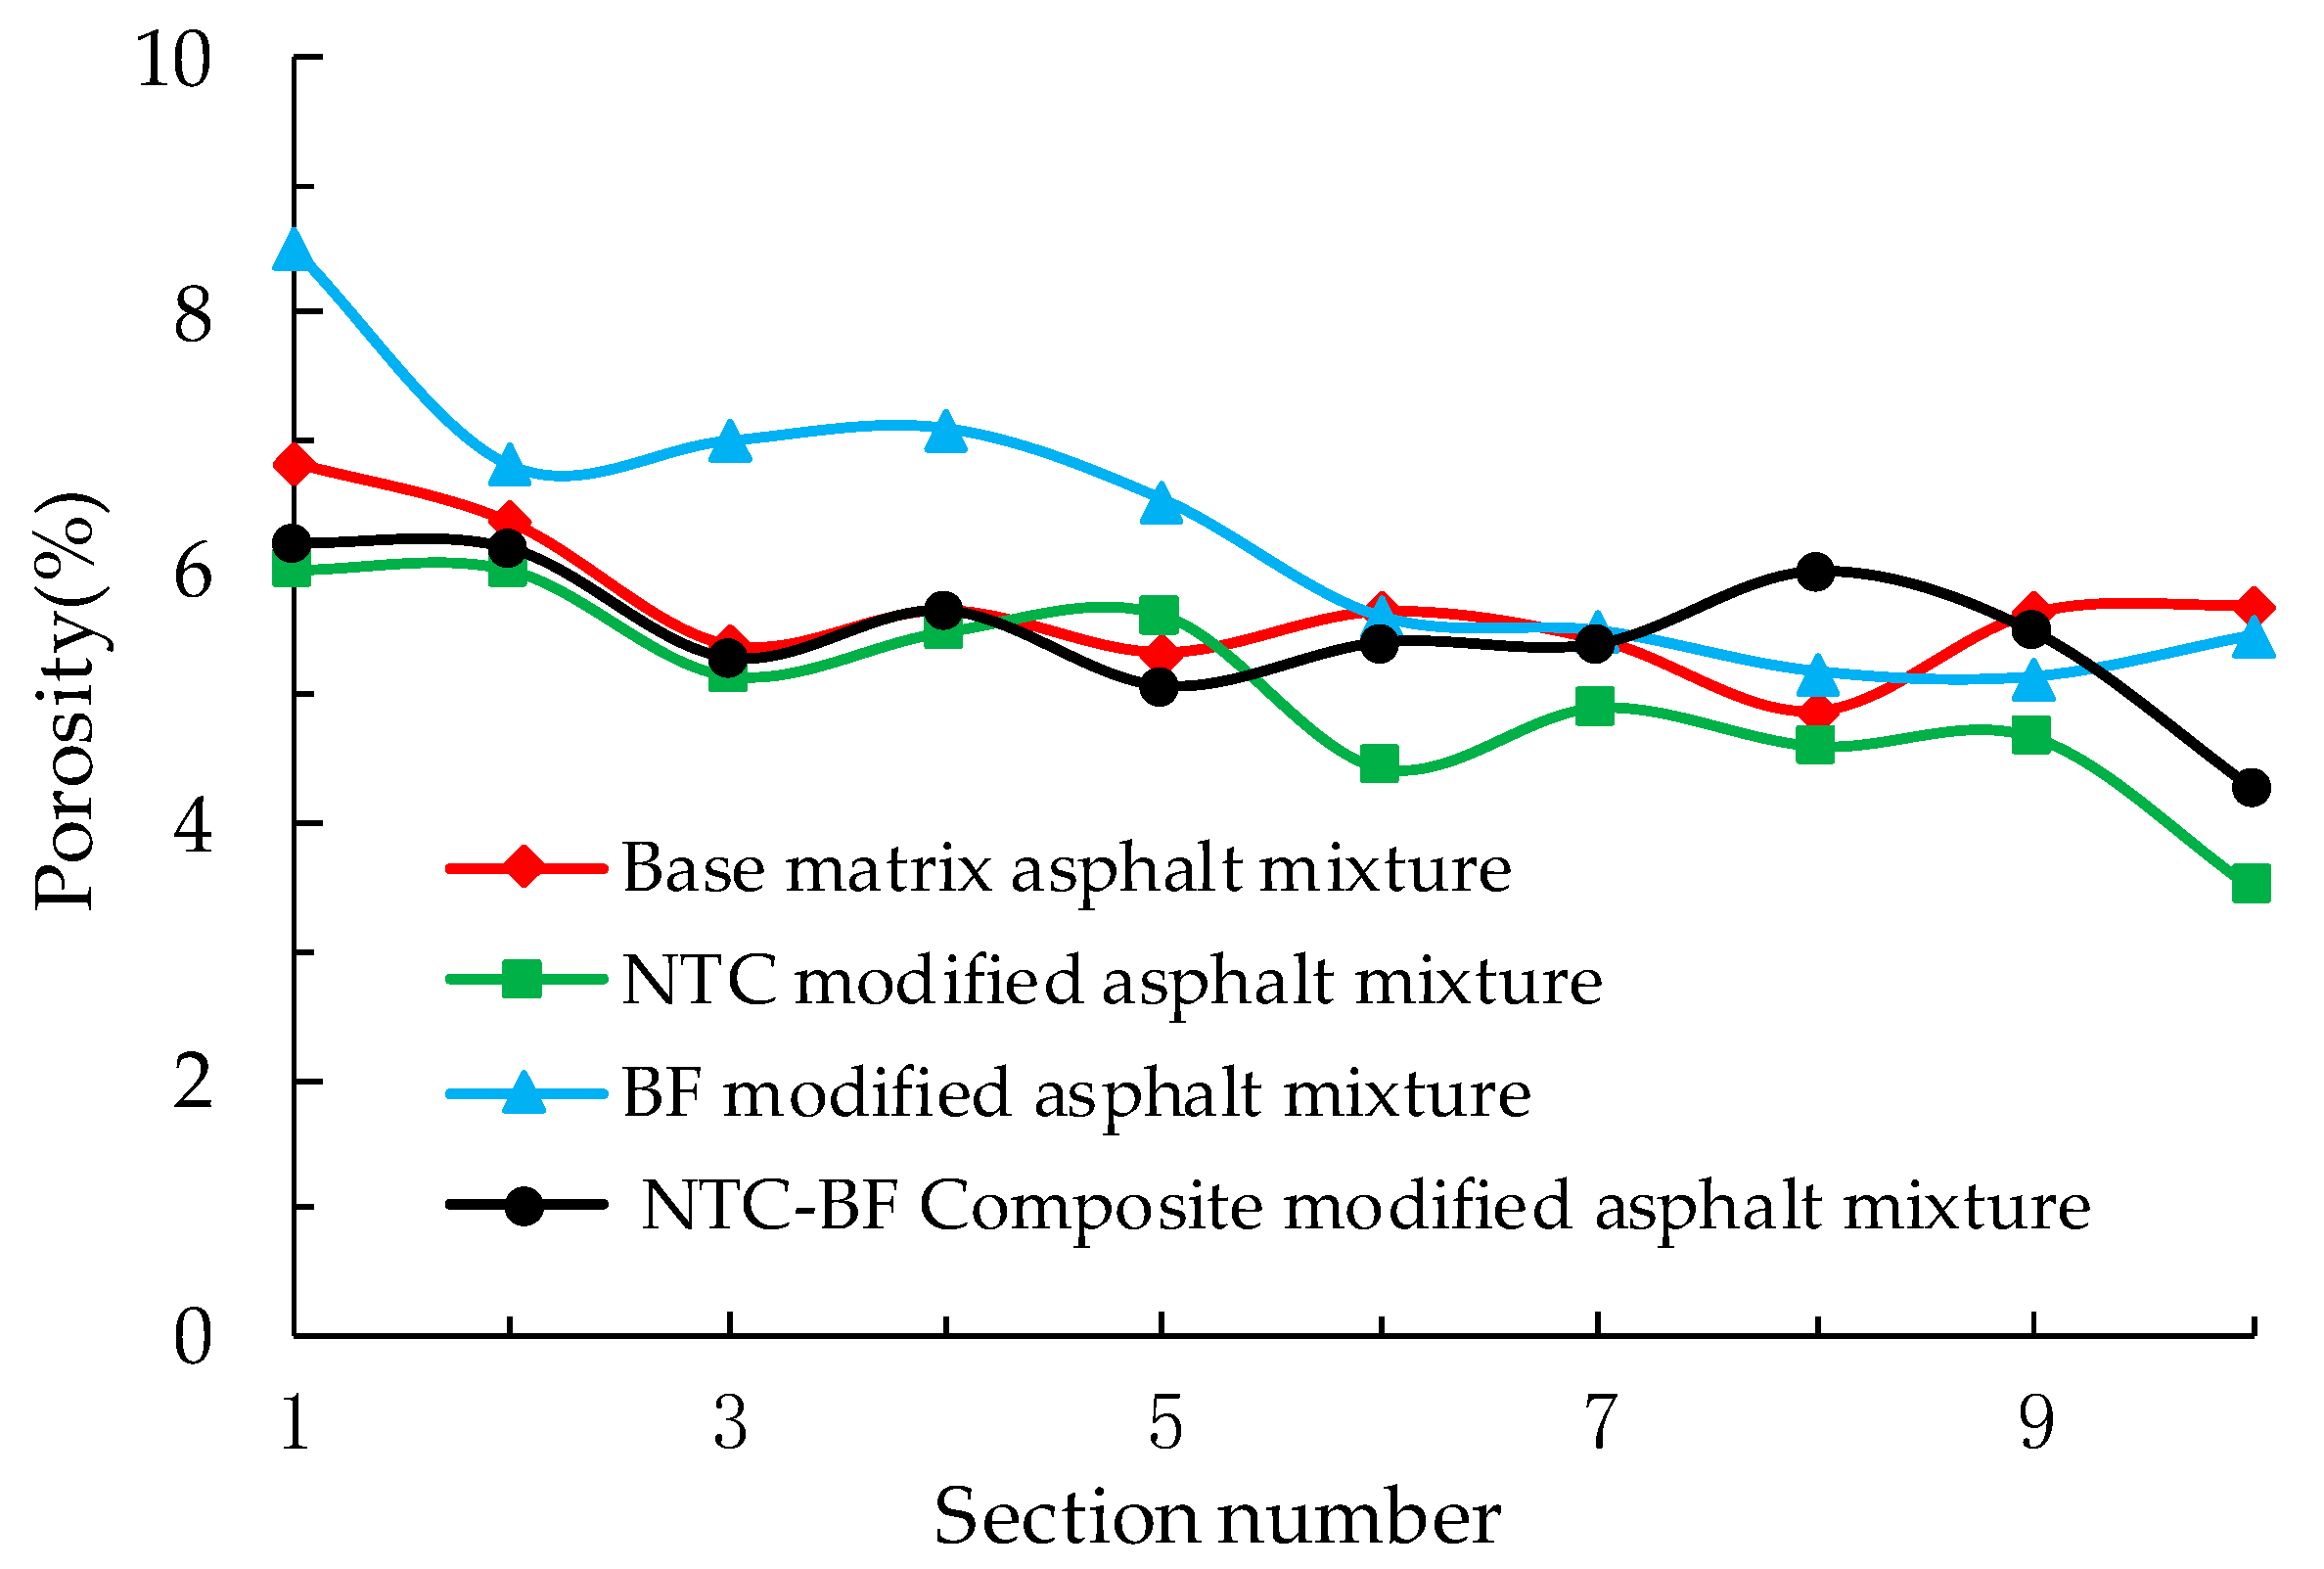
In this paper, the base matrix asphalt mixture, nano-TiO2/CaCO3 (NTC)-modified asphalt mixture, basalt fiber (BF)-modified asphalt mixture and nano-TiO2/CaCO3 and basalt fiber (NTC-BF) composite modified asphalt mixture were studied. Based on image processing technology, the CT scanning images before and after F–T cycles were obtained and processed. The pore distribution and morphology of four kinds of asphalt mixtures were studied. The influence of F–T cycles on the performance of test asphalt mixtures was analyzed from the micro point of view.

2. Materials and Methods

2.1. Raw Materials

2.1.1. Matrix Asphalt

The matrix asphalt used in this paper is AH #90 from Panjin of Liaoning Province, China. According to the Chinese standard (JTG E20-2011) [25], the penetration, softening point, ductility, Brookfield viscosity and density of asphalt are determined and listed in Table 1.

2.1.2. BF (Basalt Fiber)

The BF (shown in Figure 1) used in this paper is produced by Jilin Ningxin Basalt Industry Co., Ltd. (Jilin, China) Its technical properties are given in Table 2. The low hydrophilicity, high heat resistance and high oil absorption (oil absorption rate is 6.154%) of BF provides feasibility for its application in composite modified asphalt.

2.1.3. NTC (Nano TiO2/CaCO3)

Nano-materials are white, inorganic synthetic materials produced by Tiancheng High-tech Nano-composite Co., Ltd. in Changchun, China The molecular formula is TiO2/CaCO3, and the appearance is shown in Figure 2. It is soluble in water. The internal supporting particles are rod-shaped and the outer titanium dioxide particles are flake-shaped (diameter is 50–60 nm), with a regular structure and excellent covering power.

2.1.4. Aggregate and Filler

The coarse and fine aggregates used in this paper are from Shuangyang quarry in Jilin Province. The mineral powder is taken from Shixi of Jilin Province. Its physical properties were tested and met the requirements of JTG F40-2004.

2.2. Asphalt Mixture Preparation and Freeze–Thaw Cycles

2.2.1. Asphalt Mixture Preparation

In this study, matrix asphalt mixture, NTC-modified asphalt mixture, BF-modified asphalt mixture and asphalt mixture modified by nano-TiO2/CaCO3 and basalt fiber were made at the optimum composition ratios. The additional contents of the matrix asphalt mixture, and the modifiers, were determined according to our previous research [26]. The experimental designs of these four kinds of asphalt mixture are listed in Table 3. The gradation of asphalt mixtures including the upper limit, lower limit and design value of the aggregates are shown in Figure 3.
The test specimens were prepared in a cylinder (diameter of 101.6 ± 0.2 mm, height of 63.5 mm ± 1.3 mm) according to the compaction method of Chinese standard JTG E20-2011. [25]. The preparation procedures for the base asphalt mixture were conducted as the standard regulated. For adding NTC into the asphalt, the control asphalt and NTC were mixed using blending equipment with a speed of 4000 r/min, for 45 min. The temperature of the mixing process was 150 °C. For adding BF into the asphalt mixture, the aggregates and the BF were mixed at a temperature of 160 °C. Then asphalt or modified asphalt was poured in and mixed until the aggregates were coated. After that the weighted fillers were added and mixed well.

2.2.2. Determination of Freeze–Thaw Cycle Condition

The asphalt mixture specimens were tested to analyze their performance on the attenuation law under different numbers of freeze-thaw (F-T) cycles. The number of F-T cycles was set at 0, 5, 10 and 15. In this paper, considering the climatic conditions in Northeast China, the F–T cycle condition was determined as follows.
Step 1: Specimens were filled with water in a vacuum for 30 min and then frozen in a refrigerator at −20 °C for 16 ± 1 h.
Step 2: Specimens were completely thawed in a water bath at 60 °C ± 1 °C for 24 h.
Together, Steps 1 and 2 are considered one F–T cycle. In order to eliminate the influence of pore water on test results, the specimens were left indoors for 2 days to ensure that they were as dry as possible, and then underwent CT scanning.

3. Image Processing Technology Based on CT

The Brilliancei CT (128 rows, 256 layers) equipment produced by the Philips Company was used in this study (shown in Figure 4). The specimens of matrix asphalt mixture were scanned by the plane scanning method at a temperature of 20 °C (shown in Figure 5). For every specimen, there are nearly 100 scanning planes (the interval of each plane was 0.67 mm). All the specimens were scanned at settings of 120 KV, 100 mAs, 78 mA and 1282 ms.
The original scanning images of the test specimen were obtained and pre-processed by the “Philips DICOM Viewer” software designed for this scanner. It is essential to make an appropriate preset for further analysis. Under the guidance of scanner operators and multiple trials, the settings of W (window): 4095 and L (level): 600 were determined. The pre-processed images of the matrix asphalt mixture before freeze–thaw cycles and after five freeze–thaw cycles are given as an example in Figure 6.
In this study, the specimens of base matrix asphalt mixture and three kinds of modified asphalt mixtures were scanned by CT after 5, 10 and 15 F–T cycles, respectively. The pre-processed images were further processed by ImageJ software to analyze the porosity and pore morphology of specimens under the influence of freeze–thaw cycles. This further processing technology of images is achieved by enhancement, denoising, threshold cutting and binarization., which are introduced as follows.

3.1. Image Enhancement

The aim of this process is to achieve the optimum visualization of the image. In this study, the spatial domain method was used to enhance the image at an early stage. First, the image was converted to 8-bit type. The image can display gray levels of 0~255 under this condition. Then, the enhancement contrast was conducted. The pixel saturation is set to 0.3% to enhance the contrast.

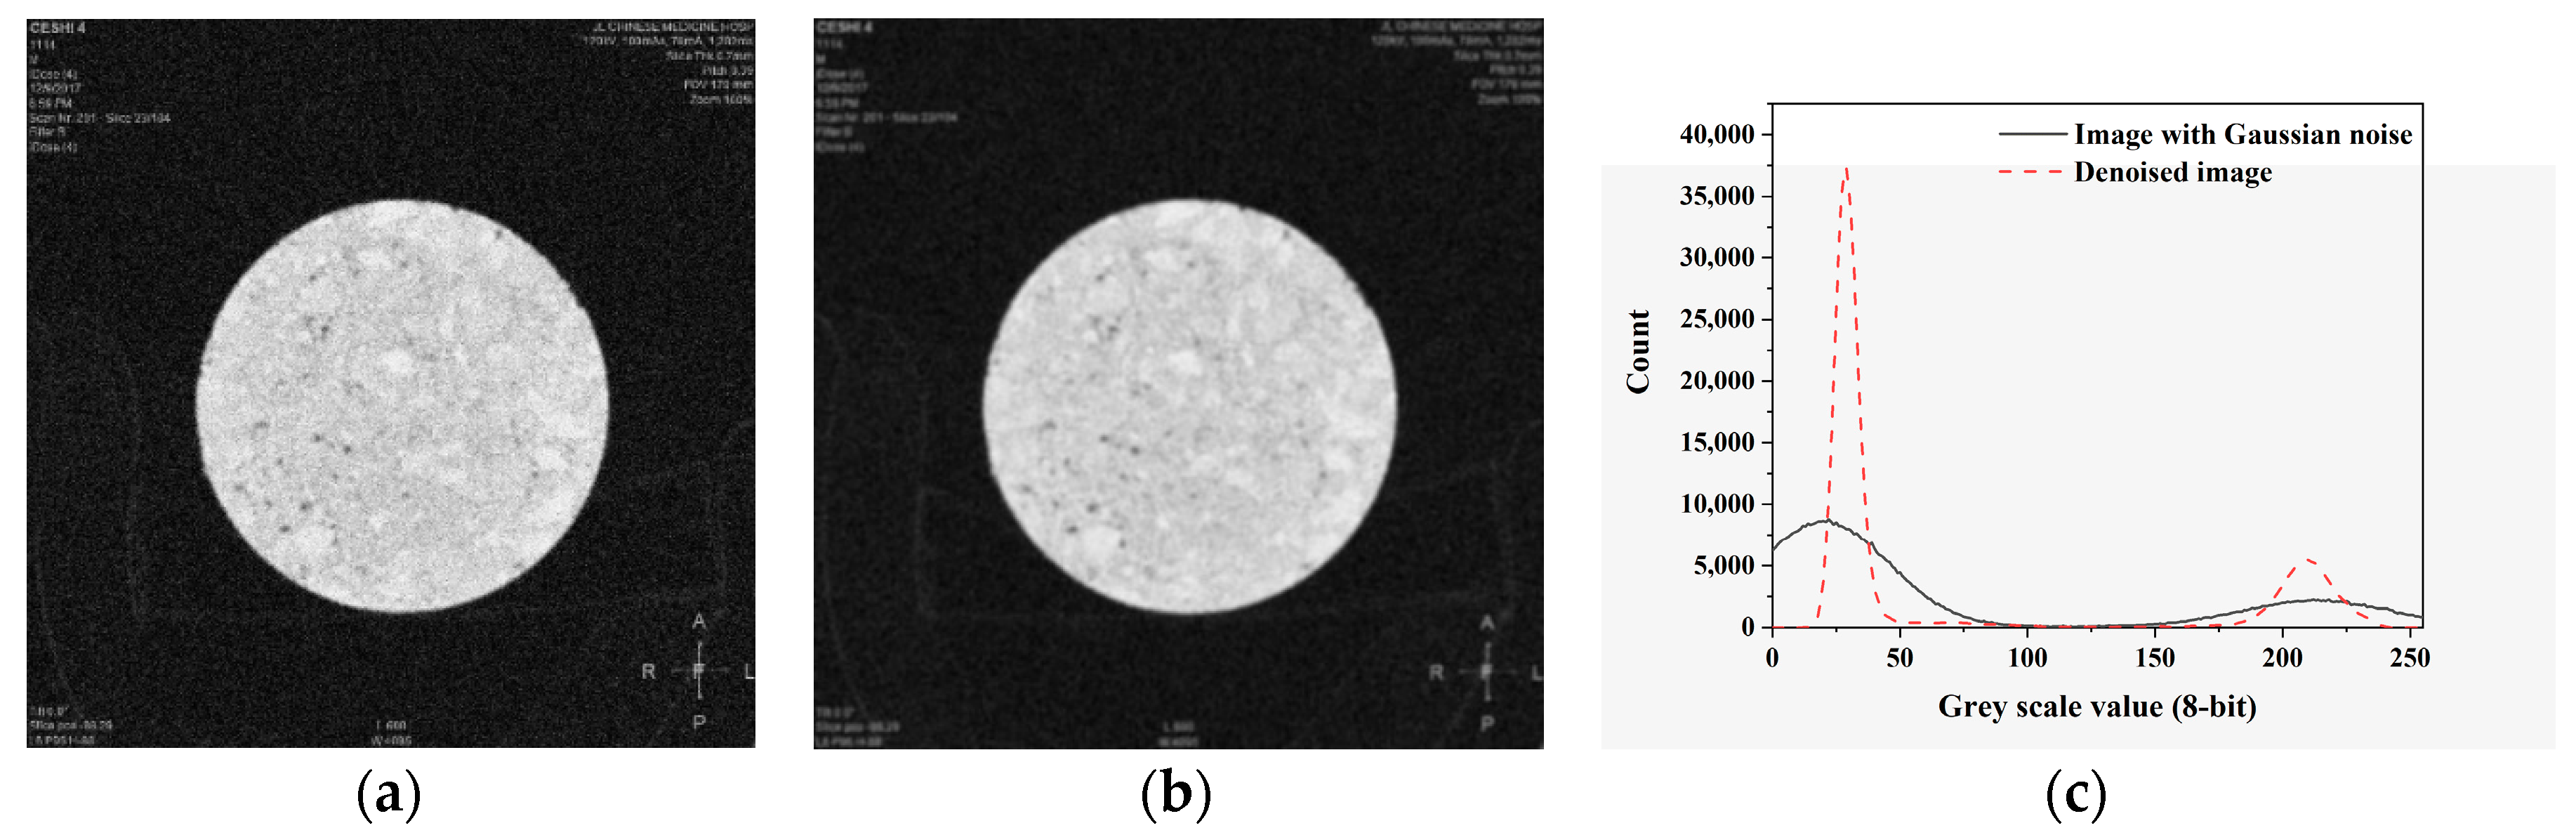
3.2. Image Denoising

In order to remove the influence of external environmental factors and equipment on electric images, the process of image denoising is essential. In this study, the enhanced images were denoised by means of a mean filtering method using Image J. First, Gaussian noise (mean = 0, standard deviation = 25) was added to the enhanced CT image. Then, the radius of pixels of 2.0 was determined as the optimum setting for the images.

3.3. Threshold Cutting and Binarization of Images

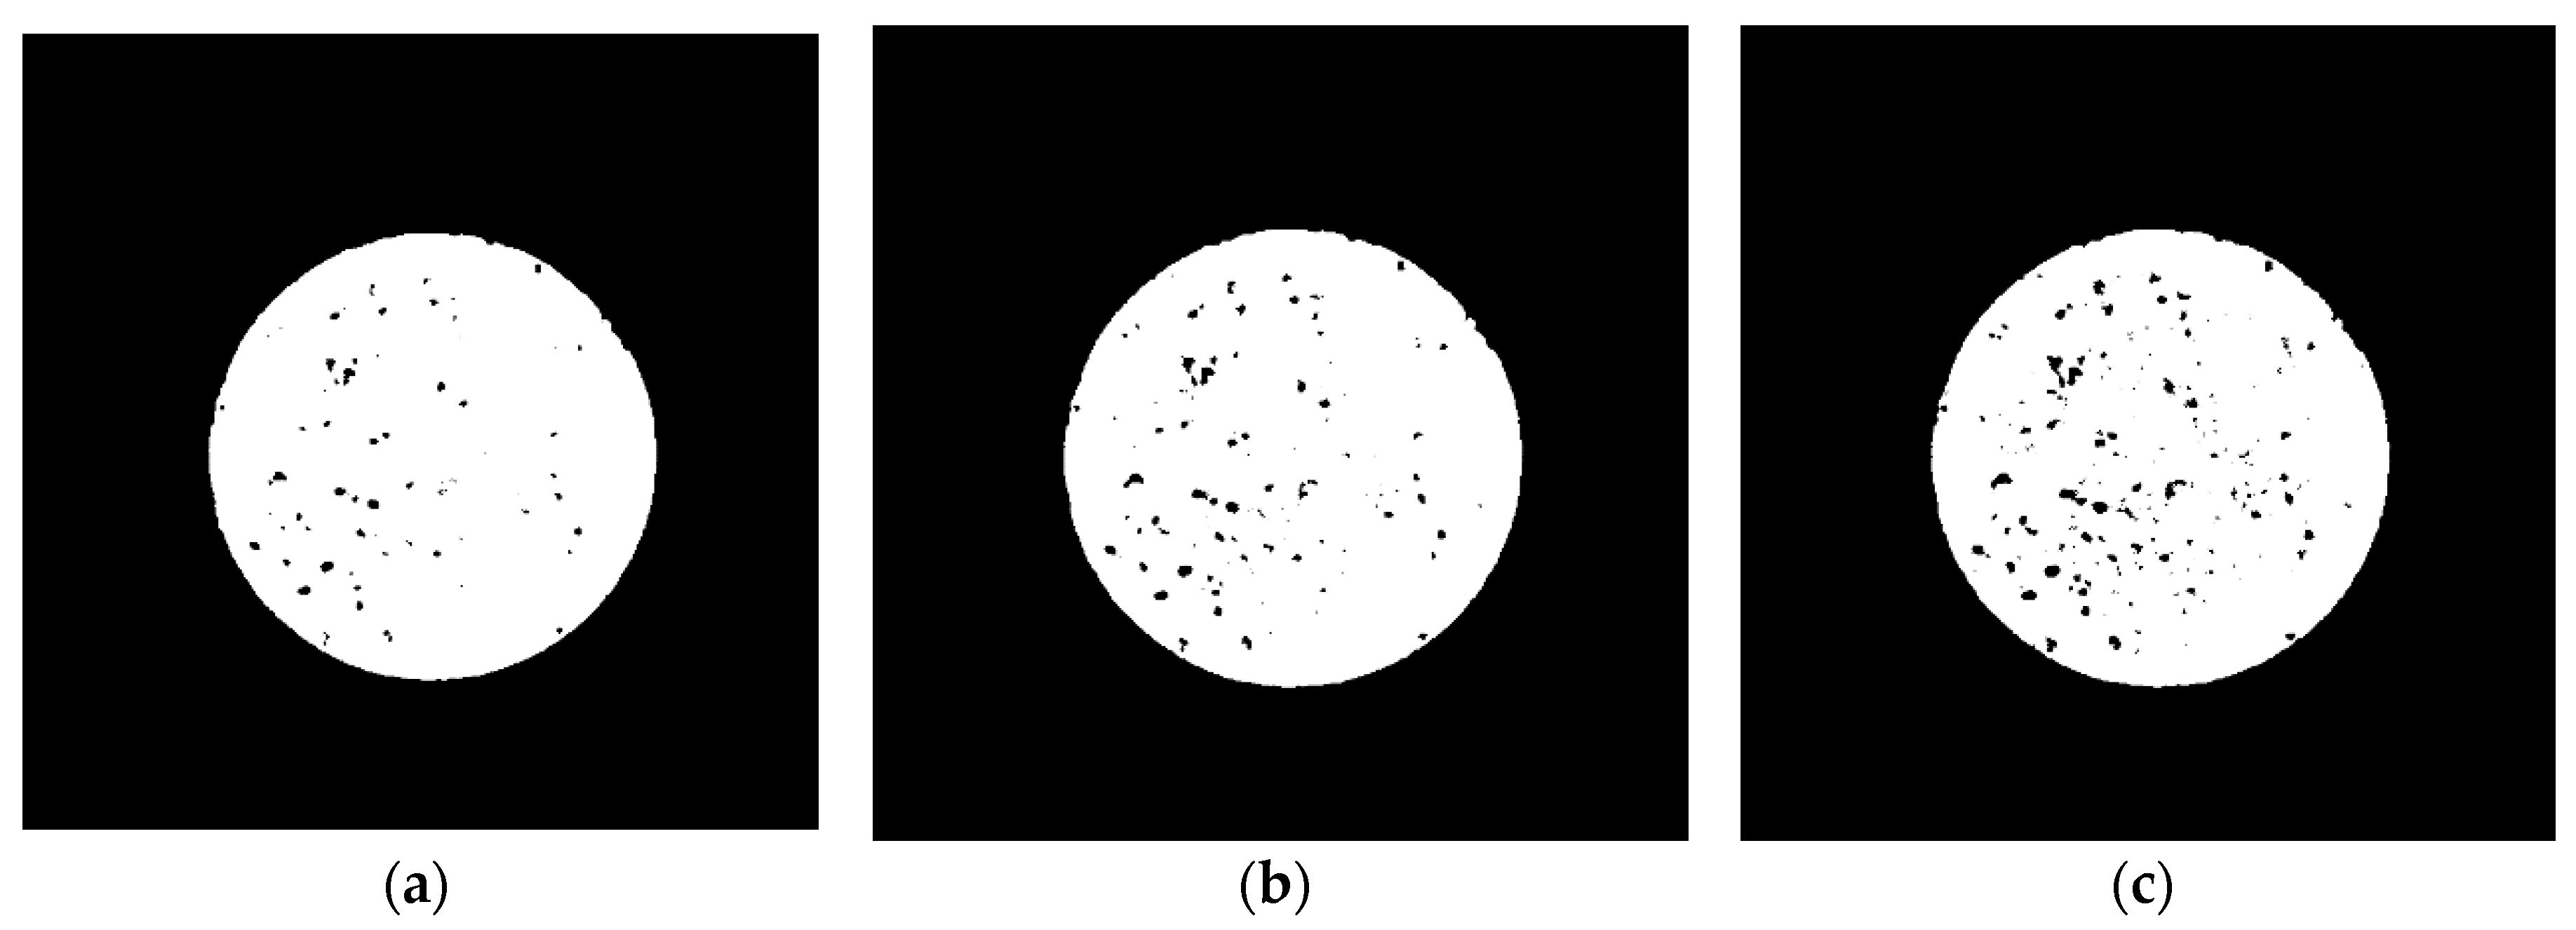
Threshold cutting is an effective method to analyze the grayscale distribution of images based on gray histograms. The image is scanned, marked and cut pixel by pixel. The setting of the threshold value is the key factor influencing the image processing result. In this study, three combination threshold settings (three limits of threshold setting: 0–175, 0–181 and 0–186) were proposed and verified as set out in the following part. Furthermore, the image was converted into a binary type for further analysis.

3.4. Porosity and Pore Morphology Calculation

What we concerned were porosity and pore morphology of the images. The research object was obtained by the superimposition and subtraction function provided in the Image J software. The area and morphology characteristics of the selected object were measured by the calculation function buttons.
The whole image processing of the matrix asphalt mixture in the 23th plane is shown as an example. The processes of image enhancement, denoising, threshold cutting, and calculation are described in Figure 7, Figure 8, Figure 9 and Figure 10, respectively.
For the entire image processing, the parameter settings in each step will have a significant impact on the results. In this study, the enhanced contrast and denoising settings were fixed, so the accuracy of the image processing was decided by the threshold setting. Three threshold combinations were selected. The calculated porosity of images with the settings of three thresholds were 1.13%, 3.91% and 6.32%, respectively. For the molding of Marshall specimens for the matrix asphalt mixture, 4% was our target porosity. This means that an image with the threshold setting of 0-181 can reflect the actual porosity distribution of the test specimen. The above image processing procedures were repeated for CT scanning images of all test specimens, and the calculated results were recorded for further analysis.

4. Microstructure Analysis of Asphalt Mixture under F–T Cycles

4.1. Microstructure of Asphalt Mixture before F–T Cycle

4.1.1. Pore Number Analysis

Pore number analysis of the matrix asphalt mixture and the three modified asphalt mixtures under F–T cycles are shown in Table 4. This includes the number of total pores (NTP), large pores (NLP), medium pores (NMP), and small pores (NSP) and their corresponding ratios (i.e., RTP, RLP, RMP, RSP) for 10 sections per sample. Pores with an actual pore area of less than 1 mm2 are defined as small pores, those with an actual pore area of 1–5 mm2 are defined as medium pores, and those with an actual pore area > 5 mm2 are defined as large pores.
As listed in Table 4, the average number of pores is 119 for the matrix asphalt mixture. Among them, NSP is 32, NMP is 72 and NLP is 15. The corresponding porosity ratios are 26.89%, 60.50% and 12.60%, respectively, and the average porosity of the matrix asphalt samples is 5.67%. The volume porosity of asphalt mixture is changed by adding NTC and BF. The volume porosity of NTC-modified asphalt mixture is the lowest, followed by NTC-BF composite modified asphalt mixture, and BF-modified asphalt mixture is the largest.
The total porosity of the three kinds of modified asphalt mixture is larger than that of the base matrix asphalt, especially BF-modified asphalt mixture. Compared with the base matrix asphalt mixture and NTC-modified asphalt mixture, the proportion of small pores in the asphalt mixture modified by BF is higher, while the proportion of small pores and large pores in the asphalt mixture is slightly increased by the addition of NTC, but the effect is not obvious. In addition, according to the porosity distribution of each section of asphalt mixture, the longitudinal porosity distribution of the sample can be roughly inferred, as shown in Figure 11.
In Figure 11, the longitudinal pore distributions of NTC-modified asphalt mixture and BF-modified asphalt mixture show the characteristics of pore fluctuation at both ends and stability in the middle, while the pore distributions of the base matrix asphalt mixture and NTCA-BF composite modified asphalt mixture are more uniform. The non-uniform distribution of the end is closely related to the compaction mode, the non-uniform filler and the performance of the asphalt mixture. The results show that the pore distribution of the base matrix asphalt mixture and NTC-BF composite modified asphalt mixture are more uniform before the F–T cycle.

4.1.2. Pore Morphology

Pore morphology analysis is an indispensable part of pore analysis, which can indirectly reflect the stability and development trend of pore structure. Based on image recognition technology, the pore morphology of four kinds of asphalt mixtures is analyzed according to typical characteristic parameters such as average pore diameter, classification coefficient and so on. The statistical results of pore morphology of base matrix asphalt mixture and three modified asphalt mixtures are shown in Table 5.
The analysis of the pore shape characteristics of each asphalt mixture was carried out based on the matrix asphalt mixture. For the long axis of the pore, the long axis size of the four kinds of asphalt mixture is close to that of the matrix asphalt mixture, and the law is not obvious. The short axis of the three kinds of modified asphalt is smaller than that of the matrix asphalt mixture, which leads to the long axis ratio of the three kinds of modified asphalt mixtures also being greater than that of the matrix asphalt mixture. Whether NTC-modified asphalt mixture, BF-modified asphalt mixture or NTC-BF composite modified asphalt mixture, the average diameters are all smaller than the matrix asphalt, and pore circumferences are also much smaller than the matrix asphalt, indicating that the average pore area and circumference of modified asphalt mixtures is smaller.
Combined with pore number analysis, the addition of nano-materials and basalt fibers can change the porosity of the matrix asphalt mixture, and the number and proportion of small pores are higher, so the average diameter and perimeter of the pores are decreased. Among the three modified asphalt mixtures, the BF modifier has the most obvious effect on the pore morphology, composite modifier takes the second place, and nanometer is the smallest. Through the analysis of the classification coefficient, it can be seen that the classification coefficient of internal pores of the base matrix asphalt mixture has improved after modification, indicating that the circular shape of pores is good. However, the increase of the ratio of long axis to short axis also shows that more shape parameters should be taken to analyze the pore shape characteristics of materials in order to obtain a more accurate and comprehensive evaluation.

4.2. Microstructure of Asphalt Mixture after F–T Test

The F–T cycle is a process of repeated freezing and thawing under the action of low temperature and normal temperature. During the F–T cycle, the water inside the object changes from solid to liquid, accompanied by the change and destruction of the internal structure under the action of frost heave force, which will have a significant impact on the performance of materials. Based on image processing technology, the variation characteristics of pore characteristics of four experimental asphalt mixtures under F–T cycles are summarized, and the variation trend of material properties under F–T cycles is analyzed from the microscopic point of view. The change trends of porosity of asphalt mixtures under F–T cycles are shown in Figure 12.
The variation of porosity in Figure 12 conformed to our expectation: that is, porosity increases gradually with the increase in the number of F–T cycles, and increases significantly at the beginning of F–T cycles (5 F–T cycles), after which the growth trend tends to be stable. In addition, the relationship between the porosity of the four asphalt mixtures does not change with the number of F–T cycles. The porosity of basalt fiber-modified asphalt mixture is still the largest and significantly increases with F–T cycles; whereas, the porosity of NTC-modified asphalt mixture is still the smallest, and the change more uniform, with F–T cycles. However, the porosity of the matrix asphalt mixture and NTC-BF composite modified asphalt mixture increase rapidly in the early F-T cycles, and tend to stabilize quickly thereafter.
In order to study the pore change characteristics of asphalt mixtures after F–T cycles, the pore number and shape characteristics were analyzed. The results are shown in Table 6 and Table 7.
The pore characteristics under F–T cycles in Table 6 and Table 7 show that changes in the number and shape of pores after F–T cycles are usually closely related. For example, after F–T cycles, the number of total pores in the asphalt mixture clearly increases, and in particular the number of small pores increases significantly. The increase in the number of small pores will lead to a significant increase in the proportion of small pores, and in turn the increase of small pores will make the internal long axis of the whole mixture, the average diameter and circumference of the shape characteristic parameters decrease, and then lead to the regular change of the parting coefficient.
Unlike the rapid increase of the number of small pores under F–T cycles, the variation regularity of the number of micro-pores and macro-pores is not obvious, which indirectly reflects the change of the internal pores of asphalt mixture under F–T cycles. There are two main reasons for the increase of the overall porosity of asphalt mixture. One is that a large number of micro-pores are produced in the sample due to F–T cycles, which makes the overall porosity increase. The other is that the freezing–thawing process makes the pores of the sample develop, which enlarges the pore area, and the transition from micro-pores to macro-pores leads to the increase in the number of macro-pores. At the same time, there are large pores forming though, resulting in the reduction of the number, and these two effects exist simultaneously. For example, matrix, nano and basalt fiber composite asphalt mixtures increase significantly with the number of small pores in the F–T cycle, resulting in a significant increase in porosity, while fiber-reinforced asphalt mixtures are mainly due to the development of internal pores in the F–T cycle resulting in an overall increase in porosity.
Among the four kinds of asphalt mixtures, the internal structure of BF modified asphalt mixture rapidly produces macro-pores under F–T cycles, and the propagations lead to significant performance degradation. The internal structure of the four kinds of asphalt mixtures produce a large number of micro-pores in the early and middle stages of the F–T cycles, and the number of pores gradually develops with F–T cycles. When the number of F–T cycles was 15, the macro-pores were connected, and the pore characteristics also changed. According to the pore number and morphological characteristics under 0 to 15 F–T cycles, the change in amplitude of the pore characteristics of the base matrix asphalt mixture and NTC-BF composite modified asphalt mixture are the most stable.

5. Conclusions

In this paper, CT was used to scan four kinds of asphalt mixtures before and after freeze–thaw cycles. Based on image processing technology, the number of pores, pore distribution characteristics and pore morphology of test asphalt mixtures were studied and analyzed. The results provide the basis for understanding the performance attenuation mechanism of asphalt mixture and establishing the respective attenuation models after F–T cycles. The main conclusions are as follows:
  • The volume porosity of asphalt mixture is influenced by adding the modifiers NTC and BF to the base asphalt. The volume porosity of BF-modified asphalt mixture is the largest, followed by base matrix asphalt, NTC-BF composite modified asphalt mixture, and NTC- modified asphalt mixture.
  • According to the longitudinal pore distribution law of asphalt mixtures, the longitudinal pore distribution of NTC-modified asphalt mixture and BF-modified asphalt mixture show the characteristics of pore fluctuation at both ends and stability in the middle, while the pore distributions of the base matrix asphalt mixture and NTC-BF composite modified asphalt mixture are more uniform.
  • After F–T cycles, the internal structure of BF-modified asphalt mixture rapidly produces macro-pores, which spread and cause significant performance degradation. As for the base matrix asphalt mixture, NTC-modified asphalt mixture and NTC-BF composite modified asphalt mixture, a large number of pores produce in the early and middle stage of F–T, then the number of pores develops slowly as the number of F–T cycles increases. Among the four kinds of asphalt mixtures, the pore characteristics of the base matrix asphalt mixture and NTC-BF composite modified asphalt mixture retain the best stability after F–T cycles.
  • With increasing F-T cycles, a series of changes take place in the pore number and morphology of the asphalt mixture: the porosity increases, and the moisture entering into the specimen with F–T cycles continuously increases. Furthermore, high temperature water bath melting increases the contact area between the specimen and water which aggravates the loss phenomenon. All of these destroy the stability of the asphalt mixture skeleton, decrease the adhesive force between asphalt and aggregates, and weaken the performance of the asphalt mixtures.
In this study, the influence of F–T cycles on the microstructure variation of test asphalt mixtures was intuitively analyzed by CT scanning technology. However, the image processing was conducted based on the identified pores. Pores that are smaller than the resolution of the CT scanner are also important and non-negligible; this will be our research focus in future work.

Author Contributions

Conceptualization, C.L.; formal analysis, Y.G., H.B. and S.W.; investigation, Y.G.; data curation, H.B. and S.W.; writing—original draft preparation, S.W. and H.B.; writing—review and editing, Y.G. and S.W.; project administration, Y.G. and S.W.; funding acquisition, Y.G. and S.W.

Funding

This work was supported by the Transportation Technology Program of Jilin province of China (Grant No. 2018ZDGC-16) and the Transportation Technology Program of Jilin province of China (Grant No. 2018-1-9).

Acknowledgments

This work was supported by the Transportation Technology Program of Jilin province of China (Grant No. 2018ZDGC-16) and the Transportation Technology Program of Jilin province of China (Grant No. 2018-1-9). We would like to acknowledge the following people from Northeast Forestry University: Thank you to Sun Hao, Wang Zhongzhi and Fang Liqun for technical support in the testing procedure and data processing.

Conflicts of Interest

The authors declare no conflicts of interest regarding the publication of this paper.

References

  1. Shafabakhsh, G.H.; Ani, O.J. Experimental investigation of effect of Nano TiO2/SiO2, modified bitumen on the rutting and fatigue performance of asphalt mixtures containing steel slag aggregates. Constr. Build. Mater. 2015, 98, 692–702. [Google Scholar] [CrossRef]
  2. Nazari, H.; Naderi, K.; Nejad, F.M. Improving aging resistance and fatigue performance of asphalt binders using inorganic nanoparticles. Constr. Build. Mater. 2018, 170, 591–602. [Google Scholar] [CrossRef]
  3. Mostafa, S.; Gholamali, S. Use of Nano SiO2 and Nano TiO2 to improve the mechanical behaviour of stone mastic asphalt mixtures. Constr. Build. Mater. 2017, 157, 965–974. [Google Scholar]
  4. Zheng, Y.X.; Cai, Y.C.; Zhang, Y.M. Laboratory Study of Pavement Performance of Basalt Fiber-Modified Asphalt Mixture. Adv. Mater. Res. 2011, 266, 175–179. [Google Scholar] [CrossRef]
  5. Qin, X.; Shen, A.; Guo, Y. Characterization of asphalt mastics reinforced with basalt fibers. Constr. Build. Mater. 2018, 159, 508–516. [Google Scholar] [CrossRef]
  6. Gao, C.M.; Dong, W.Z.; Liu, X.Y. Tensional Ability of Basalt Fiber Enforced Asphalt Mixture. Appl. Mech. Mater. 2011, 97–98, 837–840. [Google Scholar] [CrossRef]
  7. Celauro, C.; Pratico, F.G. Asphalt mixtures modified with basalt fibers for surface courses. Constr. Build. Mater. 2018, 170, 245–253. [Google Scholar] [CrossRef]
  8. Davar, A.; Tanzadeh, J.; Fadaee, O. Experimental evaluation of the basalt fibers and diatomite powder compound on enhanced fatigue life and tensile strength of hot mix asphalt at low temperatures. Constr. Build. Mater. 2017, 153, 238–246. [Google Scholar] [CrossRef]
  9. Zheng, Y.X.; Cai, Y.C.; Zhang, G.H. Fatigue Property of Basalt Fiber-Modified Asphalt Mixture under Complicated Environment. J. Wuhan Univ. Technol. 2014, 29, 996–1004. (In Chinese) [Google Scholar] [CrossRef]
  10. Badeli, S.; Carter, A.; Dore, G. Complex modulus and fatigue analysis of an asphalt mix after daily rapid freeze-thaw cycles. Mater. Civ. Eng. 2018, 30, 1–13. [Google Scholar] [CrossRef]
  11. Badeli, S.; Carter, A.; DorÉ, G. Evaluation of the durability and the performance of an asphalt mix involving Aramid Pulp Fiber (APF), Complex modulus before and after freeze-thaw cycles, fatigue, and TSRST tests. Constr. Build. Mater. 2018, 174, 60–71. [Google Scholar] [CrossRef]
  12. Éric, L.T.; Perraton, D.; Vaillancourt, M. Degradation of asphalt mixtures with glass aggregates subjected to freeze-thaw cycles. Cold Reg. Sci. Technol. 2017, 141, 8–15. [Google Scholar]
  13. Xu, H.Y.; Dang, S.Y.; Cui, D.Y. Durability Test Research of Asphalt Mixture with Rubber Particles under the Condition of Freeze-Thaw Cycle. Adv. Mater. Res. 2014, 919–921, 1096–1099. [Google Scholar] [CrossRef]
  14. Ho, C.H.; Martin Linares, C.P. Representation Functions to Predict Relaxation Modulus of Asphalt Mixtures Subject to the Action of Freeze-Thaw Cycles. J. Transp. Eng. Part B-Pavements 2018, 144, 1–10. [Google Scholar] [CrossRef]
  15. Wei, S.I.; Ning, L.I.; Biao, M.A. Impact of Freeze-Thaw Cycles on Compressive Characteristics of Asphalt Mixture in Cold Regions. J. Wuhan Univ. Technol. (Mater. Sci. Ed.) 2015, 30, 703–709. (In Chinese) [Google Scholar]
  16. Guo, N.S.; You, Z.P.; Tan, Y.Q.; Zhao, Y.H.; Jing, H.L. Evaluation Method for Homogeneity of Asphalt Mixture Base on CT Technique. Highw. Transp. 2017, 30, 1–9. (In Chinese) [Google Scholar]
  17. Guo, N.S.; You, Z.P.; Tan, Y.Q.; Zhao, Y.H. Prediction method on Volume Air Voids of Asphalt mixture based on CT Technology. Highw. Transp. 2016, 29, 12–21. [Google Scholar]
  18. Zhang, C.; Wang, H.; Zhang, P.; Yang, X. Compaction characteristics of asphalt mixture with different gradation type through Superpave Gyratory Compaction and X-Ray CT Scanning. Constr. Build. Mater. 2016, 129, 243–255. [Google Scholar] [CrossRef]
  19. Jiang, W.; Sha, A.; Xiao, J. Experimental Study on Relationships among Composition, Microscopic Void Features, and Performance of Porous Asphalt Concrete. Mater. Civ. Eng. 2015, 27, 1–10. [Google Scholar] [CrossRef]
  20. Castillo, D.; Caro, S.; Darabi, M.; Masad, E. Studying the effect of microstructural properties on the mechanical degradation of asphalt mixtures. Constr. Build. Mater. 2015, 93, 70–83. [Google Scholar] [CrossRef]
  21. Wei, H.; Li, Z.; Jiao, Y. Effects of Diatomite and SBS on Freeze-Thaw Resistance of Crumb Rubber Modified Asphalt Mixture. Adv. Mater. Sci. Eng. 2017, 2017, 7802035. [Google Scholar] [CrossRef]
  22. Xu, H.; Li, H.; Tan, Y.; Wang, L.; Hou, Y. A Micro-Scale Investigation on the Behaviors of Asphalt Mixtures under Freeze-Thaw Cycles Using Entropy Theory and a Computerized Tomography Scanning Technique. Entropy 2018, 20, 68. [Google Scholar] [CrossRef]
  23. Hu, J.; Qian, Z.; Liu, Y.; Zhang, M. High-temperature failure in asphalt mixtures using micro-structural investigation and image analysis. Constr. Build. Mater. 2015, 84, 136–145. [Google Scholar] [CrossRef]
  24. Wang, H.; Zhang, R.; Chen, Y.; You, Z.; Fang, J. Study on microstructure of rubberized recycled hot mix asphalt based X-ray CT technology. Constr. Build. Mater. 2016, 121, 177–184. [Google Scholar] [CrossRef]
  25. Ministry of Transport of the People’s Republic of China. Standard Test Methods of Bitumen and Bituminous Mixtures for Highway Engineering (JTG E20-2011); China Communications Press: Beijing, China, 2011. (In Chinese)
  26. Cheng, Y.C.; Bi, H.P.; Ma, G.R.; Gong, Y.F.; Tian, Z.H. Pavement performance of nano materials-basalt fiber compound modified asphalt binder. J. Jilin Univ. 2018, 48, 460–465. (In Chinese) [Google Scholar]
Figure 1. Basalt fiber.
Applsci 08 02191 g001
Figure 2. Appearance of nano TiO2/CaCO3 materials.
Applsci 08 02191 g002
Figure 3. Gradation of test asphalt mixture.
Applsci 08 02191 g003
Figure 4. The Brilliancei CT scanning equipment.
Applsci 08 02191 g004
Figure 5. The process of plane scanning.
Applsci 08 02191 g005
Figure 6. Pre-processed scanning image of matrix asphalt mixture: (a) before freeze–thaw cycles; (b) after five freeze–thaw cycles.
Applsci 08 02191 g006
Figure 7. Process of image enhancement: (a) original 8-bit image; (b) enhanced image; (c) gray level histogram.
Applsci 08 02191 g007
Figure 8. Process of image denoising: (a) scanning image with Gaussian noise; (b) denoised image; (c) gray level histogram.
Applsci 08 02191 g008
Figure 9. Threshold cutting and binarization: (a) threshold setting of 0–175; (b) threshold setting of 0–181; (c) threshold setting of 0–186.
Applsci 08 02191 g009
Figure 10. Selection of the calculated objects: (a) subtraction of image (threshold of 0:181); (b) selection of research objects; (c) reverse selection of research objects.
Applsci 08 02191 g010
Figure 11. Longitudinal pore distribution map of asphalt mixtures.
Applsci 08 02191 g011
Figure 12. Variation of porosity after test F–T cycles of test asphalt mixture.
Applsci 08 02191 g012
Table 1. Basic properties of matrix asphalt.
PropertyTest ResultsStandard Requirements
Penetration (25 °C, 5 s, 0.1 mm)85.880–100
Softening point TR&B (°C)46.9≥45
Ductility (25 °C, cm)>150≥100
Brookfield viscosity (135 °C, Pa·s)306.9
Density (15 °C, g/cm3)1.016
Table 2. Technical properties of basalt fiber.
PropertyTest ResultStandard Requirements
Diameter (μm)10–13
Length (mm)6
Moisture content (%)0.030≤0.2
Combustible content (%)0.56
Linear density (Tex)23982400 ± 120
Fracture strength (N/Tex)0.55≥0.40
Tensile strength (MPa)2320≥2000
Tensile modulus of elasticity (GPa)86.3≥85
Elongation at break (%)2.84≥2.5
Table 3. Experimental design of asphalt mixtures.
GroupContent of BF (%)Content of NTC (%)Asphalt-Aggregate Ratio
Base matrix asphalt mixture005.00
NTC modified asphalt mixture05.55.34
BF modified asphalt mixture6.205.78
NTC-BF composite modified asphalt mixture3.95.15.67
Table 4. The porosity of test asphalt mixtures.
SampleNTPNLPNMPNSPRTP (%)RLP (%)RMP (%)RSP (%)
Base matrix asphalt mixture1193272155.6726.8960.5012.60
NTC modified asphalt mixture1534688195.1830.0657.5212.42
BF modified asphalt mixture1876597256.4134.7651.8713.37
NTC-BF composite modified asphalt mixture1415170205.5936.1749.6414.18
Table 5. Morphological characteristics of asphalt mixture.
SampleLA 1 (mm)SA 2 (mm)AD 3 (mm)Circumference (mm)LASAR 4CC 5
Base matrix asphalt mixture3.011.452.589.572.080.73
NTC modified asphalt mixture2.961.211.926.692.450.86
BF modified asphalt mixture2.431.181.685.812.060.97
NTC-BF composite modified asphalt mixture2.781.211.816.662.300.90
1 Long Axis; 2 Short Axis; 3 Average Diameter; 4 Long and Short Axis Ratio; 5 Classification Coefficient.
Table 6. The void numbers of asphalt mixtures under F–T cycles.
SampleF-T CyclesTPN 1LPN 2MPN 3SPN 4LPR 5 (%)MPR 6 (%)SPR 7 (%)
Base matrix asphalt mixture011932721526.8960.5012.60
511229651825.8958.0416.07
1013349711336.8453.389.77
151355175937.7855.566.67
NTC modified asphalt mixture015346881930.0657.5212.42
51214369935.5457.027.44
1016874821244.0548.817.14
151496478742.9552.354.70
BF modified asphalt mixture018765972534.7651.8713.37
5217791152336.4053.0010.60
10223841093037.6748.8813.45
15221811103036.6549.7713.57
NTC-BF composite modified asphalt mixture014151702036.1749.6414.18
519983981841.7149.259.04
1017175851143.8649.716.43
15207881031642.5149.767.73
1 Total Pore Number; 2 Large Pore Number; 3 Middle Pore Number; 4 Small Pore Number; 5 Large Pore Ratio; 6 Middle Pore Ratio; 7 Small Pore Ratio.
Table 7. The pore morphology of the test asphalt mixture under F–T cycles.
Sample TypeALA 1 (mm)ASA 2 (mm)AD 3 (mm)AC 4 (mm)LATSAO 5MAAVIA 6 (degree)Classification Coefficient
Base matrix asphalt mixture3.011.452.589.572.0888.730.73
2.981.432.619.872.0894.610.8
2.511.372.017.131.8391.930.92
2.571.392.077.411.8592.10.97
NTC modified asphalt mixture2.961.211.926.692.4590.810.86
2.751.472.419.371.8794.120.75
2.571.242.077.492.0793.80.82
2.341.372.047.461.7190.220.92
BF modified asphalt mixture2.431.181.685.812.0691.170.97
2.591.211.796.772.1489.70.88
2.541.211.797.092.1089.580.85
2.691.271.847.572.1292.550.83
NTC-BF modified asphalt mixture2.781.211.816.662.3091.070.90
2.511.161.877.192.1690.910.85
2.371.191.786.531.9991.330.88
2.511.141.746.912.2090.660.83
1 Average Long Axis; 2 Average Short Axis; 3 Average Diameter; 4 Average Circumference; 5 Long Axis to Short Axis Ratio; 6 Main Axis and Vertical Inclusion Angle.

