Article

An Online Simultaneous Measurement of the Dual-Axis Straightness Error for Machine Tools

1
Smart Machine and Intelligent Manufacturing research center, National Formosa University, Yunlin 632, Taiwan
2
Department of Engineering Science, National Cheng Kung University, Tainan 701, Taiwan
*
Author to whom correspondence should be addressed.
Appl. Sci. 2018, 8(11), 2130; https://doi.org/10.3390/app8112130
Submission received: 12 October 2018 / Revised: 29 October 2018 / Accepted: 30 October 2018 / Published: 2 November 2018
(This article belongs to the Special Issue Selected Papers from IEEE ICKII 2018)

Abstract

:
Vertical straightness errors are the key factor that affects the flatness of the workpiece during vertical machining. Traditionally, the individually measured and fitted vertical straightness errors of the X and Y axes are used to compensate the Z axis and, thus, obtain the flatness of the working table of the machine tool. However, it is difficult to measure and compensate the vertical straightness error of the desired position on the working table, not to mention the centroid variation effect of the working table on the measured data. In this study, an online dual-axis measurement system with repeatability (3σ) of 2.46 μm is developed to simultaneously measure X-axis and Y-axis straightness errors of the desired position of a working table. Furthermore, the measured data are utilized to establish a flatness error model to reduce the vertical straightness error of the working table such that the repeatability (3σ) of the measured flatness may be kept within a range of 0.65 μm.

1. Introduction

Straightness, linear positioning and angular errors exist in every linear movement system [1], and the straightness of a moving platform can be measured by using a displacement indicator according to ISO230-1. The industry compensation method employed for straightness error measurements is usually conducted by using a single-axis mechanism with a laser interferometer and an optical mirror/prism that moves the other axis to the center of the measured axis, and then establishes the compensation data for vertical straightness with the measured X- and Y-axis straightness errors.
Fan et al. [2] proposed a low-cost straightness measurement system using a laser source and a quadrant detector. Lin et al. [3] integrated a dual-linear reflector, a Wollaston prism, and a corner cube to establish a measurement system of repeatability (3σ) of 1 μm. In a similar way, Feng [4] and Kuang [5] utilized a single-mode fiber-coupled laser module as the reference line for straightness measurements. Hwang et al. [6] proposed a three-probe system for measuring the parallelism and straightness of a pair of rails for ultra-precision guideways. Iqbal et al. [7] first described how randomly arising illumination noises produce unpredicted variations in the position sensing detector (PSD) output. You et al. [8] proposed a straightness error measurement approach based on common-path compensation in order to eliminate the laser beam drift by utilizing an optical module with a PSD and a quadrant detector (QD).
Huang et al. [9] developed a new measurement method based on a phase sensitive detection technique, which consists of a single-mode fiber pigtailed laser diode, a collimator, a PSD, and a corner cube. To eliminate the influence of background light, the laser diode was modulated by a sinusoidal wave current and the PSD signal phase was demodulated by using the sensitive detection technique. Borisov et al. [10] replaced the laser interferometer with a customized taut-wire module and successfully developed a straightness measurement system with a standard deviation of 1.5 μm over a measuring range of 1.5 m.
Liu et al. [11] also replaced the laser interferometer with a high-power fiber-coupled light emitting diode (LED) as a light source for measuring straightness errors within a limited detecting range. Feng et al. [12] developed a fast and accurate system for gantry type milling centers by real-time modeling one serial of straightness errors using B-spline curves.
The X and Y axes of a machine tool need to be moved during the machining process; however, the vertical straightness errors are compensated by using the individually measured vertical straightness errors of X or Y axis. The single-axis mechanism utilized in above mentioned literature may result in compensation error for vertical straightness due to the variation of center-of-gravity, especially for machine tools of long-travelling distance or high-loading operation conditions. In this study, a dual-axis measurement system based on a single-axis mechanism via the least squares method, is developed. Its advantage is that the system can simultaneously measure and compensate both vertical straightness and flatness errors for the moving working table of the machine tool.

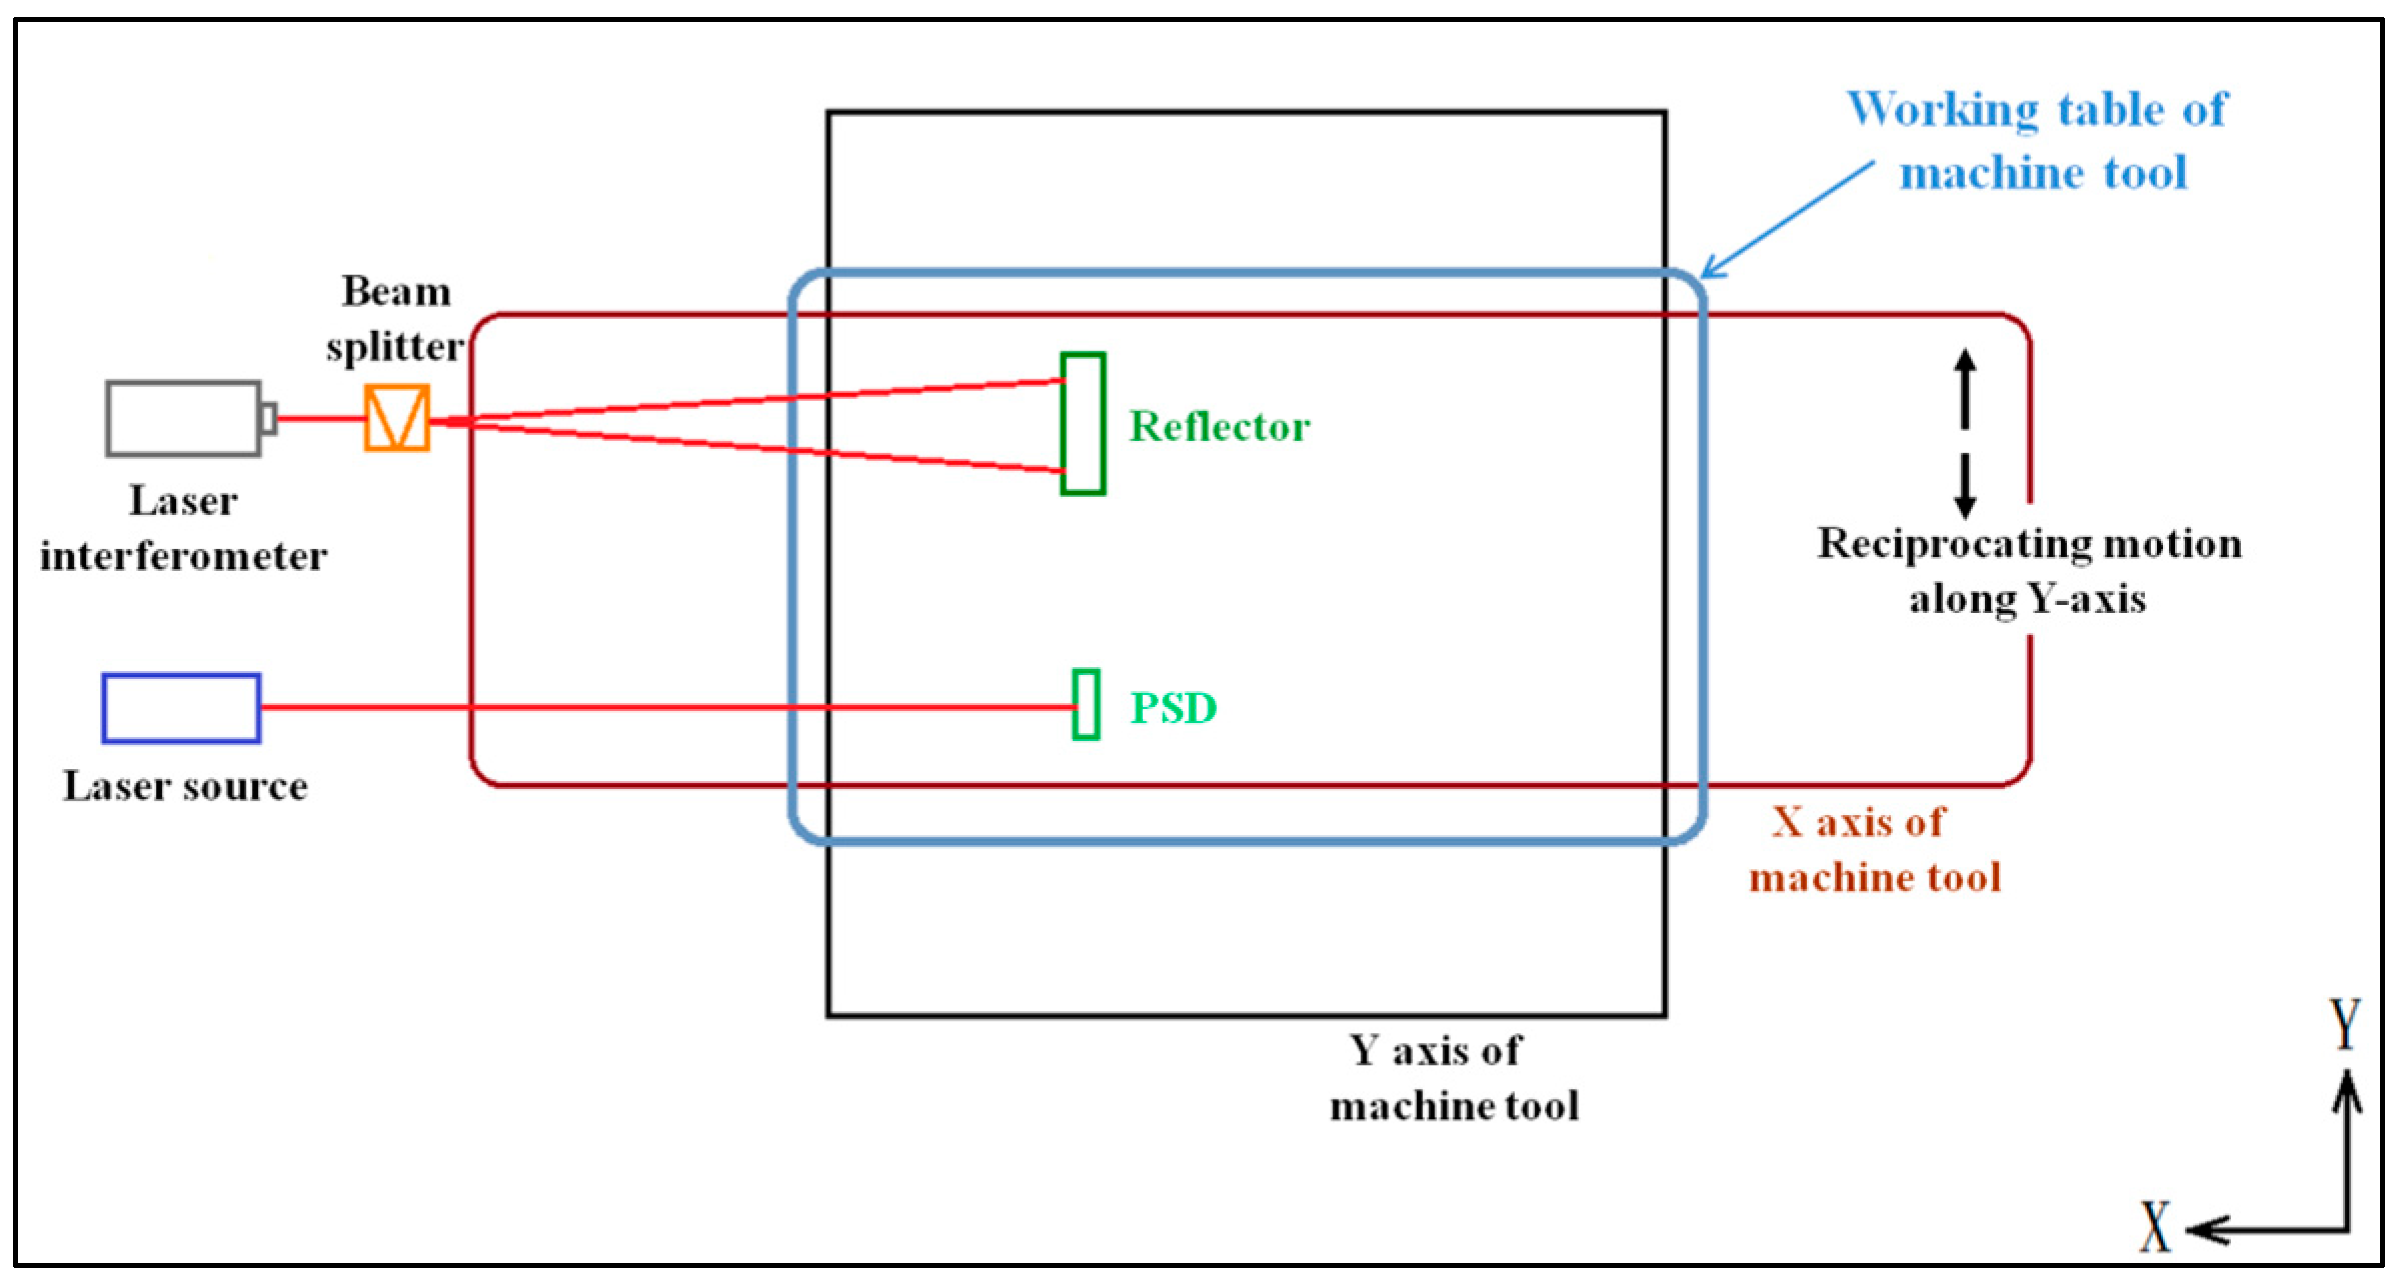
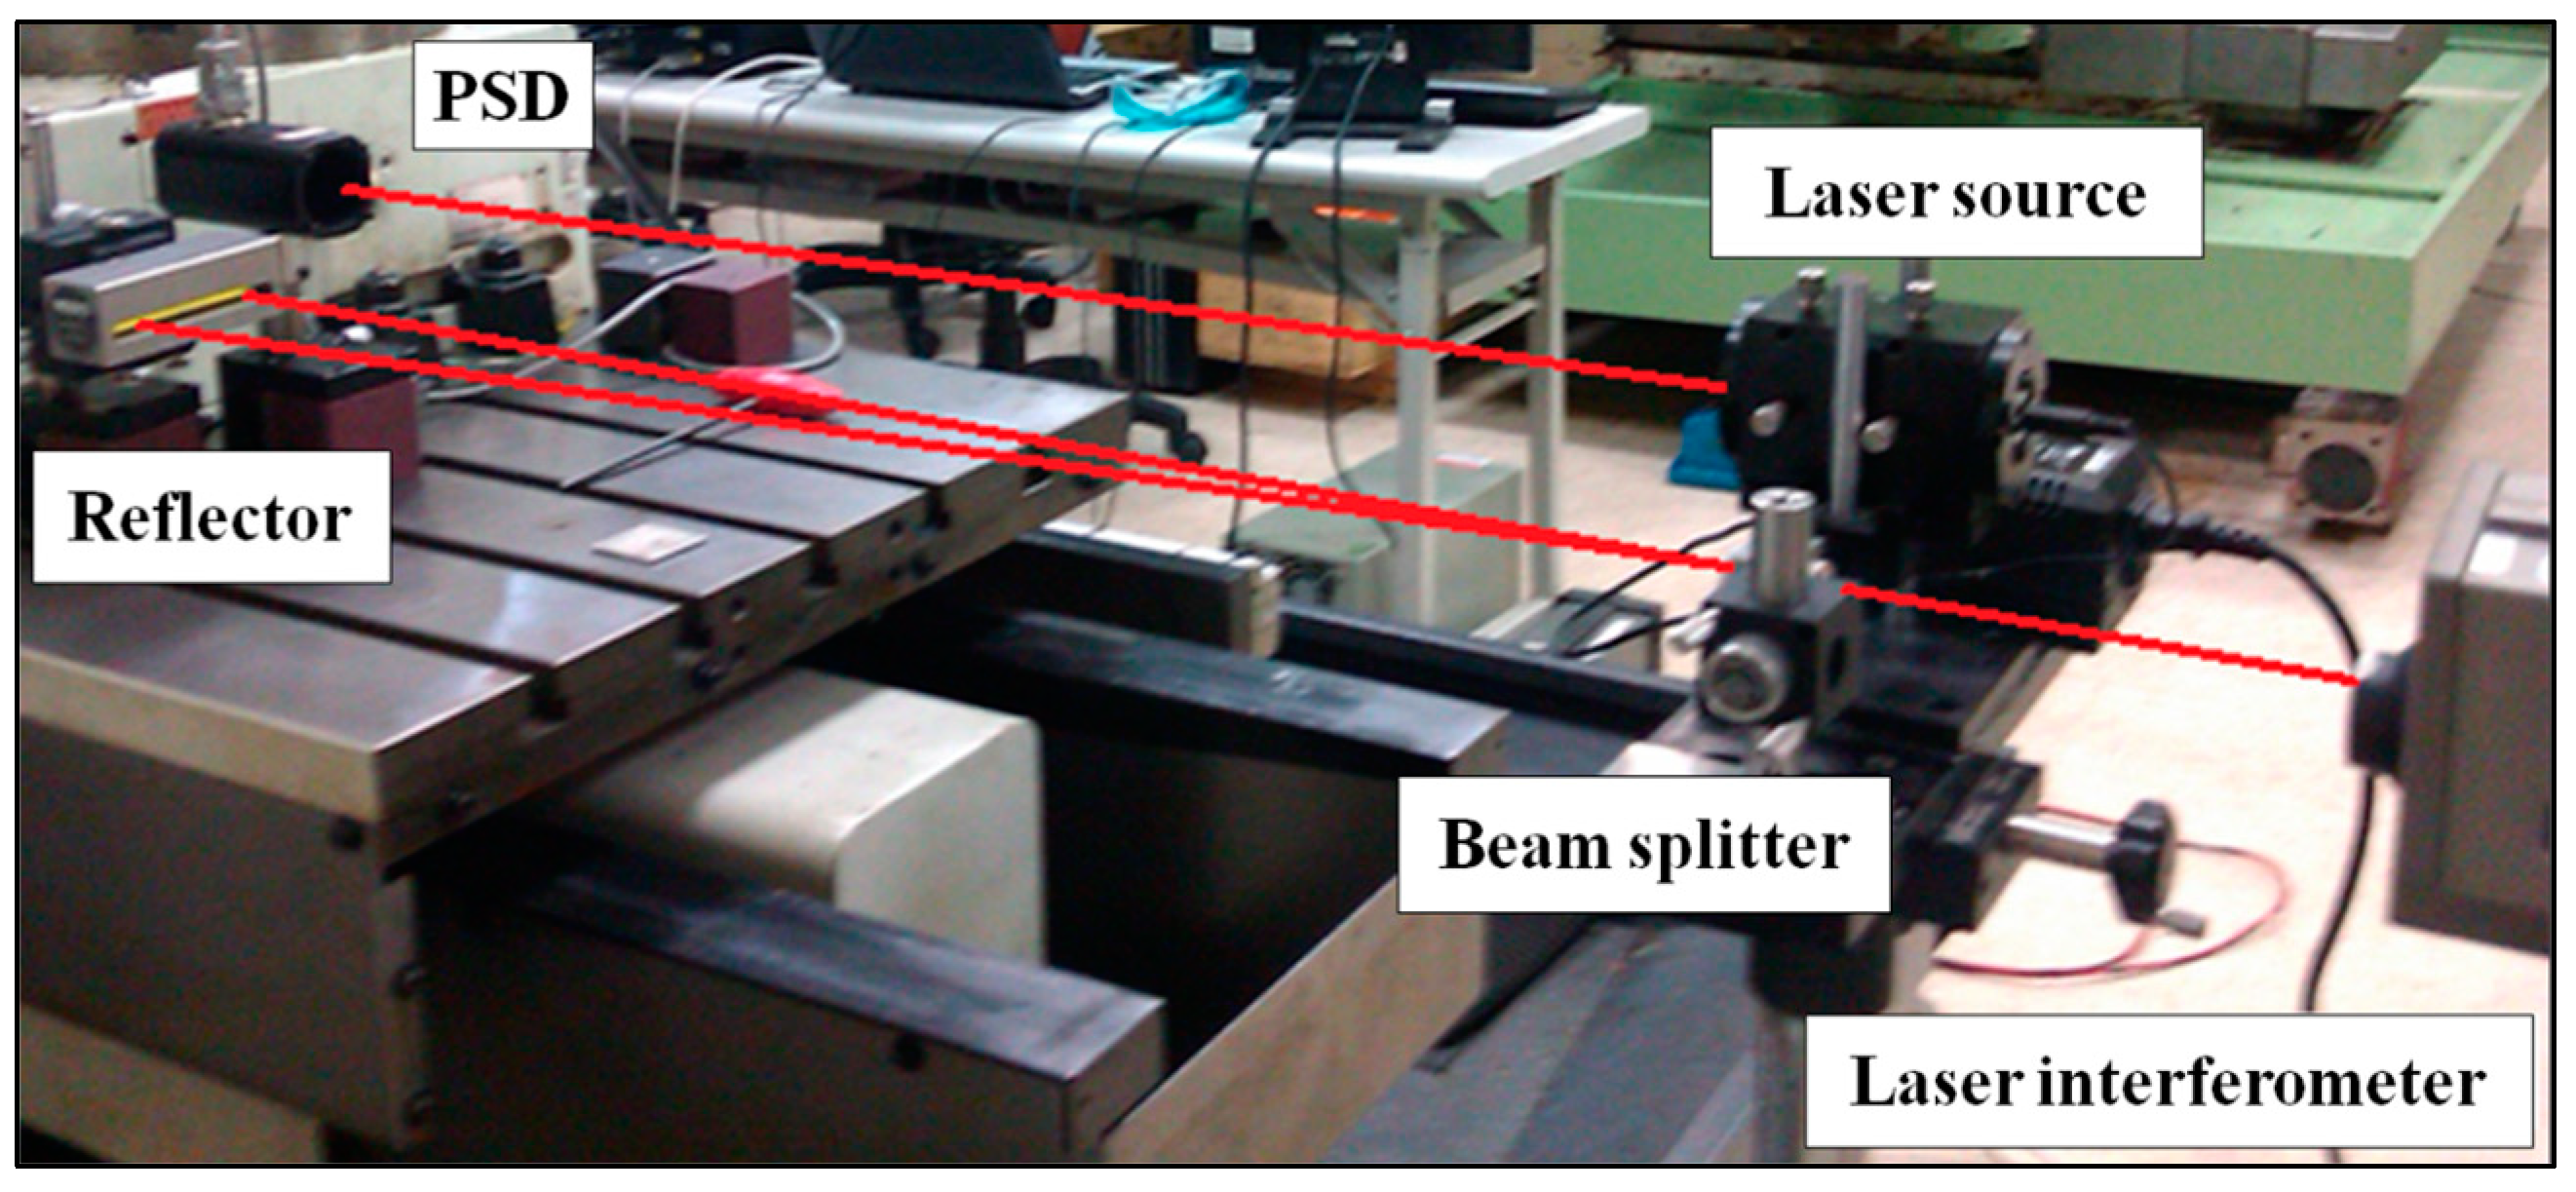
2. Dual-Axis Measurement System

The proposed system is composed of two single-axis straightness measurement modules, which mainly includes two laser sources (LBS-532-TD-5, Laserglow Tech., Toronto, ON, Canada), two PSDs (DLS-10, OSI Optoelectronics, Hawthorne, CA, USA), two lab-developed signal processors, one analog-to-digital card (USB-6210, National Instruments Co., Taipei, Taiwan), one angle sensor (0737-0604-99, Fredericks Co., Huntingdon Valley, PA, USA), and one lab-developed beam-path adjustment module.
The PSDs are dual-lateral detectors calibrated with a laser interferometer (Agilent 5529A, Agilent Tech., Santa Clara, CA, USA) and used to obtain the correct relationship between voltage and beam position projected on the PSD, as shown in Figure 1 and Figure 2.

2.1. System Configuration

Two proposed single-axis straightness measurement sub-systems (i.e., 1st and 2nd laser optical modules) were installed, respectively, on the X- and Y-axis of the machine tool and tested in order to clarify the vertical variation of XY plane of the working table, as shown in Figure 3.
First, PSD-1 was installed on the working table of the machine tool, Laser Source-1 (LS-1) and PSD-2 were installed on the X-axis, and Laser Source-2 (LS-2) was installed aside as shown in Figure 4. Secondly, beam paths were adjusted according to the distance between beam spots projected on PSD. For the two straightness measurement systems had no mutual effect on each other, it was unnecessary to pay attention to the adjustment order of beam paths.
With regard to the beam path adjustment principle, the distance between start and end points of the projected beam spot on PSD had to be kept less than 10 2 μm in order to reduce the cosine error, as shown in Figure 5. Since LS-1 was not set on a rigid stage, but on the saddle edge of the machine tool, there will exist a pitch angle error when the working platform was moved close to LS-1 along the X-axis direction, as shown in Figure 6.
In order to compensate the pitch angle error, an angle sensor mounted on the lab-developed beam-path adjustment module was set aside of LS-1 for detecting the angle variation caused by the movement of the working platform, see Figure 4. The measured data were analyzed by using the least squares method in order to obtain more accurate vertical straightness of the working table.

2.2. Measurement Principle

As shown in Figure 7, the measurement path was inspired by previous study [13]. The straightness variation of the moving working table is detected by PSDs. The laser beam of the 2nd module is utilized not only as the reference line projected on PSD-2 for measuring the vertical straightness errors of the Y-axis, as shown in Figure 3, but also as the connection for linking the errors measured by the 1st module. The reference-point of the machine tool is at the left down corner, and the measurement was performed in horizontal motion along the X-Y plane of the machine tool. The moving direction of PSD-1 along the X-axis was from machine position X—100 mm to X—900 mm (measurement distance: 800 mm), and the PSD-1 along Y-axis was from Y—100 mm to Y—500 mm (measurement distance: 400 mm).
The vertical straightness error Zσ can be expressed as the sum of the measured X- and Y-axis vertical straightness X σ Z and Y σ Z :
Z σ = X σ Z + Y σ Z
The equation for the least-squared plane can be expressed as follows:
ZAXBYC = 0
where A, B, and C are constants; X, Y, and Z are coordinates on the least-squared plane.
The vertical straightness error of every sampling point Ei can be expressed as:
E i   =   Z σ i     AX i     BY i     C   =   Z σ i     ( A X i +   B Y i +   C )   =   Z σ i     Z i   for   i   =   1 ~ n
And the squared error E is given by:
E = i = 1 n E i 2 = i = 1 n [ Z σ i ( A X i + B Y i + C ) ] 2   i = 1 ~ n
The minimum value of the squared error can be obtained by taking partial derivatives of E with respect to A, B and C, setting these derivatives to zero, and then solving for A, B, and C:
E A = i = 1 n 2 ( Z σ i A X i B Y i C ) ( X i ) = 0 E B = i = 1 n 2 ( Z σ i A X i B Y i C ) ( Y i ) = 0 E C = i = 1 n 2 ( Z σ i A X i B Y i C ) ( 1 ) = 0
Equation (5) can be expressed in a matrix form:
[ X i 2 X i Y i X i X i Y i Y i 2 Y i X i Y i 1 ] [ A B C ] = [ X i Z σ i Y i Z σ i Z σ i ]
The constants A, B and C are obtained from Equation (6). Thus, the Z-axis coordinate on the least-squared plane Z i can be calculated by substituting A, B and C back into Equation (2), and then the vertical straightness error of every sampling point E i can be calculated by subtracting Z i from Z σ i of Equation (3). Finally, the plane flatness is given by using the extremum of E i :
E = ( E i ) m a x ( E i ) m i n 1 + A 2 + B 2
If the plane of interest is in close proximity to the horizontal plane, i.e., 1 + A 2 + B 2 1 , Equation (7) can be simplified to:
E = ( E i ) m a x ( E i ) m i n

3. Uncertainty Analysis

System errors are mainly originated from environmental variation, modules setup, signal jamming, etc., and the uncertainty analysis represents the distribution range of measured data which include systematic and/or random errors in most cases. Therefore, the uncertainty of measured data should be analyzed as possible to recognize the key factors that may improve the measurement accuracy or to remove potential factors causing inaccuracy of the proposed system.

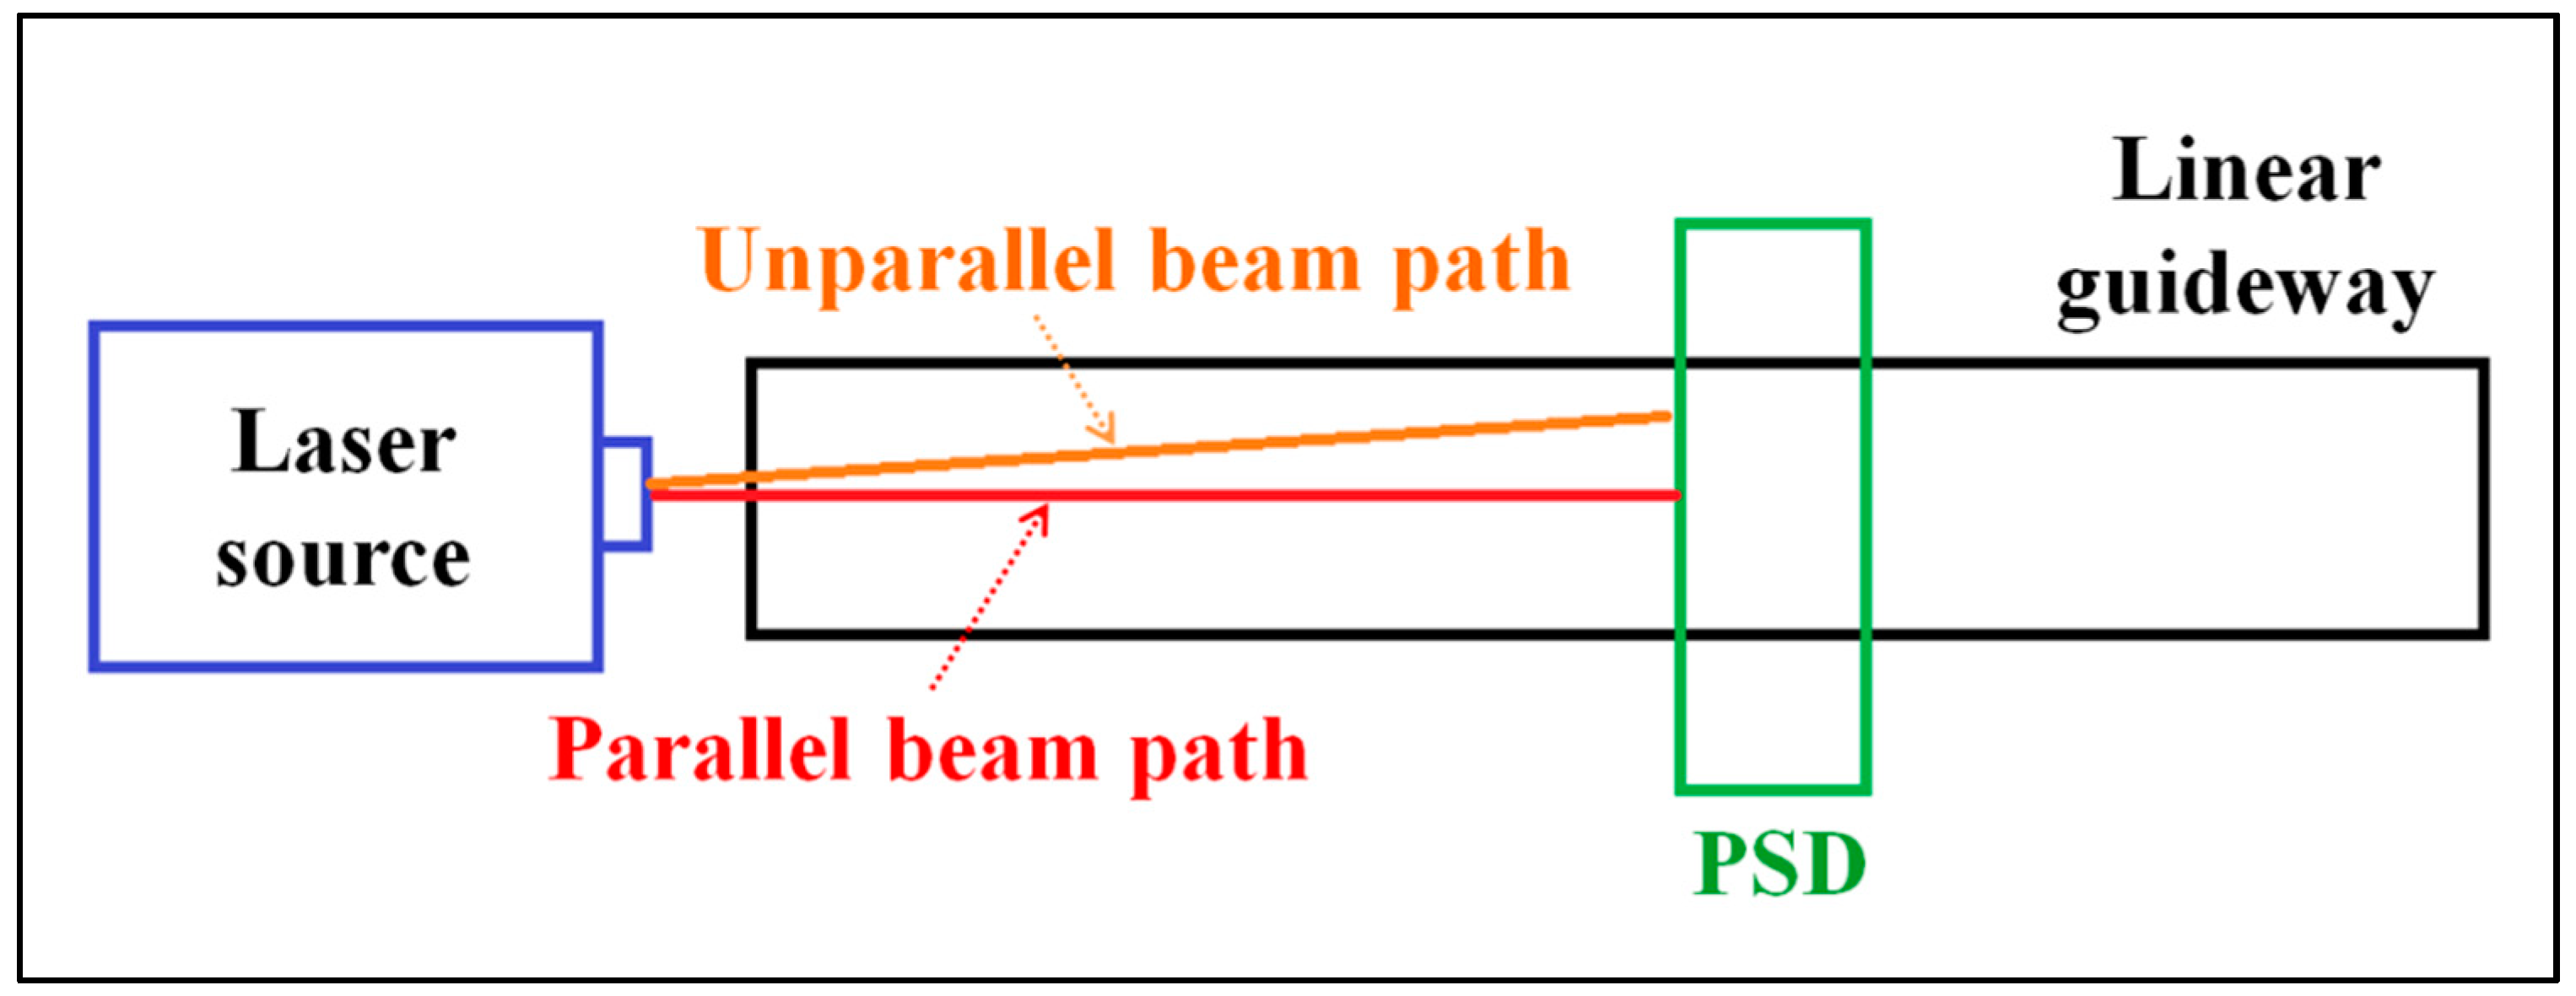
3.1. Vibration Error of the Laser Source

In an ideal environment, Laser source 2 set on the ground is utilized as the measurement baseline, which is supposed to be kept at a static state without any vibration. However, in an actual measurement environment, there may exist an angle error due to the vibration of Laser Source-2 caused by nearby machine operation, crane movement in the factory, staff walking, etc., as shown in Figure 8.
The laser vibration error can be expressed as:
E S h = f ( D L P , θ S h ) = D L P tan ( θ S h )
where E S h is the laser vibration error, D L P is the distance between laser source and PSD, and θ S h is the angle error generated by environmental vibration. Table 1 shows the result of error analysis.

3.2. PSD Setup Error

During the PSD setup process, a pitch/yaw angle error could exist due to PSD fixture, machine operation, misalignment, and so on, which may result in a cosine error in the X- or Y-axis, as shown in Figure 9. The PSD setup error can be expressed as:
E P θ = f ( L P o r , θ P s ) = sec ( θ P s ) L P o r L P o r
where E P θ is the PSD setup error, θ P s is the angle error due to PSD setup, and L P o r is the distance between the beam spot and the center point of PSD detection area. Table 2 shows the PSD setup error.

3.3. Uncertainty of Dual-Axis Measuring

For the 1st straightness measurement module was set on the X-axis of the machine tool; therefore, the vertical straightness error of X-axis ( E x z i , i = 1~n) can be expressed as follows:
E x z i = P 1 z i + D L P 1 i tan ( θ A S i ) + E S h 1 i + E P θ 1 i
where P 1 z i is the measurement of PSD-1, D L P 1 i is the distance between the beam spot and the PSD center, θ A S i is the measurement of the angle sensor, E S h 1 i is the vibration error of LS-1, and E P θ 1 i is the setup error of PSD-1.
The vertical straightness error of X-axis ( E x z i , i = 1~n) can be expressed as follows:
E y z i = P 2 z i + E S h 2 i + E P θ 2 i
where P 2 z i is the measurement of PSD-2, E S h 2 i is the vibration error of LS-2, and E P θ 2 i is the setup error of PSD-2.
The vertical straightness error of machine tool W P z i , which can be observed during the moving of working table, is the most critical factor of vertical straightness and flatness measurements, and is given by:
W P z i = E x z i + E y z i
where E x z i is the vertical straightness error of X-axis, and E y z i is the vertical straightness error of Y-axis of the machine tool.
The compensation of each measured point of the machine tool, Lsm W P z i , can be obtained by substituting W P z i into the least-squares equation:
Lsm W P z i = W P z i A X i B Y i C
The original surface flatness data of workpiece W p D i can be obtained by introducing the measurement of triangulation laser T L i :
W p D i = T L i Lsm W P z i
The workpiece flatness W p F can then calculated by the relation of the maximum and minimum of Lsm W p D i which is obtained by substituting W p D i into the least-squares equation:
Lsm W p D i = W p D i A X i B Y i C
W p F = ( Lsm W p D i ) m a x ( Lsm W p D i ) m i n 1 + A 2 + B 2
Equation (13) represents the sum of vertical straightness errors of X-axis and Y-axis originated from the motion of the working table during the machining process, which is the most critical to the system uncertainty, and can be rewritten by combining Equations (9)–(12):
W P z = P 1 z + D L P 1 tan ( θ A S ) + D L P 1 tan ( θ S h 1 ) + sec ( θ P s 1 ) L P o r 1 L P o r 1 + P 2 z + D L P 2 tan ( θ S h 2 ) + sec ( θ P s 2 ) L P o r 2 L P o r 2
Taking partial derivatives of W P z with respect to the uncertainty factors D L P 1 , θ P s 1 , D L P 2 , and θ P s 2 , we obtain:
W P z = f d f =   f D L P 1 d D L P 1 + f θ P s 1 d θ P s 1 + f D L P 2 d D L P 2 + f θ P s 2 d θ P s 2
f D L P 1 = tan ( θ A S ) + tan ( θ S h 1 )
f θ P s 1 = sec ( θ P s 1 ) tan ( θ P s 1 ) L P o r 1
f D L P 2 = tan ( θ S h 2 )
f θ P s 2 = sec ( θ P s 2 ) tan ( θ P s 2 ) L P o r 2
Finally, the system uncertainty, σ, is given by:
σ = ± ( f D L P 1 d D L P 1 ) 2 + ( f θ P s 1 d θ P s 1 ) 2 + ( f D L P 2 d D L P 2 ) 2 + ( f θ P s 2 d θ P s 2 ) 2
The system uncertainty analysis result is listed in Table 3, and the most critical single factors is d D L P 1 which is originated from the manual setup error of the distance between LS-1 and PSD-1. Meanwhile, although the individual contributions of θ A S and θ S h 1 are less effective than d D L P 1 , yet the combination contribution, i.e., f D L P 1 , is equal to d D L P 1 . This finding reveals that the pitch angle and vibration of LS-1 have to be limited in order to minimize measurement uncertainties.

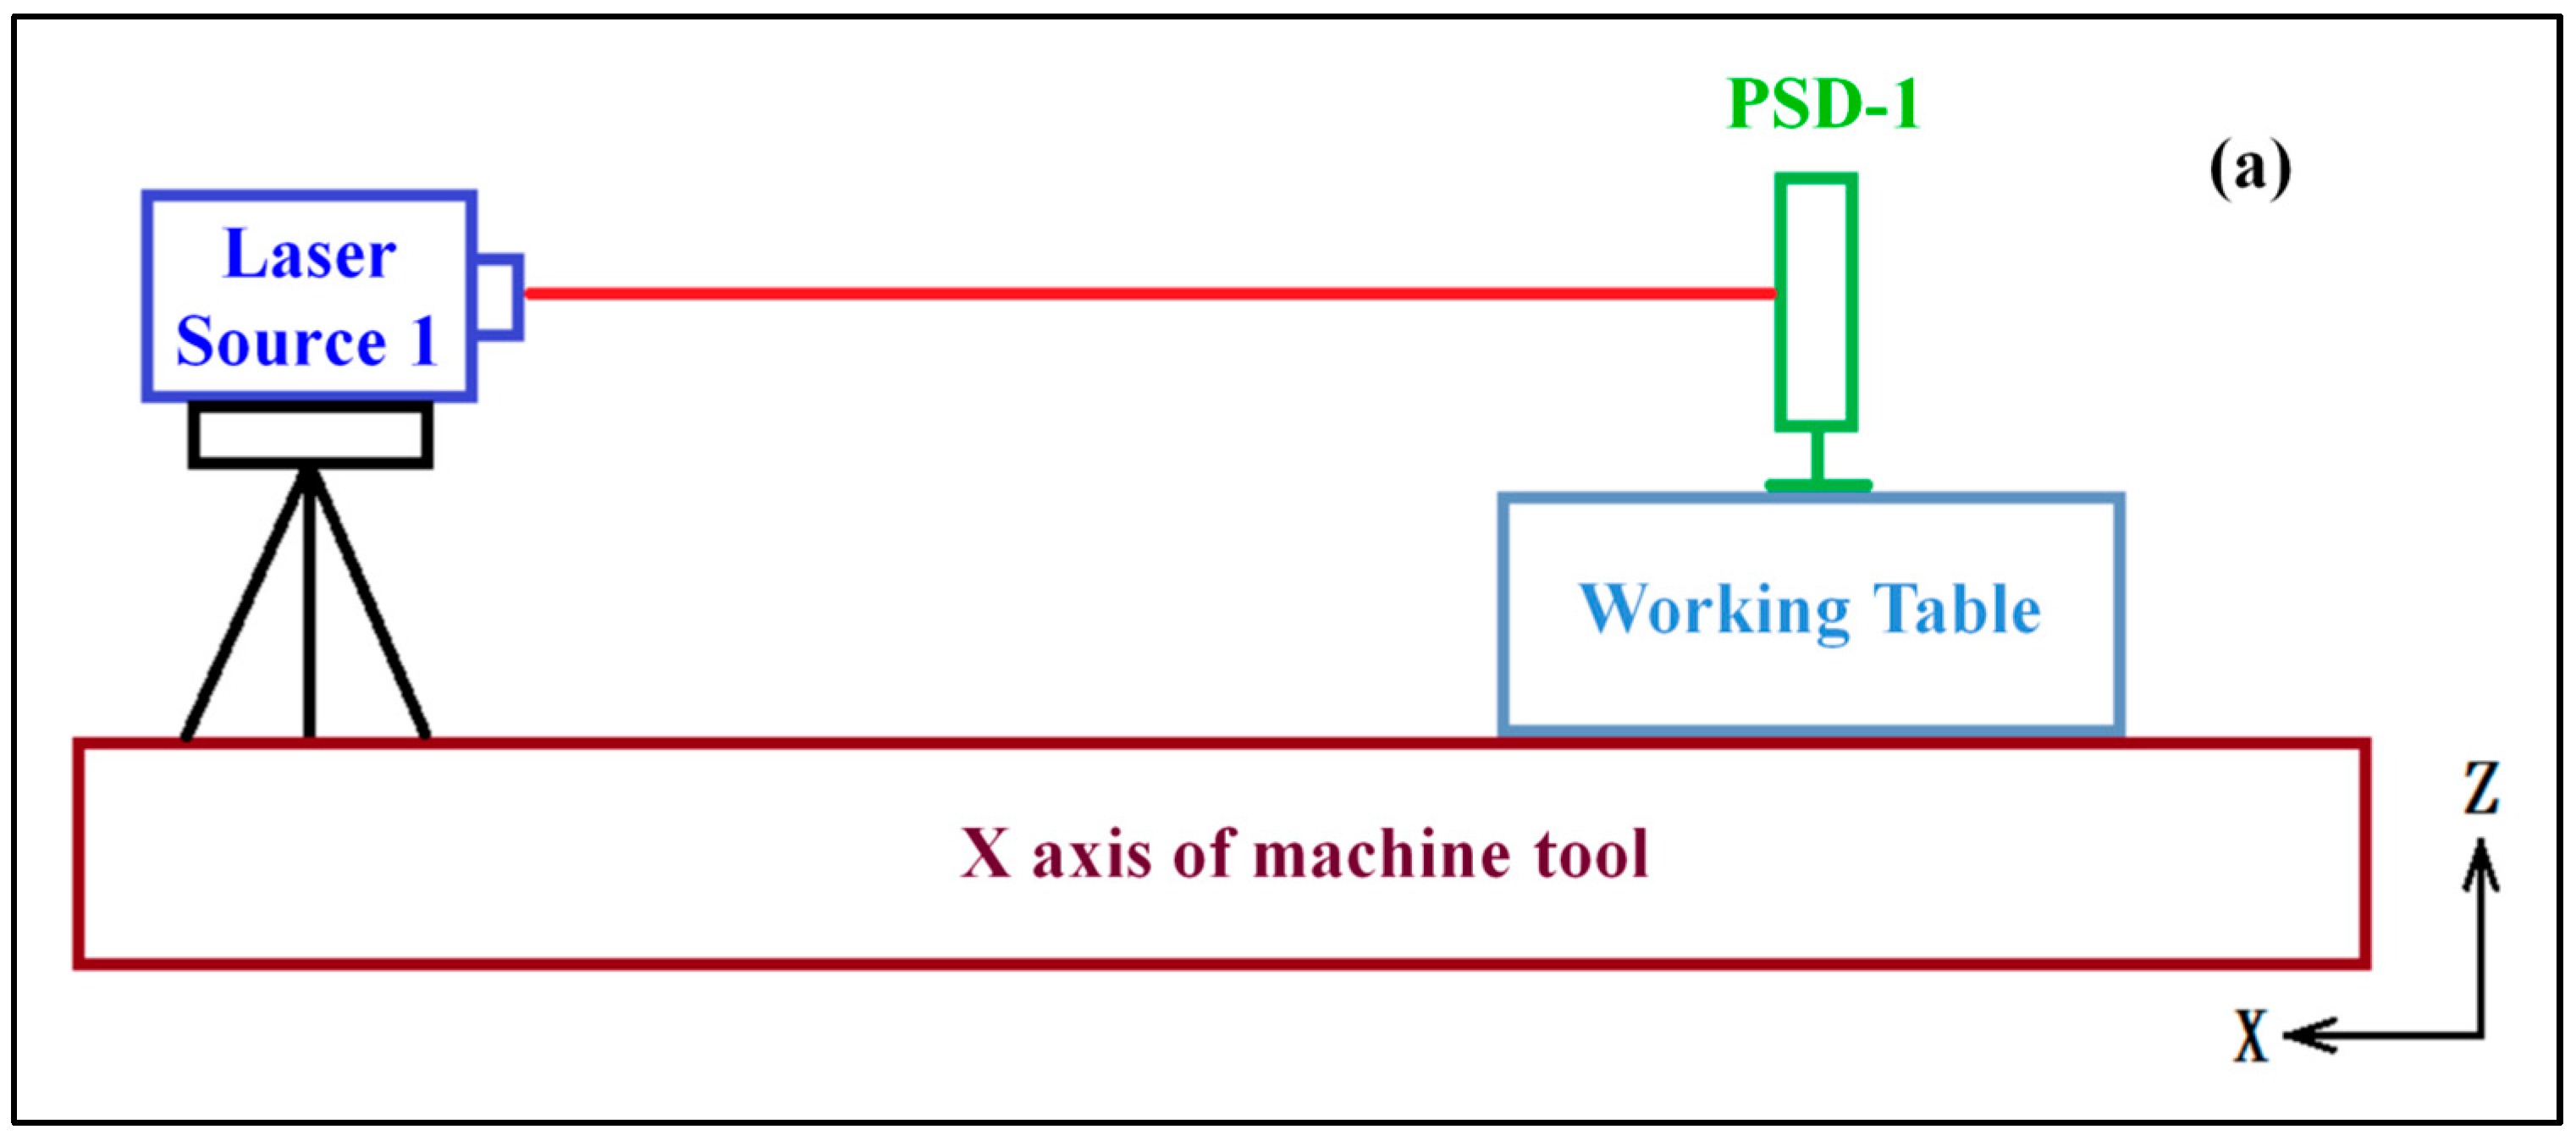
4. System Verification

4.1. Verification of Vertical Straightness Measurements

The verification of the vertical straightness of the proposed system was conducted by using the laser interferometer, which was also utilized for PSD calibration, as a reference to measure the vertical straightness errors of the in-house-developed three-axis machine tool in an air-conditioned laboratory, as shown in Figure 10 and Figure 11.
Figure 12 and Figure 13 show the vertical straightness errors and repeatability of single-axis straightness measurements, and Figure 14 and Figure 15 show those of dual-axis straightness measurements. Table 4 compares vertical straightness verification results of the laser interferometer and the proposed system. The repeatability (3σ) of the laser interferometer and the proposed system were 2.32 μm and 2.32 μm for single–axis measurements, and 2.32 μm and 2.46 μm for dual-axis measurements.

4.2. Verification of the Flatness Measurement System

The flatness error verification of dual-axis measurement system was conducted by measuring the flatness of a surface-scraped cast-iron workpiece (300 mm × 97 mm × 33.9 mm) using a three-axis vertical milling machine tool (KSC-611, KENT, New Taipei city, Taiwan) equipped with a triangulation laser (LK-H020, Keyence Co., Osaka, Japan) in an air-conditioned laboratory, as shown in Figure 4.
The triangulation laser was mounted on the spindle head (i.e., Z-axis) of the machine tool, which was utilized for ball-screw profile detection and flatness measurement in previous study [13,14]. Up to the present, there is no commercial instrument capable of conducting dual-axis straightness measurements on the proposed system, therefore, the feasibility of the proposed system is determined according to the repeatability of the flatness measurement.
Figure 16 shows the vertical straightness error model and corresponding flatness of X-Y plane on the moving working table detected by the proposed system, which could be regarded as the surface topography to a certain extent. The measurement interval of both axes is 50 mm, and the measurement ranges of the X- and Y-axes are 800 mm and 400 mm, respectively. The average flatness and repeatability (3σ) of the proposed system was 12.43 μm and 0.65 μm, respectively.
Obviously, the vertical straightness errors measured along the X-axis with a varied Y-axis position were totally different, and their distribution were generally uneven. These finding prove that vertical straightness error cannot merely rely on the fitting results of individually-measured X- and Y-axis vertical straightness errors using the traditional single-axis method, for the X-axis vertical straightness errors are indeed varying with the Y-axis position.
Before the workpiece flatness being measured, the upper surface of scrapped workpiece was placed on a blue-painted standard plate for marking high points on the scrapped surface. The workpiece was first placed in the detection range of the triangulation laser; thereupon, the proposed system was set on the three-axis machine tool. During the measurement process, the workpiece was moved by the working table according to the requested detection path; in addition, the flatness was obtained via the least-squares analysis.
With the errors compensated by the proposed system, the matched high-points in the dash windows was conspicuously improved, evidencing the cancellation of vertical straightness errors originated from the moving working-table could be a significant benefit for surface topography measurements. Furthermore, both the average flatness and accuracy repeatability (3σ) were also improved from 64.65 μm to 52.14 μm and from 2.13 μm to 1.46 μm, respectively, as shown in Table 5, which proves the system’s feasibility for increasing the accuracy and precision of surface flatness measurements.
Conclusively, it is shown that simultaneously online measurements of the proposed system could be utilized to compensate both the vertical straightness error and the plane flatness of the working table after it being moved to the desired position and this, in turn, increased the machining accuracy.

5. Conclusions

This paper addressed the problems that traditional measurement will have when measuring the vertical straightness on the machine tool. An online simultaneous dual-axis measuring system was developed for improving the machining accuracy by compensating vertical straightness errors of the moving working table using real-measured data, rather than by traditional curve fittings. The proposed system was verified by commercial instrument. The features of the proposed system are described as follows:
  • The vertical straightness of the X- and Y-axes of machine tools can be measured simultaneously with repeatability (3σ) as low as 2.46 μm.
  • The measurements of the proposed system could be utilized to establish the error model for monitoring and compensating the vertical straightness errors of machine tools, especially for vertical milling machines.
  • The surface topography of the workpiece could be significantly improved by vertical straightness error compensation.
  • The flatness of the moving working-table could be compensated by the proposed system with repeatability (3σ) being reduced to as low as 0.65 μm.

Author Contributions

The authors contributed equally to the manuscript.

Funding

This research was funded by Ministry of Science and Technology (MoST) grant number MOST104-2218-E-150-001 And The APC was funded by Ministry of Education.

Acknowledgments

This research was funded by the Ministry of Science and Technology (MoST) of the Republic of China, Taiwan, and the authors gratefully express their sincere acknowledgement to MoST.

Conflicts of Interest

The authors declare no conflict of interest.

References

  1. Schwenke, H.; Knapp, W.; Haitjema, H.; Weckenmann, A.; Schmitt, R.; Delbressine, F. Geometric error measurement and compensation of machines—An update. CIRP Ann. 2008, 57, 660–675. [Google Scholar] [CrossRef]
  2. Fan, K.C.; Zhao, Y. A laser straightness measurement system using optical fiber and modulation techniques. Int. J. Mach. Tools Manuf. 2000, 40, 2073–2081. [Google Scholar] [CrossRef]
  3. Lin, S.-T. A laser interferometer for measuring straightness. Opt. Laser Technol. 2001, 33, 195–199. [Google Scholar] [CrossRef]
  4. Feng, Q.; Zhang, B.; Kuang, C. A straightness measurement system using a single-mode fiber-coupled laser module. Opt. Laser Technol. 2004, 36, 279–283. [Google Scholar] [CrossRef]
  5. Kuang, C.; Feng, Q.; Zhang, B.; Liu, B.; Chen, S.; Zhang, Z. A four-degree-of-freedom laser measurement system (FDMS) using a single-mode fiber-coupled laser module. Sens. Actuators A Phys. 2005, 125, 100–108. [Google Scholar] [CrossRef]
  6. Hwang, J.; Park, C.H.; Gao, W.; Kim, S.W. A three-probe system for measuring the parallelism and straightness of a pair of rails for ultra-precision guideways. Int. J. Mach. Tools Manuf. 2007, 47, 1053–1058. [Google Scholar] [CrossRef]
  7. Iqbal, S.; Gualini, M.M.S.; Asundi, A. Measurement accuracy of lateral-effect position-sensitive devices in presence of stray illumination noise. Sens. Actuators A Phys. 2008, 143, 286–292. [Google Scholar] [CrossRef]
  8. You, F.L.; Feng, Q.B.; Zhang, B. Straightness error measurement based on common-path compensation for laser beam drift. Opt. Precis. Eng. 2011, 19, 515–519. [Google Scholar]
  9. Huang, P.; Li, Y.; Wei, H. Straightness measurement system based on phase sensitive detection technique. In Proceedings of the 2013 International Conference on Optical Instruments and Technology: Optoelectronic Measurement Technology and Systems, Beijing, China, 17–19 November 2013; Volume 9046. [Google Scholar]
  10. Borisov, O.; Fletcher, S.; Longstaff, A.; Myers, A. Performance evaluation of a new taut wire system for straightness measurement of machine tools. Precis. Eng. 2014, 38, 492–498. [Google Scholar] [CrossRef]
  11. Liu, W.; Feng, Q.; Cui, C. The application of fiber-coupled LED in straightness measurement. In Proceedings of the 2015 International Conference on Optical Instruments and Technology: Optoelectronic Measurement Technology and Systems, Beijing, China, 17–19 May 2015; Volume 9623. [Google Scholar]
  12. Feng, W.L.; Yao, X.D.; Azamat, A.; Yang, J.G. Straightness error compensation for large CNC gantry type milling centers based on B-spline curves modeling. Int. J. Mach. Tools Manuf. 2015, 88, 165–174. [Google Scholar] [CrossRef]
  13. Hsieh, T.H.; Jywe, W.Y.; Huang, H.L.; Chen, S.L. Development of a laser-based measurement system for evaluation of the scraping workpiece quality. Opt. Laser Eng. 2011, 49, 1045–1053. [Google Scholar] [CrossRef]
  14. Huang, H.L.; Jywe, W.Y.; Liu, C.H.; Duan, L.; Wang, M.-S. Development of a novel laser-based measuring system for the thread profile of ballscrew. Opt. Laser Eng. 2010, 48, 1012–1018. [Google Scholar] [CrossRef]
Figure 1. Schematic diagram of PSD calibration using laser interferometer.
Applsci 08 02130 g001
Figure 2. Setup of PSD calibration using a laser interferometer.
Applsci 08 02130 g002
Figure 3. Schematic diagram of the dual-axis measurement system.
Applsci 08 02130 g003
Figure 4. Setup of the dual-axis measurement system.
Applsci 08 02130 g004
Figure 5. Schematic diagram showing the setup error.
Applsci 08 02130 g005
Figure 6. Pitch angle error of the laser source due to the motion of the working table: (a) moving away; and (b) moving closer to the laser source.
Applsci 08 02130 g006aApplsci 08 02130 g006b
Figure 7. Schematic diagram of dual-axis measuring mechanism.
Applsci 08 02130 g007
Figure 8. Measurement errors due to laser source vibration.
Applsci 08 02130 g008
Figure 9. PSD setup error.
Applsci 08 02130 g009
Figure 10. Verification setup of single-axis measurements.
Applsci 08 02130 g010
Figure 11. Verification setup of dual-axis measurements.
Applsci 08 02130 g011
Figure 12. Vertical straightness errors of single-axis measurement verification: ■▲●—laser interferometer, and □△〇—proposed system.
Applsci 08 02130 g012
Figure 13. Repeatability of single-axis measurement verification.
Applsci 08 02130 g013
Figure 14. Vertical straightness errors of single-axis measurement verification: ■▲●—laser interferometer, and □△〇—proposed system.
Applsci 08 02130 g014
Figure 15. Repeatability of dual-axis measurement verification.
Applsci 08 02130 g015
Figure 16. Vertical straightness error distribution and corresponding flatness of the X-Y plane.
Applsci 08 02130 g016
Table 1. Error analysis of laser-source vibration
D L P (mm) θ S h (arc-sec) E s h (μm)
100014.8
1000524.4
5000124.2
50005121.2
Table 2. Error of PSD setup.
L P o r (μm) θ P s (Degree) E P θ (μm)
1000.50.0038
10010.0152
Table 3. System uncertainties.
θ A S (arc-sec) θ S h 1 (arc-sec) L P o r 1 (μm) θ S h 2 (arc-sec) L P o r 2 (μm) d D L P 1 (μm) d θ P s 1 (arc-sec) d D L P 2 (μm) d θ P s 2 (arc-sec)σ (μm)
111011050003605003600.05
111011050,000360050,00036000.60
101010010100500036050003600.60
555055010,00072010,0007200.60
1101001010050,000360050,00036004.37
1011001010050,000360050,00036004.37
1010101010050,000360050,00036005.70
1010100110050,000360050,00036005.45
1010100101050,000360050,00036005.70
1010100101005000360050,00036003.49
10101001010050,00036050,00036005.70
10101001010050,0003600500036005.45
10101001010050,000360050,0003605.70
10101001010050,000360050,00036005.96
20101001010050,000360050,00036008.05
10201001010050,000360050,00036008.05
20201001010050,000360050,000360010.30
10101002010050,000360050,00036007.29
10102001010050,000360050,00036006.68
10101001020050,000360050,00036006.68
101010010100100,000360050,000360010.30
10101001010050,000720050,00036006.68
10101001010050,0003600100,00036007.29
10101001010050,000360050,00072006.68
202010010100100,000360050,000360019.70
10102001010050,000720050,00036009.01
10101002010050,0003600100,000360011.12
10101001020050,000360050,00072009.01
Table 4. Verification of vertical straightness measurements.
InstrumentLaser InterferometerProposed System
Result
Single-axis MeasuringError (μm)1.982.673.852.873.434.72
Repeatability (3σ, μm)2.322.32
Dual-axis MeasuringError (μm)4.433.042.624.342.662.55
Repeatability (3σ, μm)2.322.46
Table 5. Compensation result of surface flatness by the proposed system.
Workpiece Surface Flatness (μm)
Measured by Triangulation LaserCompensated by Proposed System
1st measurement63.3651.23
2nd measurement65.3052.49
3rd measurement65.3152.15
4th measurement64.5752.62
5th measurement64.7152.20
Average64.6552.14
Repeatability (3σ)2.131.46

