Article

Proteomic Evaluation of Insecticidal Action of Phosphine on Green Peach Aphids, Myzus persicae

1
School of Applied Biosciences, Kyungpook National University, Daegu 41566, Korea
2
Animal and PlantQuarantine Agency (APQA), Gimcheon 39660, Korea
*
Author to whom correspondence should be addressed.
These authors contributed equally to this work.
Appl. Sci. 2018, 8(10), 1764; https://doi.org/10.3390/app8101764
Submission received: 21 August 2018 / Revised: 27 September 2018 / Accepted: 28 September 2018 / Published: 29 September 2018

Abstract

:

Featured Application

The specific application of the research aims to control insect pests by fumigants.

Abstract

Phosphine (PH3) fumigation is one of the best alternatives to methyl bromide for regulating insect pests during storage and shipping. Recently, this treatment has been applied to other agricultural insect pests, including Myzus persicae. To understand the mode of PH3 toxicity in M. persicae, proteomic analyses using liquid-chromatography tandem mass spectrometry were conducted to measure comparative protein expression levels between PH3-treated samples and controls. PH3 treatment increased NADH dehydrogenase (ubiquinone) flavoprotein 1, mitochondrial-like (complex I) expression, but decreased complex II and ATPases in the mitochondrial electron transport chain (ETC) of M. persicae. Glucosidase and antimicrobial proteins such as lysozymes showed enhanced expression in PH3-treated M. persicae. Some regulatory proteins related to apoptosis were more abundant in PH3-treated M. persicae. Biochemical activities of acetylcholinesterase (AChE) and cytochrome c oxidase (COX) were also measured because these enzymes are known to be targeted by PH3. Only COX activity decreased in relation to increasing PH3 concentrations in adult M. persicae. The expression of six selected genes were determined in relation to PH3 treatments. No two-fold changes in the expression of the six genes was observed. Thus, PH3 toxicity caused disruption in the ETC and glucose supply, as well as dis-regulation of apoptosis in M. persicae.

Graphical Abstract

1. Introduction

Tablets of various phosphine (PH3)-containing chemicals, including aluminum phosphide, release PH3s, which have been extensively used as fumigants for the control of insect pests, thereby minimizing trading risks and protecting stored agricultural products [1]. In addition, PH3s have been introduced as an alternative to methyl bromide for controlling adult greenhouse thrips (Heliothrips haemorrhoidalis), adult aphids (Myzus persicae), and light brown apple moth larvae (Epipyas postvittana), in cut flowers [2]. Based on the trials, the most effective formulation for aphids was 1000 μL/L PH3 + 33% CO2 for 4 h, while all tested insects were killed within 36 h of exposure [2].
Furthermore, M. persicae can be controlled by Brassicacaeae ethyl ester oils [3], a certain wavelength of light-emitting diodes [4], and biologically using banker plants with Aphidius colemani [5]. Recently, ethyl formate (EF) was used to control M. persicae by fumigation and this fumigant induced 2-fold cytochrome c oxidase (COX) activity in comparison with the control [6]. Stewart and Mon [7] introduced the use of EF fumigation to protect film-wrapped lettuces from M. persicae.
Interestingly, PH3 and EF have been combined for use in the control of insect pests. The combination of PH3 and EF effectively killed Aphis gossypii, the cotton aphid [8], whereas individual treatments with PH3 fumigation over short periods of time or at low EF concentrations provided relatively low eradication rates. The combination may also completely control the eggs of Planococcus citri (Hemiptera: Pseudococcidae) on pineapples, when applied at concentrations of 25.1/1.0 (EF/PH3) mg/L at 8 °C for 4 h [9].
This combined fumigation has been used to eradicate M. persicae efficiently and may hinder the development of PH3 and/or EF resistance in M. persicae. PH3 resistance in various insect pests have been reported throughout the world in various insect species, including Rhyzopertha dominica, Tribolium castaneum, and Cryptolestes ferrugineus [10,11,12], leading farmers and fumigators to explore new fumigation tools to control PH3-resistant insect pests in storage facilities [13,14].
This study assessed the acute toxicity in M. persicae caused by PH3 to determine its lethal concentration LC10 and LC50 values. Regarding the acute toxicity, activities of two enzymes such as acetylcholinesterase (AChE) and cytochrome c oxidase (COX) were measured to know the actual target sites of PH3. AChE and COX have been known to be the target site of an organophosphorus insecticide and PH3, respectively. Besides, expression levels of six genes responsible for expressing cytochrome P450 6CY3 (cyp6cy3), farnesyl diphosphate synthase 1 (fps1), acetylcholinesterase (ache), voltage gated sodium channel subunit 1 (para), nicotinic acetylcholine receptor alpha 3 subunit (ni-acr), and ecdysone receptor (ecr) were also measured to understand effects of PH3 on metabolism, neurotransmission system, and growth in M. persicae. Finally, overall protein expression levels were compared between the PH3-treated adults of M. persicae and the control using liquid-chromatography tandem mass spectrometry (LC-MS/MS) to find further biochemical reasons for the explication of the toxic effect by PH3.

2. Material and Methods

2.1. Chemicals

PH3 was obtained as ECO2Fume™ (2% PH3 + 98% CO2) from Cytec (Sydney, Australia). Acetylthiocholine iodide (ATChI), bovine serum albumin (BSA), cytochrome c, 5,5′-dithiobis (2-nitrobezoic acid) were purchased from Sigma-Aldrich (St. Louis, MO, USA). The DEPC-treated water was purchased from Biosesang (Seongnam, Korea). The Rotor-Gene SYBR Green PCR Kit and QIAzol Lysis reagent were purchased from Qiagen (Düsseldorf, Germany), and the Maxima First Strand cDNA Synthesis Kit with dsDNase was purchased from Thermo Fisher Scientific (Waltham, MA, USA).

2.2. Insect Strain and Breeding

Adults of Myzus persicae acquired from Quarantine and Inspection Agency (Gimcheon, Korea) were placed on Chinese cabbages, which were grown to a 5 to 7 cm leaf length, for feeding and breeding 17 days after seeding. Chinese cabbages were maintained in a glass greenhouse at 30 ± 1 °C and a relative humidity of 30%. The M. persicae were placed and bred on Chinese cabbages in 5 pots in an acrylic growth cage (30 × 30 × 45 cm) at 25 ± 1 °C and a relative humidity of 50–60%.

2.3. Fumigation Assay of PH3

A fumigation bioassay using a concentration of 0.01 to 1.0 mg/L of PH3 (ECO2Fume™: 2% PH3 + 98% CO2, Cytec, Sydney, Australia) was performed with 30 nymphs or adults of M. persicae placed in desiccators (12 L, Duran, Germany) sealed with glass stoppers containing a septum of filter paper for 20 h for PH3 at 20 °C. A 12-L desiccator (Bibby Scientific, Stone, UK, Cat. No. FE 12L/4) equipped with a lid fitted with a septum injection system (Alltech Crop Science, Nicholasville, KY, USA, Cat. No. 95326) was used for the fumigation of M. persicae. The volume of each desiccator was measured by weighing the amount of water at 20 °C. A magnetic bar was placed at the bottom of each desiccator to stir the gas and ensure even distribution of the fumigant.

2.4. Measurement of PH3 Concentrations

To monitor the fumigation concentration in the 12-L desiccator, 50-mL gas samples were drawn with a syringe from the chamber and stored in 1-L Tedlar® gas sampling bags (SKC, Dorset, UK) and analyzed, typically within 10 min of sampling. The concentration of PH3 was monitored at 10 min and 1, 3, 6, and 20 h. The subsequent concentration was determined using an Agilent GC 7890A equipped with a flame photometric detector (FPD) and HP-PLOT/Q (30 m × 530 µm × 40 µm; Agilent, Santa Clara, CA, USA) operating in split mode (10:1). The injector and oven temperatures were set to 200 °C. The detector temperature was 250 °C. The injection volume and flow rate were 20 µL and 5 mL/min, respectively. The concentrations of PH3 were calculated based on peak areas against external standards.

2.5. Determination of the Concentration × Time (CT) of Fumigants

The concentrations of the fumigants were monitored at timed intervals over the exposure period and used to calculate the CT (concentration × time) values using Equation (1).
CT = ∑ (Ci + Ci+1) (ti+1 − ti)/2
where C is the concentration of the fumigant (mg/L); t is the time of exposure (h); i is the order of measurement; and CT is the concentration × time (mg h/L)
PH3 toxicity against M. persicae was described as the mortality of >30 M. persicae adults for at least three different CT values based on an average and SE (standard error) analysis. We calculated the concentration × time values for 10% (CT 10) and 50% mortality (CT 50), as well as the time values for 10% and 50% mortality due to PH3 and EF fumigation based on a Probit analysis using the SPSS statistics software (version 23.0).

2.6. Protein Extraction

Two groups of M. persicae were collected after fumigation assay of PH3, and immediately frozen at −70 °C. The frozen M. persicae (50 individuals) were homogenized with Tris-buffer containing 500 mM sucrose (pH 7.4) using pencil-type homogenizer. The homogenized solution was centrifuged at 600× g and 4 °C for 10 min. The supernatant (whole protein extract) was centrifuged at 10,000× g and 4 °C for 15 min, the pellet containing mitochondria was named “the mitochondrial fraction,” and the supernatant containing the soluble cytosolic portion was named “the S9 fraction”. Protein quantification was performed using the Bradford Assay with the Protein Assay Dye Reagent Concentrate (Bio-Rad, Hercules, CA, USA), and the protein standard curves were constructed using varying concentrations of BSA according to the manufacturer’s recommendations.

2.7. Enzyme Assay

The reduced cytochrome c was prepared as follows for use as the substrate of COX. Cytochrome c (2.7 mg) was weighed and dissolved in 1 mL of distilled water. To this solution, 5 μL of 0.1 M 1,4-Dithiothreitol (DTT) was added as a reducing agent and allowed to react at room temperature for 30 min until the color changed from dark brown to pale pink. The fully reduced cytochrome c solution was diluted 10-fold with Tris-buffer (120 mM KCl, 10 mM Tris-HCl, pH 7.4) and used as the reaction solution of COX. The mitochondrial fraction was properly diluted with Tris-buffer containing 500 mM sucrose (pH 7.4). To measure the activity of COX, 20 μL of the mitochondrial fraction containing 0.0012 mg of proteins and 180 μL of the reaction solution were mixed in a 96-well plate at 25 °C and measured at 550 nm for 30 min at 30 s intervals.
Acetylcholinesterase (AChE) activity was determined using the Ellman method [15] at 412 nm. These enzyme activities were measured using the S9 fraction as described above. Enzyme activities were expressed in units/mg, meaning one unit would react with 1 μM substrate per min at 25 °C and pH 7.4. The data were expressed as mean ± standard deviation (SD) and analyzed using a one-way analysis of variance (ANOVA) and Tukey’s test as a post-hoc test in SPSS (version 23.0). All experiments were independently performed in triplicate.

2.8. RNA Extraction and RT-qPCR

M. persicae (50 individuals) in two groups were independently collected and frozen immediately at −70 °C. M. persicae were rinsed twice with DEPC-treated water and homogenized using pencil-type homogenizer. The DEPC-treated water was purchased from Biosesang (Seongnam, Korea). To the homogenized sample, 1 mL of QIAzol lysis reagent (Qiagen, Düsseldorf, Germany) was added and incubated on ice for 20 min. The total RNA of each M. persicae group was extracted according to the manufacturer’s protocol. The quality of total RNA was determined by measuring its A260/280 nm ratio (1.8–2.0) and checked by agarose gel electrophoresis. The Complementary DNA (cDNA) was immediately synthesized using the Maxima First Strand cDNA Synthesis Kit for RT-qPCR (Thermo Fisher Scientific Inc., Waltham, MA, USA) and stored at −20 °C. A quantitative PCR (qPCR) was performed with a CYBR® Green kit using Rotor-gene® Q (Qiagen, Düsseldorf, Germany) following the manufacturer’s recommendations: 95 °C for 10 min (hold), followed by 40 cycles of 95 °C for 10 s, 60 °C for 15 s, and 72 °C for 20 s, and then an increase of 1 °C from 72 °C to 95 °C (melt). The primers for M. persicae were designed using Primer-BLAST (Ye et al., 2012) and are listed in Table S1. The beta-actin (actb) and ribosomal protein S2 (rps2) were used to normalize the expression level of the gene of interest (GOI). The results of RT-qPCR were expressed using the ∆∆Ct method [16] and analyzed using a one-way ANOVA and Tukey’s test as a post-hoc test using the SPSS statistics software (version 23.0). All experiments were independently performed in triplicate.

2.9. Protein Preparation for Proteomics

The whole protein extract containing the mitochondrial fraction was obtained from M. persicae, following the same procedure mentioned in Section 2.6. The Tris-buffer containing 500 mM sucrose (pH 7.4) and Protease Inhibitor Cocktail Set I (Calbiochem, San Diego, CA, USA) was used to avoid protein degradation during protein extraction. The protein extracts were denatured by incubating them with 50 mM ammonium bicarbonate buffer (pH 7.8) containing 6 M Urea for 3 h at room temperature. The denatured protein extracts were incubated with 10 mM dithiothreitol for 2 h at room temperature to reduce their disulfide bonds. Subsequently, the reduced protein extracts were reacted first with iodoacetamide (IAA) for 1 h and then with trypsin at 37 °C in a shacking incubator for 18 h. The reacted samples were desalted using the Sep-Pac C18 cartridges (Waters Co., Milford, MA, USA) according to the manufacturer’s protocol.

2.10. Proteomic Analysis Using a Nano-LC-ESI-MS/MS

A Thermo Scientific Q Exactive Hybrid Quadrupole-Orbitrap (Thermo Fisher Scientific Inc., Waltham, MA, USA) equipped with Dionex U 3000 RSLCnano HPLC system was used for proteomic analyses. The mass spectrometric analyses were performed with a nano-electrospray ionization source (ESI) and a fused silica emitter tip (New Objective, Woburn, MA, USA). The water/acetonitrile (98:2 v/v) solution containing 0.1% formic acid was used as the aqueous mobile phase. The samples were trapped on an Acclaim PepMap 100 trap column (100 μm × 2 cm, nanoViper C18, 5 μm, 100 Å) and washed for 6 min at a flow rate of 4 μL/min and then separated on an Acclaim PepMap 100 capillary column (75 μm × 15 cm, nanoViper C18, 3 μm, 100 Å) at a flow rate of 300 mL/min. The resulting peptides were electro-sprayed through a coated silica tip at an ion spray voltage of 2000 eV. The mass data were analyzed using Proteome Discoverer 1.4, MaxQuant 1.6, and Scaffold 4.8.4 against the protein databases for M. persicae. Significant differences between two groups of data were obtained using Student’s t-test (p < 0.05).

3. Results

3.1. Susceptibility of M. persicae under PH3 Treatments and Biochemical Changes

Lethal concentration values due to PH3 treatment are displayed in Figure 1. There were no dramatic changes in LCT values between developmental stages of M. persicae. However, adults M. persicae were slightly more susceptible to PH3 fumigation than aphid nymphs.
One of the known target sites of PH3 fumigation in insect pests is COX; its biochemical activity was measured using a substrate, cytochrome c, after the PH3 treatments, corresponding to the LCT10 and LCT50 values in comparison with that of the control (Figure 2A). Cytochrome c oxidase activities in M. persicae nymphs were not affected by PH3 treatment but decreased in M. persicae adults as PH3 concentrations increased. These changes were statistically different, but they did not increase by up to 2-fold. The effects of PH3 fumigation on the biochemical activities of another well-known target of organophosphorus insecticides such as malathion and fenitrothion, i.e., AChE, was also measured in M. persicae using acetylthiocholine iodide (ATChI). There was no effect of PH3 treatments on AChE (Figure 2B) probably because its expression was not related to PH3 toxicity in M. persicae.
Expression levels of six genes in M. persicae: cytochrome P450 (CYP6CY3) (cyp6cy3), farnesyl diphosphate synthase 1 (fps1), acetylcholinesterase (ache), voltage gated sodium channel subunit 1 (para), nicotinic acetylcholine receptor alpha 3 (ni-acr), and ecdysone receptor (ecr), were determined in response to PH3 fumigation (Figure 3). In M. persicae nymphs, ni-acr, fps1, para, and ecr genes were upregulated after PH3 treatments (Figure 3). Similarly, in adult M. persicae, ni-acr and ecr were upregulated, whereas fps1 gene was down-regulated after PH3 treatments.
The expression of the tested genes did not increase by 2-fold in comparison with that in the control, but their expressions were statistically different in the two concentrations.

3.2. Proteomic Changes in M. persicae after PH3 Treatment

A total of 1692 proteins were identified in the PH3-treated and non-chemically treated M. persicae. Among them, 49 proteins were up- and down-regulated in the PH3-treated M. persicae, while 13 proteins were newly expressed or could not be detected after PH3 treatment (Figure 4 and Figure 5, Tables S3 and S4). Folds in expression levels of proteins identified in the PH3-treated M. persicae varied widely and increases by at least 2-fold in comparison with that in the control were considered in this study. Some proteins with small increases were ignored in the study, even if they were statistically significant.
The primary changes in protein expression after PH3 treatment in M. persicae were found in the proteins of the respiratory system, including the upregulated NADH dehydrogenase (ubiquinone) flavoprotein 1 (×3.35-fold), cytochrome b-c1 complex subunit Rieske (×0.53-fold), and the ATP synthase subunit g (×0.54-fold) (Figure 4A). Cytochrome oxidase subunit II involved in ETC were also changed, but its change was not dramatic when compared to the control (×0.70-fold) (Figure 4A).
Some of the defense proteins, glutathione S-transferase-like (×2.26-fold), lysozyme-like (×3.14-fold), probable protein phosphatase 2C 6 (×2.02-fold), and clusters of esterase E4-like isoform X1 were highly upregulated in PH3-treated M. persicae. However, multidrug resistance-associated protein 4-like was found to be reduced in PH3-treated M. persicae (Figure 4B). Interestingly, the expression of several carbohydrate-related proteins in response to the PH3 treatment were also varied: galactokinase-like (×2.2-fold), glucosidase 2 subunit beta-like (×10.3-fold), and sugar transporter SWEET1-like (Figure 4C).
On the contrary, histone H2A-like (×0.19-fold), histone H2B-like (×0.35-fold), histone H2A.V (×0.032-fold), histone H3 (×0.19-fold), which are highly alkaline proteins in eukaryotic cells, and circadian clock-controlled protein-like (×0.17-fold) were dramatically down-regulated in PH3-treated M. persicae (Figure 5A).
Various regulatory proteins, myelin expression factor 2 (×0.20-fold, Figure 5B), aspartate–tRNA ligase, cytoplasmic (×2.18-fold, Figure 5C), ubiquitin-conjugating enzyme E2 (×3.60-fold, Figure 5C), viz., type proton ATPase subunit d (×2.38-fold, Figure 5D), lamin Dm0-like (×0.52-fold, Figure 5D), ras-related protein Rab-5C (×0.51-fold, Figure 5E), caspase-1-like (×0.14-fold, Figure 5E), and cathepsin B (×2.07-fold, Figure 5E) were differentially expressed in M. persicae after PH3 treatment.
After PH3 treatment, some regulatory proteins were newly produced, viz. slit homolog 1 protein-like, and the expression of some were completely reduced, viz., of cleavage and polyadenylation specificity factor subunit 5 isoform X1, calphotin-like, and protein FAM98A (Figure 5).

4. Discussion

PH3 toxicity has been widely studied using its target invertebrates, including stored products insect pests, to understand how it disrupts normal physiological functions, leading to death [10,11,12]. A recent paper by Nath et al. [17] reviewed the two major routes of PH3 toxicity; an energy imbalance via the breakdown of the electron transport system in mitochondria, and metabolic disturbance. Other toxic mechanisms by which PH3 acts have been identified in rats and other mammals, such as a neurological disorder via potent inhibition on AChE activity, and severe inhibitory effects on metalloproteins, such as catalases and COX [18].
Prior to an amassing a deeper understanding of PH3 toxicity in M. persicae, many studies showed that PH3 interfered with COX activity, which is known as complex III in the electron transport chain [18,19]. Cytochrome c cox is a hemeprotein, within which PH3 can easily form coordination bonds with the ferric ions, thereby reducing COX activity to produce less ATP than normal [18].
In our study, M. persicae was exposed to low PH3 concentrations as LCT10 value (LC10 value), which did not kill M. persicae. As shown in Figure 2, in the PH3-treated adults M. persicae COX activity decreased with increasing concentrations of PH3. However, this does not indicate that a direct inhibition of PH3 on the target site of COX occurred or there was an indirect inhibition of COX activity by PH3. LC-MS/MS analysis showed that COX expression decreased after PH3 treatment (Figure 4A). Therefore, a reduction in COX activity after PH3 treatment was related to the reduced expression of the corresponding protein in M. persicae. This result was confirmed by Chaudhry and Price [18], who showed that no spectral changes with COX were found after the PH3 treatment, indicating that there was no direct or weak contact between the COX protein and PH3 molecules. On the contrary, other hemeproteins, hemoglobin, and myoglobin showed slow deoxygenation with spectral changes after PH3 treatment [18].
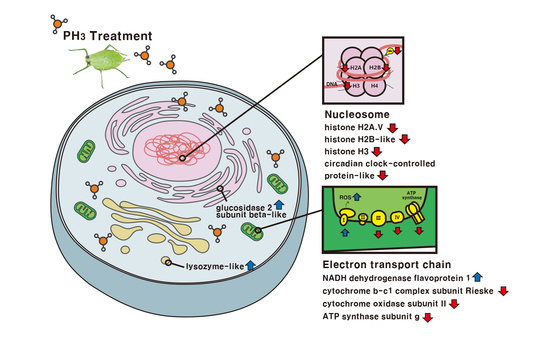
Interestingly, changes in COX activity were not dramatic, whereas cytochrome b-c1 complex subunit Rieske and ATP synthase subunit g in the PH3-treated M. persicae decreased by around 0.5-fold in terms of protein expression when compared with the control. Similarly, a reduction in ATP synthase was confirmed by Liu et al. [20], which showed a 0.15-fold change in PH3-treated larvae of the peach fruit moth, Carposina sasakii Matsumura, using 2-dimesional electrophoresis with the MALDI-TOF MS analysis.
In this study, the most important finding is the dramatic change in NADH dehydrogenase (ubiquinone) flavoprotein 1 (×3.35-fold), which is complex I in the electron transport chain. It may be the first evidence that this protein is involved in PH3 toxicity in M. persicae. The ETC in the PH3-treated M. persicae was largely modified and the imbalance in ATP production was probably related to the metabolic disorder, leading to death of M. persicae.
However, regarding the up-regulation of NADH dehydrogenase (ubiquinone) flavoprotein 1 (complex I), one possible cause of PH3 toxicity may be the overproduction of reactive oxygen species (ROS). As ROS are primarily generated in the mitochondrial ETC, complexes I and III are major sites for the production of small quantities of ROS [20,21]. Normally, the generated ROS is converted to hydrogen peroxide by superoxide dismutase, and then hydrogen peroxide can be transformed to water by peroxidases, which PH3 inhibits in Sitophilus granarius [22]. Therefore, more ROS formation will probably occur in response to the up-regulation of complex I after PH3 fumigation, and this ROS generation can lead to the death of M. persicae during PH3 fumigation. In addition to this oxidative stress, one of the regulatory proteins, ion protease homolog in mitochondria, was down-regulated and it is involved in maintaining protein quality and controlling the occurrence of misfolded or incompletely synthesized proteins (Figure 4A). We need to further study the role of proteins in PH3 toxicity in M. persicae.
During PH3 treatment, M. persicae experienced induced expression of defense-related proteins including glutathione S-transferase-like (×2.26-fold), lysozyme-like (×3.14-fold), probable protein phosphatase 2C 6 (×2.02-fold), and a cluster of esterase E4-like isoform X1 (Figure 4B). These are involved in chemical detoxification (glutathione S-transferase-like and Cluster of esterase E4-like isoform X1) and antimicrobial properties (lysozyme-like and probable protein phosphatase 2C 6). Glutathione S-transferase-like and a cluster of esterase E4-like isoform X1 are easily found in organophosphorus insecticides (OP insecticides)-resistant M. persicae [23]. Therefore, their up-regulation in PH3-treated M. persicae is related to the chemical structure of PH3 and this includes the phosphorus ion. However, they may not be involved with the actual mechanism of PH3 detoxification in the insect because PH3 does not have an ester bond for esterase or an electrophilic site for conjugation reaction by glutathione S-transferase.
However, there was no relationship between the inhibition of AChE activity and PH3 treatment in M. persicae in our study (Figure 2), even though PH3 inhibited AChE activity in Ephestia cautella (Lepidoptera: Pyralidae) [22]. This difference may be due to the low (equivalent to LCT10) concentration of PH3 in the treatments. Al-Hakkak et al. [24] used a series of concentrations of PH3 treatments, which could kill the pupae of Ephestia cautella. This phenomenon has been corroborated by Nayak and Collins [25], who showed that PH3 toxicity was influenced by concentration, in a study involving fumigation of Liposcelis bostrychophila. Therefore, at a low PH3 concentration, AChE activity will not be targeted in insects. Other neurologically related proteins, including neurotransmitter receptors and channels, were not affected by PH3 fumigation (Figure 3).
At low PH3 concentrations, various regulation signals such as synaptic vesicle membrane protein VAT-1 (negative regulation of mitochondrial fusion), V-type proton ATPase subunit d (regulation of macroautophagy), serine/threonine-protein phosphatase 2A catalytic subunit alpha isoform (positive regulation of apoptotic process), cathepsin B (regulation of apoptotic process), and slit homolog 1 protein-like (positive regulation of apoptotic process, response to cortisol), were turned on in M. persicae (Figure 4 and Figure 5). This suggests that even low PH3 concentrations induce the apoptotic process in M. persicae.
Finally, metabolic changes in relation to PH3 toxicity were also observed with the up-regulation of glucosidase2 subunit beta-like (×10.3-fold) and galactokinase-like (×2.20-fold), similar to findings by Nath et al. [17]. This may be the first study to show such dramatic increases in glucosidase in relation to PH3 toxicity.

5. Conclusions

The fumigation toxicity of low concentrations of PH3, equivalent to LCT10, which were not fatal to M. persicae was determined using LC-MS/MS proteomic analyses. At low concentrations of PH3 fumigation, the ETC in mitochondria was dramatically modified to up-regulate complex I, but down-regulate complex III and ATPase. Interestingly, changes in complex I were significant because it also produced ROS in cells. To maintain the function of the ETC during the up-regulation of complex I might jeopardize M. persicae to cast the attack of ROS during PH3 fumigation. Significant changes in metabolic and regulatory proteins were also found in PH3-treated M. persicae. Thus, in response to low concentration PH3 treatments, M. persicae experienced severe biochemical changes, including changes in energy production, and starch and glycogen breakdown.

Supplementary Materials

The following are available online at https://www.mdpi.com/2076-3417/8/10/1764/s1, Figure S1. Mortality curve for the treatment of phosphine according to its concentration and fumigation duration towards Myzus persicae. (A), nymphs; (B), adults. Table S1. Primer list using RT-qPCR analysis. Table S2. Effects of phosphine fumigation on the different developmental stages of Myzus persicae. Table S3. Proteins differentially expressed in adults of Myzus persicae after phosphine treatment at the concentration of 0.5 mg/L for 4 h. CON; control treatment group, PH3; phosphine treatment group. Proteomic analyses of Myzus persicae were undertaken using a Nano-LC-ESI-MS/MS technique. Statistical difference was analyzed using t-test (p < 0.05). Proteins were involved in energy metabolism (especially, electron transport chain), defense, metabolism, and other proteins. Table S4. Proteins differentially expressed in adults of Myzus persicae after phosphine treatment at the concentration of 0.5 mg/L for 4 h. CON; control treatment group, PH3; phosphine treatment group. Proteomic analysis was conducted by a Nano-LC-MS/MS. Statistical difference was analyzed using t-test (p < 0.05). Proteins are classified in chromatin and histones, transcription, transition, and post-translational modification, signaling pathways and other functional roles in cells.

Author Contributions

S.-E.L. and J.O.Y. conceived and designed all of the experiments; K.K. and J.S.P. performed the experiments; K.K. and S.-E.L. analyzed the results; and S.-E.L. wrote the paper.

Funding

This study was supported by a grant from the Animal and Plant Quarantine Agency of the Ministry of Agriculture, Food and Rural Affairs of the Republic of Korea (Z-1543086-2017-19).

Conflicts of Interest

The authors declare no conflict of interest.

References

  1. Rajashekar, Y.; Vanitha Reddy, P.; Khamrunissa, B.; Leelaja, B.C.; Somiahnadar, R. Studies on aluminium phosphide tablet formulation. Pestology 2006, 30, 41–45. [Google Scholar]
  2. Karunaratne, C.; Moore, G.A.; Jones, R.; Ryan, R. Phosphine and its effect on some common insects in cut flowers. Postharvest Biol. Technol. 1997, 10, 255–262. [Google Scholar] [CrossRef]
  3. Hansson, D.; Morra, M.J.; Borek, V.; Eigenbrode, S.D. Green peach aphid [Myzus persicae (Sulzer) (Hemiptera: Aphididae)] control using Brassicaceae ethyl ester oil sprays. J. Appl. Entomol. 2013, 137, 330–339. [Google Scholar] [CrossRef]
  4. Park, J.H.; Lee, H.S. Phototactic behavioral response of agricultural insects and stored-product insects to light-emitting diodes (LEDs). Appl. Biol. Chem. 2017, 60, 137–144. [Google Scholar] [CrossRef]
  5. Andorno, A.V.; Lopez, S.N. Biological control of Myzus persicae (Hemiptera: Aphididae) through banker plant system in protected crops. Biol. Control 2014, 78, 9–14. [Google Scholar] [CrossRef]
  6. Kim, K.; Lee, B.H.; Park, J.S.; Yang, J.O.; Lee, S.E. Biochemical mechanisms of fumigant toxicity by ethyl formate towards Myzus persicae nymphs. J. Appl. Biol. Chem. 2017, 60, 271–277. [Google Scholar] [CrossRef]
  7. Stewart, J.K.; Mon, T.R. Commercial-scale vaccum fumigation with ethyl formate for postharvest control of the green peach aphid (Homoptera: Aphididae) on film-wrapped lettuce. J. Econ. Entomol. 1984, 77, 569–573. [Google Scholar] [CrossRef]
  8. Lee, B.H.; Kim, H.M.; Kim, B.S.; Yang, J.O.; Moon, Y.M.; Ren, Y. Evaluation of the synergistic effect between ethyl formate and phosphine for control of Aphis gossypii (Homoptera: Aphididae). J. Econ. Entomol. 2016, 109, 143–147. [Google Scholar] [CrossRef] [PubMed]
  9. Yang, J.; Park, Y.; Hyun, I.H.; Kim, G.H.; Kim, B.S.; Lee, B.H.; Ren, Y. A combination treatment using ethyl formate and phosphine to control Planococcus citri (Hemiptera: Pseudococcidae) on pineapples. J. Econ. Entomol. 2016, 109, 2355–2363. [Google Scholar] [CrossRef] [PubMed]
  10. Afful, E.; Elliott, B.; Nayak, M.K.; Phillips, T.W. Phosphine resistance in North American field populations of the lesser grain borer, Rhyzopertha dominica (Coleoptera: Bostrichidae). J. Econ. Entomol. 2018, 111, 463–469. [Google Scholar] [CrossRef] [PubMed]
  11. Rafter, M.A.; McCulloch, G.A.; Daglish, G.J.; Walter, G.H. Progression of phosphine resistance in susceptible Tribolium castaneum (Herbst) populations under different immigration regimes and selection pressures. Evol. Appl. 2017, 10, 907–918. [Google Scholar] [CrossRef] [PubMed]
  12. Tang, P.A.; Duan, J.Y.; Wu, H.J.; Ju, X.R.; Yuan, M.L. Reference gene selection to determine differences in mitochondrial gene expressions in phosphine-susceptible and phosphine-resistant strains of Cryptolestes ferrugineus, using qRT-PCR. Sci. Rep. 2017, 7, 7047. [Google Scholar] [CrossRef] [PubMed]
  13. Opit, G.P.; Thomas, E.; Phillips, T.W.; Payton, M.E. Effectiveness of sulfuryl fluoride fumigation for the control of phosphine-resistant grain insects infesting stored wheat. J. Econ. Entomol. 2016, 109, 930–941. [Google Scholar] [CrossRef] [PubMed]
  14. Subramanyam, B.; Li, X. Efficacy of ozone against phosphine susceptible and resistant strains of four stored-product insect species. Insects 2017, 8, 42. [Google Scholar] [CrossRef]
  15. Ellman, G.L.; Courtney, K.D.; Andres, V.; Featherstone, R.M. A new and rapid colorimetric determination of acetylcholinesterase activity. Biochem. Pharmacol. 1961, 7, 88–95. [Google Scholar] [CrossRef] [Green Version]
  16. Livak, K.J.; Schmittgen, T.D. Analysis of relative gene expression data using real-time quantitative PCR and the 2ΔΔct method. Methods 2001, 25, 402–408. [Google Scholar] [CrossRef] [PubMed]
  17. Nath, N.S.; Bhattacharya, I.; Tuck, A.G.; Schlipalius, D.I.; Ebert, P.R. Mechanisms of phosphine toxicity. J. Toxicol. 2011, 494168. [Google Scholar] [CrossRef] [PubMed]
  18. Chaudhry, M.Q.; Price, N.R. A spectral study of the biochemical reactions of phosphine with various haemproteins. Pestic. Biochem. Phys. 1990, 36, 14–21. [Google Scholar] [CrossRef]
  19. Price, N.R. Some aspects of the inhibition of cytochrome c oxidase by phosphine in susceptible and resistant strains of Rhyzopertha dominica. Insect Biochem. 1980, 10, 147–150. [Google Scholar] [CrossRef]
  20. Liu, T.; Li, L.; Li, B.; Zhang, F.; Wang, Y. Proteomic analysis of peach fruit moth larvae treated with phosphine. Front. Biosci. 2012, E4, 1780–1786. [Google Scholar] [CrossRef]
  21. Ježek, P.; Plecitá-Hlavatá, L.; Smolková, K.; Rossignol, R. Distinctions and similarities of cell bioenergetics and the role of mitochondria in hypoxia, cancer, and embryonic development. Int. J. Biochem. Cell Biol. 2010, 42, 604–622. [Google Scholar] [CrossRef] [PubMed]
  22. Bolter, C.J.; Chefurka, W. Extramitochondrial release of hydrogen peroxide from insect and mouse liver mitochondria using the respiratory inhibitors phosphine, myxothiazol, and antimycin and spectral analysis of inhibited cytochromes. Arch. Biochem. Biophys. 1990, 278, 65–72. [Google Scholar] [CrossRef]
  23. Bass, C.; Puinean, A.M.; Zimmer, C.T.; Denholm, I.; Field, L.M.; Foster, S.P.; Gutbrod, O.; Nauen, R.; Slater, R.; Williamson, M.S. The evolution of insecticide resistance in the peach potato aphid, Myzus persicae. Insect Biochem. Mol. Biol. 2014, 51, 41–51. [Google Scholar] [CrossRef] [PubMed] [Green Version]
  24. Al-Hakkak, Z.S.; Al-Azzawi, M.J.; Al-Adhamy, B.W.; Khalil, S.A. Inhibitory action of phosphine on acetylcholinesterase of Ephestia cautella (Lepidoptera: Pyralidae). J. Stored Prod. Res. 1989, 25, 171–174. [Google Scholar] [CrossRef]
  25. Nayak, M.K.; Collins, P.J. Influence of concentration, temperature and humidity on the toxicity of phosphine to the strongly phosphine-resistant psocid Liposcelis bostrychophila Badonnel (Psocoptera: Liposcelididae). Pest Manag. Sci. 2008, 64, 971–976. [Google Scholar] [CrossRef] [PubMed]
Figure 1. Effects of phosphine fumigation on the different developmental stages of Myzus persicae. Lethal concentration time (LCT) values are obtained using Equation (1). More details in mortality are shown in Figure S1 and Table S2.
Applsci 08 01764 g001
Figure 2. Enzyme assays in the two different developmental stages of Myzus persicae (nymphs and adults) after the phosphine treatment. (A) Cytochrome c oxidase (COX); (B) Acetylcholinesterase (AChE). The enzyme activities were expressed as unit/mg of the insect. Different letters on the bars indicate statistical differences between phosphine-treated samples and the control (p < 0.05). Treated concentrations were equivalent to LC10 (0.055 mg/L for nymphs or 0.056 mg/L for adults) and LC50 (0.130 mg/L for nymphs or 0.120 mg/L for adults) values.
Applsci 08 01764 g002
Figure 3. Gene expressions in the phosphine-treated M. persicae determined by RT-qPCR. Six gene primers are listed in Table S1. Different letters on the bars indicate statistical differences between phosphine-treated samples and the control (p < 0.05). Statistic differences were tested using one-way ANOVA and Tukey’s test as a post-hoc test. Treated concentrations were equivalent to LC10 (0.055 mg/L for nymphs or 0.056 mg/L for adults) and LC50 (0.130 mg/L for nymphs or 0.120 mg/L for adults) values.
Applsci 08 01764 g003
Figure 4. Proteins differentially expressed in adults of Myzus persicae after phosphine treatment at the concentration of 0.5 mg/L for 4 h. CON; control treatment group, PH3; phosphine treatment group. Statistically difference was analyzed using t-test (p < 0.05). *, <0.05; **, 0.01; ***, 0.001; ****, 0.0001. (A), proteins involved in energy metabolism, especially electron transport chain; (B), proteins involved in defense; (C), proteins involved in metabolism; (D), other proteins.
Applsci 08 01764 g004aApplsci 08 01764 g004b
Figure 5. Proteins differentially expressed in adults of Myzus persicae after phosphine treatment at the concentration of 0.5 mg/L for 4 h. CON; control treatment group, PH3; phosphine treatment group. Statistically difference was analyzed using t-test (p < 0.05). *, <0.05; **, 0.01; ***, 0.001; ****, 0.0001. (A), proteins classified in chromatin and histones; (B), proteins involved in transcription; (C), proteins involved in translation and post-translational modification; (D), proteins involved in signaling pathways; (E), other proteins.
Applsci 08 01764 g005aApplsci 08 01764 g005b

