Article

Numerical Models for the Assessment of Historical Masonry Structures and Materials, Monitored by Acoustic Emission

by
Stefano Invernizzi
*,
Giuseppe Lacidogna
and
Alberto Carpinteri
Department of Structural, Geotechnical and Building Engineering, Politecnico di Torino, Corso Duca degli Abruzzi 24, 10129 Torino, Italy
*
Author to whom correspondence should be addressed.
Appl. Sci. 2016, 6(4), 102; https://doi.org/10.3390/app6040102
Submission received: 9 December 2015 / Revised: 7 March 2016 / Accepted: 18 March 2016 / Published: 8 April 2016
(This article belongs to the Special Issue Acoustic and Elastic Waves: Recent Trends in Science and Engineering)

Abstract

:
The paper reviews some recent numerical applications for the interpretation and exploitation of acoustic emission (AE) monitoring results obtained from historical masonry structures and materials. Among possible numerical techniques, the finite element method and the distinct method are considered. The analyzed numerical models cover the entire scale range, from microstructure and meso-structure, up to full-size real structures. The micro-modeling includes heterogeneous concrete-like materials, but mainly focuses on the masonry texture meso-structure, where each brick and mortar joint is modeled singularly. The full-size models consider the different typology of historical structures such as masonry towers, cathedrals and chapels. The main difficulties and advantages of the different numerical approaches, depending on the problem typology and scale, are critically analyzed. The main insight we can achieve from micro and meso numerical modeling concerns the scaling of AE as a function of volume and time, since it is also able to simulate the b-value temporal evolution as the damage spread into the structure. The finite element modeling of the whole structure provides useful hints for the optimal placement of the AE sensors, while the combination of AE monitoring results is crucial for a reliable assessment of structural safety.

1. Introduction

Nondestructive experimental techniques and monitoring set-up are increasingly being adopted to acquire and assess the progress of dangerous structural phenomena, such as cracking and damage, and to estimate their successive evolution. The adoption of the better controlling and monitoring technique strictly depends upon the typology of the reinforced concrete or masonry structures under consideration, and on the information to be collected [1]. For historical buildings, non-destructive techniques (NDT) can be exploited for different purposes: (1) revealing hidden structural elements, such as floor beams, or arches and piers which have been incorporated into the walls; (2) assessing the mechanical properties of masonry and mapping the inhomogeneity of the wall components (e.g., adoption of different bricks throughout the life of a building); (3) estimating the extent of cracking in damaged structures; (4) mapping voids and flaws; (5) monitoring moisture content and water rising due to capillary action; (6) surveying surface decay phenomena; and (7) assessing the mechanical and physical properties of brick or stone and mortar.
The acoustic emission (AE) technique has proved particularly effective in the assessment of structural integrity, in that it allows an assessment of the amount of energy emitted due to fracture propagation and helps derive information on the criticality of the undergoing process.
At the present time, the AE technique can be exploited during experimental tests to investigate on the damage advancement in ductile or brittle materials prior to the final collapse [2,3]. Moreover, this non-destructive monitoring technique is successful when studying critical phenomena and to predict the remaining lifetime and durability in full-scale structures [4].
According to this method, it is feasible to acquire the transient elastic waves related to each stress-induced crack advancement event inside a structure or a specimen. These waves can be detected and recorded by transducers applied on the external surface of samples or structural elements. The transducers are piezoelectric sensors that commute the power of the elastic waves into voltaic signals. A proper analysis of the AE waveform parameters (peak amplitude, duration time and frequency) helps provide detailed information about the damage progression, such as the emitted energy, cracking pattern, and fracture mode [5].
The critical conditions that anticipate the collapse can be monitored analyzing the b-value calculated from the Gutenberg-Richter (GR) law. The GR law can fit, with basically the same accuracy, data from both earthquake distributions in seismic areas [6] and AE technique structural monitoring [7,8,9], even though two different dimensional scales are involved.
The connection between recorded waves and fracture mode depends on various factors like geometry, propagation distances, and relative orientations. Both experimental and numerical results show the crucial influence of heterogeneities in the crack propagation path. Therefore, it should be carefully considered for AE characterization of large structures, while it should not be disregarded even in small-scale sample laboratory studies to improve cracking characterization [10,11].
The energy emitted by the monitored structure is strictly connected to the energy detected by AE sensors. The energy dissipation in correspondence of crack nucleation and propagation in quasi-brittle materials and structures plays a fundamental role and influences their mechanical behavior throughout their entire life. In recent times, an ad hoc method has been implemented for structural monitoring by means of the AE technique according to fractal concepts. The fractal theory inherently accounts for the multiscale nature of energy dissipation and for the resulting strong size effects. This energetic approach let to introduce a useful parameter for structural damage assessment that is based on the correlation between AE monitored in the structure and the corresponding emissions detected in specimens of different sizes.
This methodology is effective in quantifying the effects of the environmental configuration on the final response, since it inherently accounts for the size of structures and the signal attenuation and distortion recorded during the AE monitoring.
The effectiveness of the assessment can be greatly improved when NDT monitoring is combined with proper numerical analysis. Numerical modeling is useful both for more efficient structural assessment and for more extensive comprehension of meso and microstructural phenomena of materials.
Analytical and numerical modeling of acoustic emissions in metals dates back to the eighties of last century [12,13]. The numerical simulation of progressive failure of rock and associated acoustic emissions or seismicity, depending on the scale of interest, was among others addressed by Tang [14]. Acoustic emission monitoring in concrete structures started in the sixties of last century [2], while numerical simulation of the acoustic emission process in concrete, according to the authors’ knowledge, are more recent [15,16].
The acoustic emission phenomenon can be modeled numerically following different approaches, depending on the scale and on the aspects of the problem under consideration. Dynamical models are preferred if the acoustic emission source mechanism must be considered in detail. In the literature different source hypotheses have been proposed [17] (point-like, linear or based upon fracture mechanics description of the crack propagation), while the elastic acoustic wave propagation is affected by the attenuation, dispersion and propagation in the guiding media. If a heterogeneous concrete-like material is considered, together with the presence of another source of wave disturbance like tendons, the problem become very challenging [18], and numerical results must be compared with additional very innovative experimental techniques like X-ray tomography [19].
When the geometry of the sample or structure become more complex, quasi-static numerical models are usually preferred, which can provide localization in space and time of the acoustic emission events, based on a detailed description of damage propagation in the media. In this case, the signal acquired by piezoelectric sensors cannot be compared directly with numerical results, and it is necessary to calculate the acoustic emission location with some moment-tensor algorithm. Different numerical strategies can be adapted to this purpose. The so-called lattice-model allows for a detailed discretization of the microstructure, and acoustic emission events can be related to the rupture of lattice elements or bundle of elements [20]. Alternatively, continuous discretization can be coupled with discontinuities described with the cohesive crack model [21], and crack advancements can be directly related to the occurrence of acoustic emissions.
Numerical simulations of acoustic emissions in masonry and masonry structures are quite recent and relatively poorly investigated. For this reason, in the following, a number of applications of combined AE and numerical analysis performed by the authors on masonry and masonry structures are reviewed, from real-size structures down to model structures and meso or microstructural material modeling.

2. Historical Masonry Structures

In the last fifteen years, the authors have investigated a number of relevant existing buildings belonging to the Italian cultural heritage. In this section these structures are briefly described, in order to illustrate the combination of numerical modeling and acoustic emission monitoring.

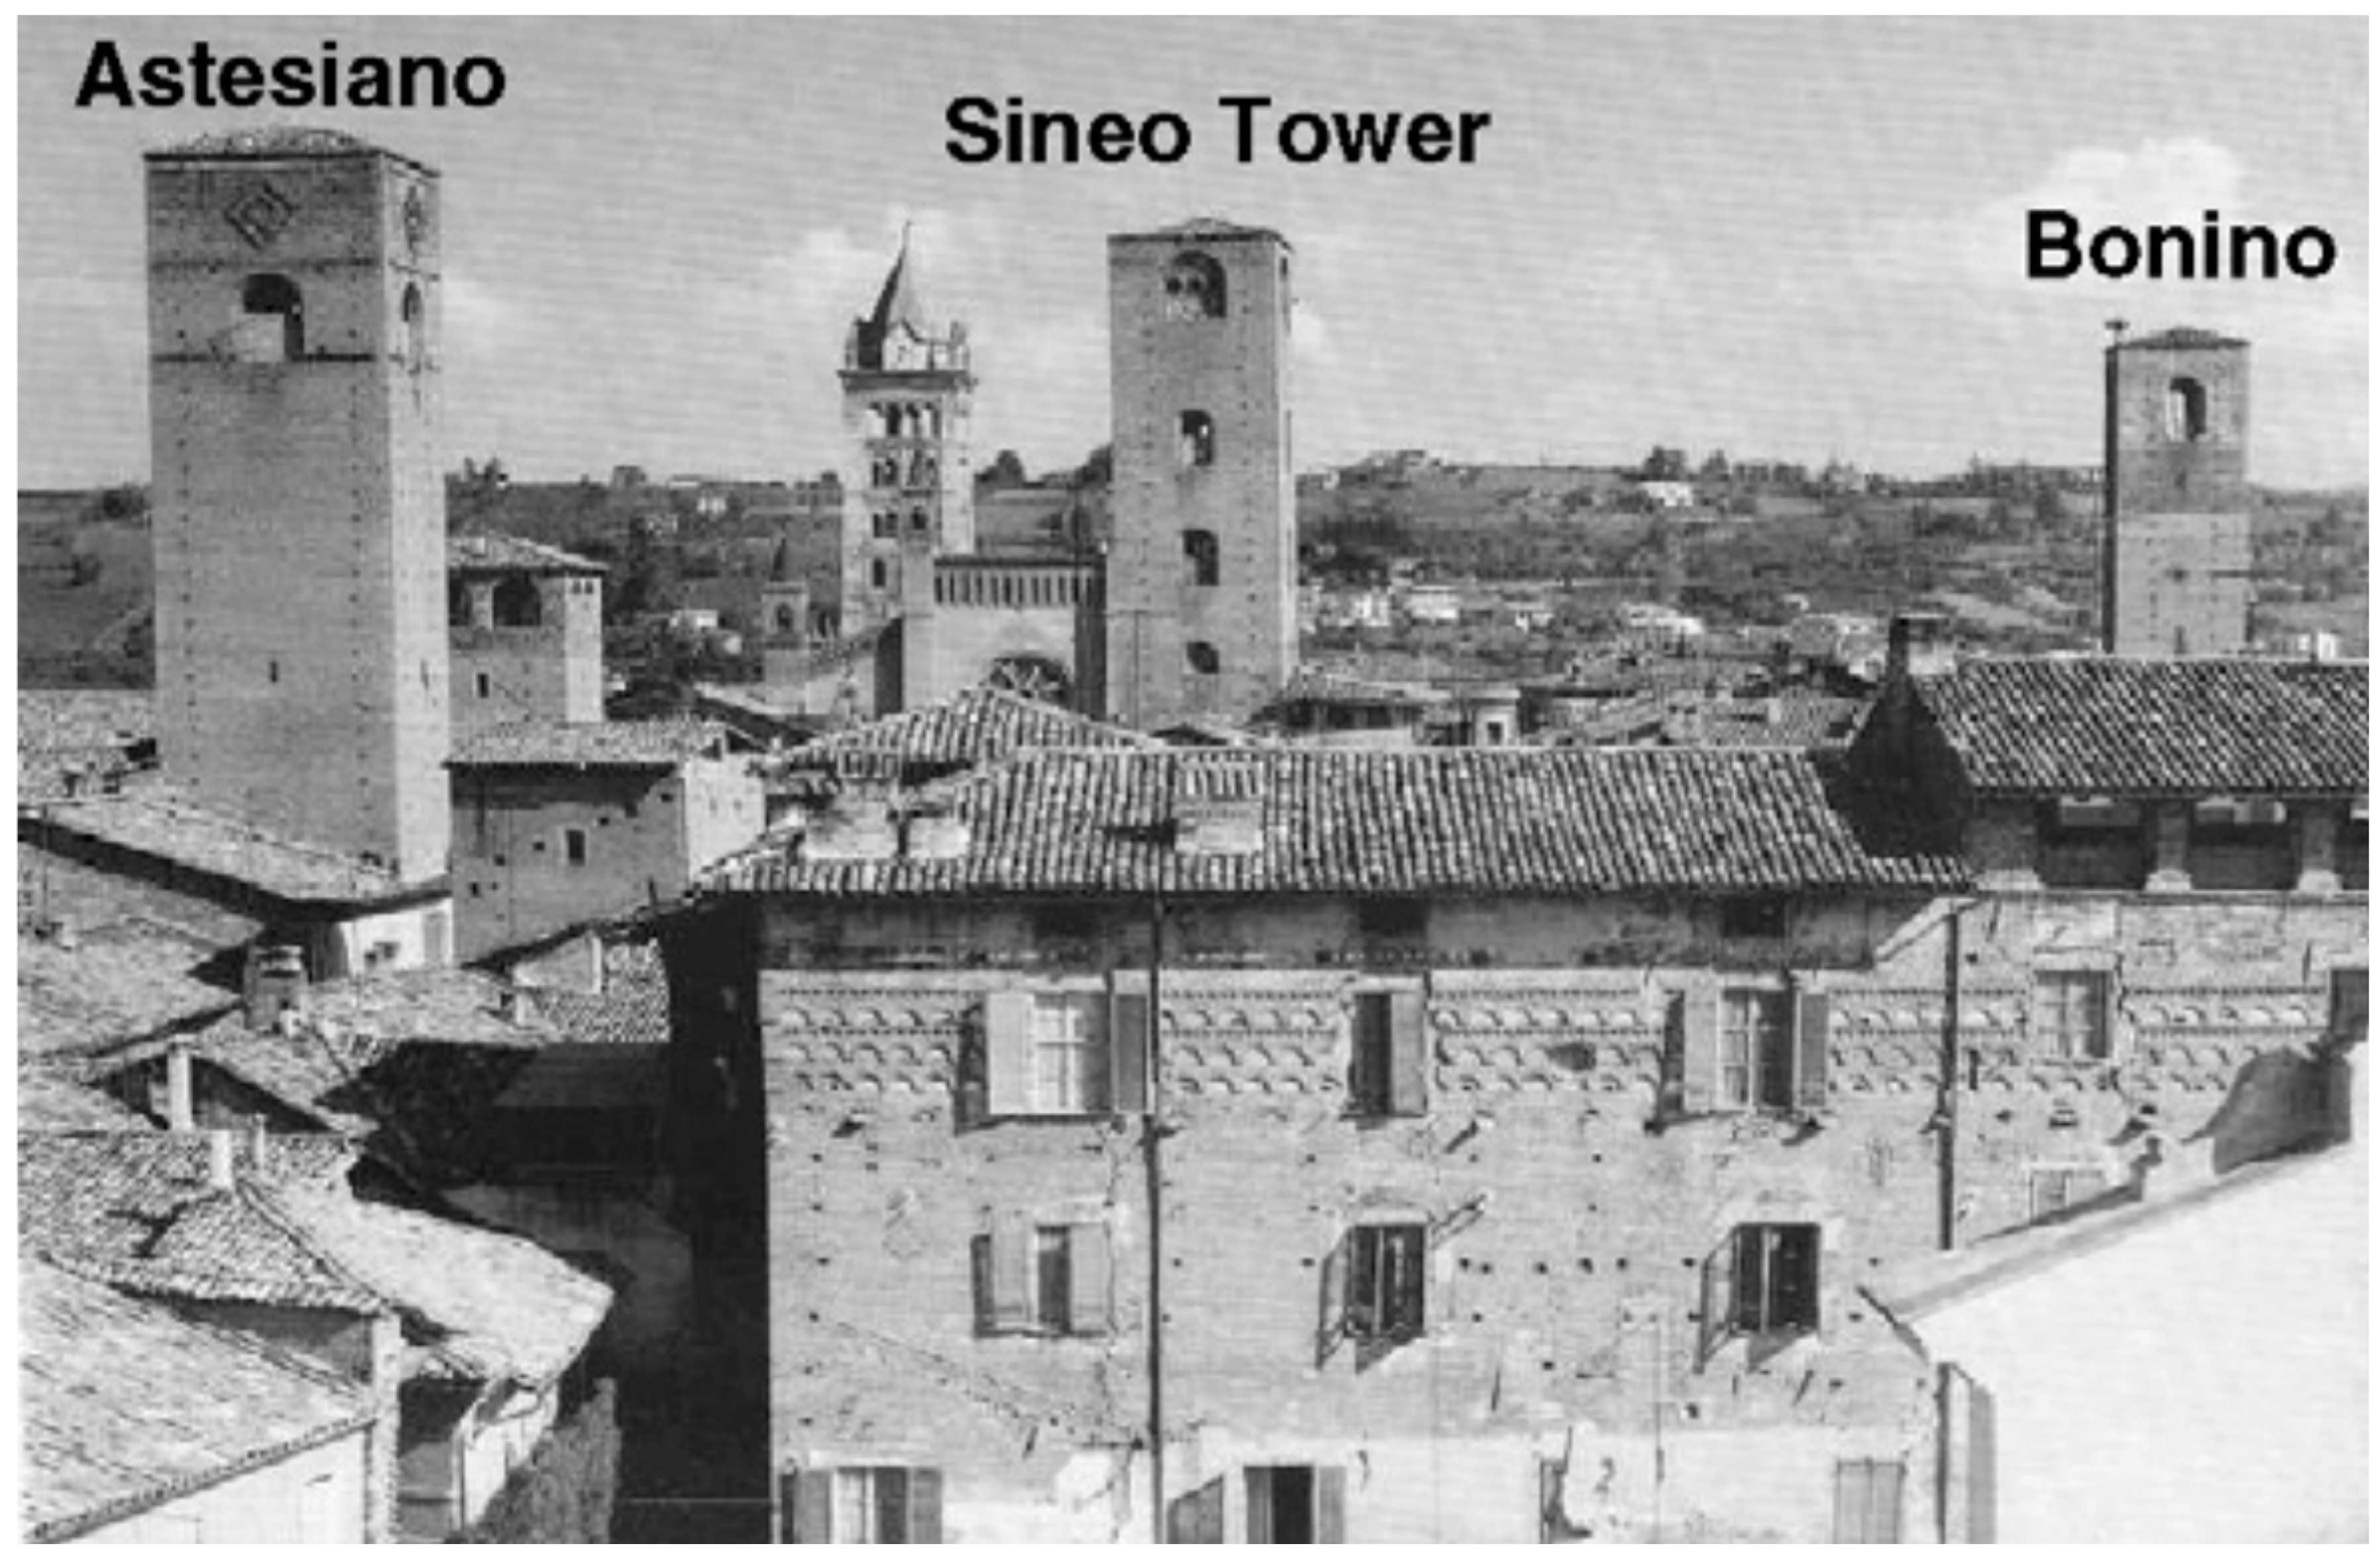
2.1. Historical Masonry Towers of Alba

These medieval masonry towers are the tallest and most iconic constructions from the XIIIth century that are conserved in Alba up to the present time (Figure 1) [22,23].
The three towers have been analyzed by three-dimensional finite element models, set up starting from Autocad® drawings (Autodesk®, San Rafael, CA, USA). The discretization mesh was obtained adopting 20-node isoparametric solid brick elements, and the analysis was performed with the finite element commercial code iDIANA (TNO DIANA BV®, Delft, The Netherlands). The discretization mesh was such that the wall thickness of the towers included five element’s nodes minimum.
The models accounted for the dimension and shape of openings and for the variation of the wall thickness at various levels. Conversely, the presence of timber floors has been neglected. Each structure was mainly subjected to its dead load. The three towers present various damage patterns, ranging from smeared cracking to dominant cracks. The acoustic emission (AE) technique was exploited to monitor the crack propagation in the most relevant structural areas of the three towers. Piezoelectric transducers applied to the inner or outer surface of the tower walls were used to acquire the elastic waves emitted as a consequence of crack propagation within the masonry volume.
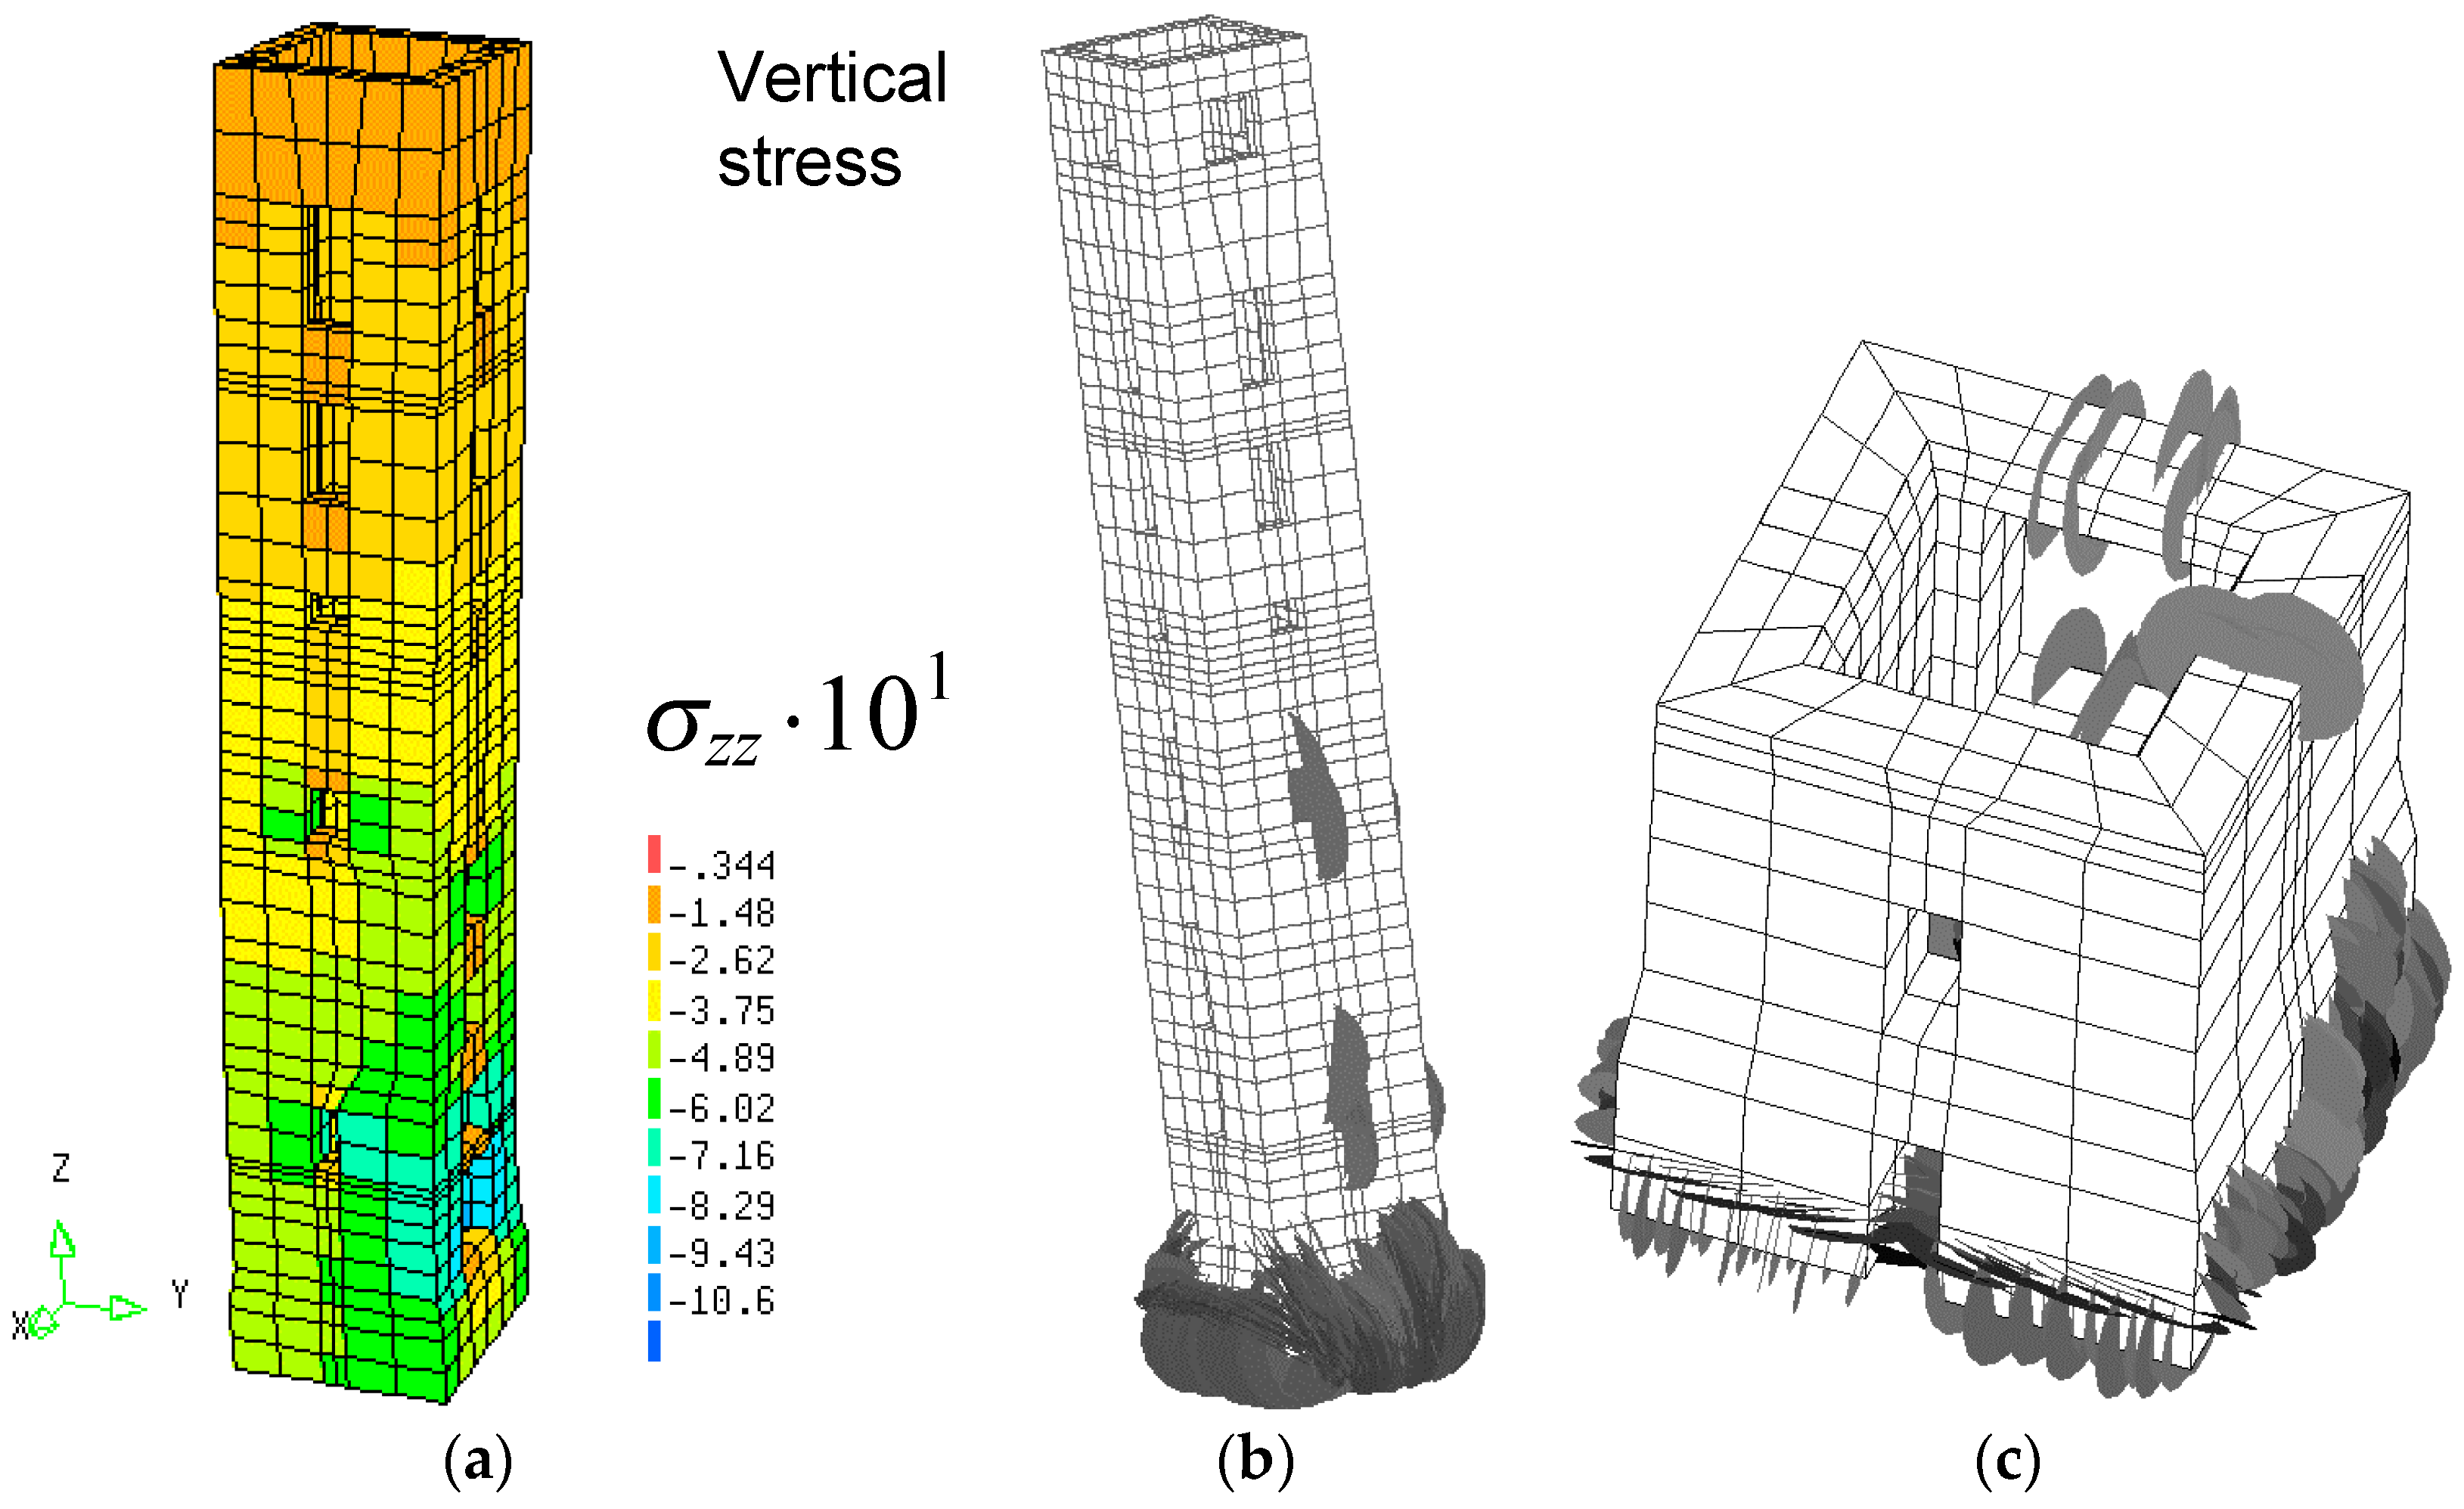
From the survey it was found that the Sineo tower is not exactly vertical, and therefore the possible evolution of the eccentricity of the tower must be considered. A direct assessment of the tilt evolution based on the mechanical characteristics of the foundation is not very reliable, due to the geotechnical uncertainties of the underlying soil layers. On the other hand, a loading scenario can be analyzed, where an increasing rotation of the base is considered, together with the self-weight of the masonry and wind thrust acting on the higher lateral surface of the tower (Figure 2). The crack pattern scenario allowed for localization of the main regions subjected to cracking in case of tilt evolution. Therefore, the location of AE sensors was optimized [22,23].
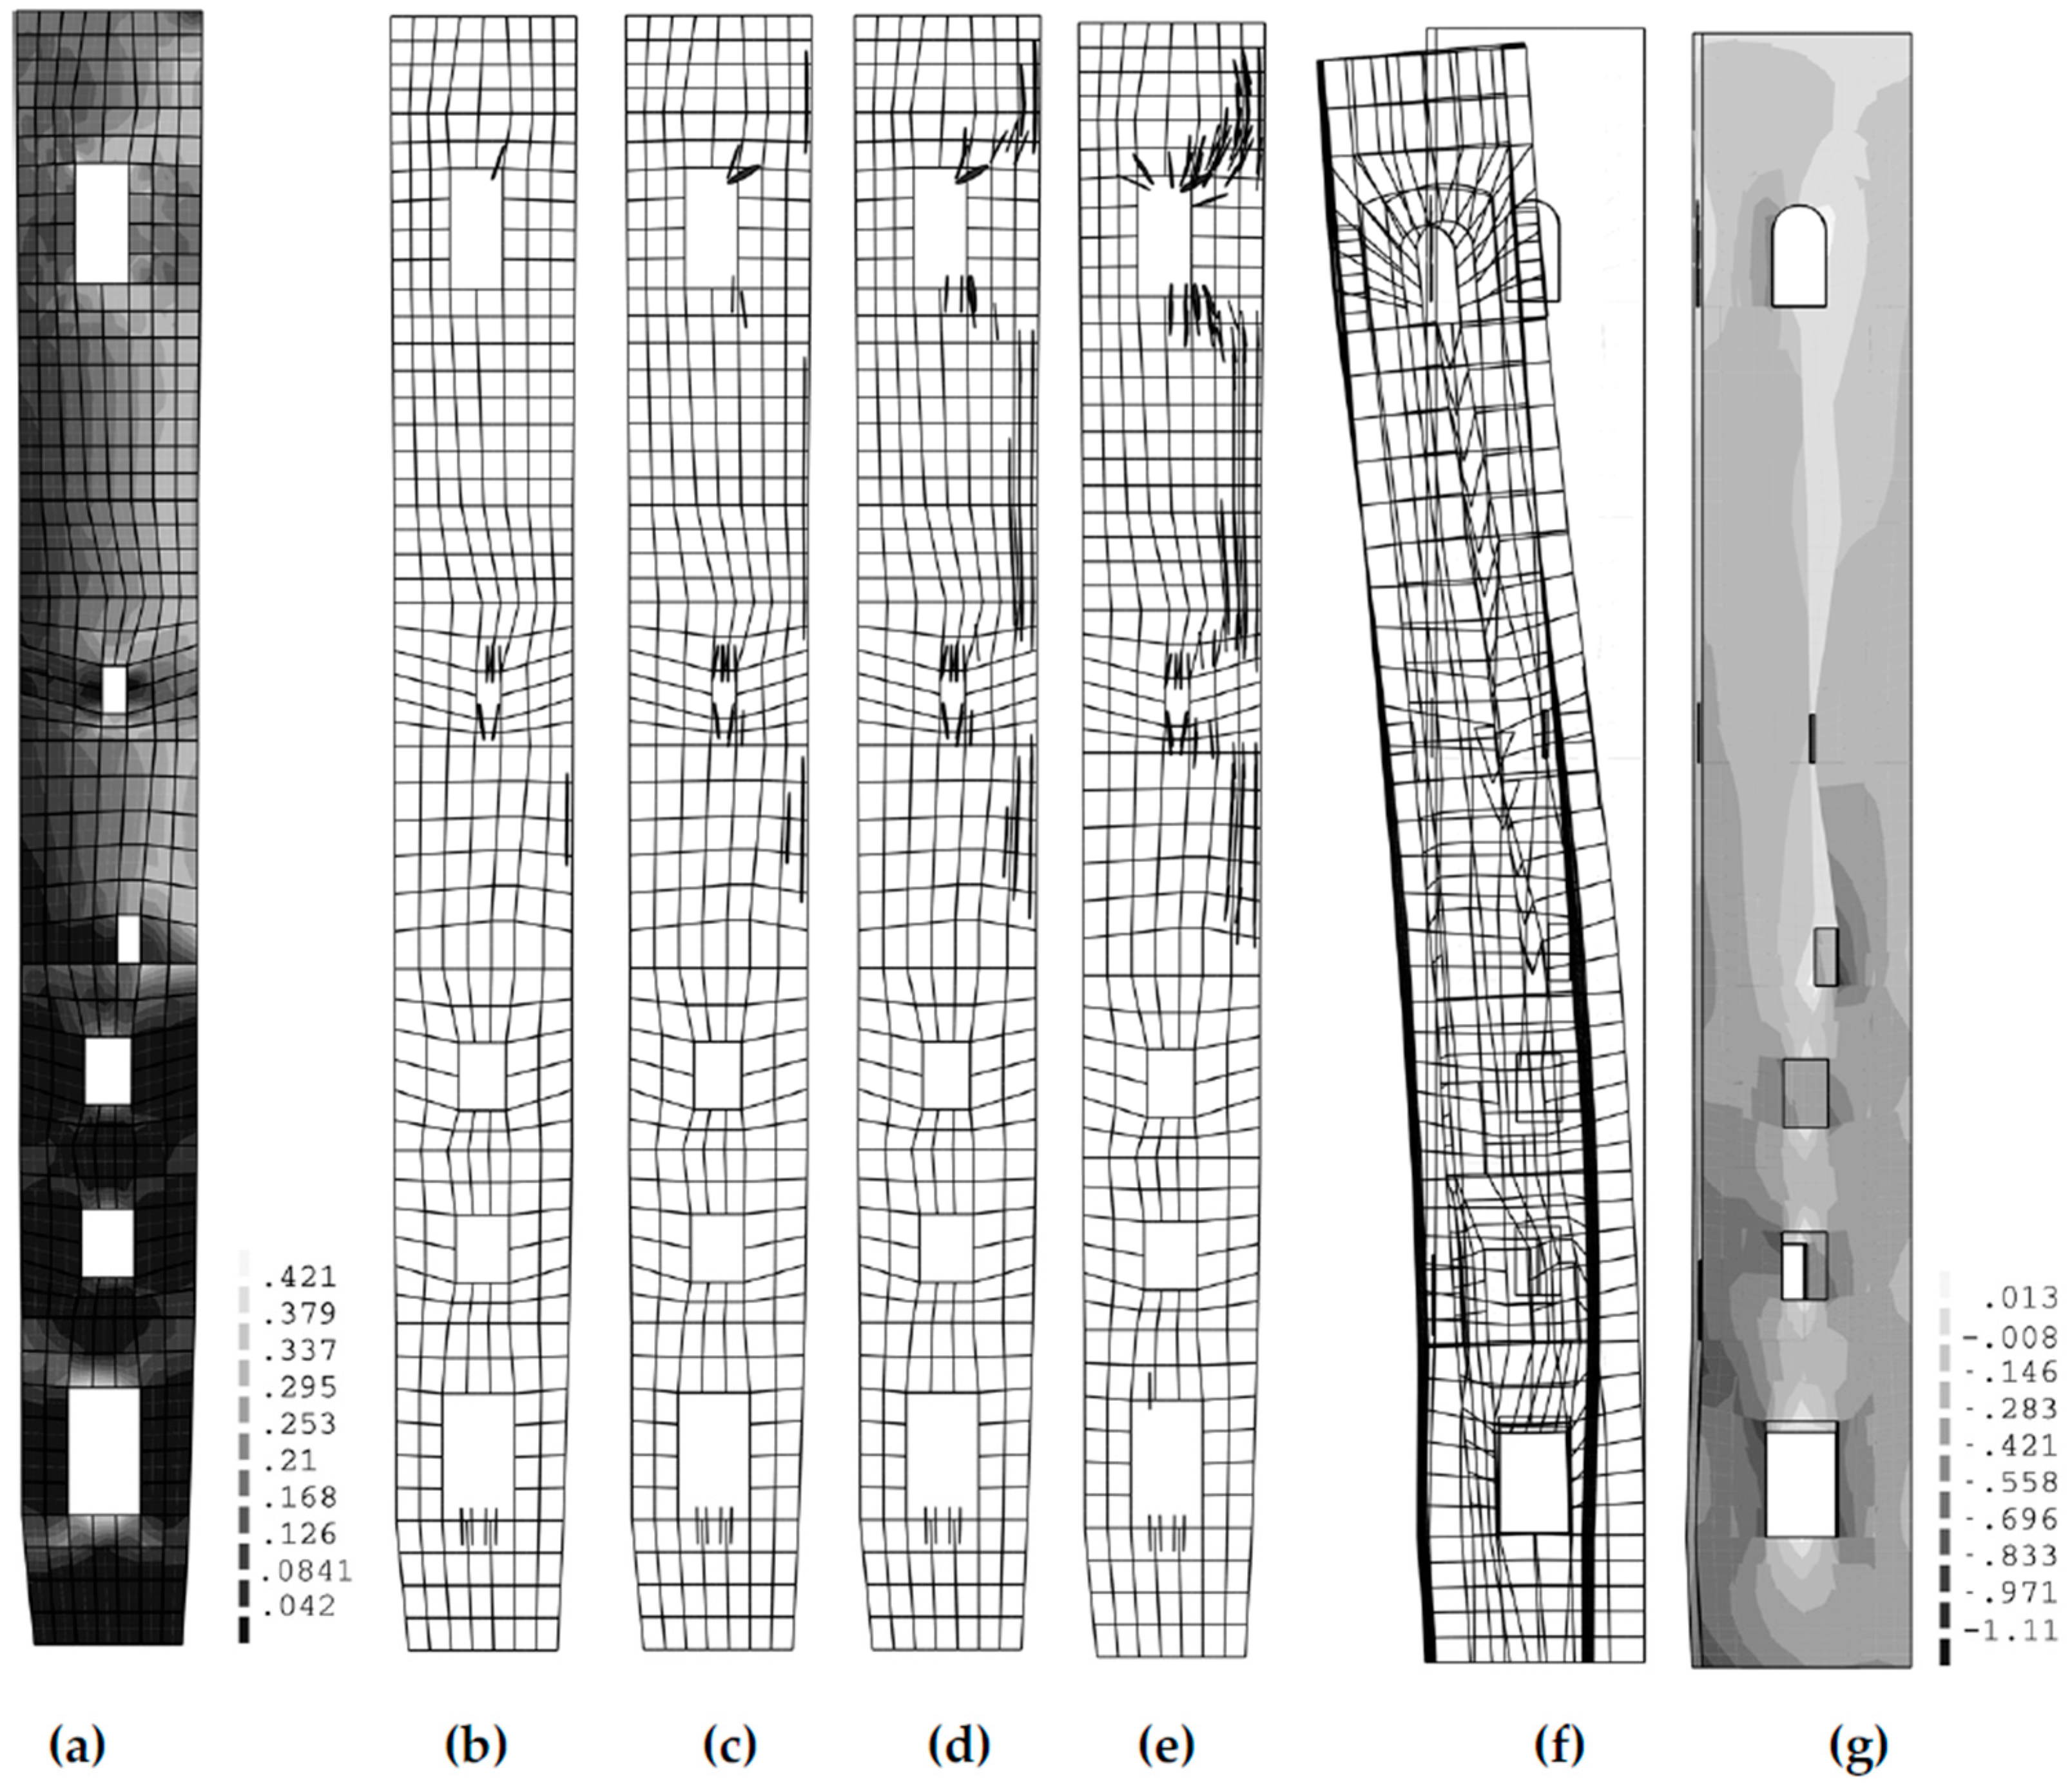
The mechanical response of Torre Astesiano was characterized by the presence of a dominant crack, which was uncertainly ascribed to the impact of a cannon ball during a past conflict. The structural analysis (Figure 3) allowed it to be proven that thermal stresses due to seasonal and daily temperature oscillation could justify the opening of the crack. Two piezoelectric transducers were placed in the inner masonry layer of the tower, close to the fourth floor level, and near the tip of the main sub-vertical crack, where dynamic analysis provided the main stress intensification.
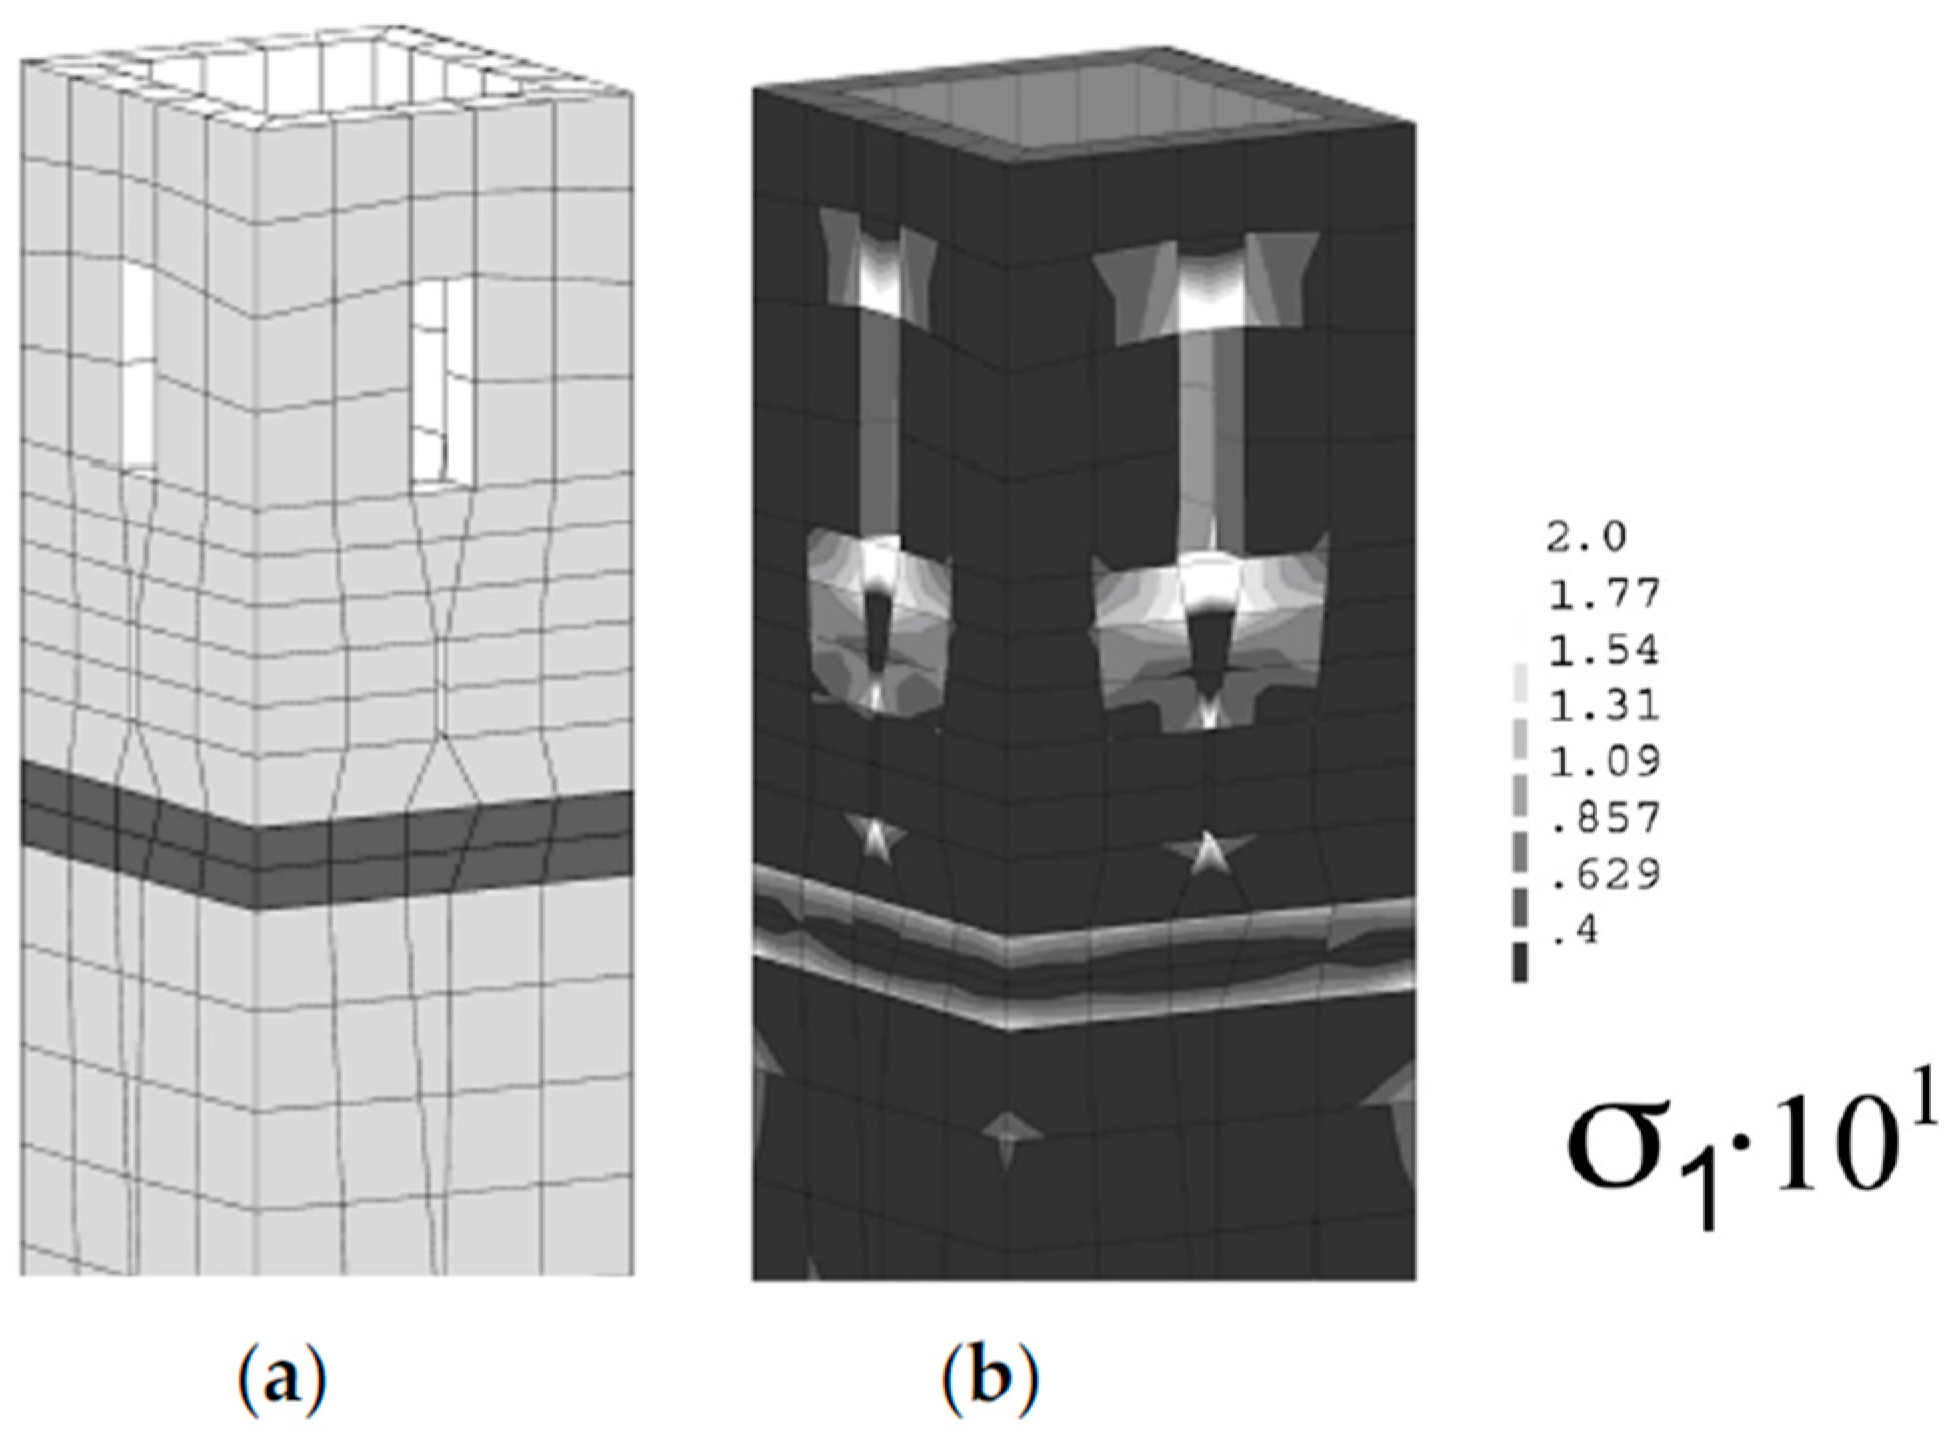
The Bonino tower was recently subjected to some restructuring works, which involved the opening of new apertures in the masonry, especially in the correspondence of the first floor level. Another cause of concern was the damage detected in the correspondence of the ornamental layer of the upper part of the tower. The structural analysis (Figure 4) allowed for the localization of stress increases in the correspondence of the new openings, as well as for the determination of tensile stresses due to the higher stiffness of the ornamental layer, which was made with stone whose Young modulus is almost twice that of the surrounding masonry.
The AE equipment was placed in correspondence of these critical areas, in order to assess the influence on damage propagation. An evolutionary release of energy is recorded under the effect of self-weight, which can be ascribed to pseudo-creep behavior of the masonry.
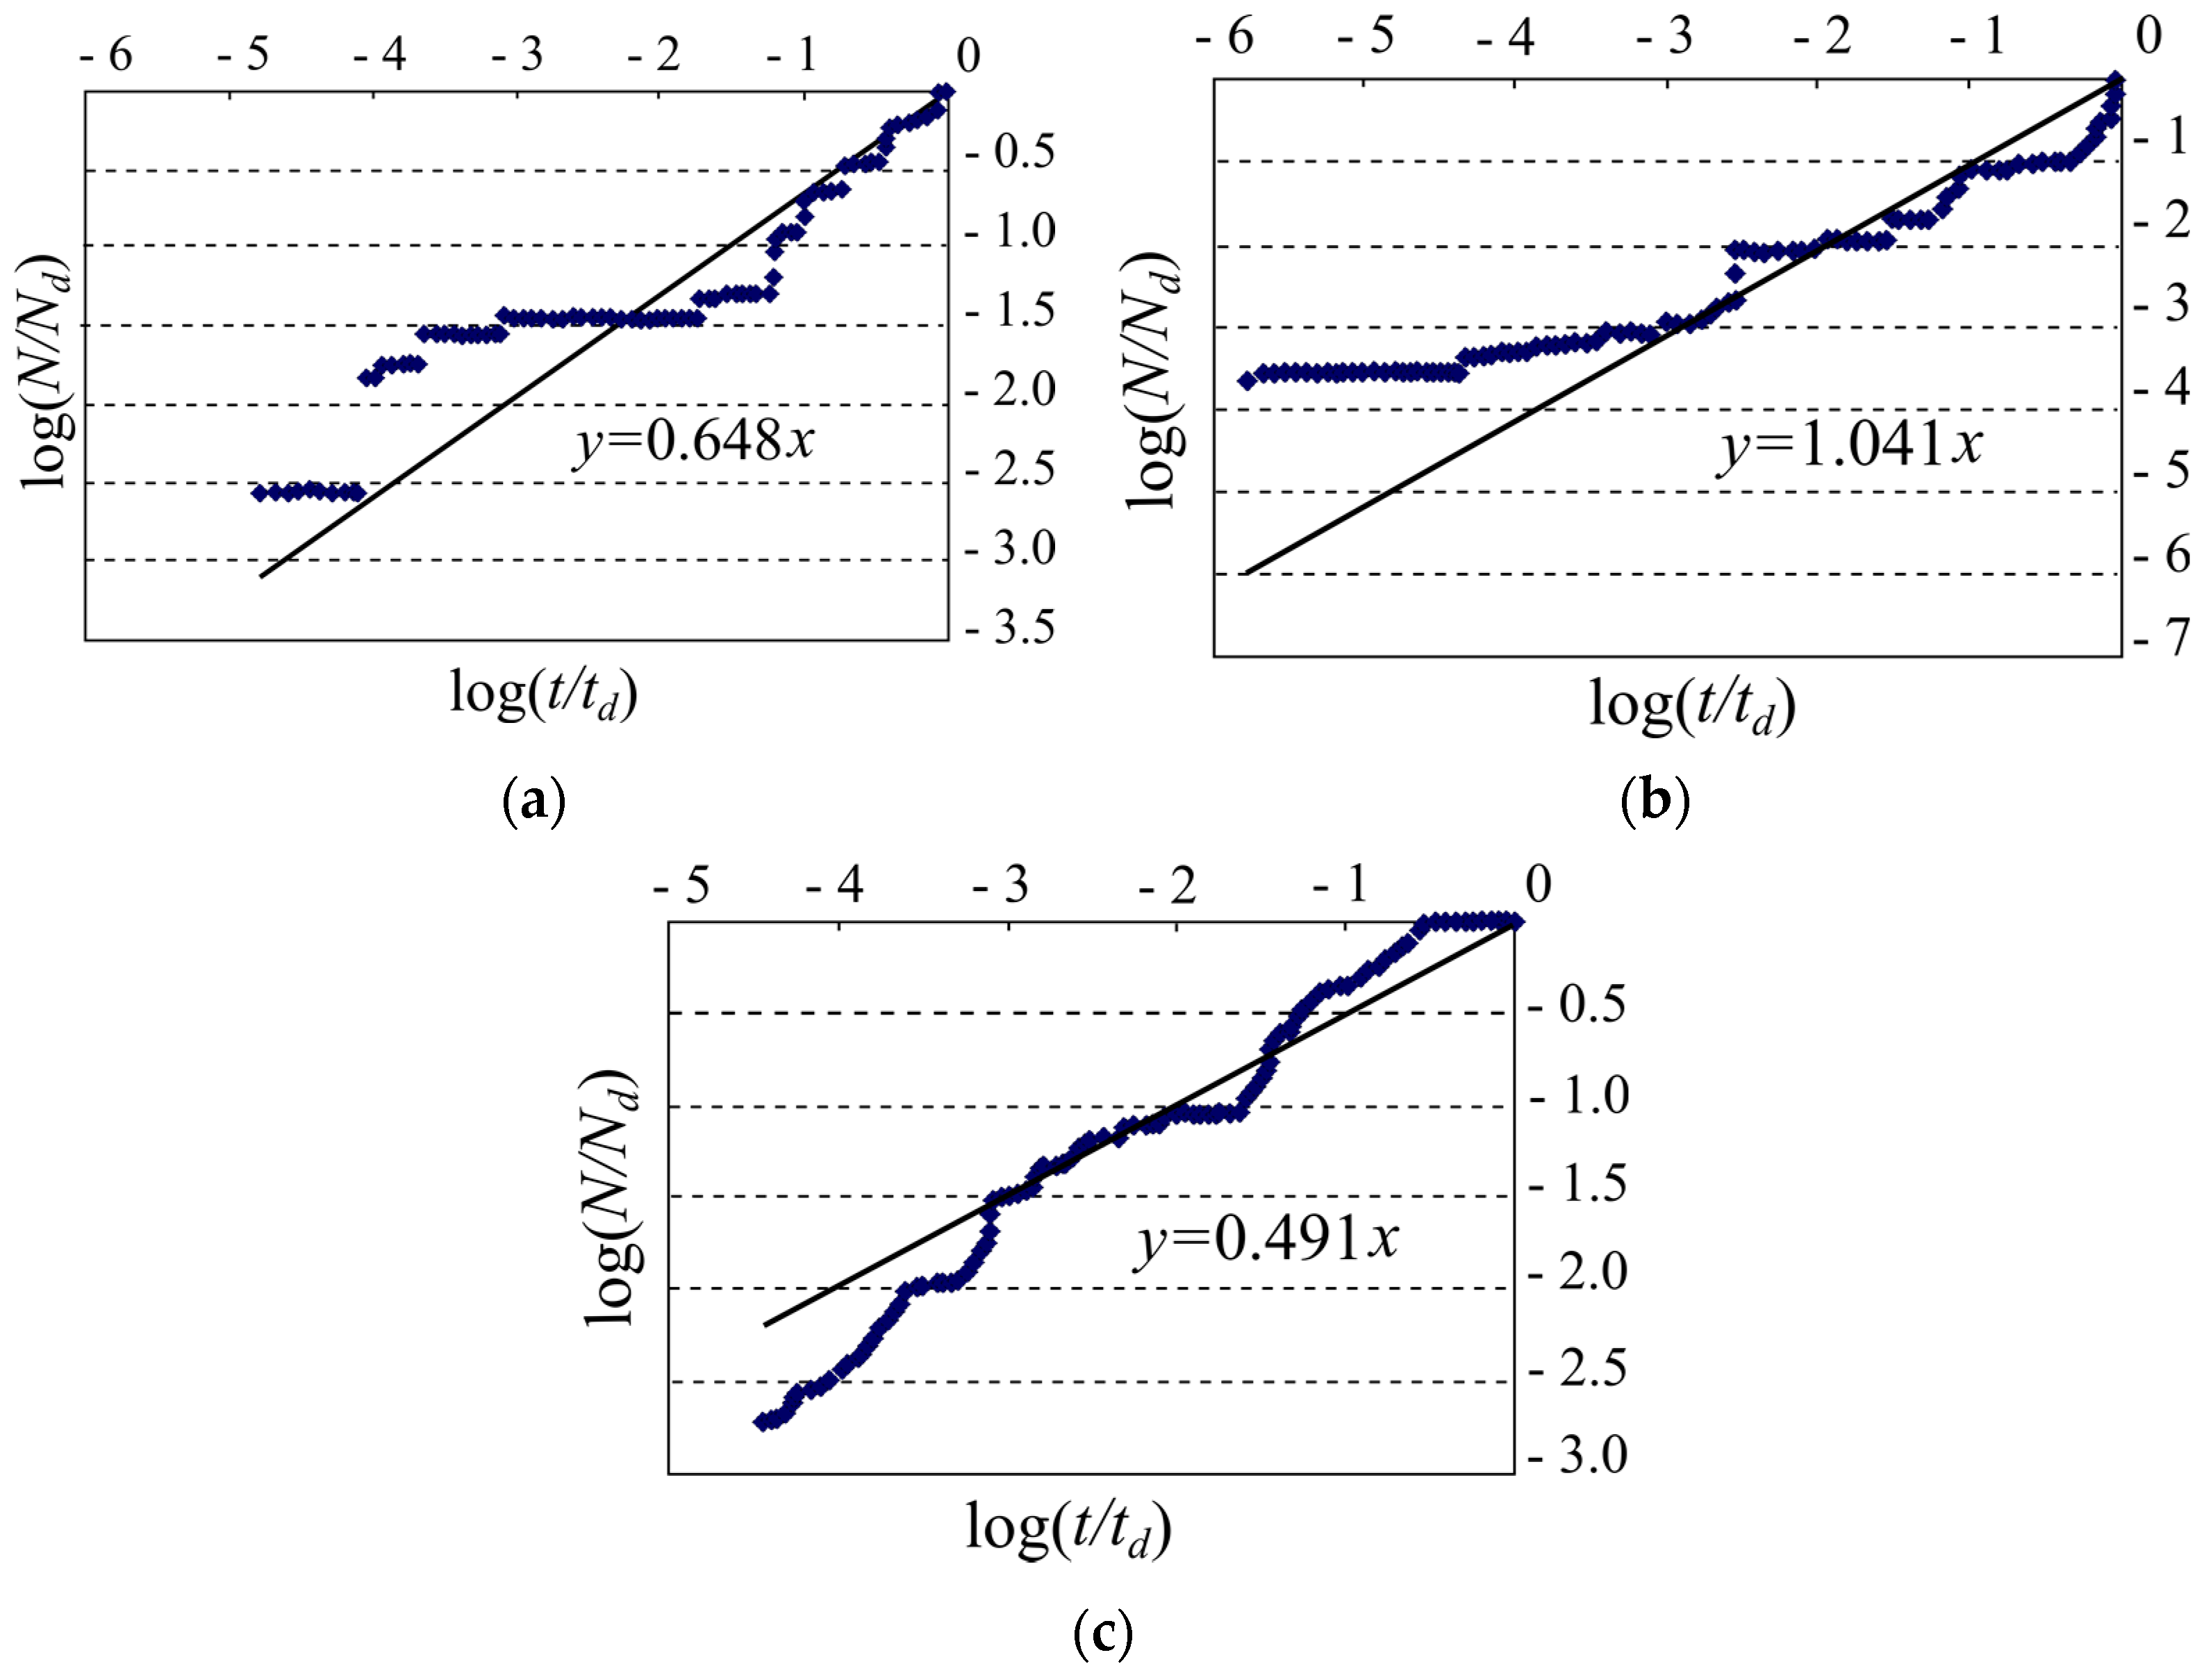
The rate of propagation of the micro-cracks in the three masonry towers (Figure 5) is correlated to the time dependence of the structural damage observed during the monitoring. The ratio of the cumulative number of AE counts recorded during the monitoring process, N, to the number obtained at the end of the observation period, Nd, as a function of time, t, is equal to:
η = E E d = N N d = ( t t d ) β t
The parameter td in Equation (1) refers to the whole structure monitoring time, while the Ed and Nd parameters are usually lower than the values attained at critical conditions (EdEmax; NdNmax). It is possible to obtain an assessment about the stability condition of the structure deriving the exponent β t as the linear best-fitting coefficient in the bi-logarithmic diagram (Figure 5) where AE data from monitoring are reported.
The exponent β t < 1 indicates that the damaging process is slowing down, and that the structure is evolving towards a stable condition. On the contrary, the parameter β t > 1 indicates that the process is becoming unstable. Finally, the case β t 1 refers to a metastable condition, i.e., although the phenomenon is linearly increasing over time, it could attain either instability or stability conditions. The Sineo tower analysis yielded a slope β t 0.648 , the Astesiano tower provided β t 1.041 , and the Bonino tower β t 0.491 (Figure 5). During the monitoring period, these results reveal that in the Sineo and Bonino towers the damage process is stable. On the contrary, as far as the Astesiano tower is concerned, the damage is approaching a metastable condition.

2.2. Cathedrals and Vaulted Structures

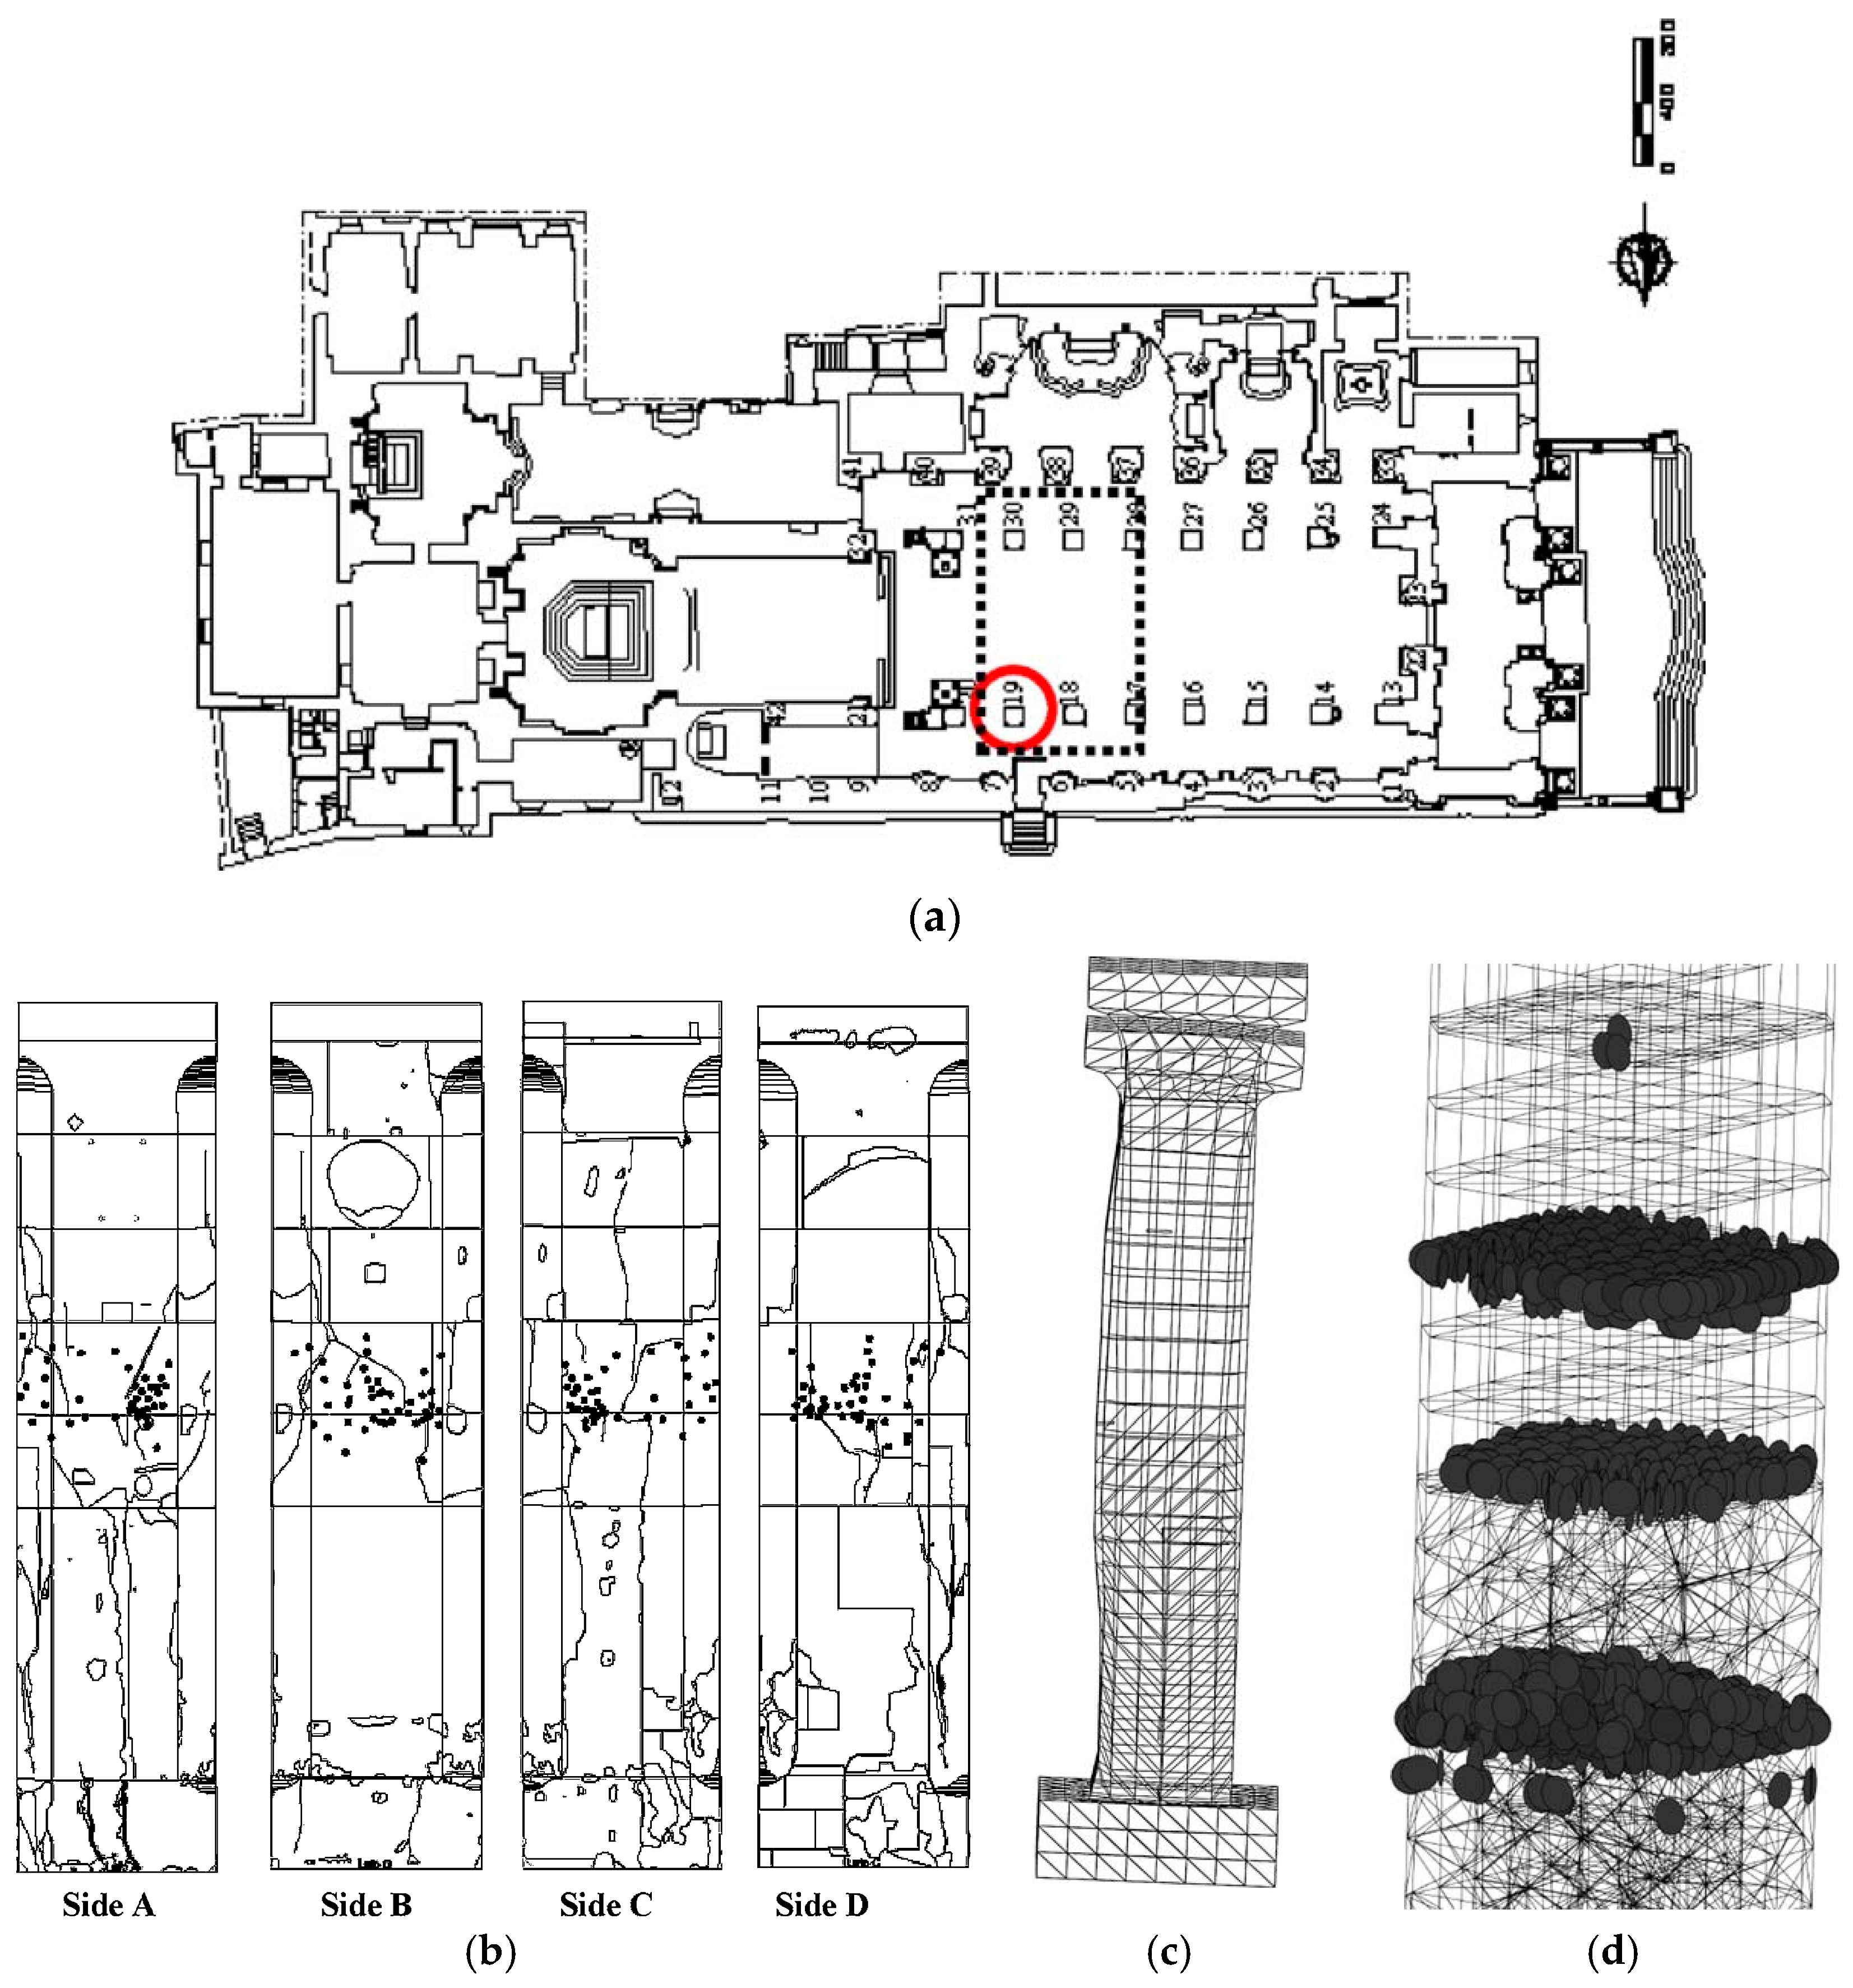
A monitoring campaign and numerical analysis has been performed on the ancient Cathedral of Syracuse in Sicily [24] (Figure 6a). The acoustic emission (AE) technique is adopted to assess the damage pattern evolution. The localization of the propagating cracks is obtained using six synchronized acoustic emission sensors. A clear correlation between the regional seismic activity and the AE acquisition data has been obtained. In fact the AE count rate presents peaks corresponding to the main seismic events. During the observation period (Figure 6b), the number of AE counts was 4300 .
In order to assess the rate of the damage propagation, as given in Equation (1), the AE technique data were reported in the bilogarithmic plane to obtain the best-fitting slope, providing β t 0.98 . The quasi-linear progression of damage over time confirms that the process in the pillar is in metastable conditions. A detailed geometrical survey of the most damaged pillar allowed for the definition of an accurate 3D model.
The geometry of each block, as well as the presence of masonry inserts, have been considered. Two main loads were considered: the dead load (of the pillar and of the surrounding structure), and a horizontal seismic load provided as horizontal ground acceleration. Due to the horizontal acceleration, cracking can take place in the pillar. A detail of crack nucleation is shown in Figure 6d. The crack occurrence provided by the analysis agrees quite well with the crack localization provided by the AE recording. Cracking corresponds both to diffuse cracking in the continuum elements of the sandstone blocks and to opening or sliding of the discrete interfaces between blocks.
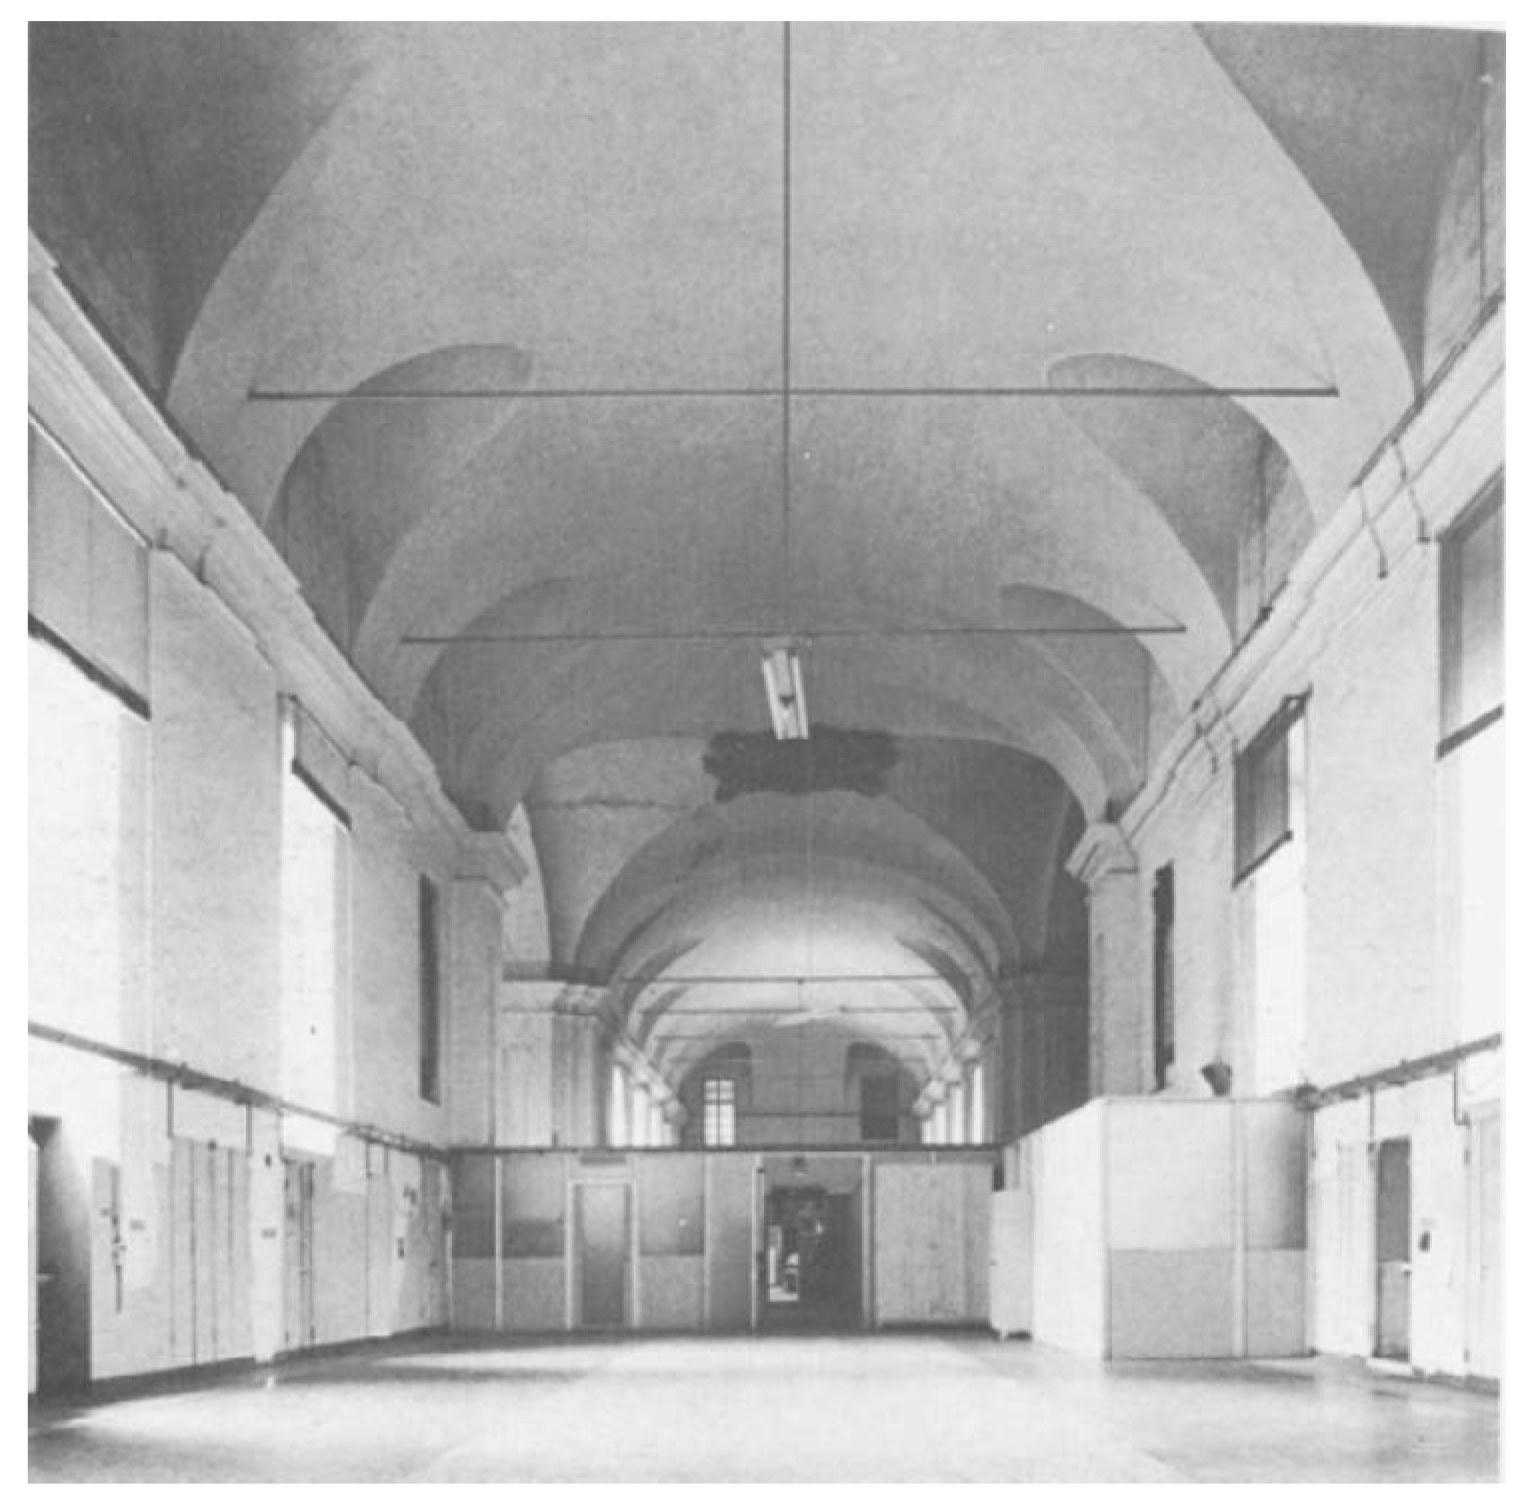
Another case was the Hospital San Giovanni in Turin (Italy) [25], a masonry building complex initiated in 1680, under the design of the Italian architect Amedeo di Castellamonte (1610–1683) (Figure 7). The ground floor of the complex was recently chosen to host an important fossil collection from the Regional Museum of Natural Science.
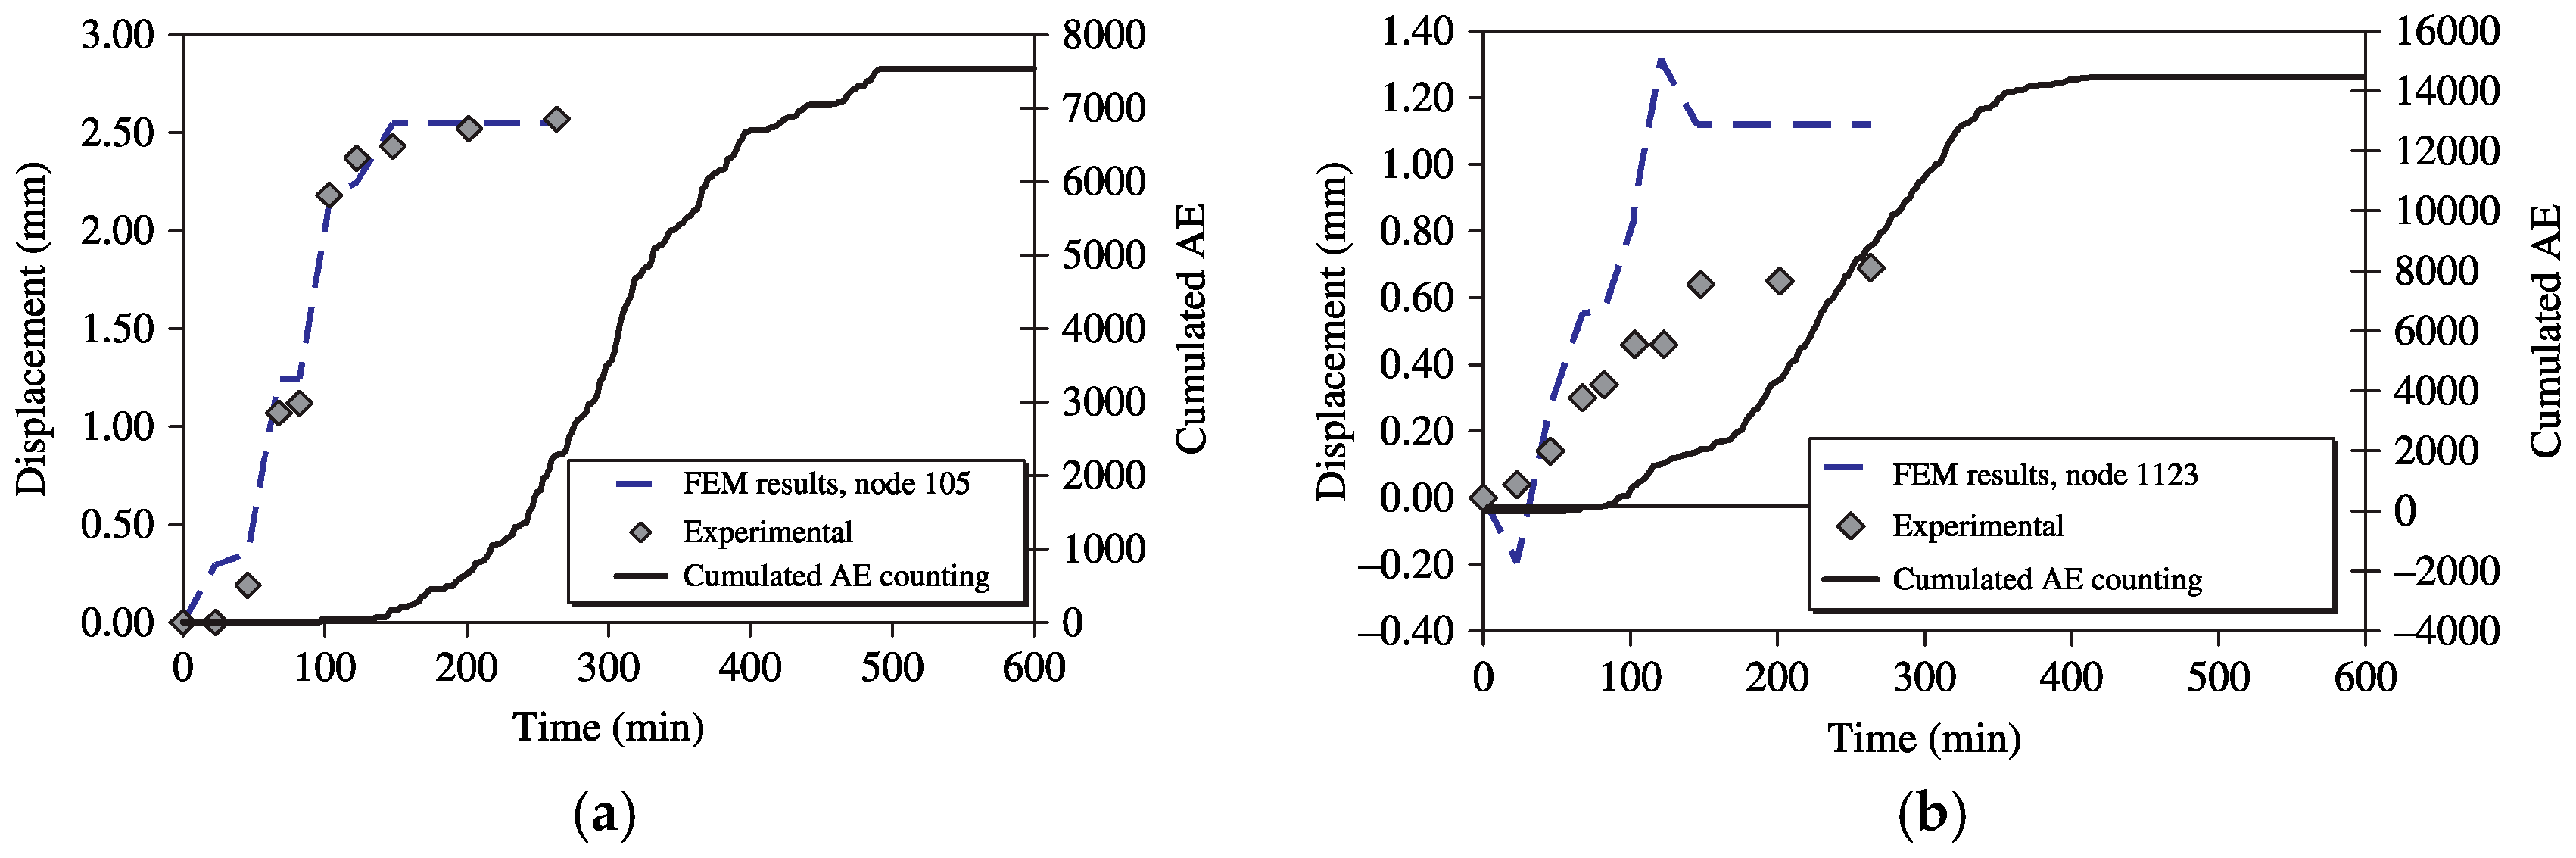
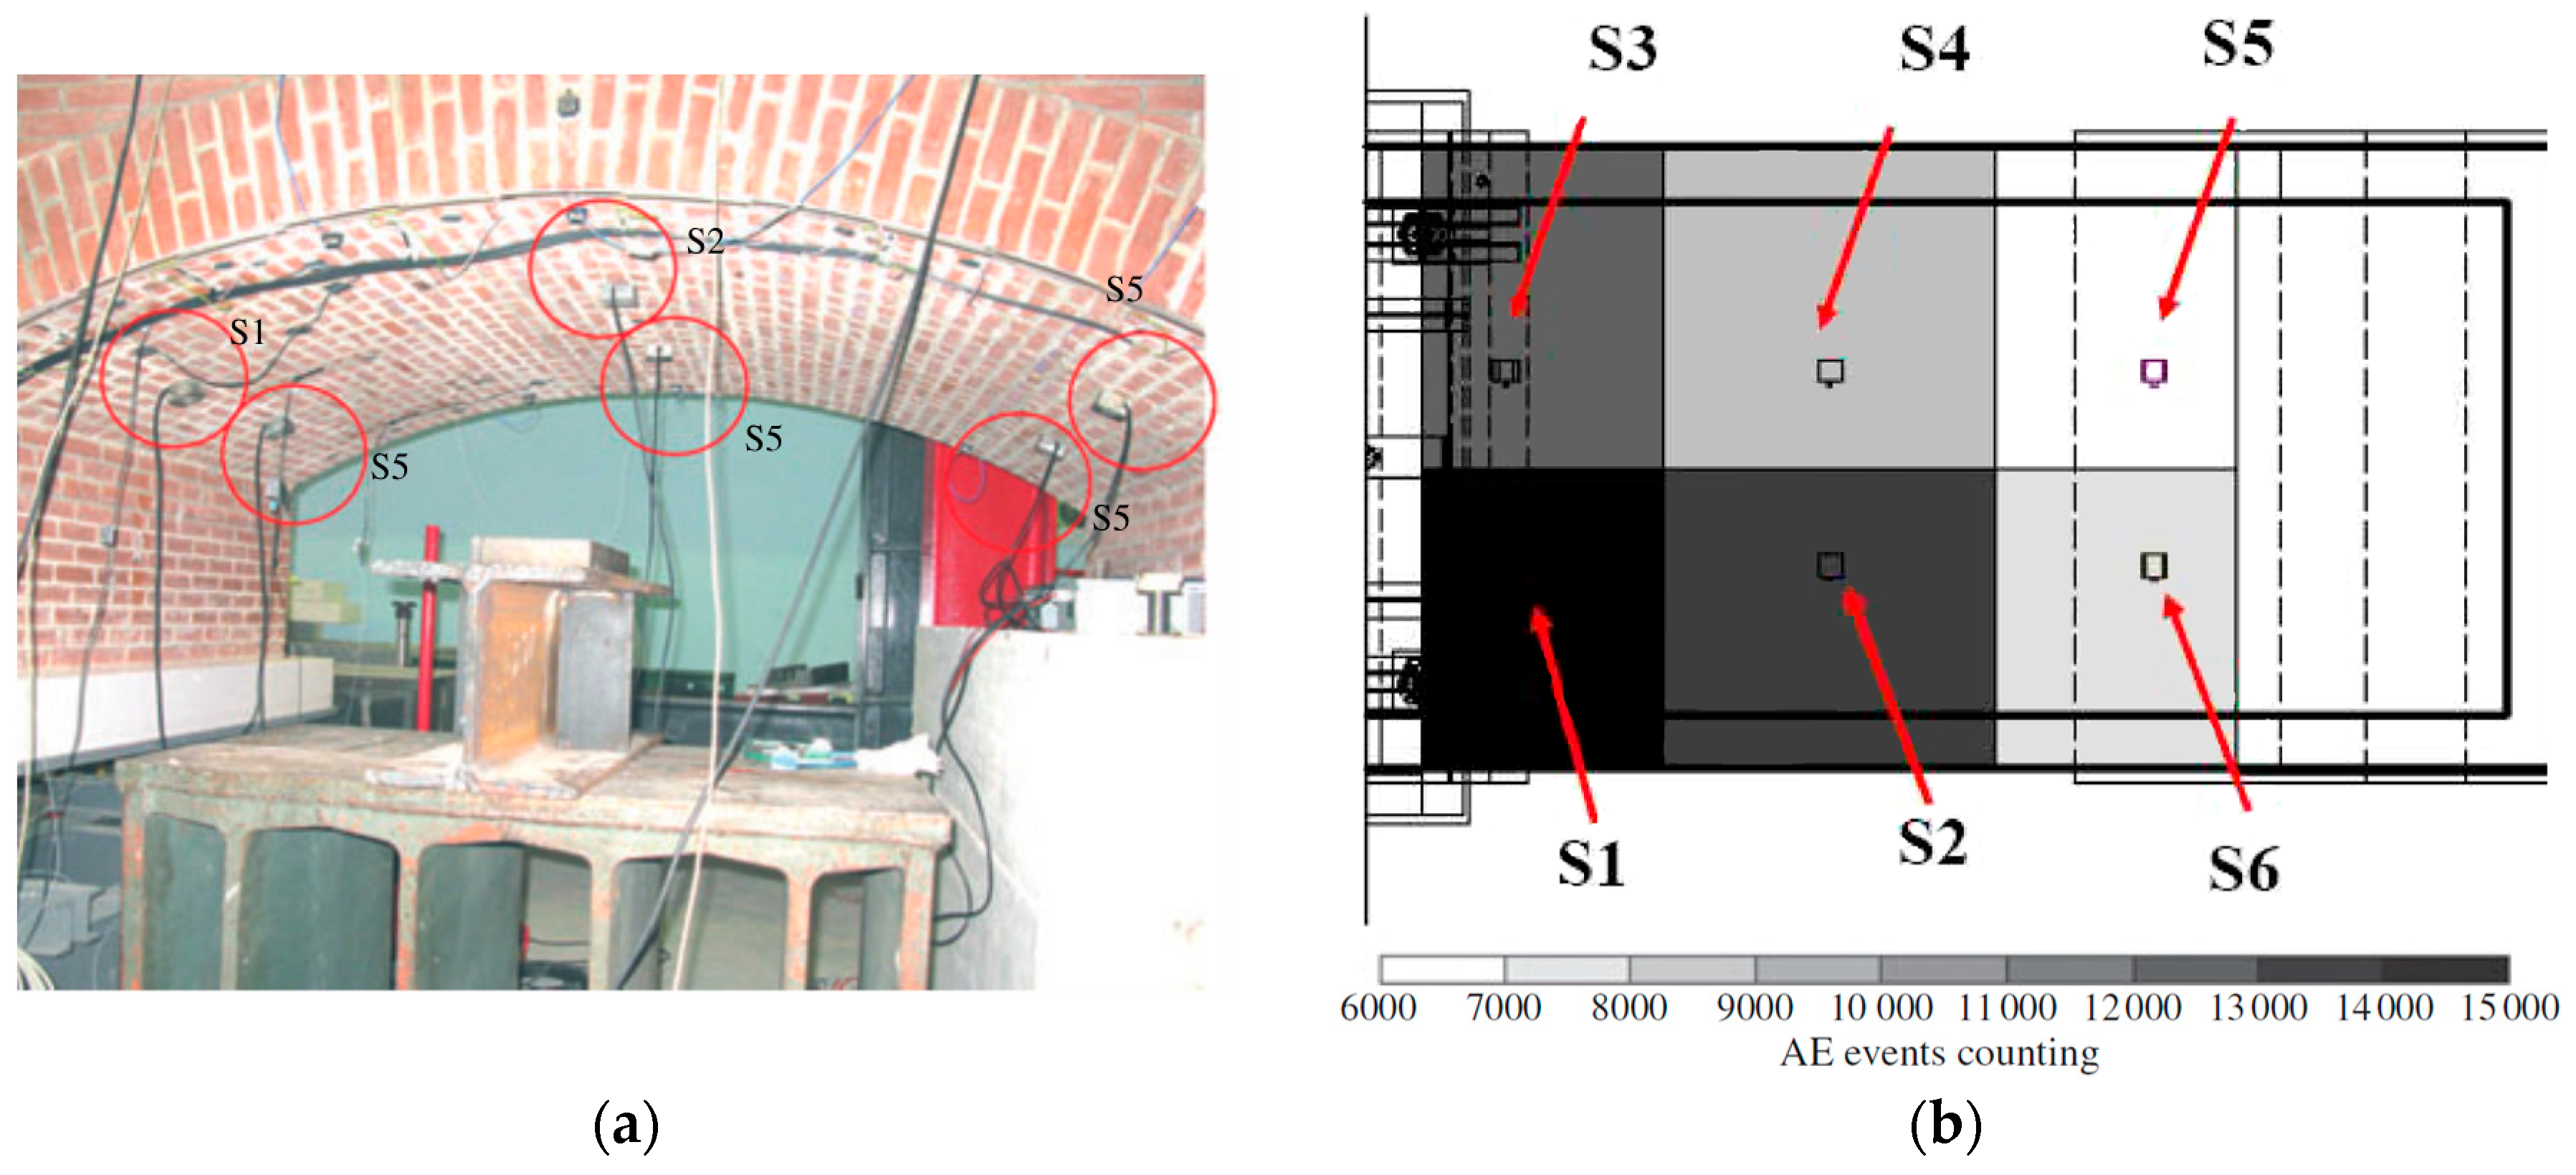
Due to this change of use, an assessment of the structural load capacity of the masonry vault beneath the first floor was necessary because the fossil collection involves a significant increase in the vault load. During the in situ load test, we recorded the acoustic emissions from the vault, as well as displacements of the vault and strains in the steel rods. We compared the experimental data with the numerical results obtained from finite element modeling of cracking and crushing. After validation, the model allowed us to assess the ultimate load-bearing capacity of the vault. The 3D model provided a slightly better estimate of the displacements close to the abutment (Figure 8). From the direct comparison of the cumulative AE counting distribution with the deformation of the structure, we determined that the two diagrams (Figure 9) match each other in shape quite well. In the present case, if the time scale is plotted without rescaling, the two curves do not match identically. Nevertheless, AE are confirmed as a useful tool to measure damage, specifically in the case of very stiff vaulted structures.

3. Model Structures

Numerical modeling has also been fruitfully combined with NDT and AE monitoring in the study of scaled model structures in the laboratory.
A scaled model of a two-span masonry arch bridge has been built to assess the consequences of the central pile settlement due to riverbank erosion [26]. The bridge geometry and the structural details, including the masonry bricks and mortar joints, are realized in 1:2 scale (Figure 10). The model bridge has been subjected to incremental settlement of the pile. To this purpose, a devoted mobile support was realized to sustain the central pile.
The AE counting has been recorded during the first stage of the settlement. The criticality of the ongoing process was monitored based on the interpretation of the AE rate acquired during the test. Moreover, it has been possible to localize the main damaged zones on the base of the number of AE recorded by each transducer. The statistical properties AE time series have been analyzed using an estimation of the b-value of the Gutenberg–Richter (GR) law that allows assessment of the damage level reached in the model (Figure 11).

4. Material Meso and Microstructure

When numerical simulation is combined with AE monitoring at the meso and micro scale, detailed information about the damage evolution are obtained. In particular, the AE statistics and evolution law of the b-value with increasing damage can be obtained numerically. The AE statistics is analogous to the well-known Gutenberg–Richter, which express the link between the magnitude and the frequency of seismic events. The b-value is related to the slope, in the bilogarithmic diagram, of the Gutenberg–Richter relation, and can be interpreted as an indicator of the criticality of the rupture process. Seismic events and AE share, at very different dimensional scales, the same physical nature, both being energy release phenomena due to damage propagation and rupture.

4.1. Smeared Cracking

Finite element modeling can be performed adopting a smeared cracking constitutive law. In this way the number of crack advance at each gauss point can be put into correspondence with AE events recorded during monitoring.
The double flat jack test has been studied in details [27], combining it with AE monitoring and considering an experimental configuration where the analyzed volume of masonry is not constant.
The numerical model accounts for the detailed mesostructure of the masonry texture (Figure 12). Although it is not possible to obtain an easy direct relation between the acoustic emission and the amount of cracking, nevertheless, it is possible to state that the two quantities are proportional to each other when increasing sizes are considered (Figure 13).
Also, concrete-like materials can be studied with a similar strategy, in order to account for the detailed material microstructure composed of matrix and aggregates [28]. In this way the volumetric scaling of AE was obtained numerically (Figure 14).

4.2. Particle Strategy

The propagation of micro cracks can be put in direct correspondence with AE events by adopting a particle strategy according to the distinct element method [29]. In this case, every single aggregate is modeled as a particle of appropriate size distribution, while a reciprocal lattice of beams that simulates the matrix (Figure 15a,b). The method is particularly effective in compression crushing simulation (Figure 15c).
The method correctly describes the size effect on compressive strength and the scaling of AE with size. In addition, the b-value can be evaluated numerically, as shown in Figure 16. The evolution of the parameter obtained numerically is in good agreement with theoretical prevision and experimental results.

5. Conclusions

A number of case studies, analyzed by the authors in the last fifteen years, are summarized and briefly described to emphasize the advantage of combined numerical methods and AE monitoring. This analysis shows how proper numerical modeling can improve the comprehension of involved phenomena and the reliability of structural assessment. The role of the geometrical and temporal scale is emphasized, and the complex statistics of the energy release magnitude obtained from monitoring and numerical simulations are successfully compared.

Author Contributions

A.C. supervised the research; S.I. performed the numerical simulations; G.L. carried out acoustic emission and nondestructive technique tests; S.I. wrote the paper after discussion with all the authors.

Conflicts of Interest

The authors declare no conflict of interest.

References

  1. Anzani, A.; Binda, L.; Carpinteri, A.; Invernizzi, S.; Lacidogna, G. A multilevel approach for the damage assessment of historic masonry towers. J. Cult. Herit. 2010, 11, 459–470. [Google Scholar] [CrossRef]
  2. Ohtsu, M. The history and development of acoustic emission in concrete engineering. Mag. Concr. Res. 1996, 48, 321–330. [Google Scholar] [CrossRef]
  3. Grosse, C.; Ohtsu, M. Acoustic Emission Testing; Springer: Berlin, Germany, 2008. [Google Scholar]
  4. Carpinteri, A.; Lacidogna, G.; Pugno, N. Structural damage diagnosis and life-time assessment by acoustic emission monitoring. Eng. Fract. Mech. 2007, 74, 273–289. [Google Scholar] [CrossRef]
  5. Aggelis, D.G. Classification of cracking mode in concrete by acoustic emission parameters. Mech. Res. Commun. 2011, 38, 153–157. [Google Scholar] [CrossRef]
  6. Scholz, C.H. The frequency-magnitude relation of microfracturing in rock and its relation to earthquakes. Bull. Seismol. Soc. Am. 1968, 58, 399–415. [Google Scholar]
  7. Shiotani, T.; Fujii, K.; Aoki, T.; Amou, K. Evaluation of progressive failure using AE sources and improved b-value on Slope Model Tests. Progr. Acoust. Emiss. 1994, 7, 529–534. [Google Scholar]
  8. Kurz, J.H.; Finck, F.; Grosse, C.U.; Reinhardt, H.W. Stress drop and stress redistribution in concrete quantified over time by the b-value analysis. Struct. Health. Monit. 2006, 5, 69–81. [Google Scholar] [CrossRef]
  9. Carpinteri, A.; Lacidogna, G.; Puzzi, S. From criticality to final collapse: Evolution of the b-value from 1.5 to 1.0. Chaos Solitons Fractals 2009, 41, 843–853. [Google Scholar] [CrossRef]
  10. Aggelis, D.G.; Mpalaskas, A.C.; Ntalakas, D.; Matikas, T.E. Effect of wave distortion on acoustic emission characterization of cementitious materials. Constr. Build. Mater. 2012, 35, 183–190. [Google Scholar] [CrossRef]
  11. Carpinteri, A.; Lacidogna, G.; Accornero, F.; Mpalaskas, A.C.; Matikas, T.E.; Aggelis, D.G. Influence of damage in the acoustic emission parameters. Cement Concrete Compos. 2013, 44, 9–16. [Google Scholar] [CrossRef]
  12. Wadley, H.N.G.; Scruby, C.B.; Speake, J.H. Acoustic emission for physical examination of metals. Int. Metals Rev. 1980, 2, 41–64. [Google Scholar] [CrossRef]
  13. Onoe, M.; Tsao, J.W. Numerical simulation of acoustic emissions. Jap. J. Appl. Phys. 1981, 20, 177–180. [Google Scholar] [CrossRef]
  14. Tang, C. Numerical simulation of progressive rock failure and associated seismicity. Int. J. Rock Mech. Min. Sci. 1997, 34, 249–261. [Google Scholar] [CrossRef]
  15. Ohtsu, M.; Kaminaga, Y.; Munwam, M.C. Experimental and numerical crack analysis of mixed-mode failure in concrete by acoustic emission and boundary element method. Constr. Build. Mater. 1999, 13, 57–64. [Google Scholar] [CrossRef]
  16. Mpalaskas, A.C.; Vasilakos, I.; Matikas, T.E.; Chai, H.K.; Aggelis, D.G. Monitoring of the fracture mechanisms induced by pull-out and compression in concrete. Eng. Fract. Mech. 2014, 128, 219–230. [Google Scholar] [CrossRef]
  17. Sause, M.R.G.; Richler, S. Finite element modelling of cracks as acoustic emission sources. J. Nondestruct. Eval. 2015, 34. [Google Scholar] [CrossRef]
  18. Schechinger, B.; Vogel, T. Acoustic emission for monitoring a reinforced concrete beam subject to four-point-bending. Constr. Build. Mater. 2007, 21, 483–490. [Google Scholar] [CrossRef]
  19. Kocur, G.K.; Saenger, E.H.; Vogel, T. Elastic wave propagation in a segmented X-ray computed tomography model of a concrete specimen. Constr. Build. Mater. 2010, 24, 2393–2400. [Google Scholar] [CrossRef]
  20. Grégoire, D.; Verdon, L.; Lefort, V.; Grassl, P.; Saliba, J.; Regoin, J.P.; Loukili, A.; Pijaudier-Cabot, G. Mesoscale analysis of failure in quasi-brittle materials: Comparison between lattice model and acoustic emission data. Int. J. Numer. Anal. Meth. Geomech. 2015, 39, 1639–1664. [Google Scholar] [CrossRef]
  21. Veselý, V.; Vodák, O.; Trčka, T.; Sobek, J.; Koktavý, P.; Keršner, Z.; Koktavý, B. Acoustic emission from quasi-brittle failure of cementitious composites—Experimental measurements and cohesive crack model simulations. Key Eng. Mater. 2014, 592–593, 676–679. [Google Scholar] [CrossRef]
  22. Carpinteri, A.; Invernizzi, S.; Lacidogna, G. Numerical assessment of three medieval masonry towers subjected to different loading conditions. Mason. Int. 2006, 19, 65–76. [Google Scholar]
  23. Carpinteri, A.; Invernizzi, S.; Lacidogna, G. In situ damage assessment and nonliner modelling of an historical masonry tower. Eng. Struct. 2005, 27, 387–395. [Google Scholar] [CrossRef]
  24. Carpinteri, A.; Lacidogna, G.; Manuello, A.; Invernizzi, S.; Binda, L. Stability of the vertical bearing structures of the Syracuse Cathedral: Experimental and numerical evaluation. Mater. Struct. 2009, 42, 877–888. [Google Scholar] [CrossRef]
  25. Carpinteri, A.; Invernizzi, S.; Lacidogna, G. Structural assessment of a XVIIth century masonry vault with AE and numerical techniques. Int. J. Archit. Herit. 2007, 1, 214–226. [Google Scholar] [CrossRef]
  26. Invernizzi, S.; Lacidogna, G.; Manuello, A.; Carpinteri, A. AE monitoring and numerical simulation of a two-span model masonry arch bridge subjected to pier scour. Strain 2011, 47, 158–169. [Google Scholar] [CrossRef]
  27. Carpinteri, A.; Invernizzi, S.; Lacidogna, G. Historical brick-masonry subjected to double flat-jack test: Acoustic Emissions and scale effects on cracking density. Constr. Build. Mater. 2009, 23, 2813–2820. [Google Scholar] [CrossRef]
  28. Invernizzi, S.; Lacidogna, G.; Carpinteri, A. Scaling of fracture and acoustic emission in concrete. Mag. Concrete Res. 2013, 65, 529–534. [Google Scholar] [CrossRef]
  29. Invernizzi, S.; Lacidogna, G.; Carpinteri, A. Particle-based numerical modeling of AE statistics in disordered materials. Meccanica 2013, 48, 211–220. [Google Scholar] [CrossRef]
Figure 1. View of the Astesiano, Sineo and Bonino towers in Alba.
Applsci 06 00102 g001
Figure 2. Torre Sineo: (a) vertical stresses (MPa); (b) overall crack pattern; (c) detail crack pattern of the basement area, corresponding to a 3% deviation from verticality.
Applsci 06 00102 g002
Figure 3. Torre Astesiano: (a) internal side of the South wall: principal tensile stress (MPa); (be) thermally induced crack pattern evolution; (fg) deformed mesh and vertical stresses (MPa) of the damaged model.
Applsci 06 00102 g003
Figure 4. Torre Bonino: (a) detail of the stone layer discretization; (b) principal tensile stresses σ1 (MPa).
Applsci 06 00102 g004
Figure 5. Damage monitoring: (a) Sineo tower; (b) Astesiano tower; (c) Bonino tower.
Applsci 06 00102 g005
Figure 6. (a) Plan of the Syracuse Cathedral and most critical pillar; (b) cracking pattern and localization of AE sources; (c) deformed mesh due to the seismic load; (d) cracking in the pillar due to to the seismic acceleration.
Applsci 06 00102 g006
Figure 7. Hospital San Giovanni: photograph inside the vault.
Applsci 06 00102 g007
Figure 8. (a) Vault subjected to the dead load: principal compression stress contour; (b) 3D vault deformed mesh; (c) time-displacement diagrams at the springing and (d) close to the keystone.
Applsci 06 00102 g008
Figure 9. Graph of the comparison between cumulated acoustic emission (AE) counting (right y-axis), and the experimental or two-dimensional finite element vertical displacements (left y-axis): (a) node 105, and (b) node 1123.
Applsci 06 00102 g009
Figure 10. (a) Placing of the acoustic emissions sensors, and their competence areas; (b) number of acoustic events in each competence area.
Applsci 06 00102 g010
Figure 11. Evolution of the b-value compared to pile’s incremental settlements.
Applsci 06 00102 g011
Figure 12. (a) Double flat jack experimental set; (b) numerical discretization and crack patterns for increasing distance between the flat jacks.
Applsci 06 00102 g012
Figure 13. Double flat jack test: Proportionality between Nmax and the number of cracked finite elements.
Applsci 06 00102 g013
Figure 14. Compression tests: (a) sample meshes; (b) proportionality between Nmax and the number of cracked finite elements.
Applsci 06 00102 g014
Figure 15. (a) Bond interaction scheme between two particles; (b) particle size distribution; (c) subsequent stages of crushing obtained from a simulated compression test.
Applsci 06 00102 g015
Figure 16. (a) Comparison between numerical results (stars and continuous line) and experimental size effect on compression strength (diamonds and dotted line); (b) comparison between the stress level and the variation of the simulated b-value (circles) as a function of time.
Applsci 06 00102 g016

