Article

Acoustic Emission Activity for Characterizing Fracture of Marble under Bending

by
Eleni Tsangouri
1,
Dimitrios G. Aggelis
1,†,
Theodore E. Matikas
2,† and
Anastasios C. Mpalaskas
2,*
1
Department of Mechanics of Materials and Constructions, Vrije Universiteit Brussel, Pleinlaan 2, Brussels 1050, Belgium
2
Department Materials Science and Engineering, University of Ioannina, Ioannina 45110, Greece
*
Author to whom correspondence should be addressed.
These authors contributed equally to this work.
Appl. Sci. 2016, 6(1), 6; https://doi.org/10.3390/app6010006
Submission received: 24 November 2015 / Revised: 16 December 2015 / Accepted: 18 December 2015 / Published: 24 December 2015
(This article belongs to the Special Issue Acoustic and Elastic Waves: Recent Trends in Science and Engineering)

Abstract

:
The present paper occupies with the acoustic emission (AE) monitoring of fracture of marble. The specimens belong to two different material types and were tested in three-point bending after being ultrasonically interrogated. Consequently, they were repaired by means of suitable epoxy agent and mechanically re-loaded. Apart from the well-known correlation of pulse velocity to strength, which holds for the materials of this study as well, AE provides some unique insight in the fracture of the media. Parameters like the frequency content of the waveforms, and their duration among others show a transition in relation to the load. According to their strength class, the specimens exhibit distinct AE characteristics even at low load, enabling to judge their final strength class after having sustained just a small percentage of their ultimate capacity. More importantly, the AE activity during reloading indicates the quality of repair; specimens with good restoration of strength, exhibited similar AE activity to the intact specimens, while specimens with lower repaired capacity exhibited random behavior. This work discusses the passive monitoring of marble fracture and shows that AE parameters that have been used to successfully characterize cementitious materials, provide good results in monolithic materials like marble as well. It is suggested that AE monitoring during a proof loading can provide good information on the potential strength class, which is especially useful for repaired specimens, where the pulse velocity cannot be easily used.

1. Introduction

Acoustic emission (AE) is a technique used for many decades in structural health monitoring (SHM) applications. It uses sensors to record the elastic motion that follows crack nucleation and propagation events within the materials and transform them into electric waveforms. Their intensity (energy), number and other parameters reveal information on the crack density and propagation rate, the location and the mode of fracture [1,2,3,4]. The use of the technique in a typical laboratory experiment is shown in Figure 1. In typical rock materials like marble and granite, acoustic wave techniques have been used for quite some time. The cumulative AE activity was studied in relation to the fracture process of pre-cracked marble under compression. It was shown that specimens with “zigzag” cracks failed in a more unpredictable way since most of the activity was registered at the moments of macroscopic failure [5]. The evolution of AE activity was very indicative of the strain at creep experiments of granite [6]. The AE activity and energy release during compression was used to indicate the damage level showing that in marble, main damage comes with the peak stress, while earlier only micro-cracking is formed compared to granite and rock salt [7]. The frequency content of AE has shown to increase with the load, being essentially a precursor of failure in confining pressure experiments, while close to the peak load a strong drop was noticed [8]. The Kaiser effect (absence of detectable AE before the previous maximum load is overpassed) in Brazilian and bending tests was investigated to reveal the previous tensile stress imposed in marble [9]. Energy rate, hit counts, amplitude and location of AE events were used for characterization of crack propagation during the indentation test [10] and compression test in rock materials [11].
Figure 1. Typical acoustic emission (AE) setup.
Applsci 06 00006 g001
AE monitoring of rock material under compression showed mainly two time zones of high “avalanche-like” activity, interrupted by a long period of acoustic silence [12]. The effect of temperature on brittleness of marble was studied with AE corresponding very well to the “rupture evolution law” [13]. Complementary to AE, another elastic wave method, ultrasonic pulse velocity (UPV) has also been used for characterization of marble condition and mechanical performance. Specifically UPV has been used to derive elastic constants of marble [14] and has been positively correlated to the mean grain size of marble [15], while the anisotropy has also been highlighted due to the noticeable difference between the velocities at the three different axes [16]. The influence of water saturation in granite has also been examined by ultrasonic measurements. The effect of microstructure is revealed by the systematic increase of velocity for higher ultrasonic frequencies (150 kHz compared to 54 kHz) [17].
The present study is a continuation of preliminary tests on granite and marble. Previously, different fracture modes were targeted showing that AE is quite sensitive to the loading conditions [18,19]. Specimens loaded in pure bending emitted higher frequencies and signals of shorter duration relatively to shear-loaded ones. After encouraging results were found, in this case, a large population of specimens of two marble types was tested in bending with concurrent AE recoding to increase the statistical adequacy in an effort to check possible correlations between passively monitoring parameters and mechanical properties. The AE behavior proved very consistent exhibiting three distinct stages with different AE rate. Specific parameters can be used from the early loading to characterize the capacity of the material, like average frequency and RA value, which have been adopted from concrete practice. The fractured specimens were consequently repaired and reloaded to failure. The AE activity of repaired specimens showed capability to characterize the repair efficiency since the specimens with high reloading capacity exhibited similar AE stages with the intact material, while the ones with low strength restoration exhibited a more random behavior driven by the weak bond between the epoxy and the marble. To the authors knowledge, this is the first effort to relate low load AE (approximately one-third of the ultimate load) to the final load bearing capacity of marble both in the intact and the repaired state.

2. Experimental Section

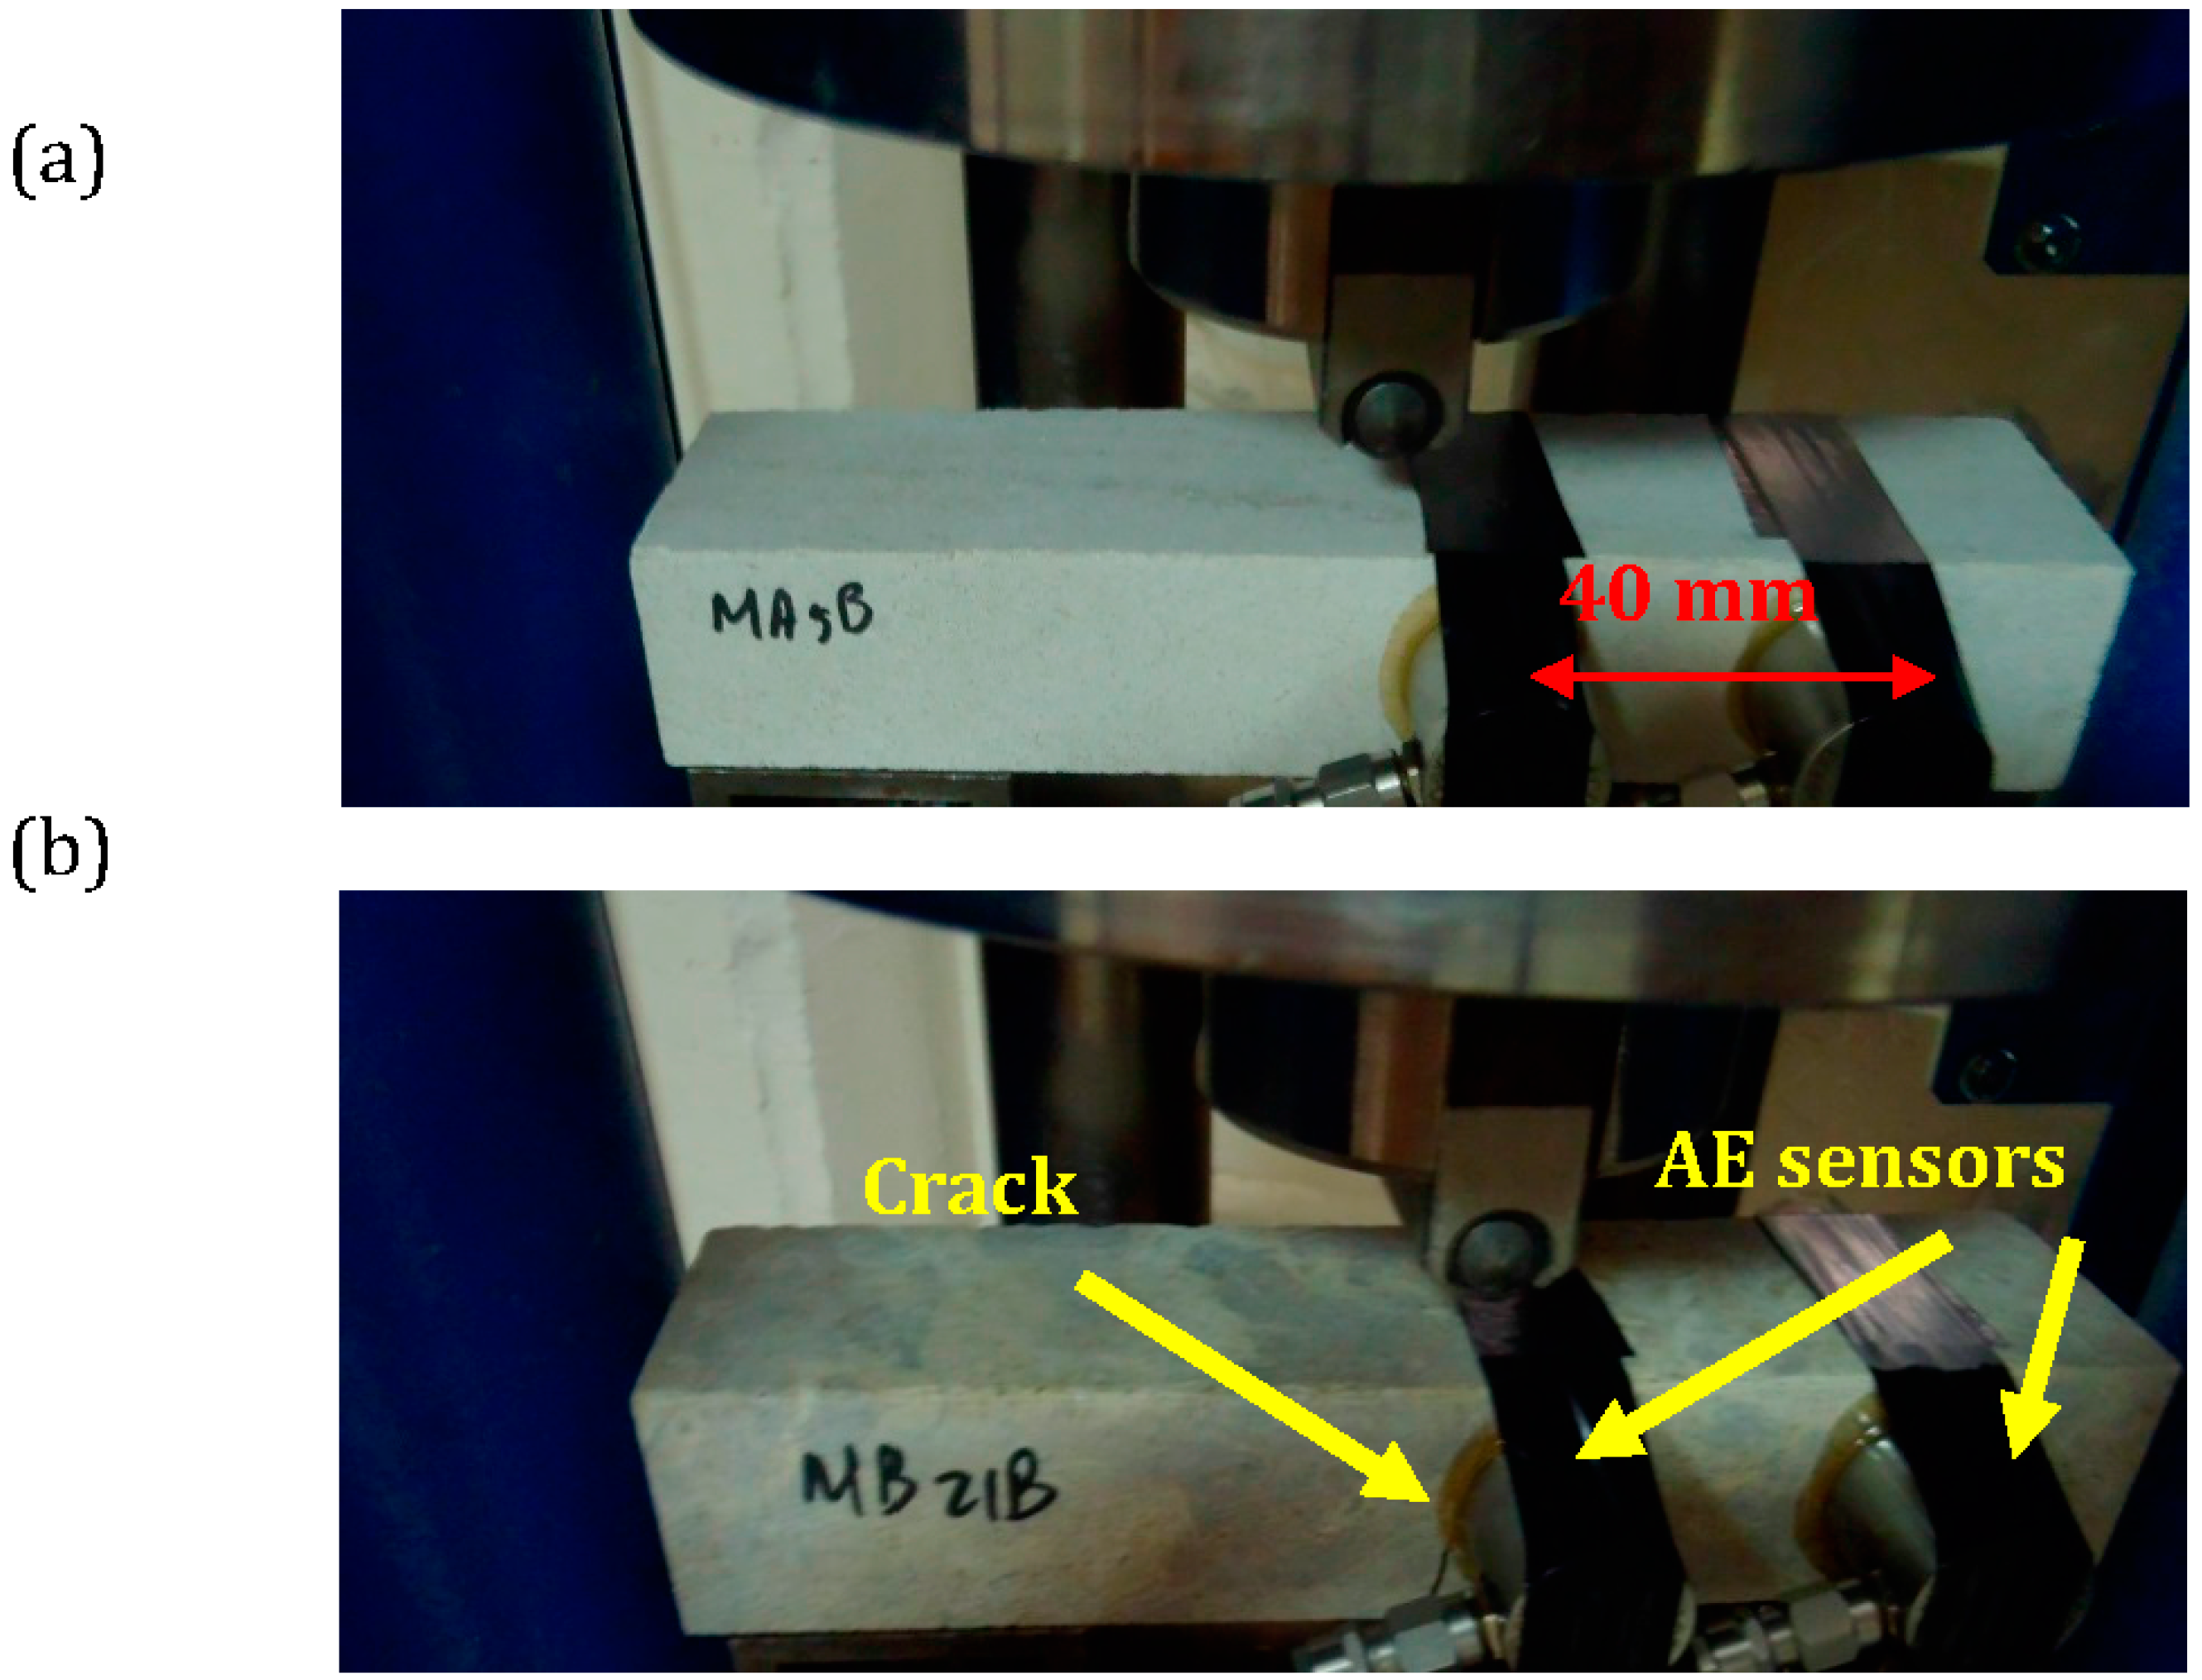
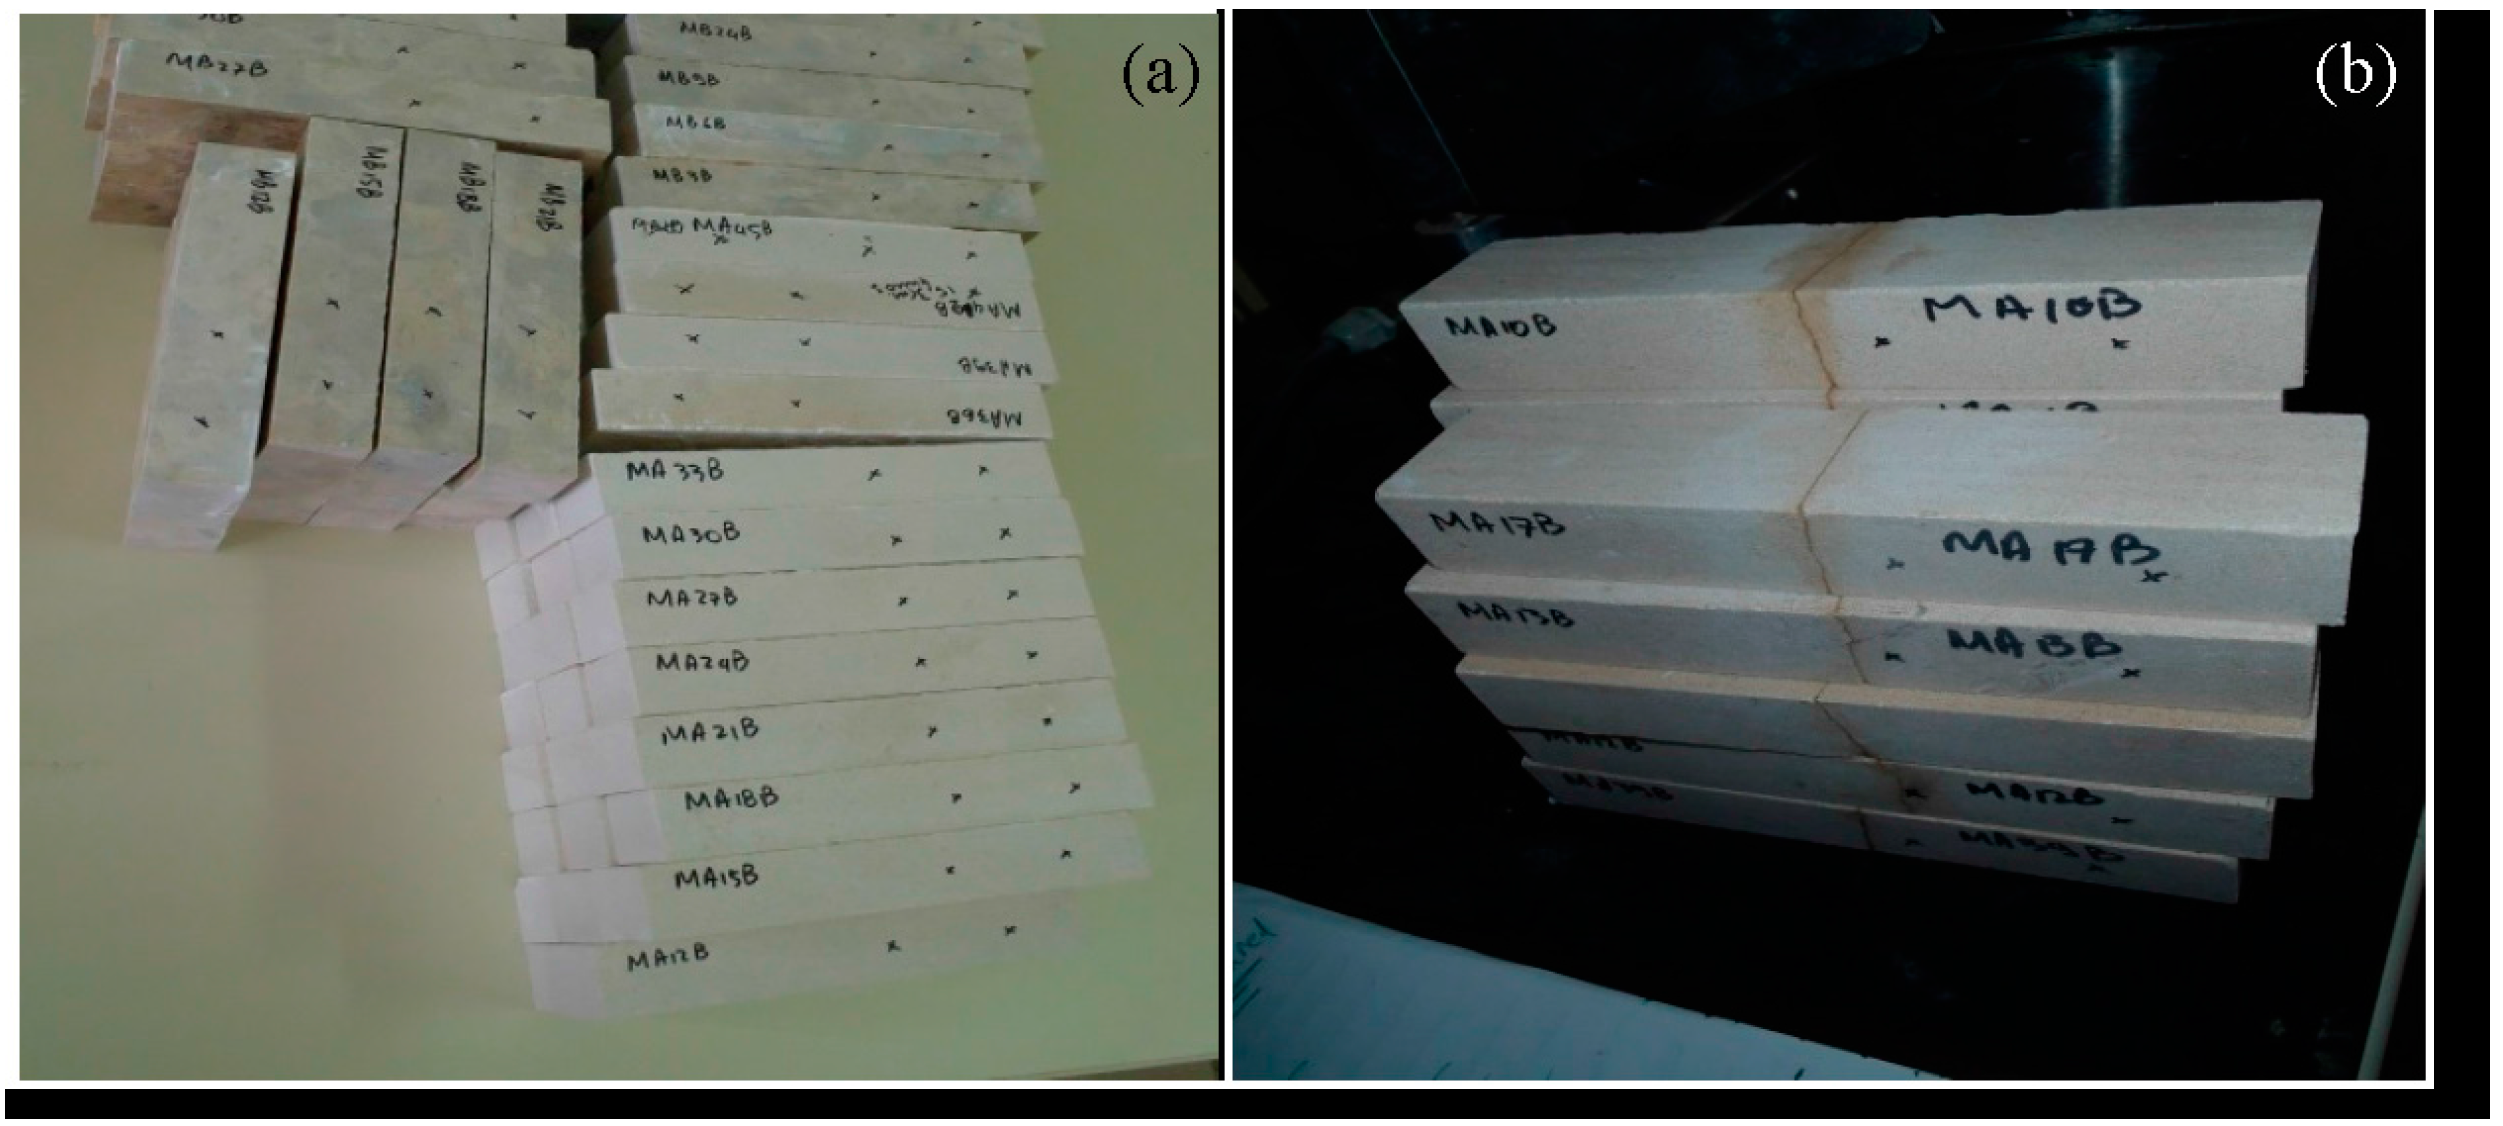
2.1. Materials and Mechanical Details

Two types of marble were used, one named California Honey from Morocco with an average measured density of 2280 kg/m3 and the other named Crema Mocha with an average measured density of 2508 kg/m3 from Spain [20]. For convenience the first marble type will be addressed as MA and the next as MB. The specimens were prismatic of size 40 × 30 × 160 mm. Thirty-three specimens of the first type of marble and forty specimens of the second type of marble were subjected to three-point bending according to EN 13892-2:2002, see Figure 2a,b. The load was applied at a constant rate of 50 N/s and the loading was automatically terminated at the moment of instant load drop. At the three-point bending test, the crack starts from the central point of the bottom side due to the tensile stresses (Figure 2b).
Figure 2. (a) Three point bending of (a) MA and (b) MB marble with concurrent AE monitoring by two sensors.
Applsci 06 00006 g002
After bending fracture has occurred all the specimens were repaired in the crack surface with a two-component solvent-free bonding system based on epoxy resin and hardener named “Epoxol” in its commercial product name. It is a specially formulated, high viscosity, polyester marble adhesive-putty, used to bond and fill for repair purposes with hardening time of approximately 5–6 h [21]. The bonding was carefully established so that the original geometry of the specimen was not altered. Figure 3a,b show the populations of healthy and repaired specimens for MA marble, respectively.
Figure 3. The population of (a) healthy and (b) repaired specimens for MA marble.
Applsci 06 00006 g003

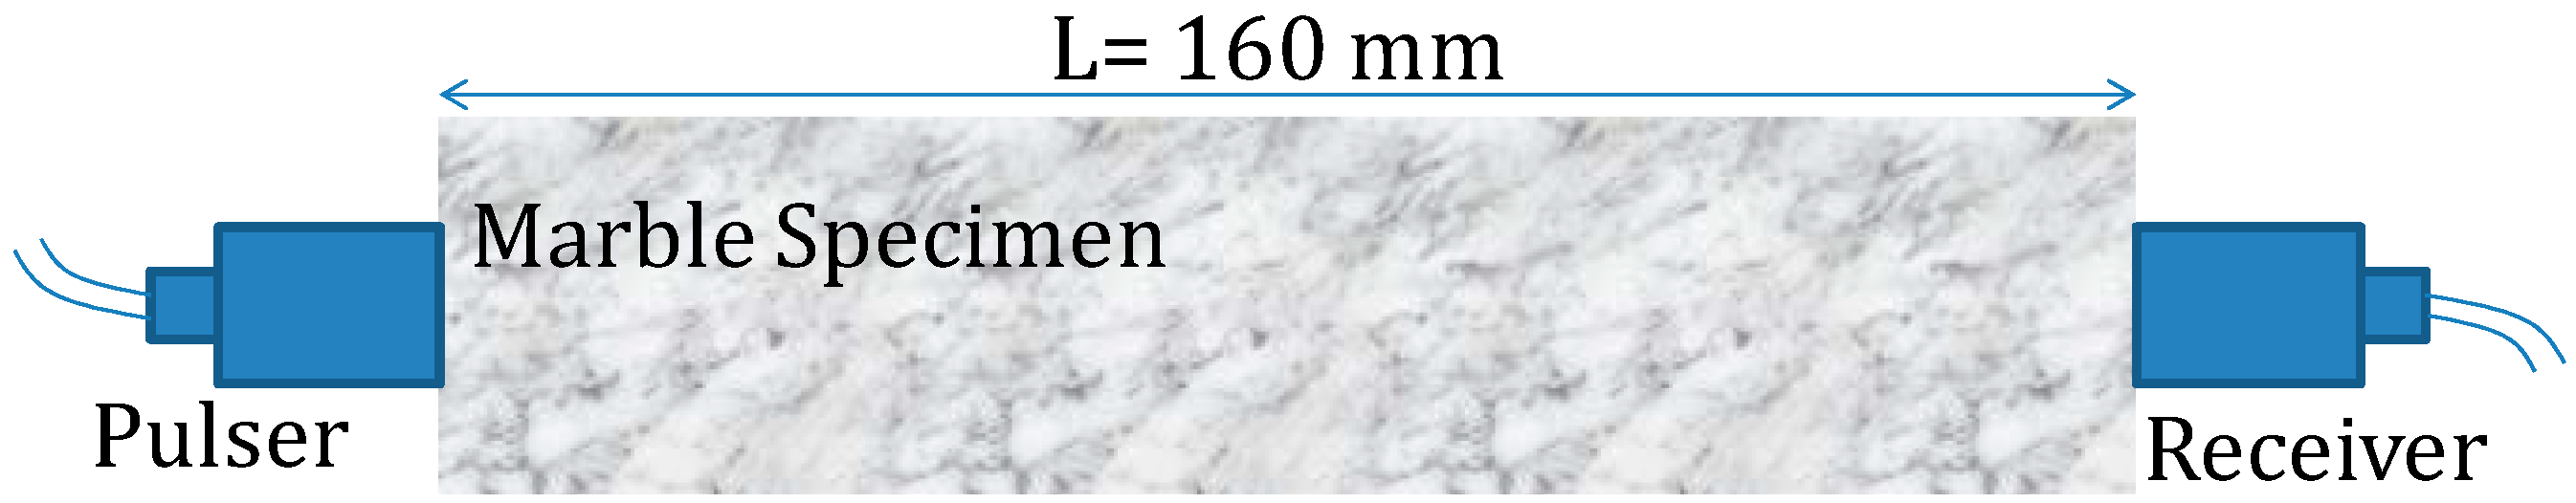
2.2. Ultrasonic Inspection

The whole population of specimens was examined by ultrasound before the fracture test. Two AE transducers (pulser and receiver) were placed on the longitudinal axis of the specimens as seen in Figure 4, having a wave path of 160 mm. A layer of grease between the transducers and the specimen enhanced acoustic coupling. The transducers were of 150 kHz resonance (R15, Mistras Group). The excitation came by a pulse generator with an electric cycle of 150 kHz directly fed to the pulser as well as the acquisition board to act as reference. The pulse velocity (UPV) was calculated by the wave path over the time delay to the first detectable disturbance of the received waveform. The signal was clear and there was no need for extra processing like stacking or filtering.
Figure 4. Schematic representation of ultrasound testing.
Applsci 06 00006 g004

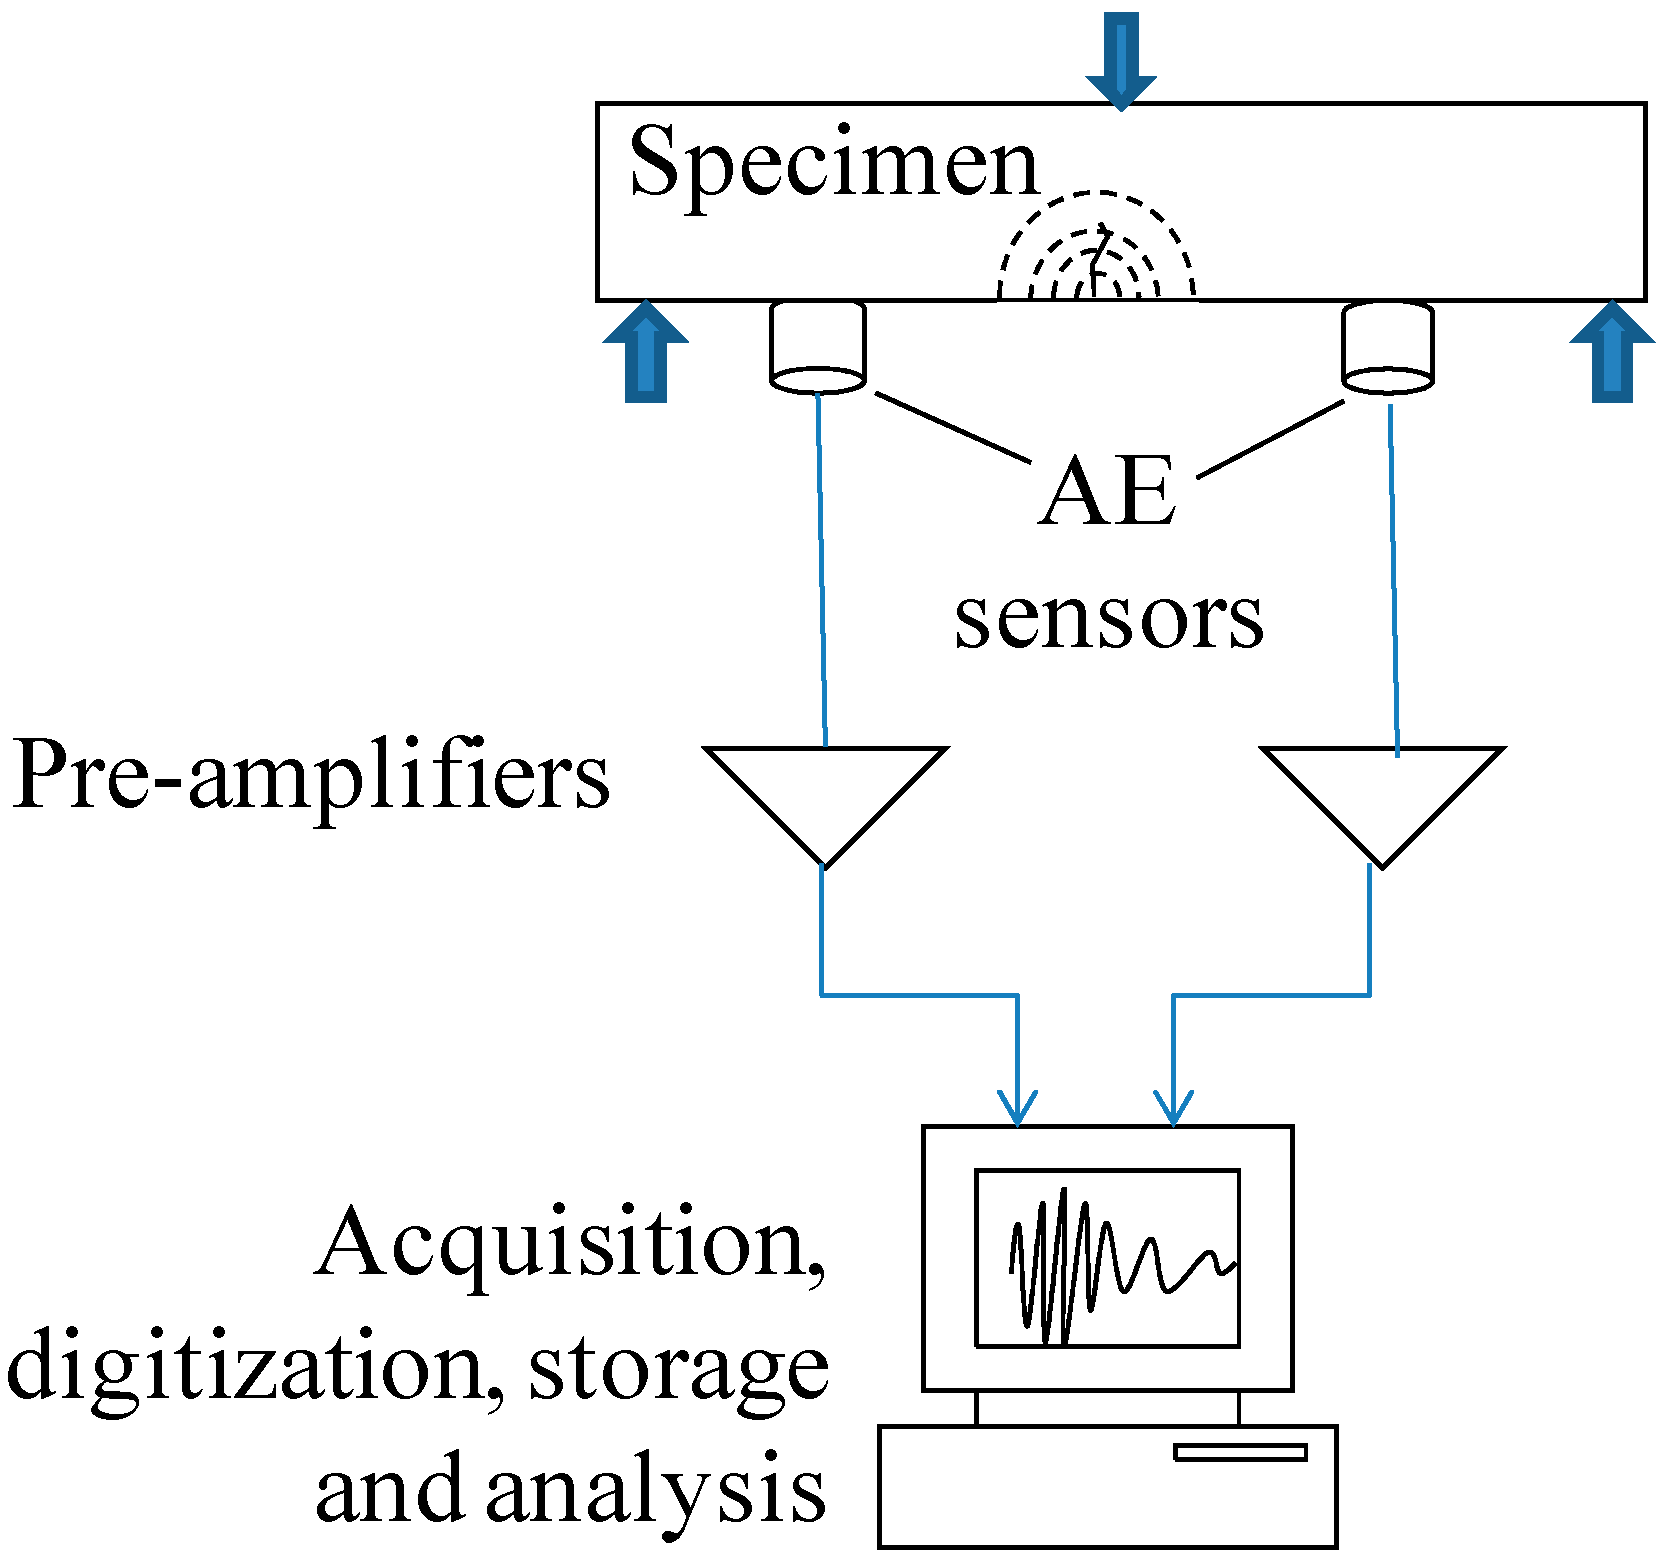
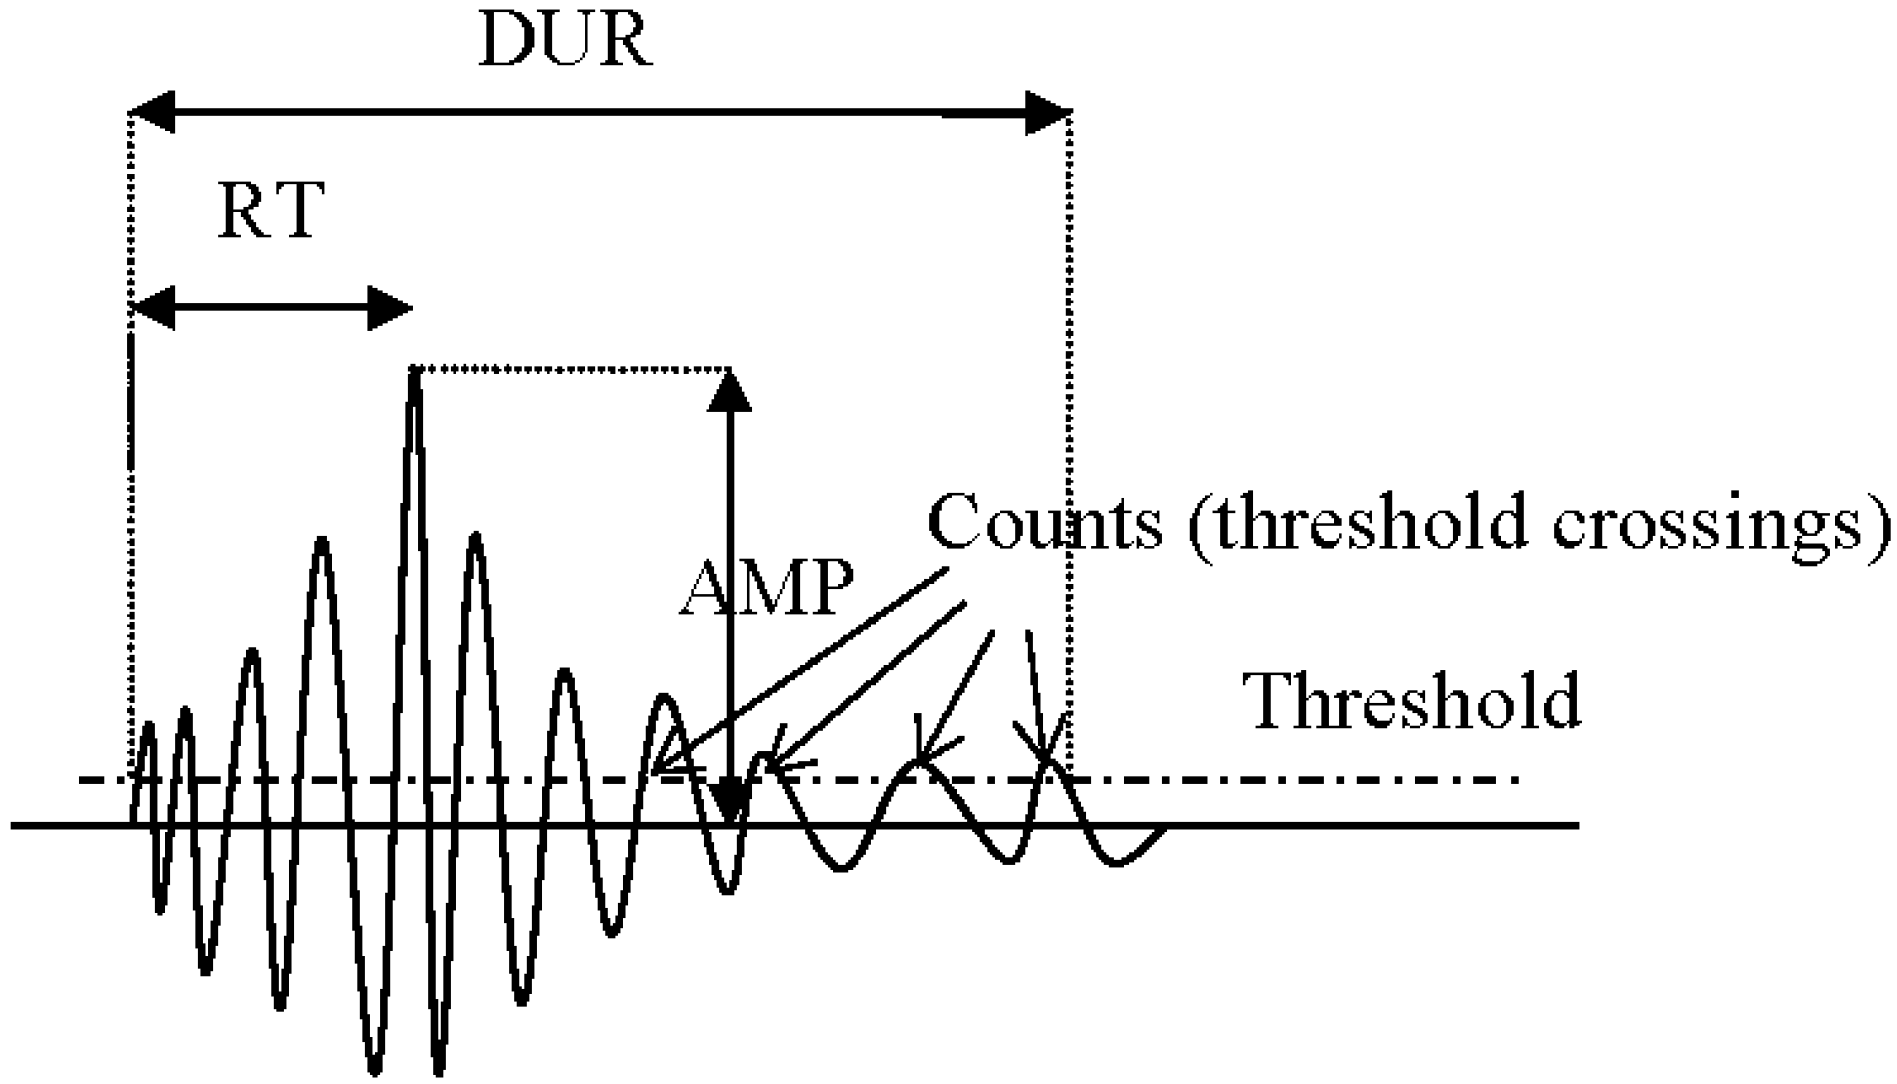
2.3. Acoustic Emission

AE monitoring took place by means of two piezoelectric sensors, (R15, Mistras). Their resonance comes at 150 kHz and their positions on the specimens are shown in Figure 2. The center of one sensor was placed 15 mm away from the point of the expected crack, which was secured by a notch. The second sensor was placed 40 mm away. Both sensors were positioned at the same side of the crack in order to be able to characterize the distortion of the signals as they propagate for the additional distance of 40 mm. Nevertheless, the effect of distortion will not be discussed herein and will be treated separately in another study. Acoustic coupling was improved by silicon grease between the sensors face and the specimens’ surface. AE activity was captured by a two-channel PCI-2 Mistras board with sampling rate of 5 MHz. The threshold was 40 dB, as well as the pre-amplification. A schematic representation of a waveform is seen in Figure 5. Some of the main features are the maximum amplitude, AMP (usually in dB), and the duration, DUR (period between the first and the last threshold crossing). The “rise time” (RT) (which is the time between the first threshold crossing and the point of peak amplitude in μs) is related to the fracture mode of the crack and so is the inverse of the slope of the initial part of the signal (RA value, RT/A in μs/V). The energy (ENE) is defined as the area under the rectified signal envelope. Frequency content can be measured by AF (average frequency), which is the total number of threshold crossings divided by the duration, while there are other indices based on the spectrum of the FFT.
Figure 5. Typical AE waveform and its basic characteristics.
Applsci 06 00006 g005

3. Results and Discussion
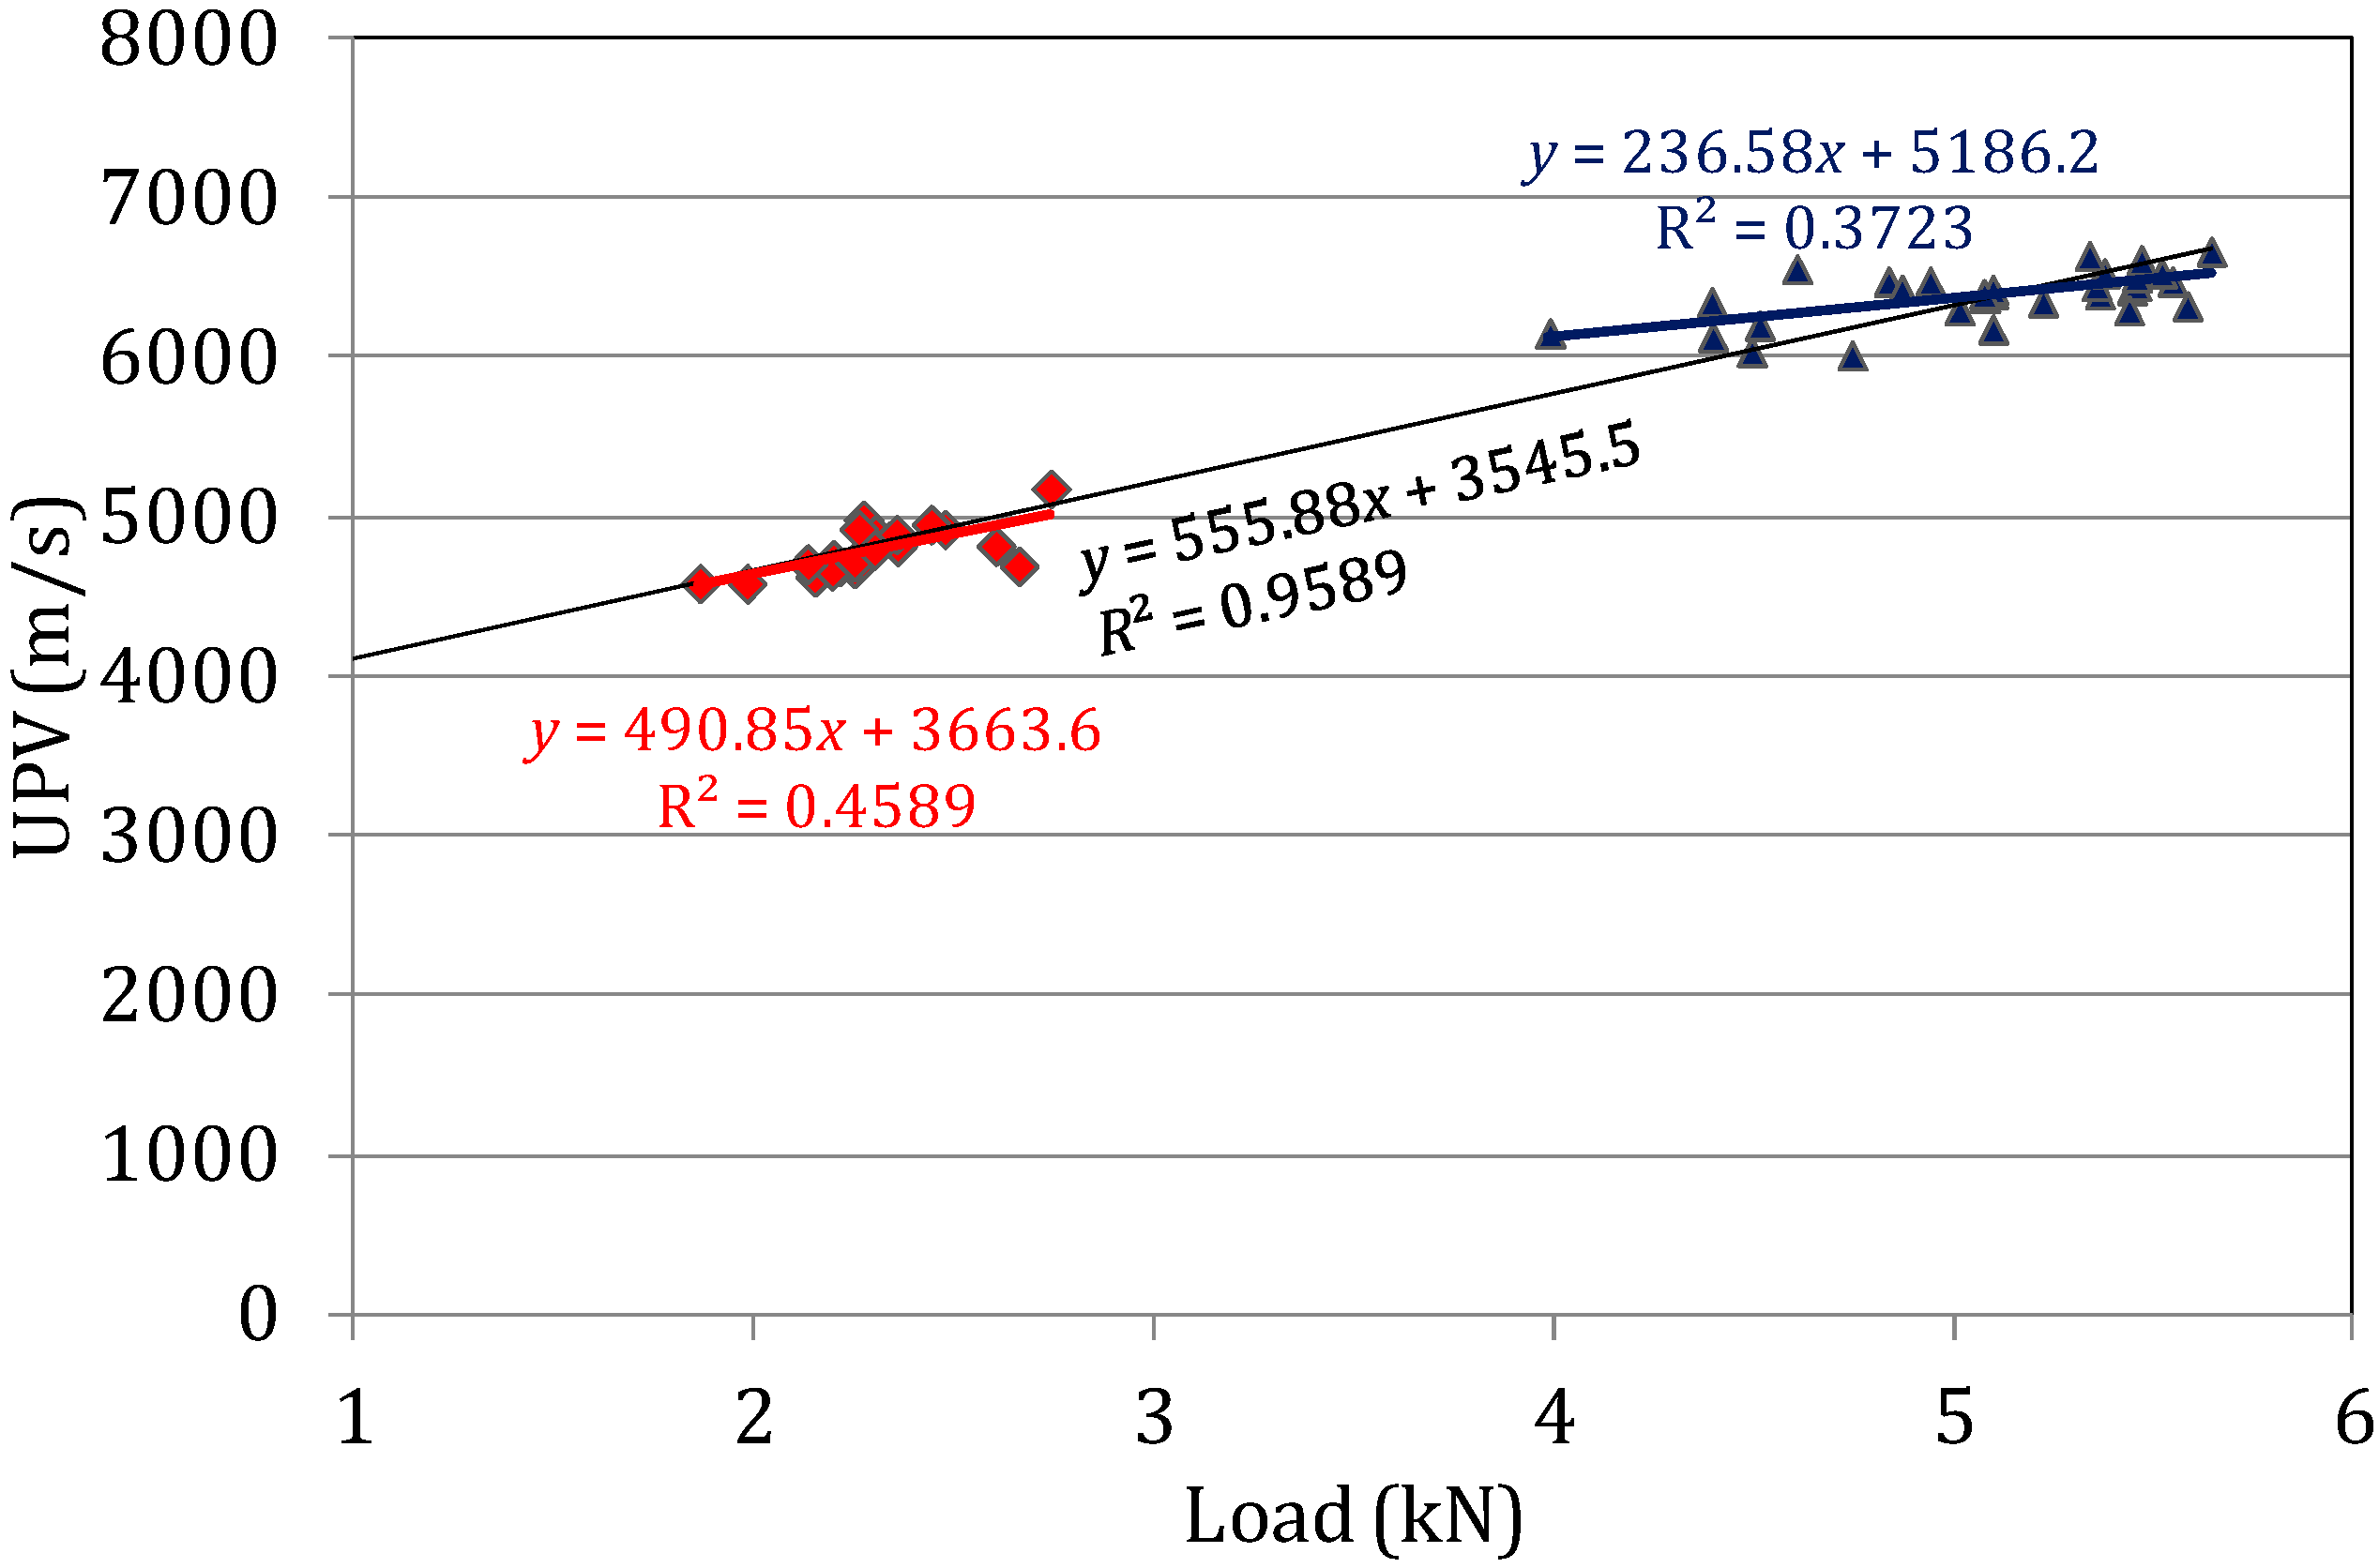
The mechanical results will be discussed along the monitoring ones in the corresponding ultrasonic and AE paragraphs.

3.1. Ultrasonics

The ultrasonic velocity results are summarized in Figure 6 in correlation to the maximum load of the specimens. Clearly, the two different types of marble formed two clusters. Type MB, which exhibited higher maximum load, also showed much higher pulse velocity. The differences are quite strong, as there is no overlap between the clusters, while there is also a weak (but not negligible) correlation within each cluster. In any case, the sensitivity of pulse velocity to the stiffness and indirectly to the strength of the engineering materials is well known [22,23].
Figure 6. Correlation between pulse velocity and maximum load for the marble specimens.
Applsci 06 00006 g006

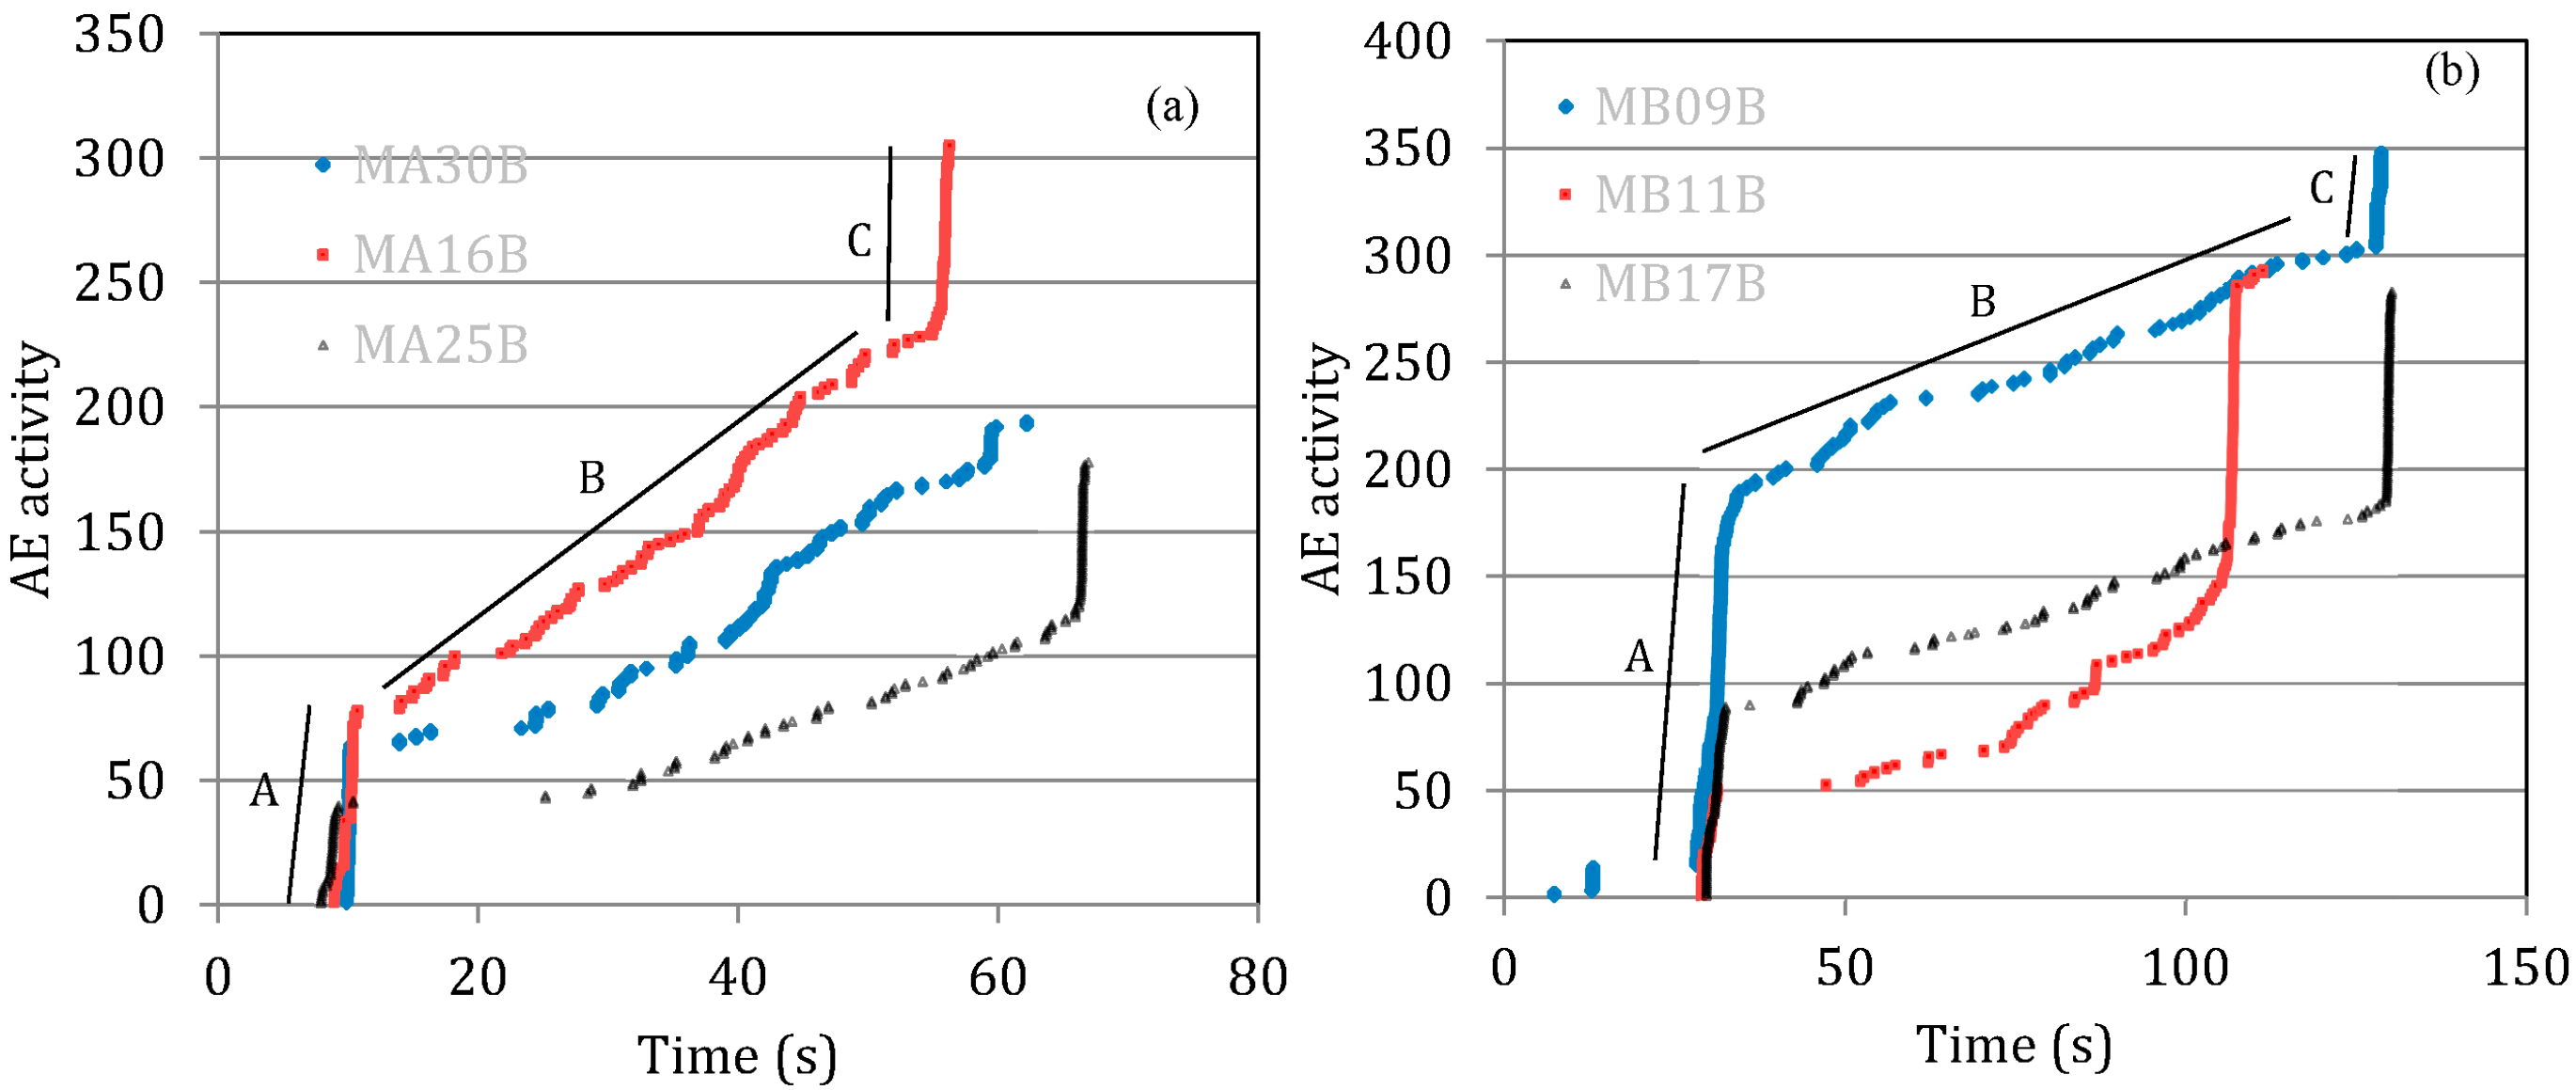
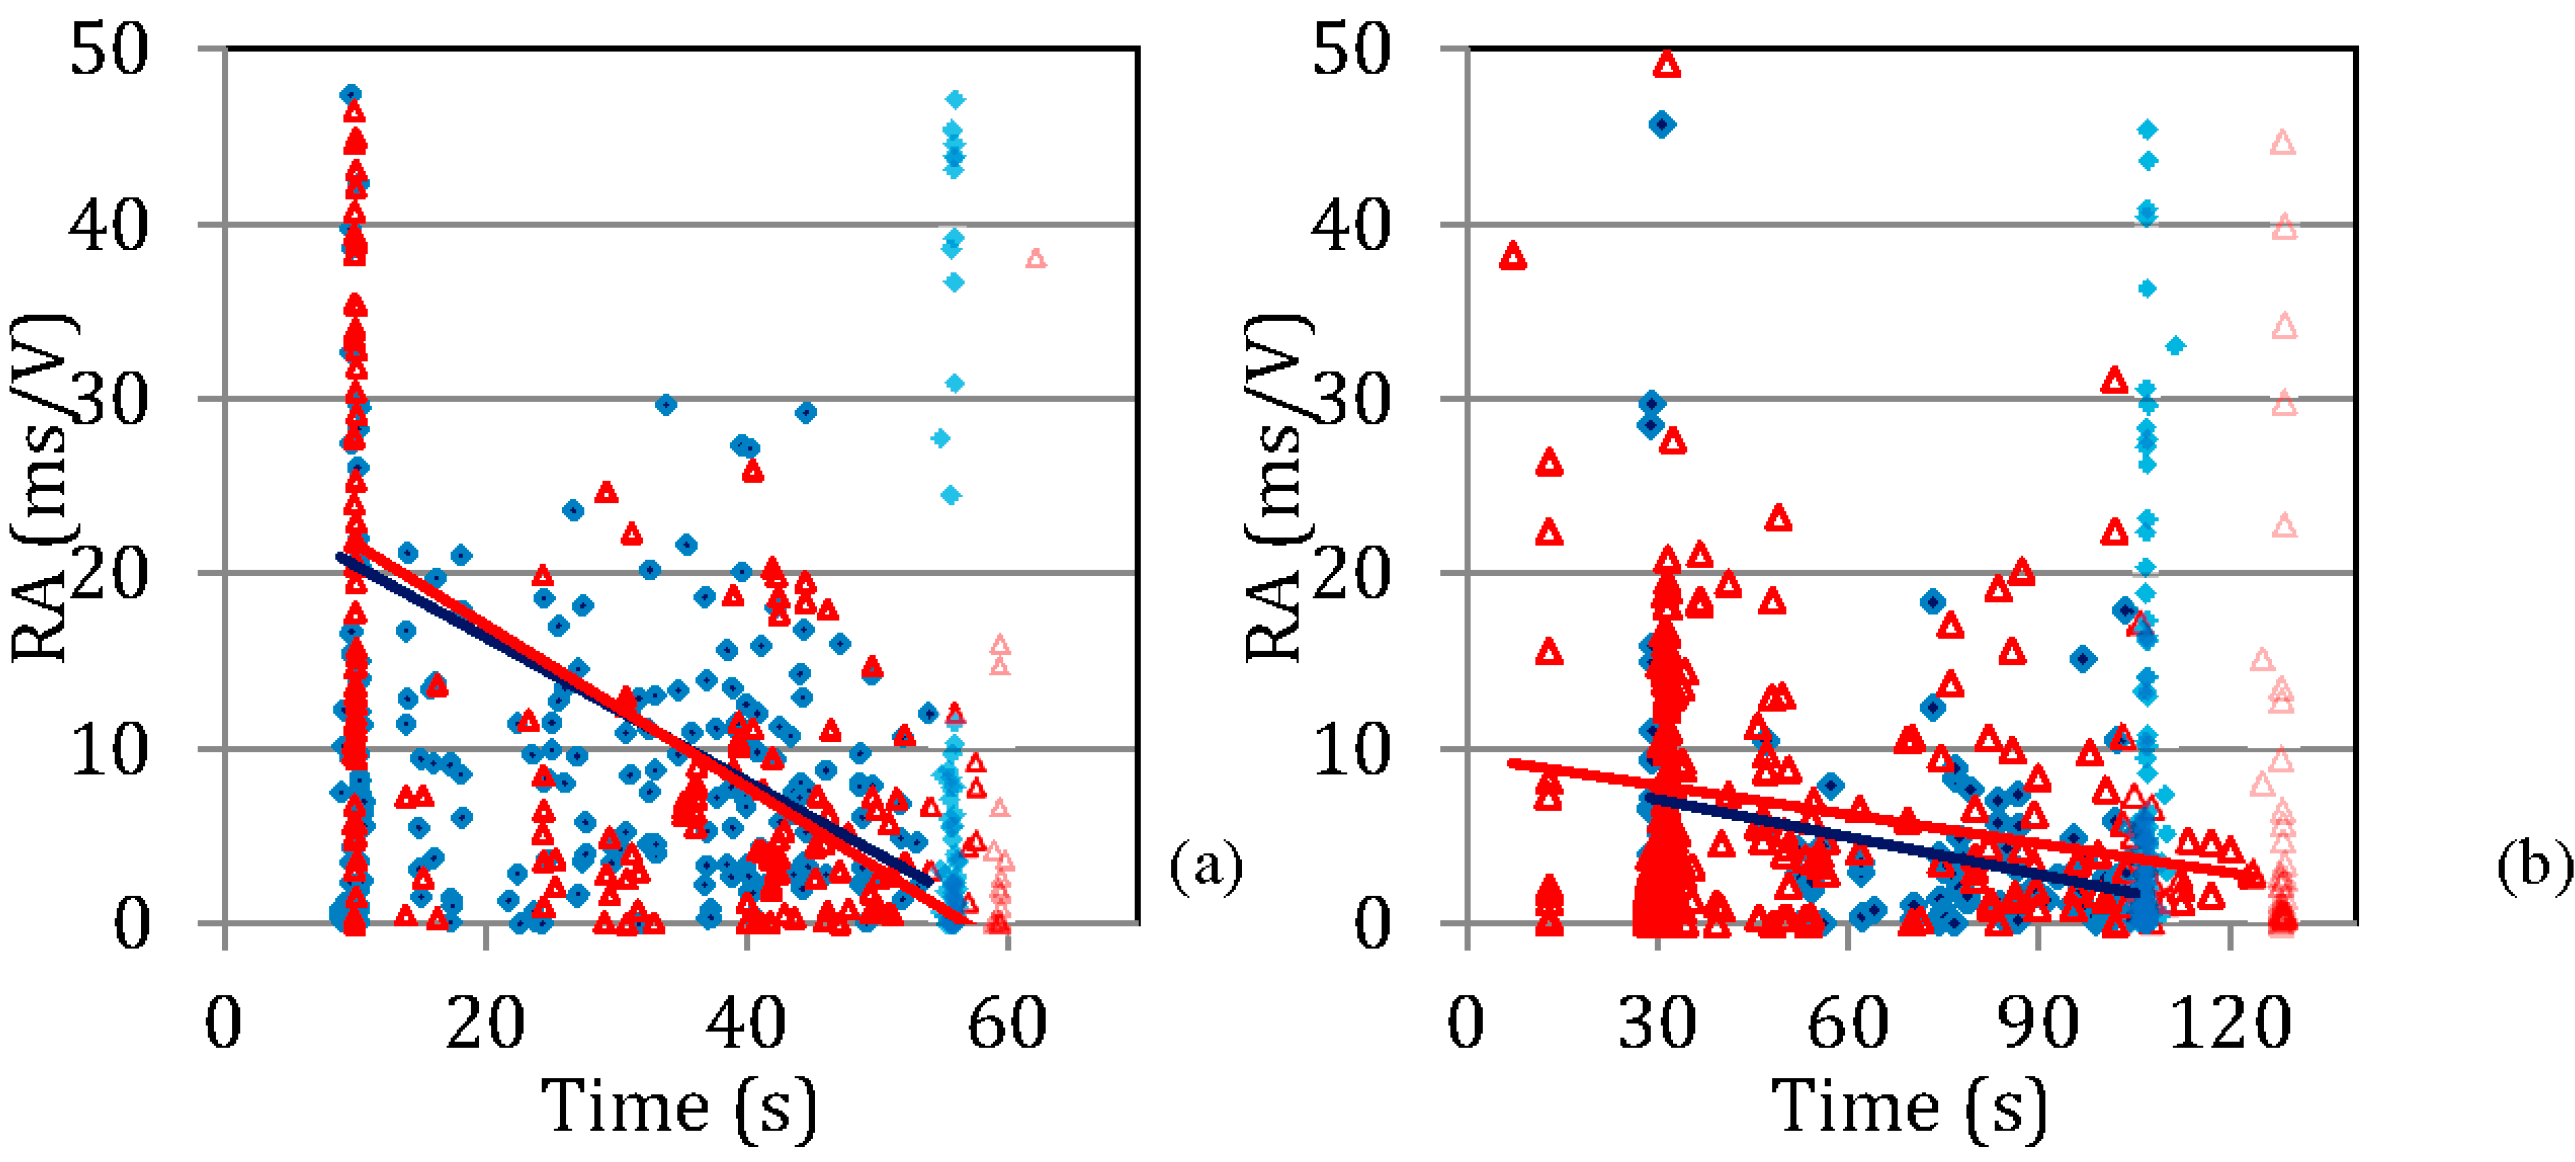
3.2. Acoustic Emission

Figure 7a,b show typical examples of cumulative AE activity as received by both sensors for marble type MA and MB, respectively. In all of the cases, three distinct stages of activity can be defined. At the start of the experiment a quite high rate of events is recorded (Stage A) followed by a long time window of moderate activity (Stage B). At the end and quite close to the macroscopic fracture of the material, the rate increases again (Stage C). Similar AE activity patterns have been seen recently in similar specimens during compression. The initial saturation was attributed to the depletion of a “weakpoint reservoir in the deforming material”, while the increase at the final stage was attributed to clustering of the individual defects due to decreased distance among the sources [12]. It seems that after application of load, formation of micro-cracks is quite fast. However, coalescence of them into larger ones that lead to final fracture takes more time and accumulated energy. This energy is released at the end with another “avalanche” like activity. Although the number of AE hits of Stage C are just a small fraction of the total activity, their energy is much higher.
Figure 7. Cumulative AE activity history for marble type (a) MA and (b) MB.
Applsci 06 00006 g007
The behavior of the different marble types was quite repeatable. Apart from the three indicative cases included in the figures, nearly all specimens exhibited the three stages of high, moderate and high activity again.
However, in addition to the total number of hits, high importance is carried by the AE waveform parameters. To give an idea of the transient changes of AE characteristics during loading, Figure 8 shows the RA values for two representative specimens of type MA marble (Figure 8a) and other two from type MB marble (Figure 8b). The data corresponding to the last Stage C are included in a transparent pattern since it is intended to focus on the behavior prior the macroscopic failure. It is obvious that the RA initial level is at much higher levels for type MA than type MB, since values up to 50 ms/V are quite frequent, while for MB specimens values are almost restricted below 30 ms/V. As loading continues high values become scarce resulting in a decreasing trend for RA for both types. At the end of Stage B, and just before the macroscopic failure, the RA values of both types of specimens seem to deepen below 10 ms/V. Concerning the whole population of specimens (more than 30), the average values are shown in Table 1.
Figure 8. RA values for two specimens of marble type (a) MA and (b) MB.
Applsci 06 00006 g008
Table 1. Results of the bending tests for two types of marble.
TypeMaximum Load (kN)UPV (m/s)Fracture StageRT (μs)ENE (-)DUR (μs)AMP (dB)AF (kHz)RA (μs/V)
MA2.304798A45510.91321.047.025.820305
B1677.9820.846.830.68222
C3808.71158.746.831.015829
MB5.086383A2318.6832.648.335.88452
B955.8508.347.941.04344
C96429.42904.550.738.222355
From the above table, a general conclusion is that the AE features differ for the successive stages. As an example, the rise time and duration of the second stages (Stage B) is clearly lower than the first (Stage A), while the final stage (Stage C) produces again higher values. Inversely, the frequency content as measured by AF increases for Stage B relative to Stage A. Duration of AE signals is related to the intensity of the source and it shows again the same transition as the total AE activity. It would be premature to interpret these fluctuations of AE parameters in terms of shift between shear and tensile phases, as it should be combined with the knowledge of the microstructure. However, this lowering of RA in the intermediate stage, follows the rate of damage accumulation, which is slower in Stage B, as revealed by the low AE activity rate denoting the creation of micro-cracks, the coalescence of which leads to the final fracture at Stage C.
Apart from the differences between the successive stages, there are considerable differences in between the different marble types. Type MB exhibits for the first two fracturing stages, AF higher by as much as 10 kHz than marble MA. This difference is quite high considering that it was recorded by resonant sensors. Correspondingly, it exhibits lower duration, RT and RA values. In addition, while MA exhibits lower RA values for the last stage, type MB exhibits a strong increase. These different trends are attributed to the different fracturing behavior of the two media since the specimen geometry and the whole experimental lay-out was constant. As aforementioned changes of RA are due to the fracture mode. Although the macroscopic stress field is similar, the microstructure of the different marbles may induce different motion of the crack tips strongly influencing the AE parameters received.
It has been seen that high RA values correspond to material closer to fracture while the inverse is measured for frequencies. The frequencies drop just before the final failure. It comes as no surprise therefore, that the material type with higher frequency and lower RA exhibited higher density and load bearing capacity. What should be stressed is that these differences are obvious from the initial fracture stage; MB exhibits 39% higher frequency and 58% lower RA allowing predictions as to the final capacity of the beams.
By separating the activity at the different stages we can study the AE activity at low, moderate and high load. Figure 9a shows the graph of AF vs. RA for the first stage of fracturing (Stage A) as explained in the previous section, while the corresponding graph of the intermediate Stage B is given in Figure 9b. The whole group of points extends from frequencies of approximately 20 kHz to 45 kHz and from RA values of 3 to 30 ms/V. However, it is important to notice that the type MB occupies most of the spots of higher frequency and low RA, while the two populations (MA and MB) could even be separated by a single line (see dashed diagonal line) having only three overlapping points. For the next Stage B of moderate activity, the whole population shifts to higher frequencies and lower RA values (see Figure 9b) but there is still a substantial difference of the centers of the two populations. Marble MB again exhibits higher frequencies and lower RA values and the separation line attains a much higher slope. The separation lines are certainly not unique and successful clustering could achieved by means of pattern recognition algorithms. However, this is left for the next stage, when larger populations will be examined.
Figure 9. Correlation plot between AF and RA for (a) the initial loading Stage A; (b) the intermediate loading Stage B; and (c) the final Stage C.
Applsci 06 00006 g009
Based on the AE activity of the preliminary loading stage it can be concluded that if the ratio of the average AF over RA is more than 1.67, the ultimate load will be higher than 4 kN (denoting type MB) while if it is lower the load capacity will be less than 3 kN (type MA). The importance of such a correlation lies in the fact that the strength capacity of the material can be assessed by a quite reliable way based on AE data resulted from loading the specimen, without however, inflicting any serious damage: the initial activity (Stage A) is recorded while the load is less than 10% of the ultimate.
Results are quite similar for the intermediate stage where the load is between 20% and 90%. The analogy between AF and RA now changes to 5.2 but again the separation with a straight line is similarly successful.
For the last stage of macroscopic fracture, the results are more mixed, showing that in macro-fracture the intensity of the phenomena “covers” delicate changes that are imposed by the microstructure (Figure 9c).

3.3. Behavior of Repaired Specimens

As aforementioned, the fractured specimens were repaired by means of adhesive epoxy, suitable for cultural heritage projects. In order to check the strength restoration they were tested again with the same bending setup. Their AE activity was once again monitored. Table 2 shows the average value of maximum load for both repaired marble types. The maximum load is approximately 1.63 kN and 2.46 kN for types MA and MB, respectively, corresponding to 70% and 48% of their original strengths. The marble with higher original strength (MB type) exhibited the higher capacity even after repair, although it suffered larger loss as a percentage of the original strength.
Table 2. Results of the bending tests for two types of repaired marble (reloading).
Marble TypeMaximum Load (kN)UPV * (m/s)Fracture StageRT (μs)ENE (-)DUR (μs)AMP (dB)AF (kHz)RA (ms/V)
MA1.634798A1465.662947.6387.33
B614.641648.143.92.93
C37215.2115349.536.79.45
MB2.466383A1797.274048.837.25.60
B714.545447.639.93.07
C34416.4102250.943.99.08
* UPV was measured before fracture.
Compared to the nearly uniform behavior of the sound specimens, the AE behavior of the repaired MA type specimens showed mixed trends. Most of the specimens (20 out of 33) followed a similar behavior to the sound (first loading) with the same stages (high initial rate-plateau-high final rate) but the rest of the specimens exhibited a more random behavior where the specific stages could not be defined. Examples are seen in Figure 10a,b for the aforementioned cases. The absence of fracture stages can be attributed to the inefficient interfacial bonding between the marble and the epoxy.
Figure 10. (a) Cumulative AE history for repaired MA specimens following three stages. (b) Cumulative AE history for repaired MA specimens without similar three stages.
Applsci 06 00006 g010
Table 3 shows the average values of ultimate load and reload for the specimens of marble MA that exhibited the three stages at the reloading (20 specimens), the specimens with random behavior (13 specimens) as well as the average of the whole population (33 specimens). It also includes the repair factor (n) as the ratio of ultimate load of the repaired to the initial load of the intact specimens.
Table 3. Results of the bending tests for MA type of repaired marble.
MAMaximum Load (kN)UPV * (m/s)Maximum Load(REP) (kN)n = Load(REP)/Load (-)
no stages in AE2.2447131.460.66
3 stages in AE2.3348461.750.76
total2.3047981.630.72
* UPV was measured before fracture.
It is worth noticing that the specimens that during reloading followed a behavior similar to the initial loading exhibit substantially higher repaired load. Specifically this group of specimens exhibited an average maximum load of 1.75 kN substantially higher than the group of the random behavior (1.46 kN). This shows that the bonding was of better quality and therefore the structural capacity, the fracture process and as a result the AE behavior was closer to the behavior of the intact material achieving a restoration factor of 76% which is quite high for similar cases [24].
Concerning type MB, nearly all specimens (38 out of 40) behaved similarly to the sound specimens. This has to be related to the bond between the epoxy and the matrix. For the case of MB, the epoxy and its bond to the marble works well and results in the same behavior like the initial monolithic material. This is confirmed by the maximum load after repair.
Additionally, a general observation is that the plateaus (silent periods) are longer for the repaired specimens, while stage B is characterized by lower AE rate than the initial loading. Specifically Stage B exhibits an activity of 3.3 hits/s for marble MA and 2.2. hits/s for marble MB. For the repaired version of the same specimens, the corresponding rates was negligible with only sparse AE hits for Stage B (check again Figure 10a). This lower activity (and the longer plateaus in the beginning of the test) can be attributed to the lower elasticity of epoxy. The stiffness of this layer is much lower than marble, allowing it to deform without cracking for longer period than marble. Therefore, it withstands the imposed deflection with limited AE. Additionally it has been seen that the type of epoxy may influence this behavior. In recent experiments in concrete repaired by flexible healing agent, the AE development was smooth since the bonding took place in small and frequent events. On the other hand, rigid epoxy follows a slightly different trend by fewer but larger debonding events [24].
Excluding the specimens that exhibited random behavior (13 of type MA and two of type MB) one can again separate the AE behavior in the successive stages. Results are included in Table 2 above. It is evident that the parameter values are much closer between the different marble types for each stage. For the first stage received at low load, average frequencies are almost identical and RA values are very close. It should be recalled that in the first loading, marble MB exhibited 39% higher frequency, while the RA value of B was 58% lower than MA (see Table 1). Now these differences are nearly eliminated; frequencies are essentially the same and the average RA of MB is only 23% lower than MA. Differences in rise time and duration are similarly compressed. The AE parameters show indeed that in the repaired specimens, the importance lies primarily in the bonding between epoxy matrix and less in the marble itself. The difference of 23% in RA although may seem substantial, does not allow successful separation of the two classes, due to the overlap. Indeed in AE, the experimental scatter of the parameter values is high and a difference between averages of the order of 20% of even 50% is not enough to separate different populations [25]. However, it can still be seen that type MA with higher RA value in the preliminary stage of loading exhibited lower maximum load. Therefore, there is certainly potential in the study of AE in the repaired specimens as to predict the final behavior. It should be kept in mind that it is possible to apply pattern recognition combining not only two but many features which offer the highest characterization capacity or even apply principal component analysis.

4. Discussion

The reason why AE inspection acquires even more significance is that ultrasound cannot reliably assess the condition of the repaired specimen. As shown in Figure 4, the nominal wave path is 160 mm. In the repaired material, the layer of epoxy resin is approximately 1 mm corresponding to less than 1% of the total. Therefore, the stiffest marble (in this case type MB) would always exhibit much higher velocities and the sensitivity to the epoxy layer and its adhesion to the matrix would be negligible. Despite the fact that ultrasound shows very good correlation to the material properties and the final strength, it would not be possible to characterize by the same test the capacity of the repaired specimens.
It should also be mentioned that although AE gets signals from fracturing of the material it is not necessarily “close to failure”, as micro-cracking activity is induced very early in the loading. There are several other examples in literature where AE starts in a small fraction of the ultimate load [7,11,12,25,26]. Therefore, AE can be used in the concept of “proof loading”. This kind of test is a usual application in different types of structures (e.g., pressure vessels). The structure is loaded up to a safety point and the AE is monitored. According to the received AE the structure can be categorized either as safe for continuous use, as safe for a period of time before another monitoring, or unfit and should be replaced. AE, due to the sensitivity of the sensors records the very early fracturing incidents in the micro-scale before the structural capacity of the member/specimen is compromised. In the specific case, the loading rate was constant. Taking into account the accumulated AE activity for marble MA, the initial AE stage is completed well before 15 or 20 s in a total of 50 to 60 s until fracture (check Figure 7a). This means that the load until that moment was approximately one-third of the maximum load. For marble MB, the initial activity (first stage) was completed at about 30 s while the duration of the loading until fracture was more than 100 s (Figure 7b). Again this means that the loading for the first AE stage is well below one-third of the maximum. Therefore, it can be supported that the AE data used for correlation with the final load capacity, as presented in Figure 9a correspond to a stage when the material is still macroscopically intact since the load was about 30% of the ultimate. For the repaired specimen, the initial stage of AE represents approximately half the duration of the experiment, so we can say that the “early” AE data were recorded until 50% of the capacity (Figure 10a). After the initial stage, the specimen continued to receive increasing load within a period of acoustic silence before it was fractured 20 to 40 s later. Therefore, it can again be argued that the early loading did not effectively compromise the load bearing capacity of the specimens.
Concerning the localization of the AE sources, the present setting with two sensors enables only linear location. More sensors would not add much to the accuracy of the AE events. This is because the accuracy is compromised by different factors. The specific type of sensors is widely applied in practice due to their high sensitivity but on the other hand they are far from being considered point sensors, as their diameter is approximately 16 mm. This is comparable to the propagation distance between the crack (middle of specimen) and the 1st sensor and also comparable to the specimen dimensions (thickness of 40 mm). Therefore, AE location would enable to separate events that occurred centimeters away but within a single damage zone it would be troublesome to make more accurate statements. As an example, in our study the thickness of the epoxy in the repaired specimens is approximately 1 mm. AE location results would not be reliable enough to check if an event occurred within this mm (crack in epoxy) or 0.5 mm to the right or left (marble crack), as the typical error is certainly higher. In addition to the above mentioned geometry reasons, the heterogeneity of the material should be kept in mind that creates a variation in the pulse velocity and further compromises the accuracy. Therefore, in the specific case, AE location could not be used to clarify the exact point of the fracture and specifically discriminate between fracture in the epoxy or in the marble matrix.

5. Conclusions

The present paper occupies mainly with the AE behavior of large populations of two marble types under bending and the repair efficiency as tested by a second loading after application of adhesive epoxy. The main conclusions of the work are summarized below:
i)
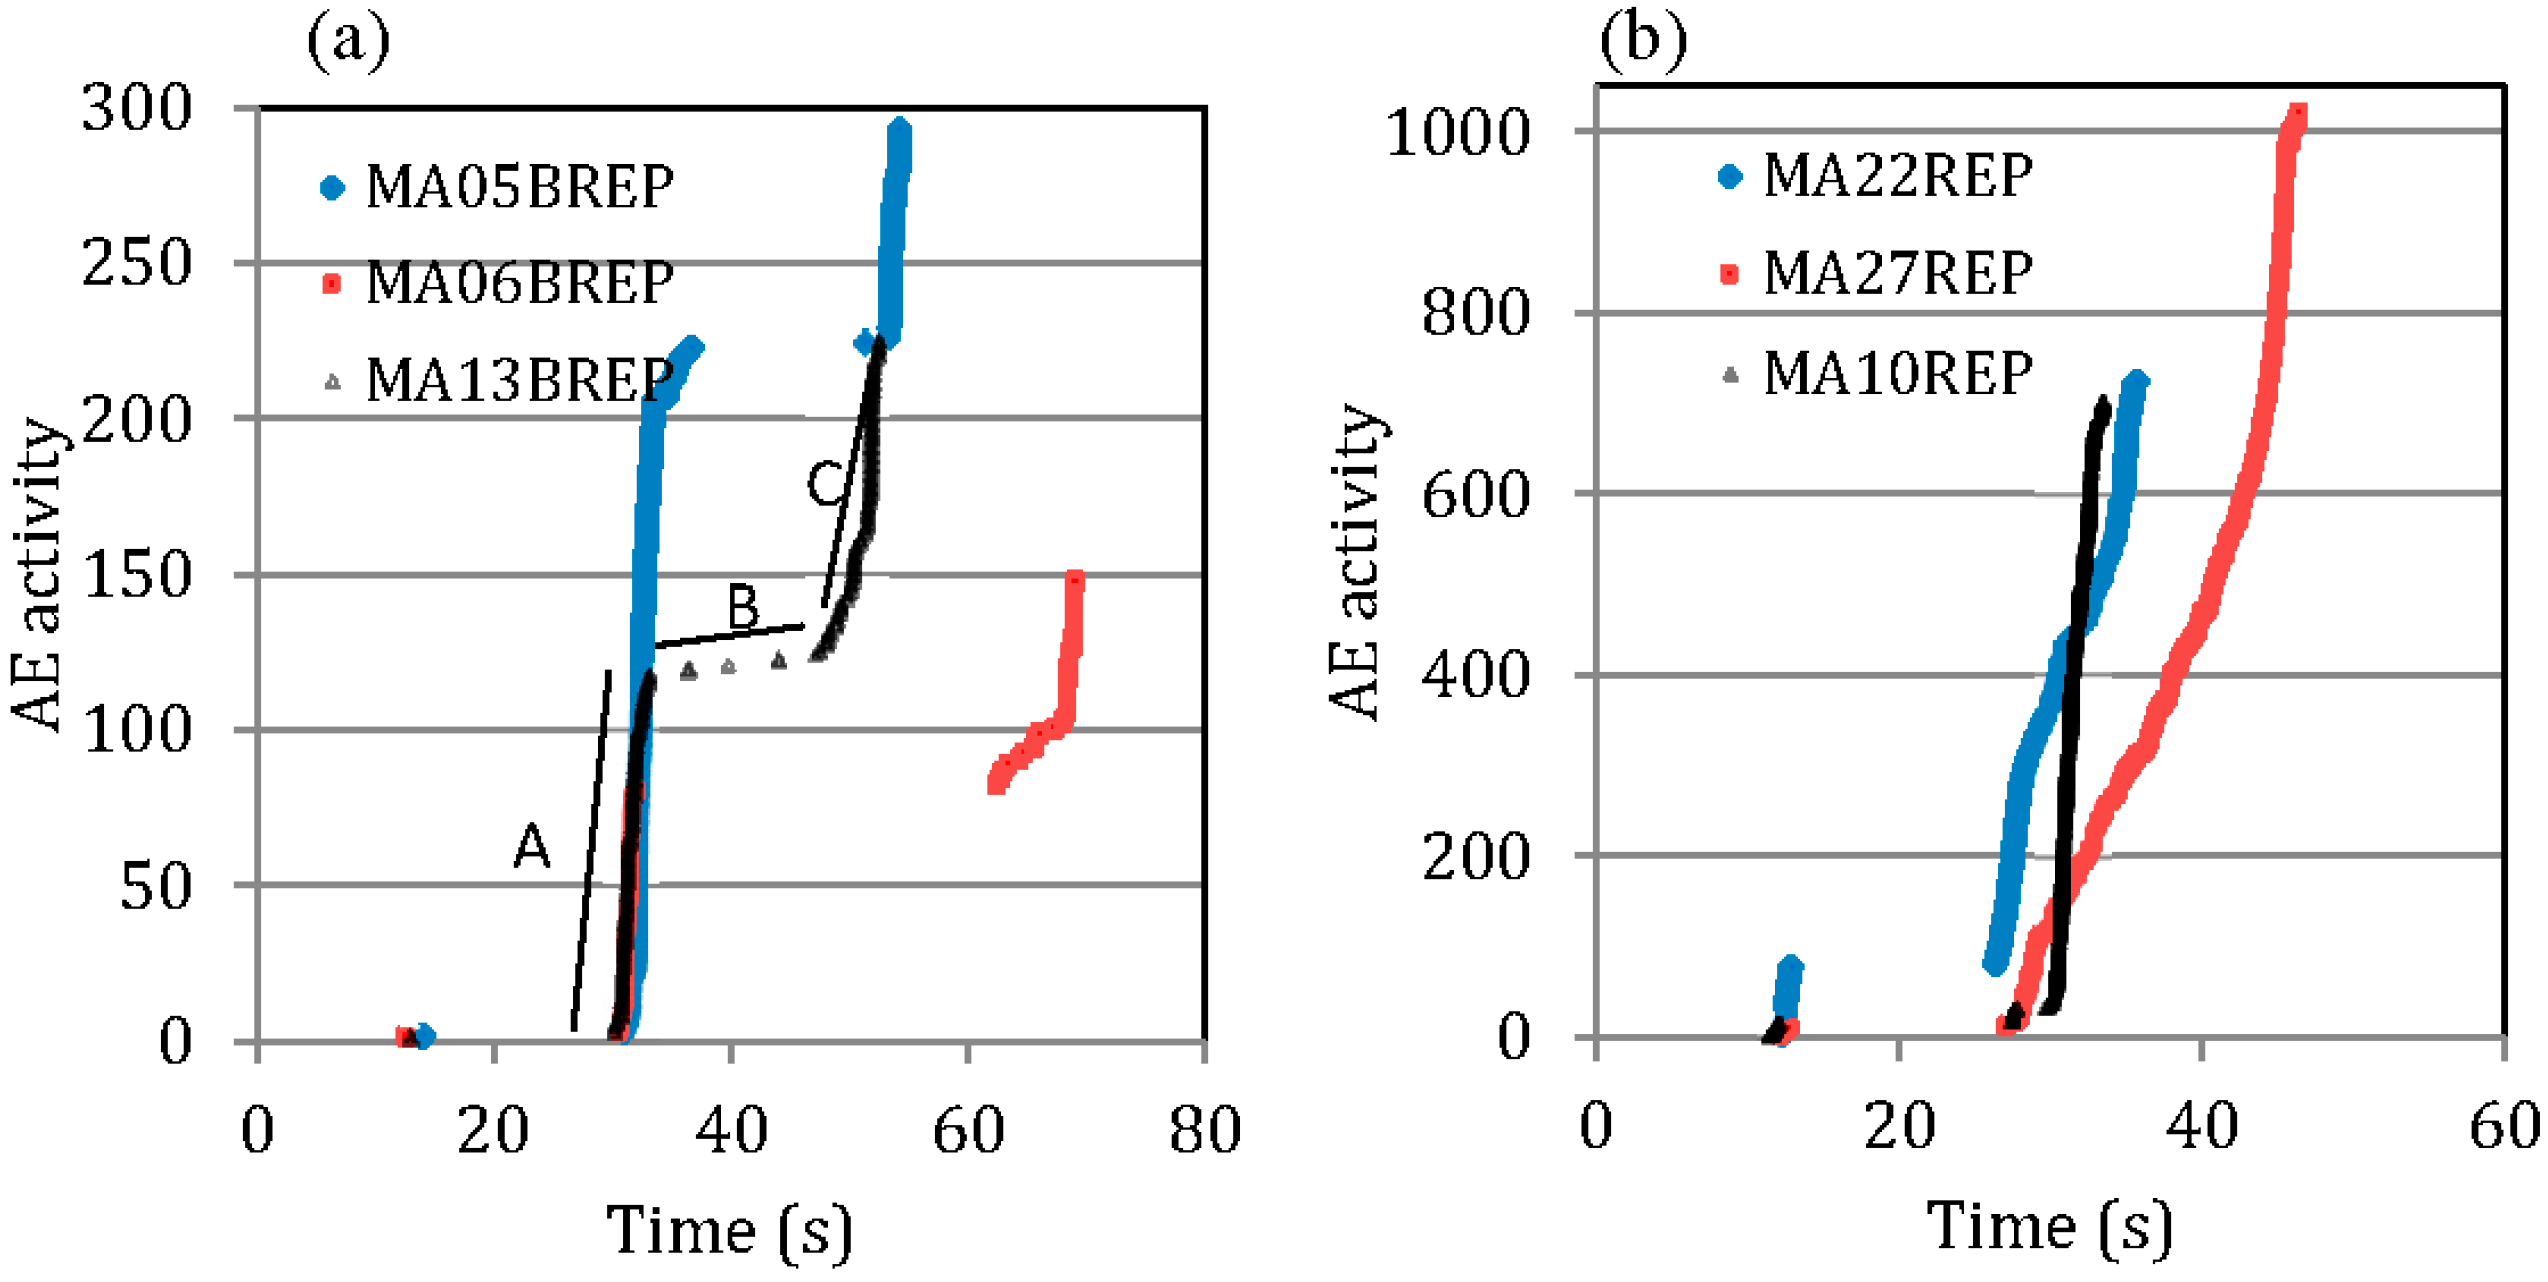
The fracture of the material follows three successive stages of high, low and high AE activity.
ii)
The AE parameters at each stage vary showing that the fracture pattern changes throughout the damage process even though the macroscopic failure of both marble types is derived from the same three-point bending setup.
iii)
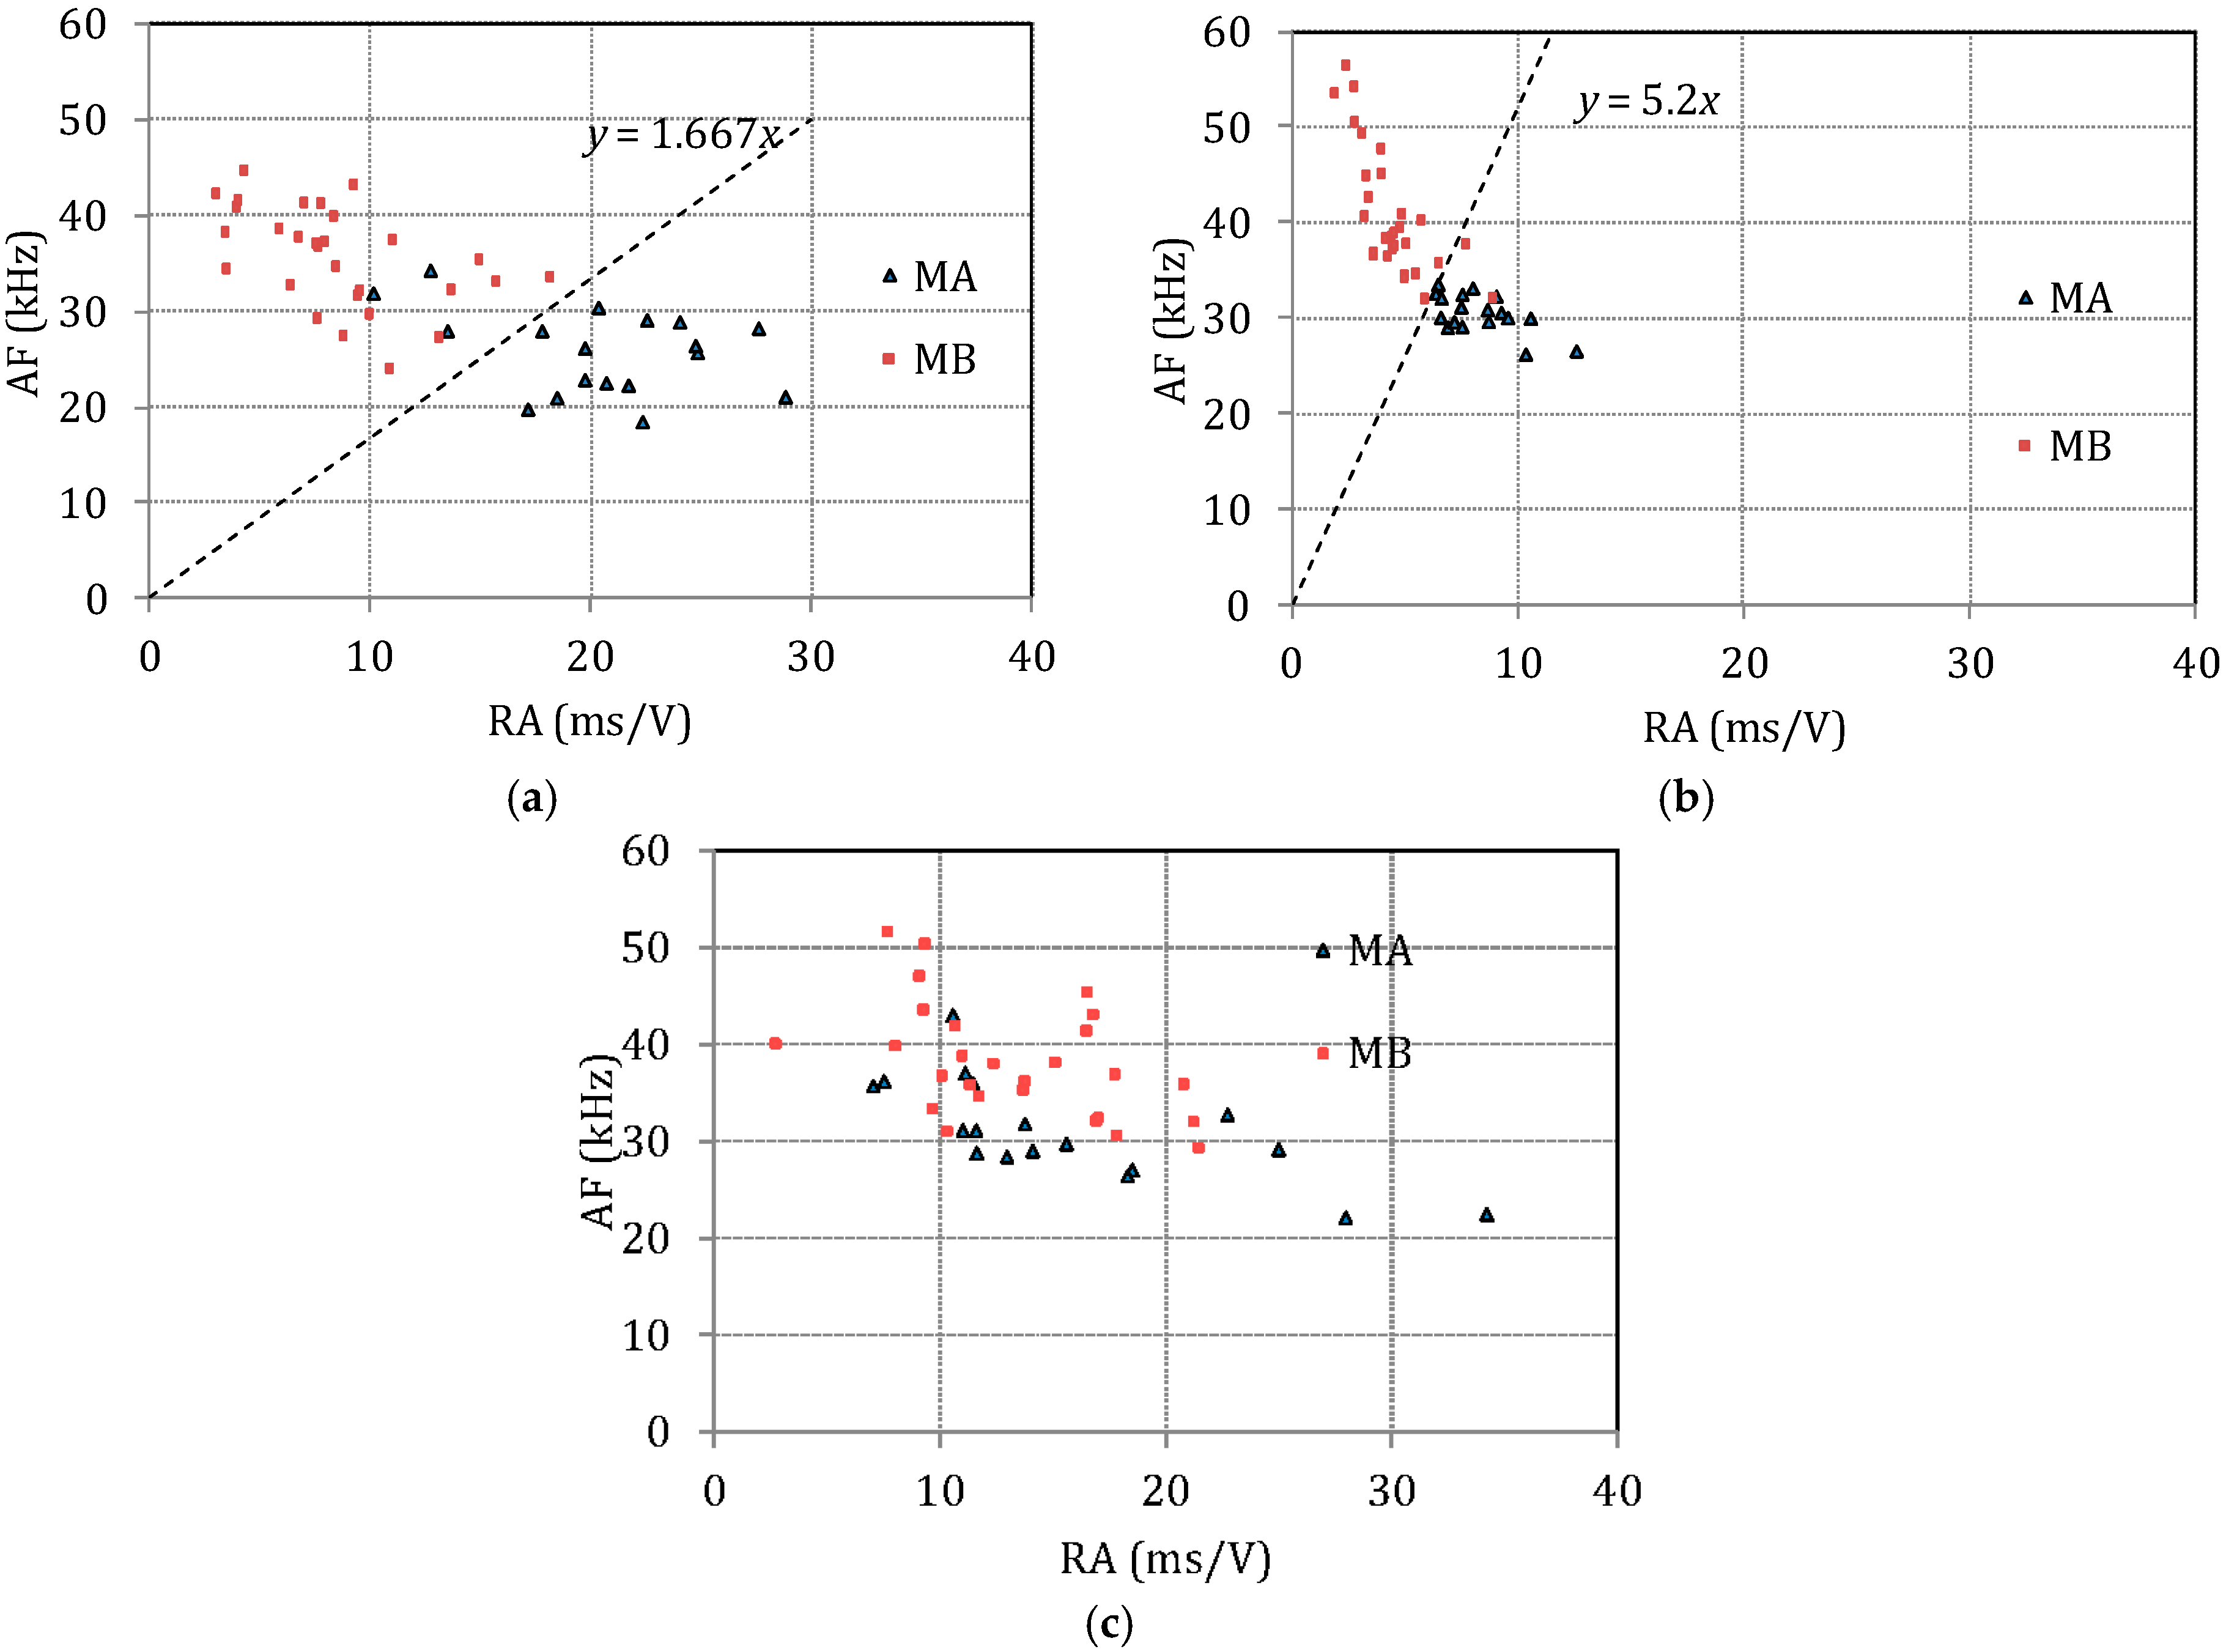
Different marble types exhibit fairly different behavior, even from the initial stage of loading. Based on AE parameters from the early stage (AF and RA), an almost complete separation of the two populations (high and low strength) is possible, allowing the prediction of the strength group that each specimen belongs.
iv)
Repaired specimen with adhesive epoxy exhibited a restoration of flexural strength between 50% and 75% depending on the bonding efficiency.
v)
The repaired specimens, which followed AE behavior similar to the intact ones (same three distinct fracture stages), exhibited much higher strength restoration (20% higher ultimate load at the test after repair), something attributed to the good adhesion that dictates the specimens to fracture similar to the intact ones.
Study should continue with different fracture modes apart from bending, as well as with other natural stones like granite (different morphology, greater flexural strength and density than marble). In addition, pattern recognition approaches should be applied in order to achieve even better characterization or classification of the different AE populations.

Author Contributions

All authors contributed to the work presented in this paper, and to the writing of the final manuscript. E.T. contributed to the data analysis. D.G.A. was responsible for the ultrasonic experiment and the analysis of the data. T.E.M. provided discussion on the testing procedure and the results. A.M. organized the study and was responsible for the mechanical testing and AE monitoring.

Conflicts of Interest

The authors declare no conflict of interest.

References

  1. Grosse, C.U.; Ohtsu, M. Acoustic Emission Testing; Springer: Berlin, Germay, 2008. [Google Scholar]
  2. Zitto, M.E.; Piotrkowski, R.; Gallego, A.; Sagasta, F.; Benavent-Climent, A. Damage assessed by wavelet scale bands and b-value in dynamical tests of a reinforced concrete slab monitored with acoustic emission. Mech. Syst. Signal Process. 2015, 60, 75–89. [Google Scholar] [CrossRef]
  3. Shiotani, T.; Oshima, Y.; Goto, M.; Momoki, S. Temporal and spatial evaluation of grout failure process with PC cable breakage by means of acoustic emission. Constr. Build. Mater. 2013, 48, 1286–1292. [Google Scholar] [CrossRef]
  4. Carpinteri, A.; Lacidogna, G.; Accornero, F.; Mpalaskas, A.C.; Matikas, T.E.; Aggelis, D.G. Influence of damage in the acoustic emission parameters. Cem. Concr. Compos. 2013, 44, 9–16. [Google Scholar] [CrossRef]
  5. Li, Y.; Chen, L.; Wang, Y. Experimental research on pre-cracked marble under compression. Int. J. Solids Struct. 2005, 42, 2505–2516. [Google Scholar] [CrossRef]
  6. Chen, L.; Wang, C.P.; Liu, J.F.; Liu, Y.M.; Liu, J.; Su, R.; Wang, J. A damage-mechanism-based creep model considering temperature effect in granite. Mech. Res. Commun. 2014, 56, 76–82. [Google Scholar] [CrossRef]
  7. Zhang, Z.; Zhang, R.; Xie, H.; Liu, J.; Were, P. Differences in the acoustic emission characteristics of rock salt compared with granite and marble during the damage evolution process. Environ. Earth Sci. 2015, 73, 6987–6999. [Google Scholar] [CrossRef]
  8. Zhang, L.; Ren, M.; Ma, S.; Wang, Z.; Wang, J. Acoustic emission and fractal characteristics of marble during unloading failure process. Chin. J. Rock Mech. Eng. 2015, 34, 2862–2867. [Google Scholar]
  9. Fu, X.; Xie, Q.; Liang, L. Comparison of the Kaiser effect in marble under tensile stresses between the Brazilian and bending tests. Bull. Eng. Geol. Environ. 2015, 74, 535–543. [Google Scholar] [CrossRef]
  10. Yin, L.J.; Gong, Q.M.; Ma, H.S.; Zhao, J.; Zhao, X.B. Use of indentation tests to study the influence of confining stress on rock fragmentation by a TBM cutter. Int. J. Rock Mech. Min. Sci. 2014, 72, 261–276. [Google Scholar] [CrossRef]
  11. Carpinteri, A.; Corrado, M.; Lacidogna, G. Heterogeneous materials in compression: Correlations between absorbed, released and acoustic emission energies. Eng. Fail. Anal. 2013, 33, 236–250. [Google Scholar] [CrossRef]
  12. Chmel, A.; Shcherbakov, I. A comparative acoustic emission study of compression and impact fracture in granite. Int. J. Rock Mech. Min. Sci. 2013, 64, 56–59. [Google Scholar] [CrossRef]
  13. Chen, G.-F.; Yang, S.-Q. Study on failure mechanical behavior of marble after high temperature. Eng. Mech. 2014, 31, 189–196. [Google Scholar] [CrossRef]
  14. Prassianakis, I.N.; Prassianakis, N.I. Ultrasonic testing of non-metallic materials: concrete and marble. Theor. Appl. Fract. Mech. 2004, 42, 191–198. [Google Scholar] [CrossRef]
  15. Sarpun, H.; Kilickaya, M.S.; Tuncel, S. Mean grain size determination in marbles by ultrasonic velocity techniques. NDT E Int. 2005, 38, 21–25. [Google Scholar] [CrossRef]
  16. Sáez-Pérez, M.P.; Rodríguez-Gordillo, J. Structural and compositional anisotropy in Macael marble (Spain) by ultrasonic, XRD and optical microscopy methods. Constr. Build. Mater. 2009, 23, 2121–2126. [Google Scholar] [CrossRef]
  17. Vasconcelos, G.; Lourenco, P.B.; Alves, C.A.S.; Pamplona, J. Ultrasonic evaluation of the physical and mechanical properties of granites. Ultrasonics 2008, 48, 453–466. [Google Scholar] [CrossRef] [PubMed]
  18. Aggelis, D.G.; Mpalaskas, A.C.; Matikas, T.E. Acoustic signature of different fracture modes in marble and cementitious materials under flexural load. Mech. Res. Commun. 2013, 47, 39–43. [Google Scholar] [CrossRef]
  19. Mpalaskas, A.C.; Matikas, T.E.; van Hemelrijck, D.; Iliopoulos, S.; Papakitsos, G.S.; Aggelis, D.G. Acoustic signatures of different damage modes in plain and repaired granite specimens. In Proceedings of the SPIE—The International Society for Optical Engineering, San Diego, CA, USA, 9–11 March 2015.
  20. Skandalis marbles. Available online: http://www.skandalis.gr/el/products/marbles.html (accessed on 19 December 2015).
  21. Neotex, S.A. Technical Data Sheet. Available online: http://www.neotex.gr/frontoffice/portal.asp?cpage=NODE&cnode=122&clang=1 (accessed on 15 December 2015).
  22. Naik, T.R.; Malhotra, V.M.; Popovics, J.S. The Ultrasonic Pulse Velocity Method. In CRC Handbook of Nondestructive Testing of Concrete; Malhotra, V.M., Carino, N.J., Eds.; CRC: Boca Raton, FL, USA, 2004. [Google Scholar]
  23. Kourkoulis, S.K.; Prassianakis, I.; Agioutantis, Z.; Exadaktylos, G.E. Reliability assessment of the NDT results for the internal damage of marble specimens. Int. J. Mater. Prod. Technol. 2006, 26, 35–56. [Google Scholar] [CrossRef]
  24. Tsangouri, E. Experimental Assessment of Fracture and Autonomous Healing of Concrete and Polymer Systems. Ph.D. Thesis, MEMC-Vrije Universiteit Brussel, Brussel, Belgium, 2015. [Google Scholar]
  25. Aggelis, D.G.; Verbruggen, S.; Tsangouri, E.; Tysmans, T.; van Hemelrijck, D. Characterization of mechanical performance of concrete beams with external reinforcement by acoustic emission and digital image correlation. Constr. Build. Mater. 2013, 47, 1037–1045. [Google Scholar] [CrossRef]
  26. Lockner, D. The role of acoustic emission in the study of rock fracture. Int. J. Rock Mech. Min. Sci. Geomech. Abstr. 1993, 30, 883–889. [Google Scholar] [CrossRef]

