1. Introduction
A new method to evaluate seismic risk in regional areas is proposed as an attempt to preserve Italian historical and architectural cultural heritage. To this purpose, the spatial and temporal correlations between the acoustic emission (AE) data obtained from the monitoring sites and the earthquakes that have occurred in specific ranges of time and space are examined.
The predictive power and the non-invasive procedure of the AE technique (no external excitation is provided, since the source of energy is the damage process itself) can be exploited to preserve Italian cultural heritage, as historic buildings and monuments are exposed to seismic risk and, in general, to severe, long-term, cyclic loading conditions or harsh environmental conditions.
Buildings and structures exposed to the action of earthquakes with moderate magnitude, which are rather frequent in the central and southern regions of Italy, may undergo accelerated aging and deterioration. Such damage processes, often inaccessible to visual inspection, eventually lead to an increased vulnerability to the actions of major earthquakes, with catastrophic results [
1].
The two regions considered in this paper surround the Italian cities of Varallo and Bologna, where the authors have recently carried out AE monitoring of important historical monuments for structural stability assessment. In particular, in the Italian Renaissance Architectural Complex of “The Sacred Mountain of Varallo” the structure of the Chapel XVII was analyzed, while in the City of Bologna the stability of the “Asinelli Tower”, known as the highest leaning tower in Italy, was evaluated [
2,
3].
According to seismic analysis, several studies investigated spatial and temporal correlations of earthquake epicenters, involving, for example, the concepts of Omori’s Law and fractal dimensions [
4,
5,
6]. Other authors tried to study the complex phenomenon of seismicity using an approach that is able to analyze the spatial location and time occurrence in a combined way, without subjective a priori choices [
7]. The present approach leads to a self-consistent analysis and visualization of both spatial and temporal correlations based on the definition of correlation integral [
8].
Based on these considerations, we have tried not only to analyze the seismic activity in the considered regions, but also to correlate it with the AE activity detected during the structural monitoring. By adopting a modified Grassberger-Procaccia algorithm, we give the cumulative probability of the events’ occurrence in a specific area, considering the AE records and the seismic events during the same period of time. In the modified integral the cumulative probabilities
C (
r, τ) are the function of the regional radius of interest,
r, and of the time interval, τ, both considering the peak of AEs as earthquake “precursors” or “aftershocks” [
9].
2. Description of Chapel XVII and Asinelli Tower
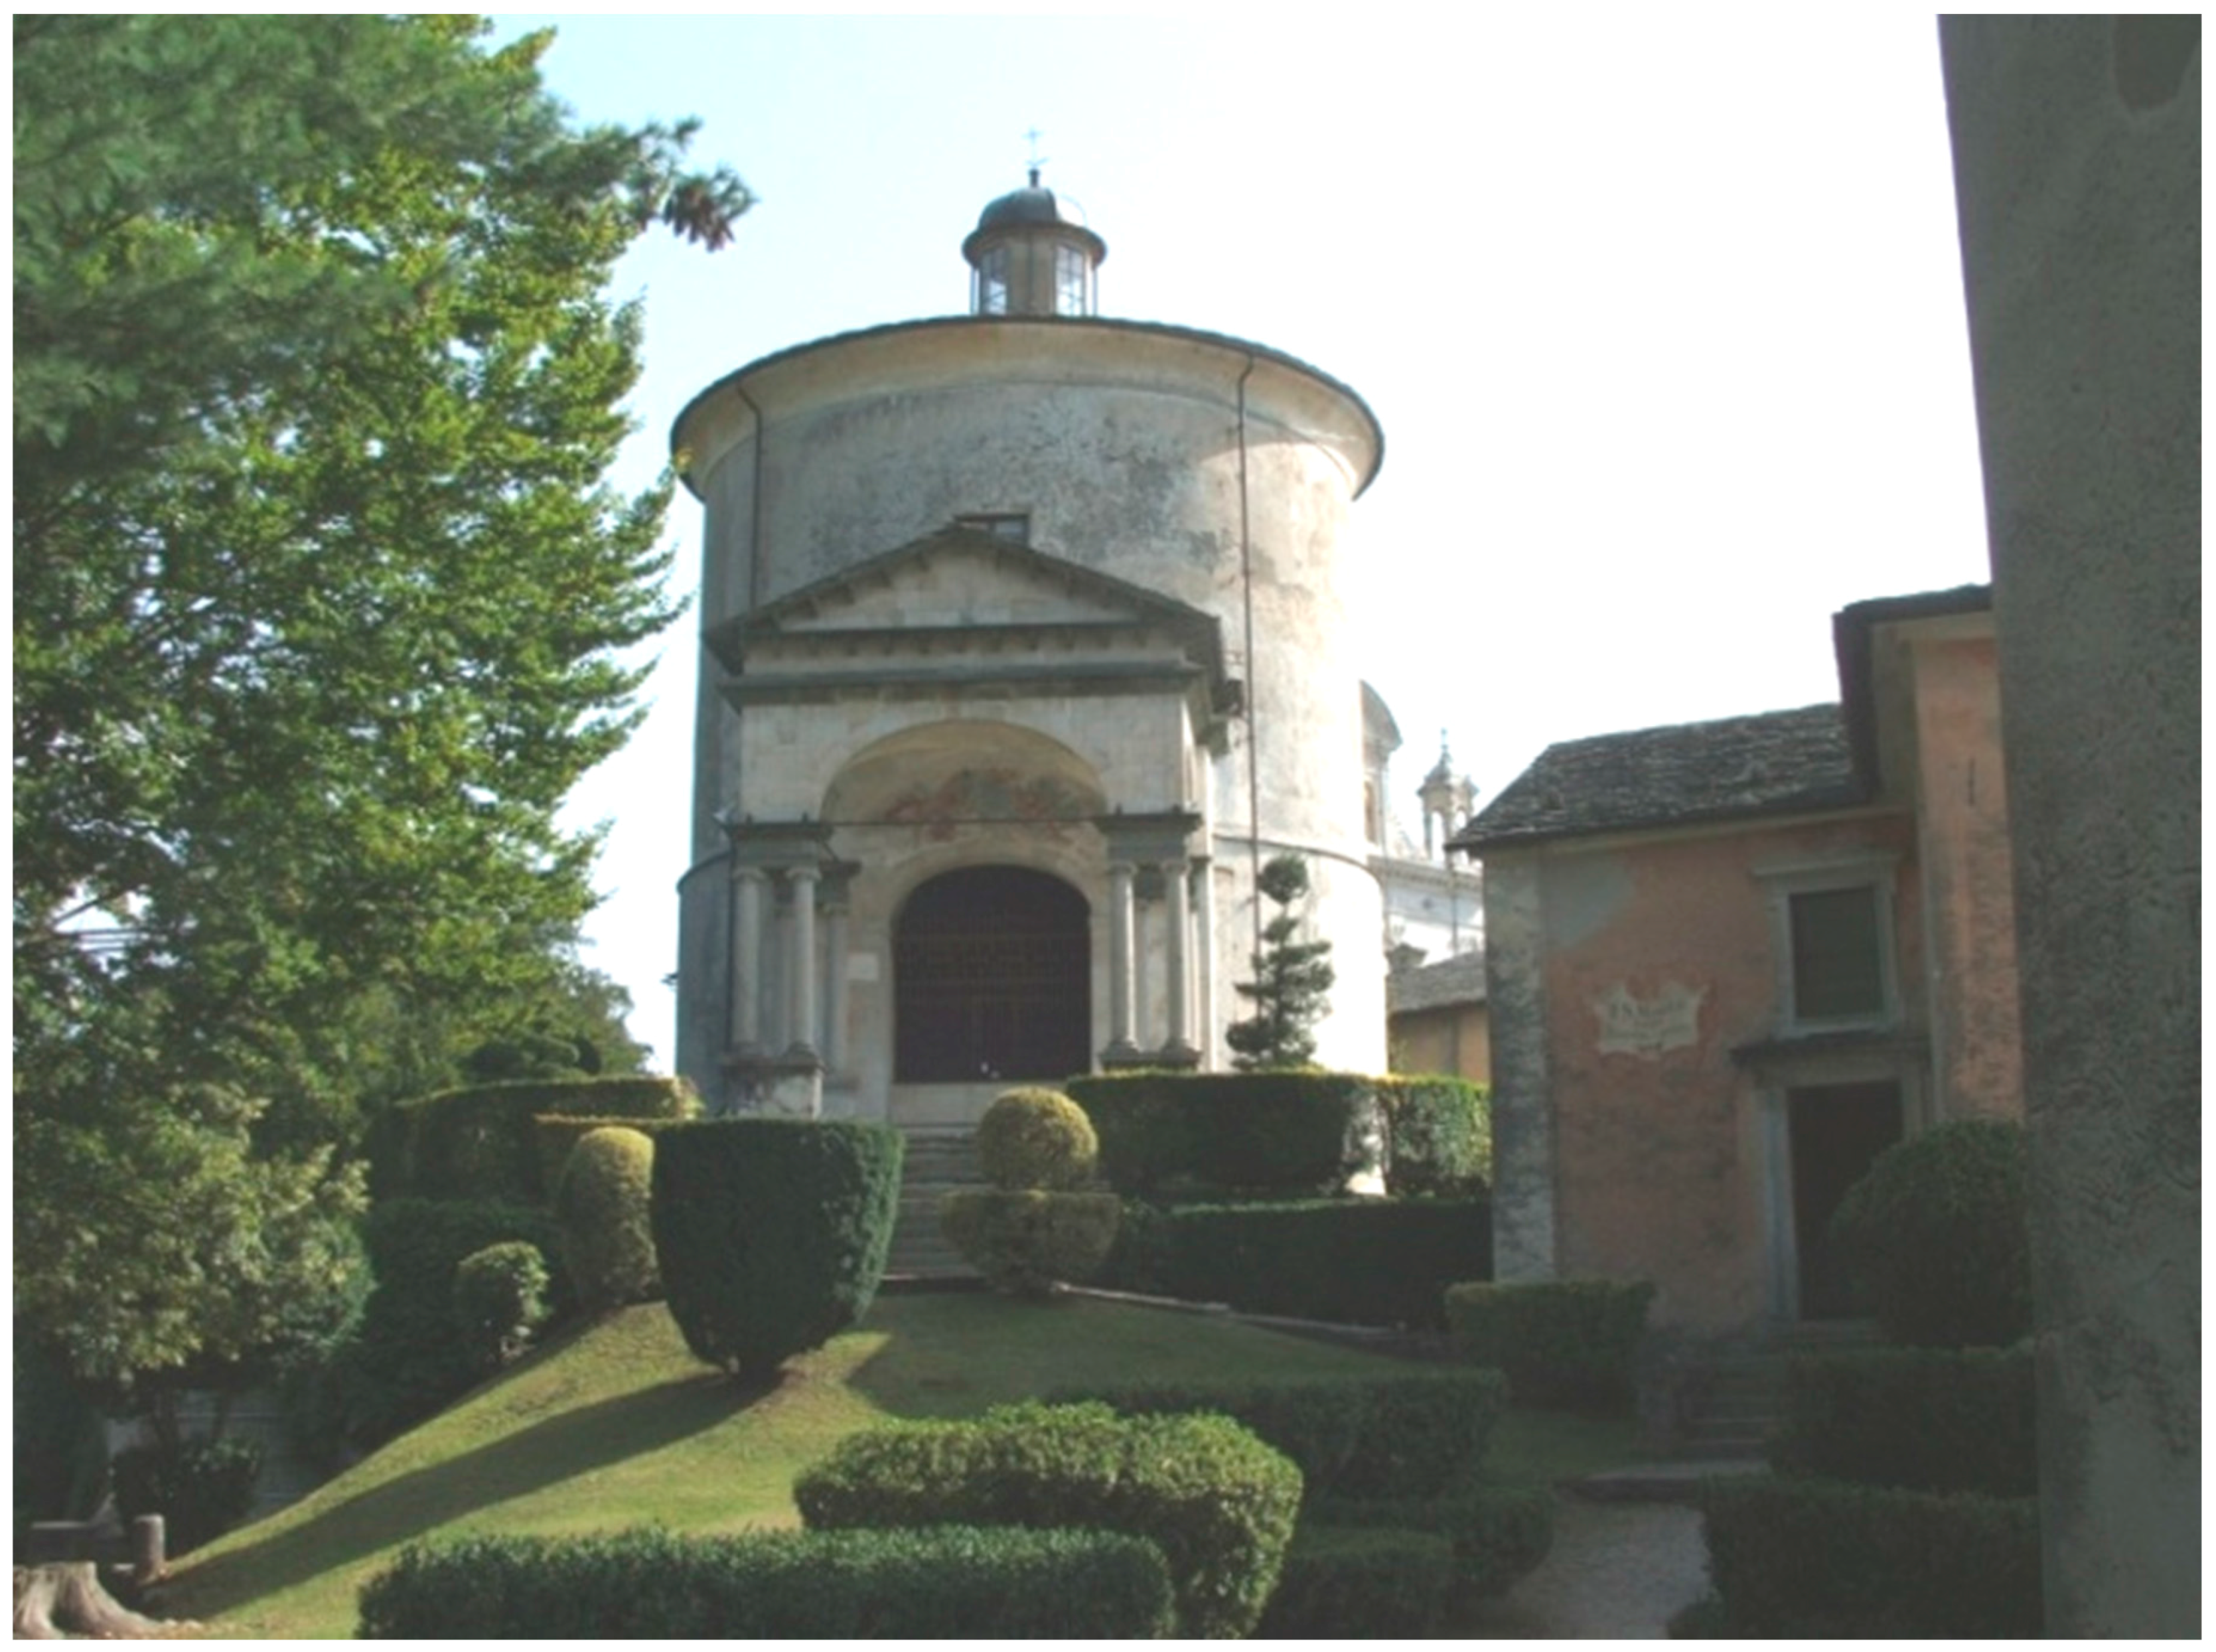
In Varallo, placed in Piedmont in the province of Vercelli, there is the relevant Italian Renaissance Architectural Complex named “The Sacred Mountain of Varallo”. It was built in the 15th century on a cliff above the town of Varallo and is composed of a basilica and 45 chapels.
Because of its high level of damage due to regional earthquakes that have occurred [
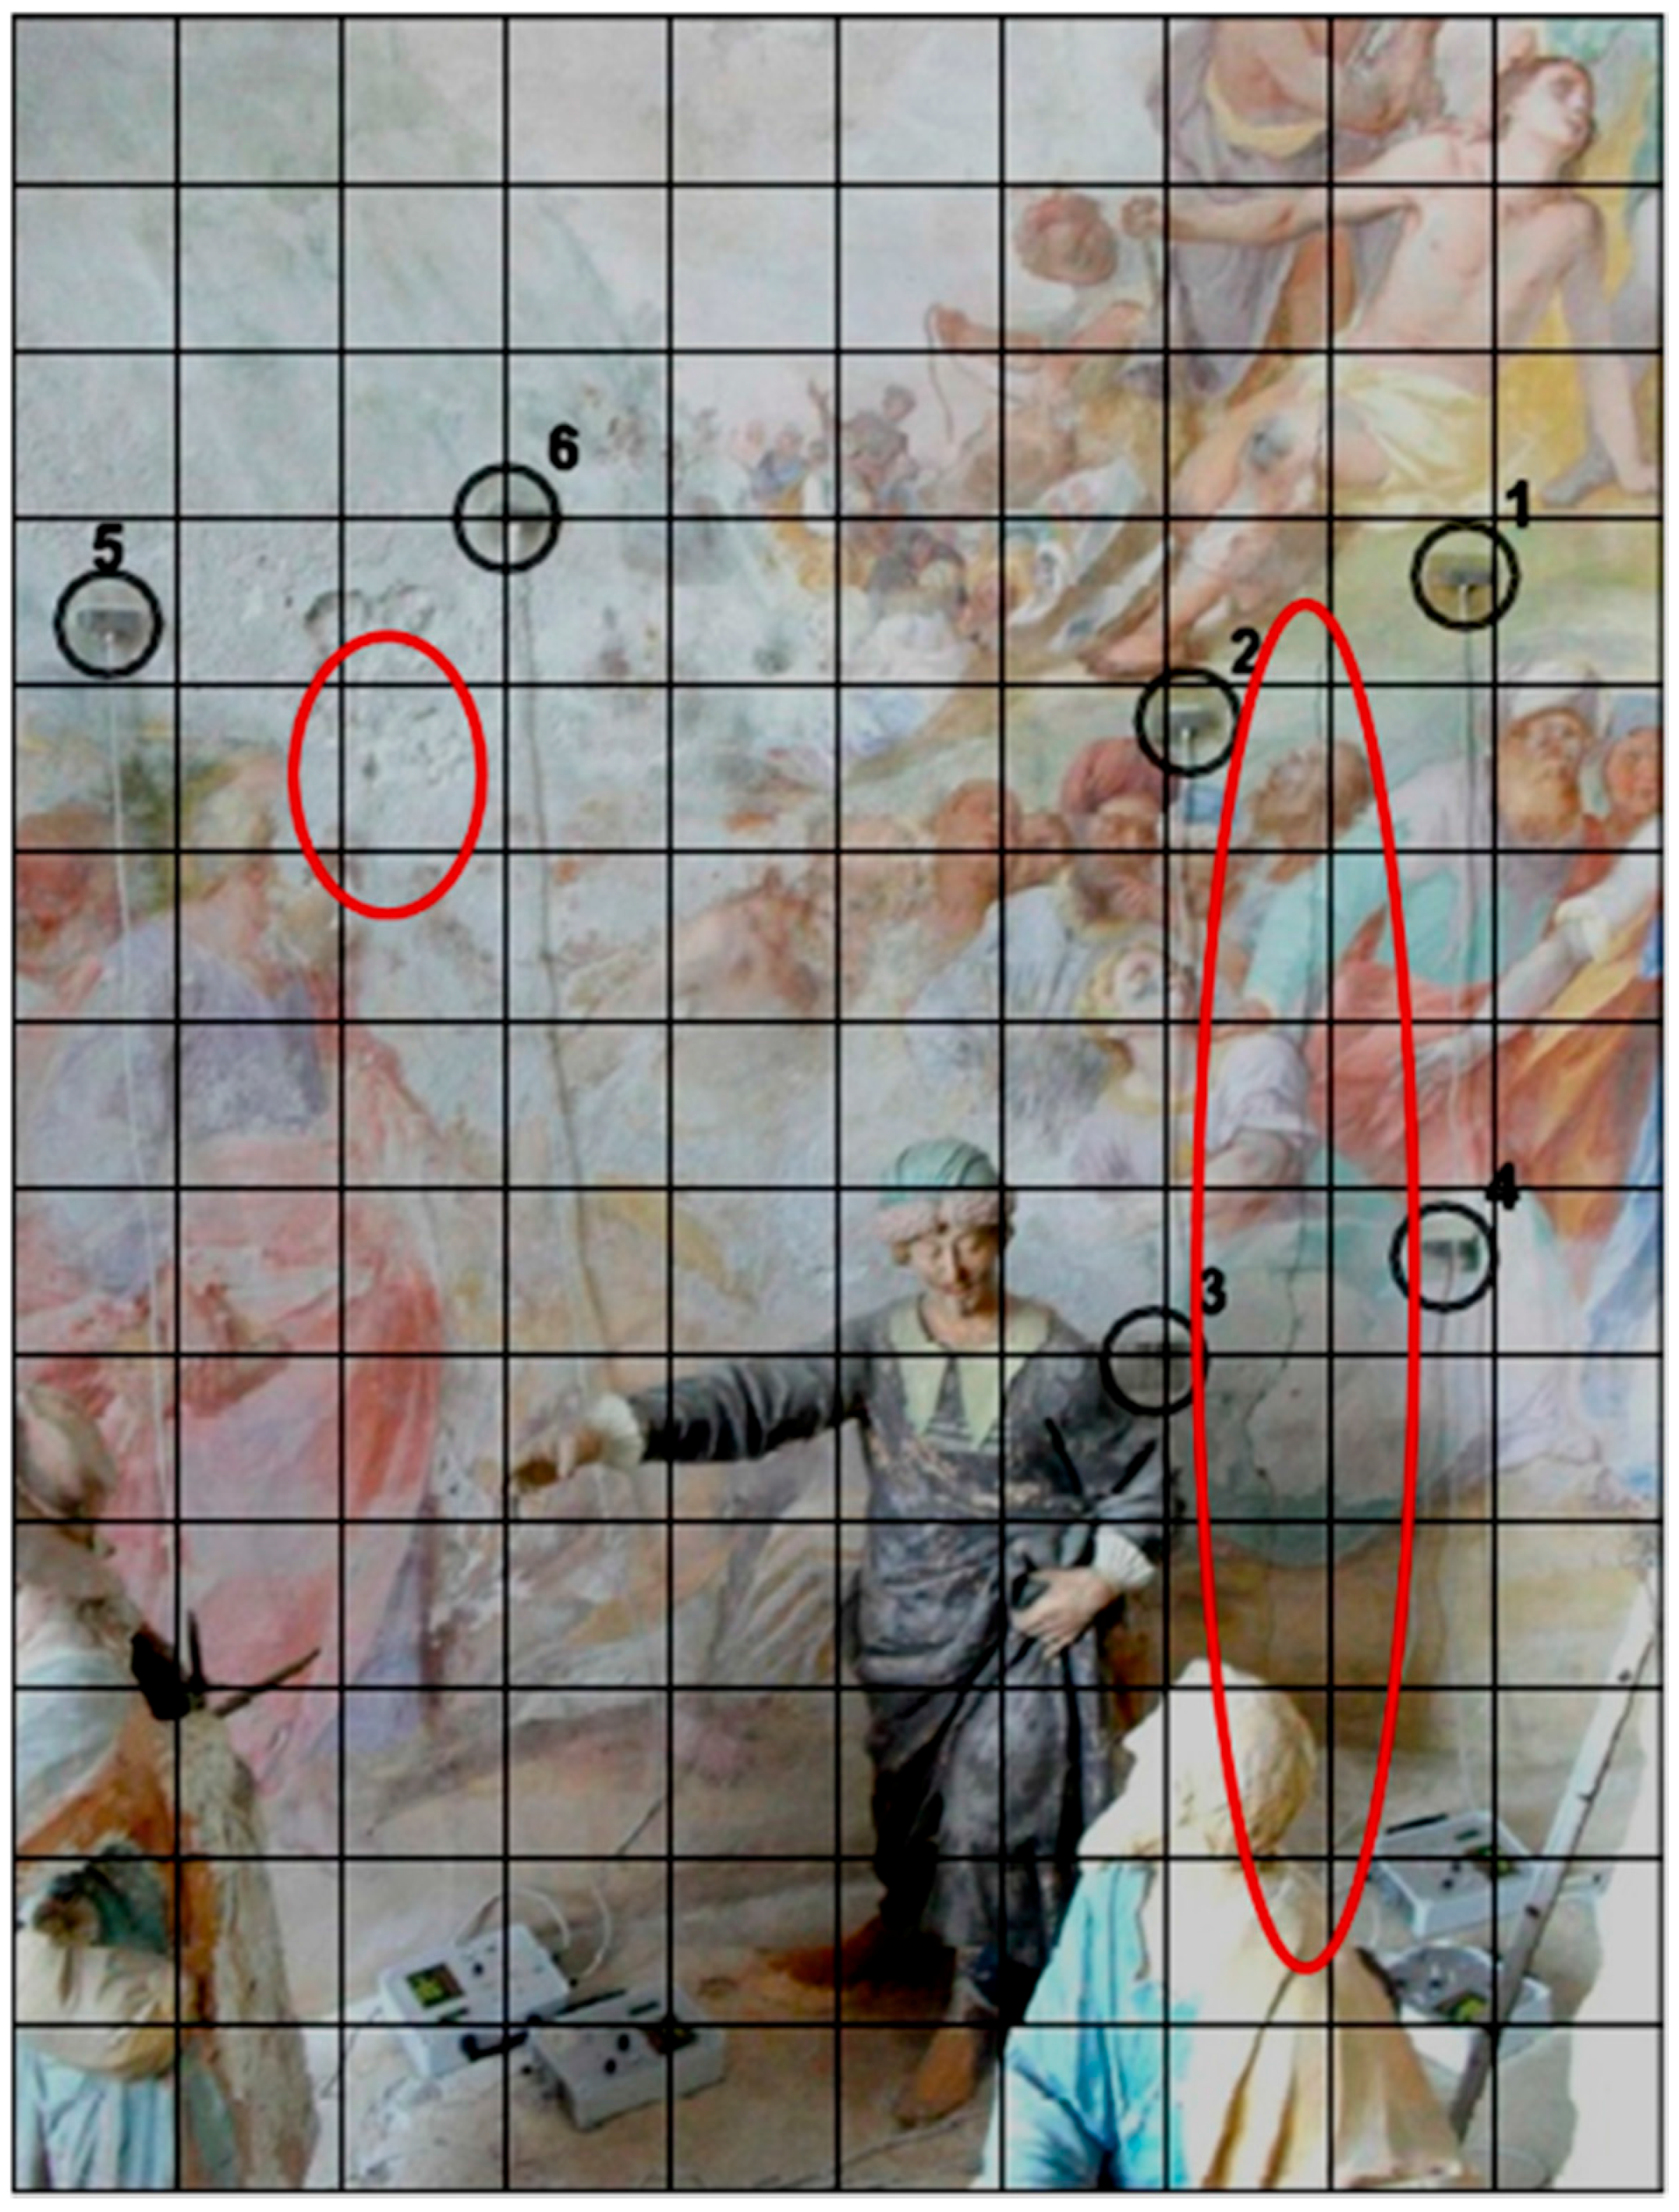
2], we chose to consider Chapel XVII, known as the chapel of the “Transfiguration of the Christ on the Mount Tabor”, for the AE analysis. This structure, having a circular plan, was built with stone masonry and mortar. The interior walls of the chapel are also equipped with some valuable frescoes (
Figure 1).
Figure 1.
Sacred Mountain of Varallo, Mount Tabor Chapel XVII.
Figure 1.
Sacred Mountain of Varallo, Mount Tabor Chapel XVII.
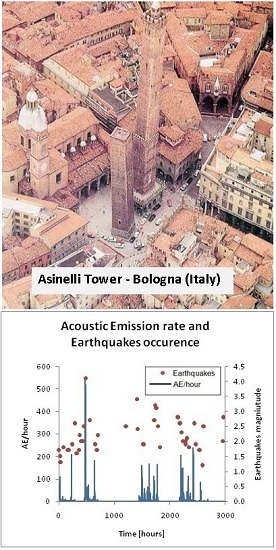
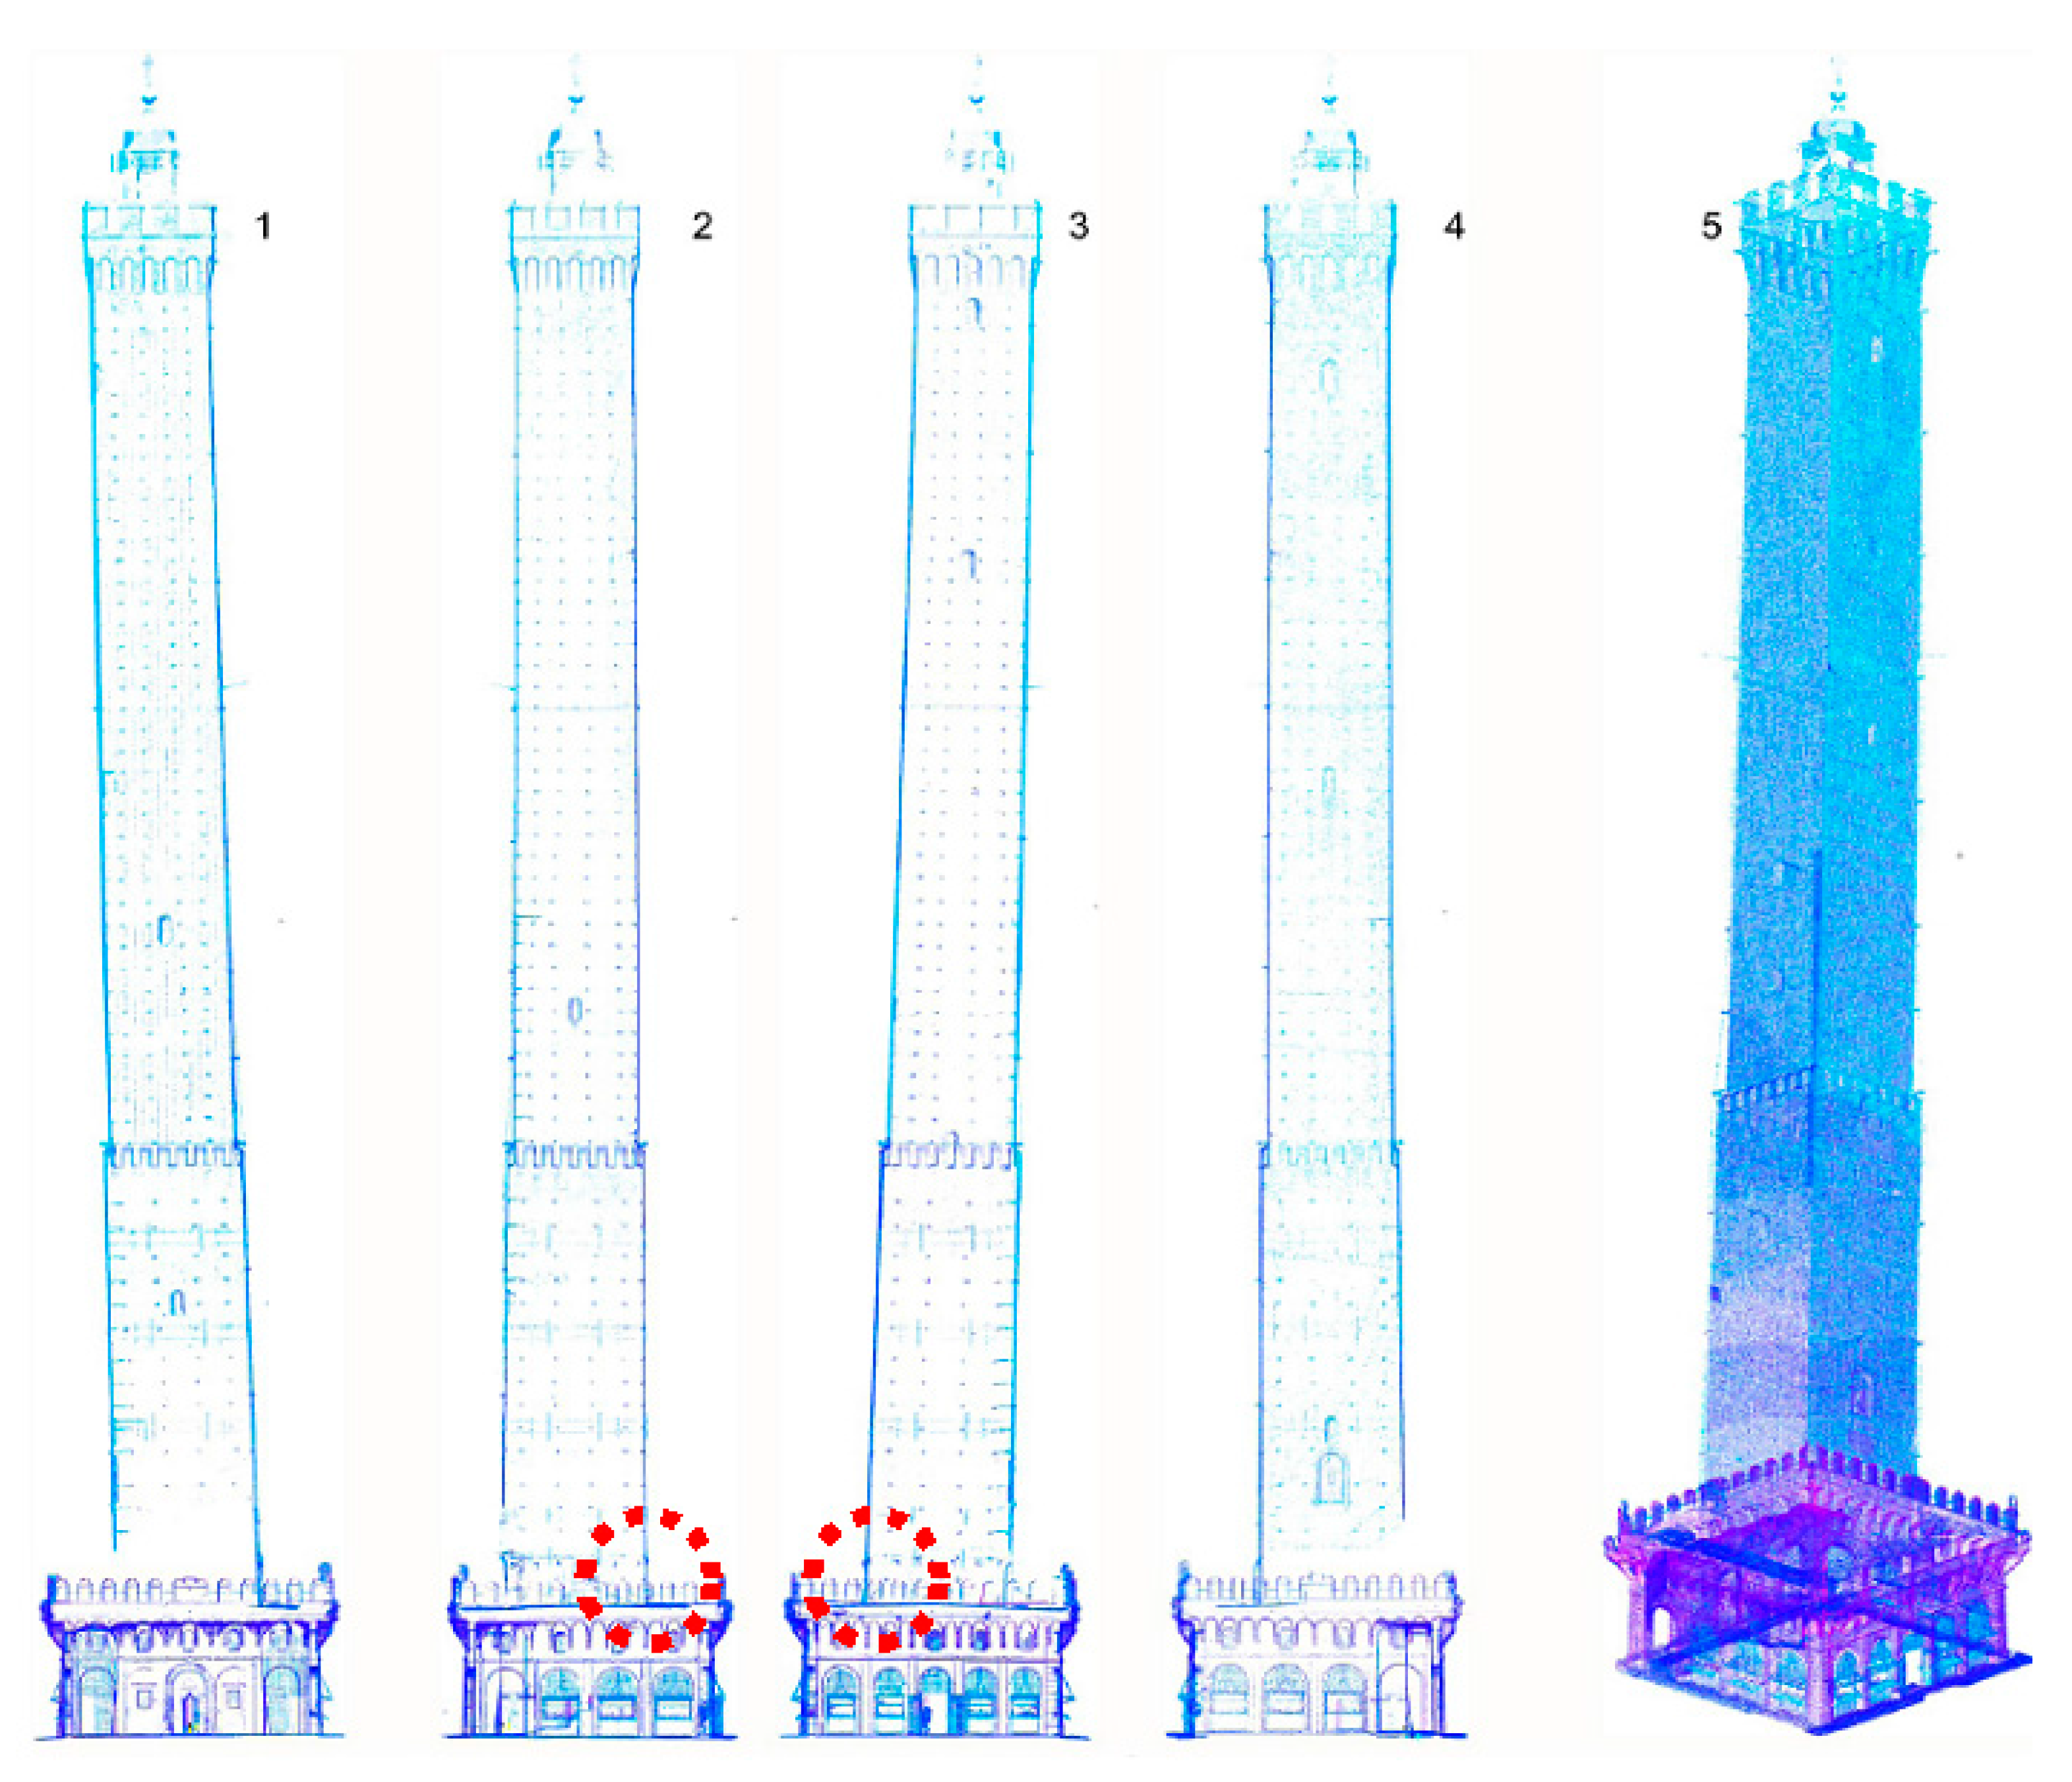
In Bologna, Emilia-Romagna, there is another important masterpiece of Italian architectural and historical heritage, the “Asinelli Tower”, which is also the symbol of the city. To study the damage evolution of the structure, we have recently analyzed the effect of repetitive and impulsive natural and anthropic events, such as earthquakes wind, or vehicle traffic, with the AE technique [
3].
The Asinelli Tower was built in the early 12th century, and it rises to a height of 97.30 m above the ground. From the ground level, up to a height of 8.00 m, the tower is surrounded by an arcade built at the end of the 15th century. Studies conducted in the early 20th century revealed that the Asinelli Tower leaned westward by 2.25 m, and other recent studies have confirmed that its leaning is of 2.38 m, and it remains the tallest leaning tower in Italy (
Figure 2).
Figure 2.
The Asinelli and the adjacent Garisenda Towers in the city center of Bologna. The Asinelli tower is the tallest one on the right.
Figure 2.
The Asinelli and the adjacent Garisenda Towers in the city center of Bologna. The Asinelli tower is the tallest one on the right.
4. Grassberger-Procaccia Algorithm
Acoustic emissions in materials and earthquakes in the crust are very similar phenomena though on very different scales. They both involve a sudden release of elastic energy from a source located in the medium: respectively, the tip of opening micro-cracks and the seismic hypocenter [
11]. The aging and the damage of historical buildings due to the action of small and intermediate earthquakes, a situation very common in central and southern Italy, implies triggering of AE activity on these structures.
However, there appear to be some seismic events which follow AE bursts and, then, do not trigger structural AE activity. In fact, intense crises of crustal stress apparently cross large areas, as revealed by increased AE activity in several case histories from Italy [
12], and precede the eventual occurrence of some earthquake within them.
This experimental evidence suggests that part of the AE activity from the structures might derive from precursive microseismic activity propagating across the ground-building foundation interface.
In this sense, AE monitoring provides twofold information: one concerning the structural damage and the other the amount of stress affecting the crust, in which the building foundation represents a sort of extended underground probe.
With this spirit we introduce a statistical approach to analyze spatial and temporal correlations between AE bursts from the structures and surrounding earthquakes, along the lines of similar investigations of the spatial and temporal correlations of earthquakes [
2,
3,
9].
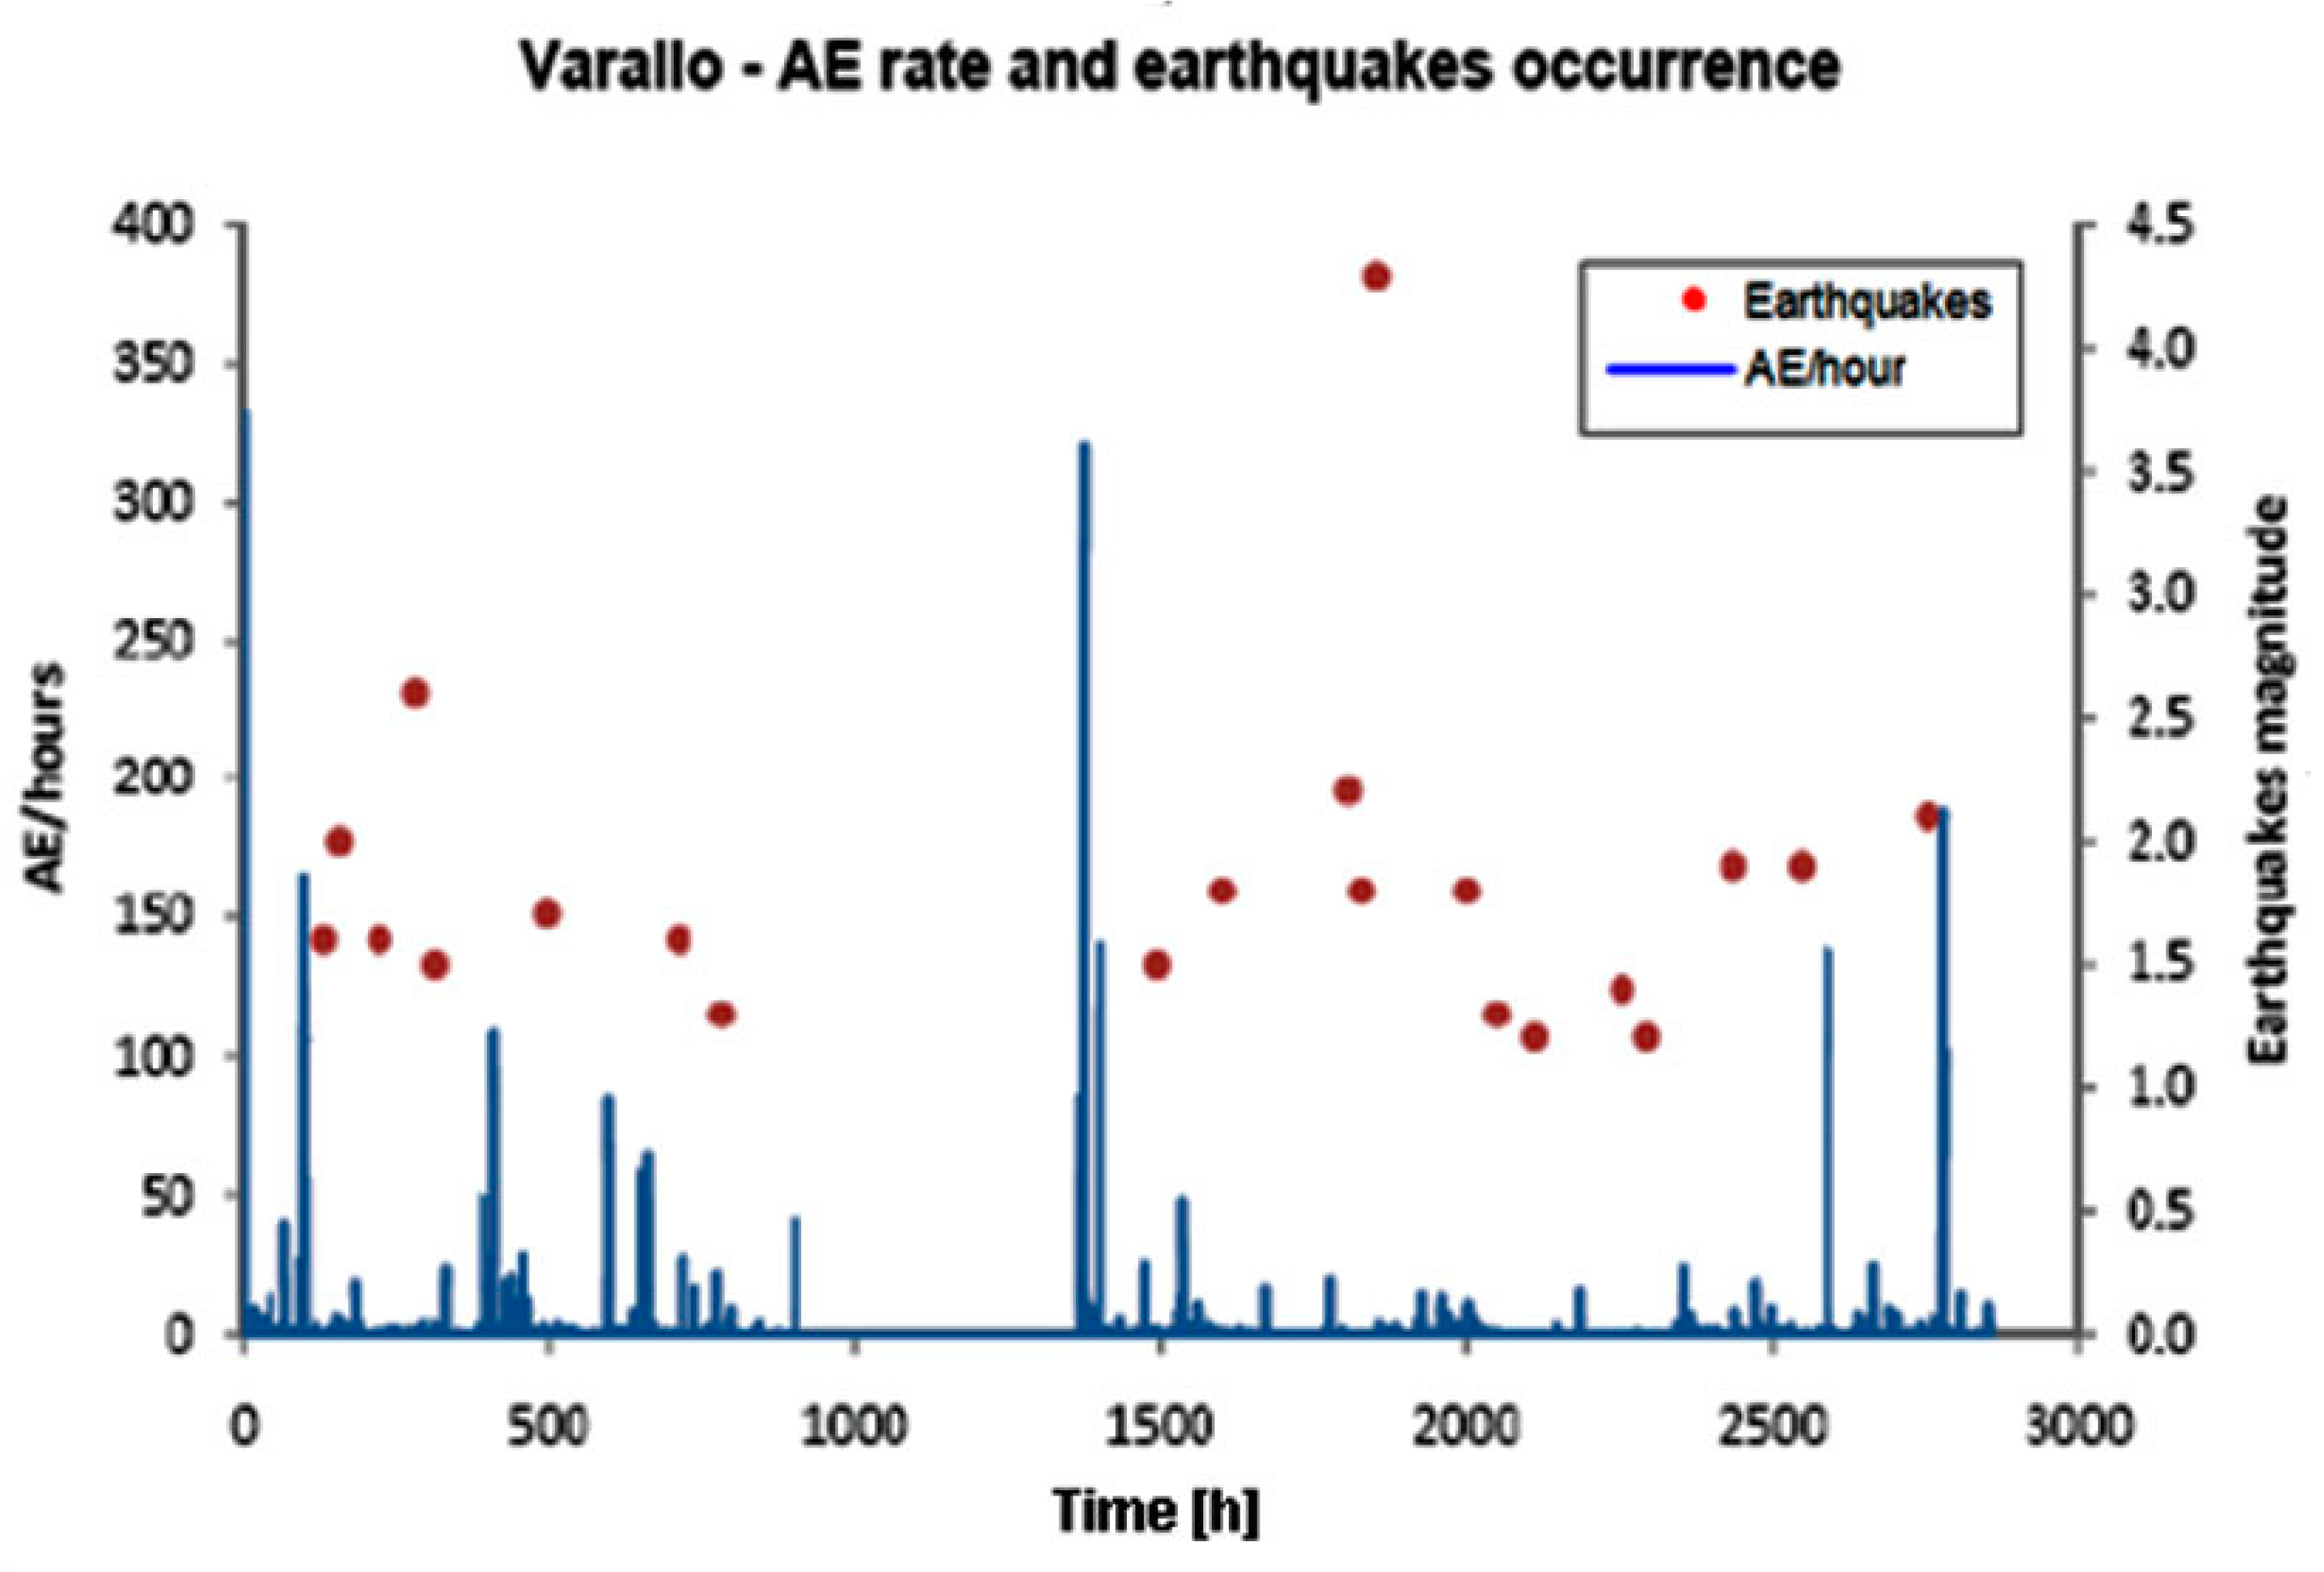
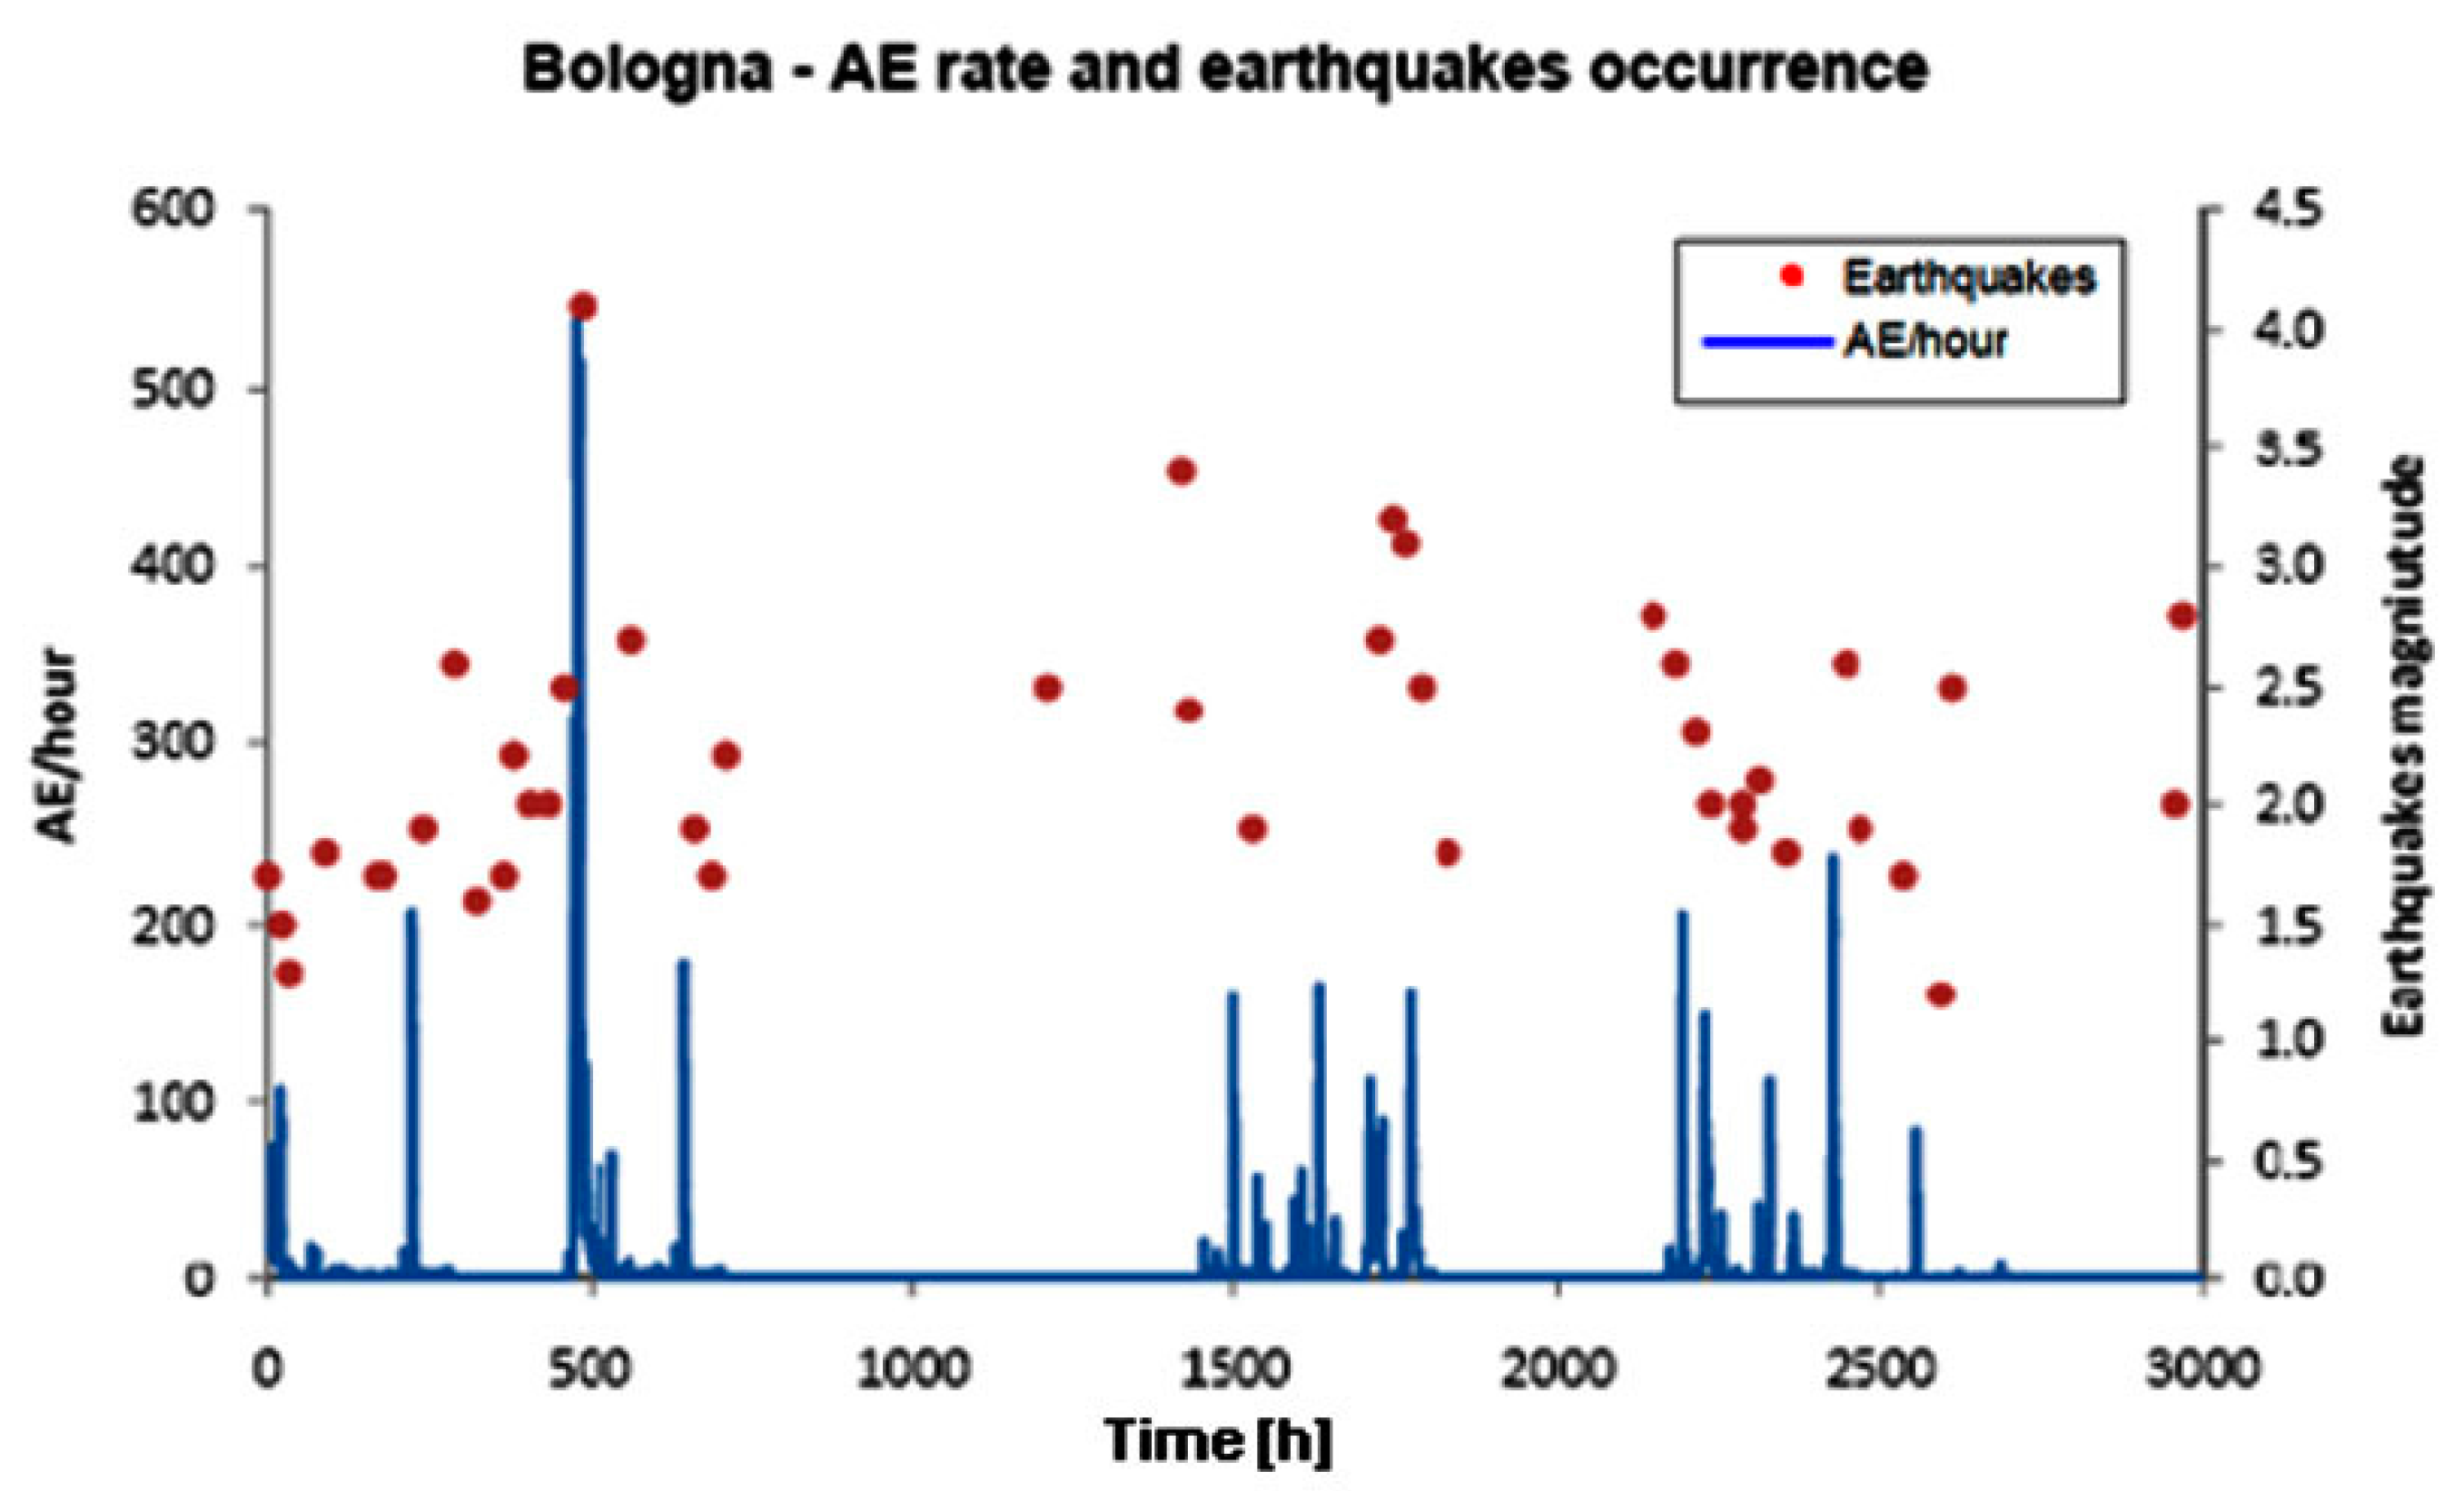
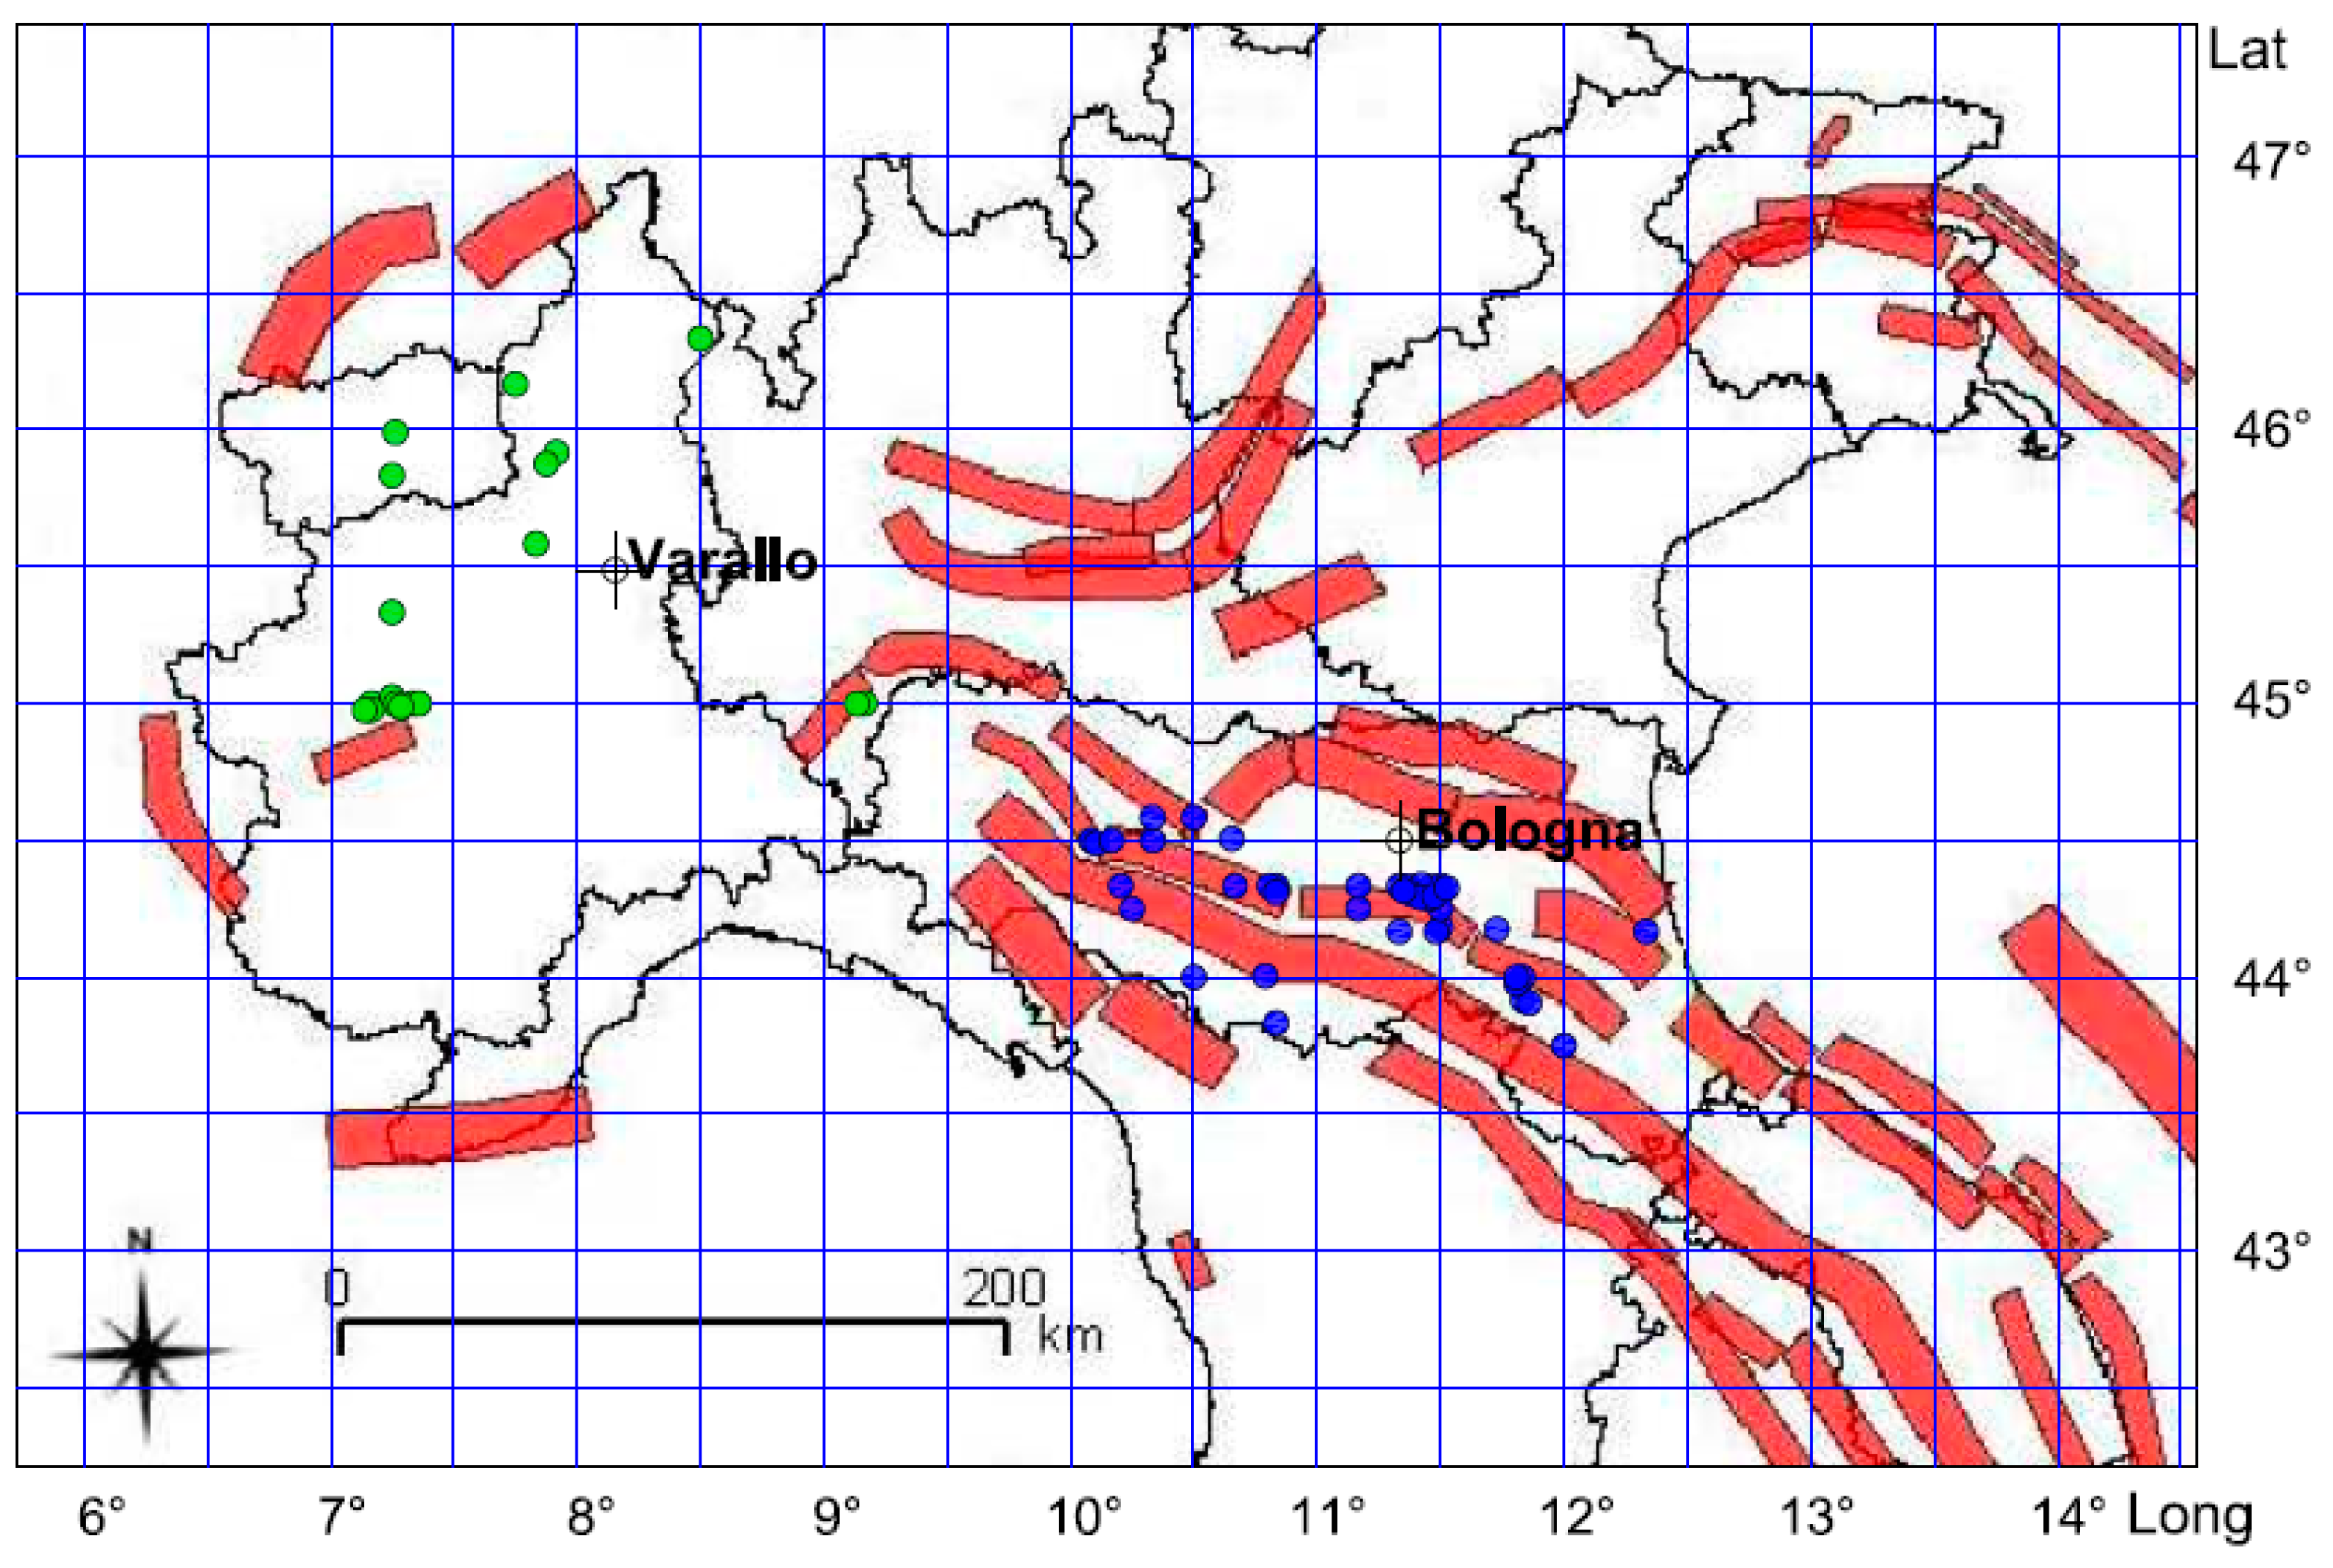
Seismicity levels of the Varallo and Bologna areas can be consistently compared by investigating the earthquakes’ spatial distribution over equally sized regions (
i.e., circular regions with a radius of 100 km) centered at the two monitoring sites, during analogous monitoring periods (3000 h, as shown in
Figure 4 and
Figure 6).
Quantification of this feature is possible through the notion of the fractal dimension of hypocenters, which is frequently estimated by the correlation integral because of its great reliability and sensitivity to small changes in clustering properties [
13,
14,
15]. The correlation integral for hypocenter points embedded into a three-dimensional space is defined as follows:
where
N is the total number of seismic events,
x is the hypocentral coordinate vector, and Θ is the Heaviside step function (Θ(
x) = 0 if
x ≤ 0, Θ(
x) = 1 if
x > 0). The correlation integral
C(
r) gives the probability of finding another point in the sphere of radius
r centered at an arbitrary point. For a fractal population of points,
C(
r) scales with
r as a power law,
D being the correlation dimension:
We apply the correlation integral to the earthquake sequences under consideration, i.e., the earthquakes with epicentral distance in the range of 60–100 km from the Varallo Chapel and 25–100 km from the Asinelli Tower, which occurred during the AE monitoring periods. The choice of the minimum magnitude threshold, mL ≥ 1.2, was driven by completeness criteria.
The seismic events were taken from the Italian Seismological Instrumental and Parametric Data-Base ISIDE [
16].
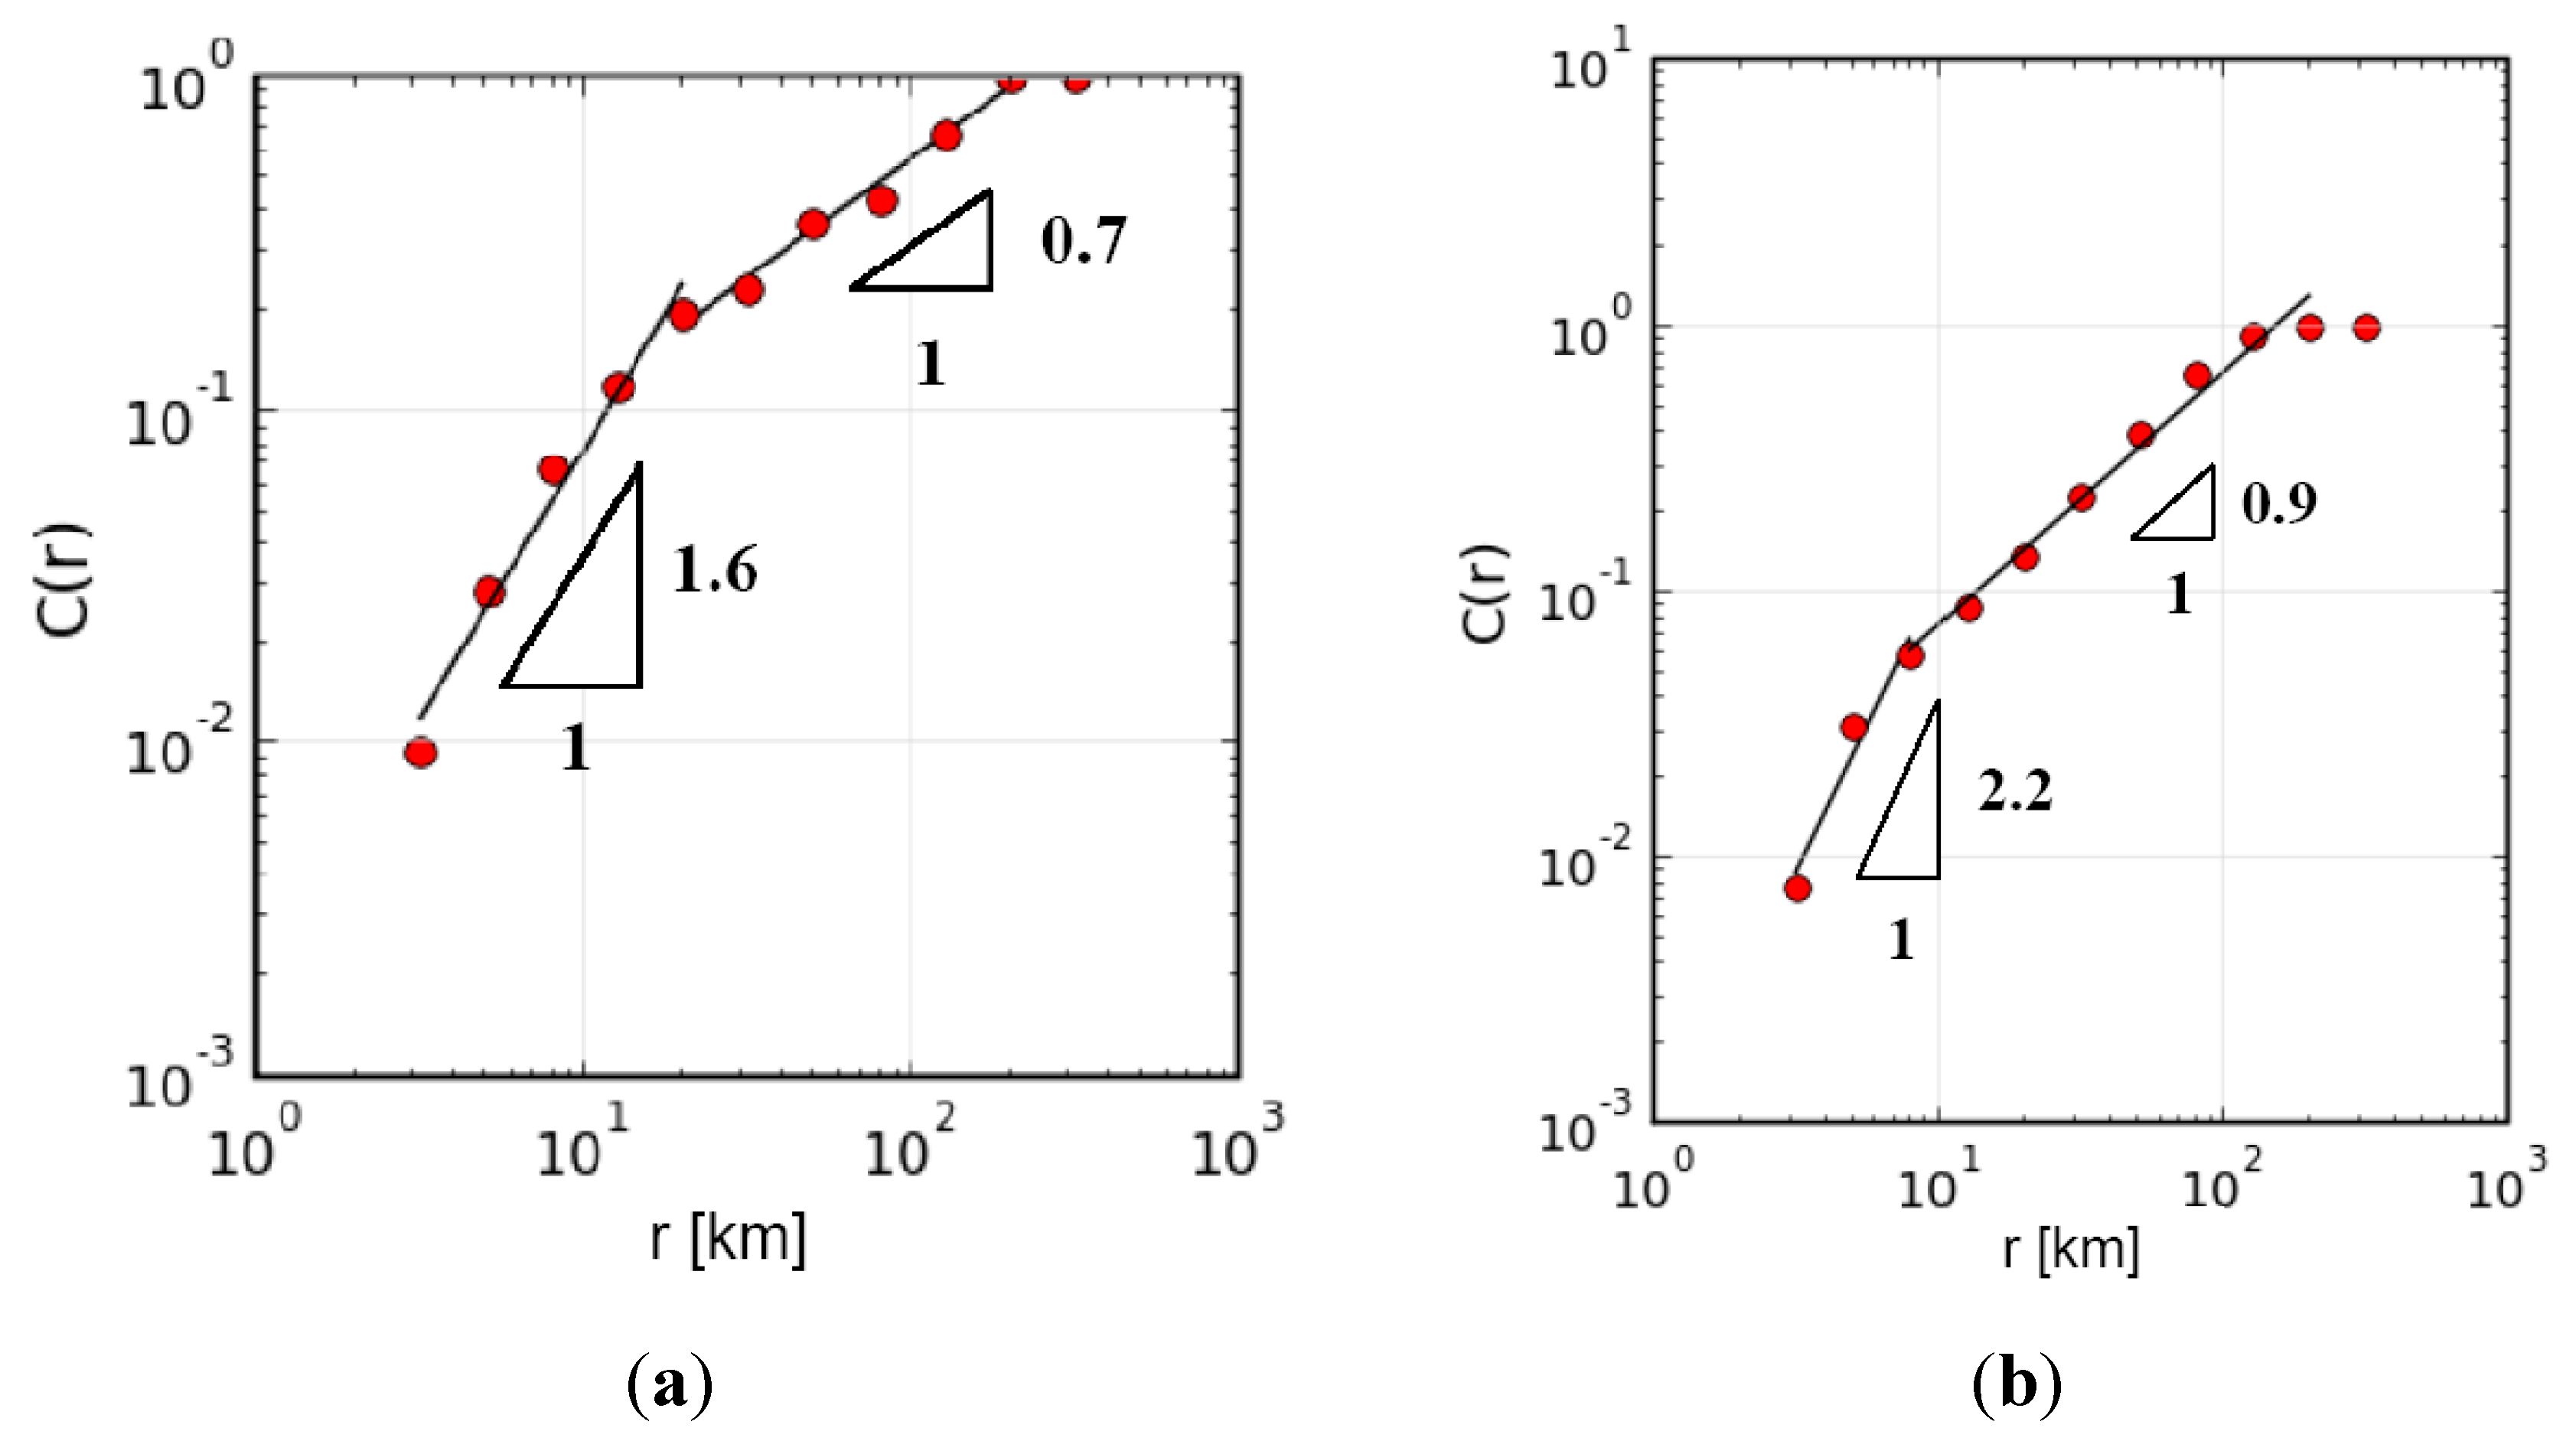
Two patterns are evidenced in
Figure 7a,b: shorter ranges, 3 km <
r < 10–20 km, are defined by a unique slope giving a relatively high value of the correlation dimension,
D = 1.6 (Varallo) and
D = 2.2 (Bologna); for distances over 10–20 km, the slope gives a value of
D = 0.7 (Varallo) and
D = 0.9 (Bologna). For short ranges,
D ≈ 2 corresponds to a distribution of events over a fault plane, such as the active faults in the region surrounding Bologna; the highest ranges, corresponding to a value of
D < 1, suggest a dust-like setting of seismicity as in the region surrounding Varallo (see
Figure 8).The higher dimension for Bologna apparently reflects the recent and active tectonics of the Emilia-Romagna in the northeastern Italy, with respect to the seismically quiet zone of Varallo [
17].
Figure 7.
Correlation integral C(r) vs. r (km) and its slope D in bi-logarithmic scale for Varallo regional seismicity (a) and Bologna regional seismicity (b).
Figure 7.
Correlation integral C(r) vs. r (km) and its slope D in bi-logarithmic scale for Varallo regional seismicity (a) and Bologna regional seismicity (b).
Figure 8.
Map of Northern Italy depicting faults and epicenters.
Figure 8.
Map of Northern Italy depicting faults and epicenters.
5. Space-Time Correlation between AE and Seismic Events
Along the lines of studies on the space-time correlation among earthquakes based on a generalization of the Grassberger-Procaccia correlation integral [
8], we calculate the degree of correlation between the AE time series and the sequence of nearby earthquakes recorded during the same period. No a priori assumptions on causal relationships between AE and seismic activities drive this approach, which is merely statistical. Only the choice of the time window and the region size is arbitrary.
The space-time combined correlation integral is defined as follows [
7,
9]:
where the index
j runs over all the
NAE event bursts {
x0,
tj}, with
x0 being the coordinate vector of the monitoring site, while
k runs over all the
NEQ seismic events {
xk,
tk}, with
xk being the epicentral coordinate vector.
Since the double-sum in Equation (3) counts pairs formed by an AE event (x0, tj) and a seismic event (xk, tk) with mutual epicentral distance │x0 − xk│ ≤ r and time intervals│tj − tk│ ≤ τ among all NAE and NEQ possible pairs, C(r,τ) can easily be interpreted as the probability of an AE burst and an earthquake occurring with an inter-distance ≤r and a time interval ≤τ.
If
C(
r, τ,) exhibits power-law behavior both in space and time variables, time and space fractal dimensions
Dt and
Ds can be defined similarly to Equation (2):
and
The time correlation dimension Dt(r, τ) characterizes the time-coupling of AE bursts to the earthquakes occurring up to a given distance r from the AE monitoring site, whereas the space correlation dimension Ds(r, τ) characterizes the spatial distribution of nearby earthquakes with separation in time from AE bursts not exceeding a given τ.
It is worth noting that Equation (5) identifies with Equation (2) if τ equals the whole time data span, as all earthquakes would be taken into account in the Grassberger-Procaccia integral C(r, τ).
Actually, the imposed condition │
tj −
tk│ ≤ τ does not specify the chronological order between the two types of event. On the other hand, the AE time series and the sequence of nearby earthquakes are two very closely interrelated sets in the time domain. Therefore, a given AE burst might be either due to structural damage triggered by a seismic event or due to precursive microseismic activity. In spite of intrinsic difficulties in high-frequency propagation across disjointed media (in particular at the ground-building foundation interface), AE bursts apparently indicate widespread crustal stress crises during the preparation of a seismic event [
9,
12], when part of the related deformation energy stored in the Earth’s crust might be transferred to the building foundations.
It is interesting to carry out a probabilistic analysis of the available data considering AE events once as preceding an earthquake,
i.e., as potential seismic precursors, and next as following an earthquake,
i.e., as structural aftershocks. In this way, the obtained conditioned probability distributions can be compared in order to discover the prevailing trend. This analysis is performed applying the modified correlation integral [
9]:
where “+” and “−“ are used to account for AE events, respectively, as seismic precursors and as aftershocks.
C+ (
r, τ), for example, gives the occurrence probability of an AE burst followed by an earthquake in the next interval τ and within a radius
r of the monitoring site.
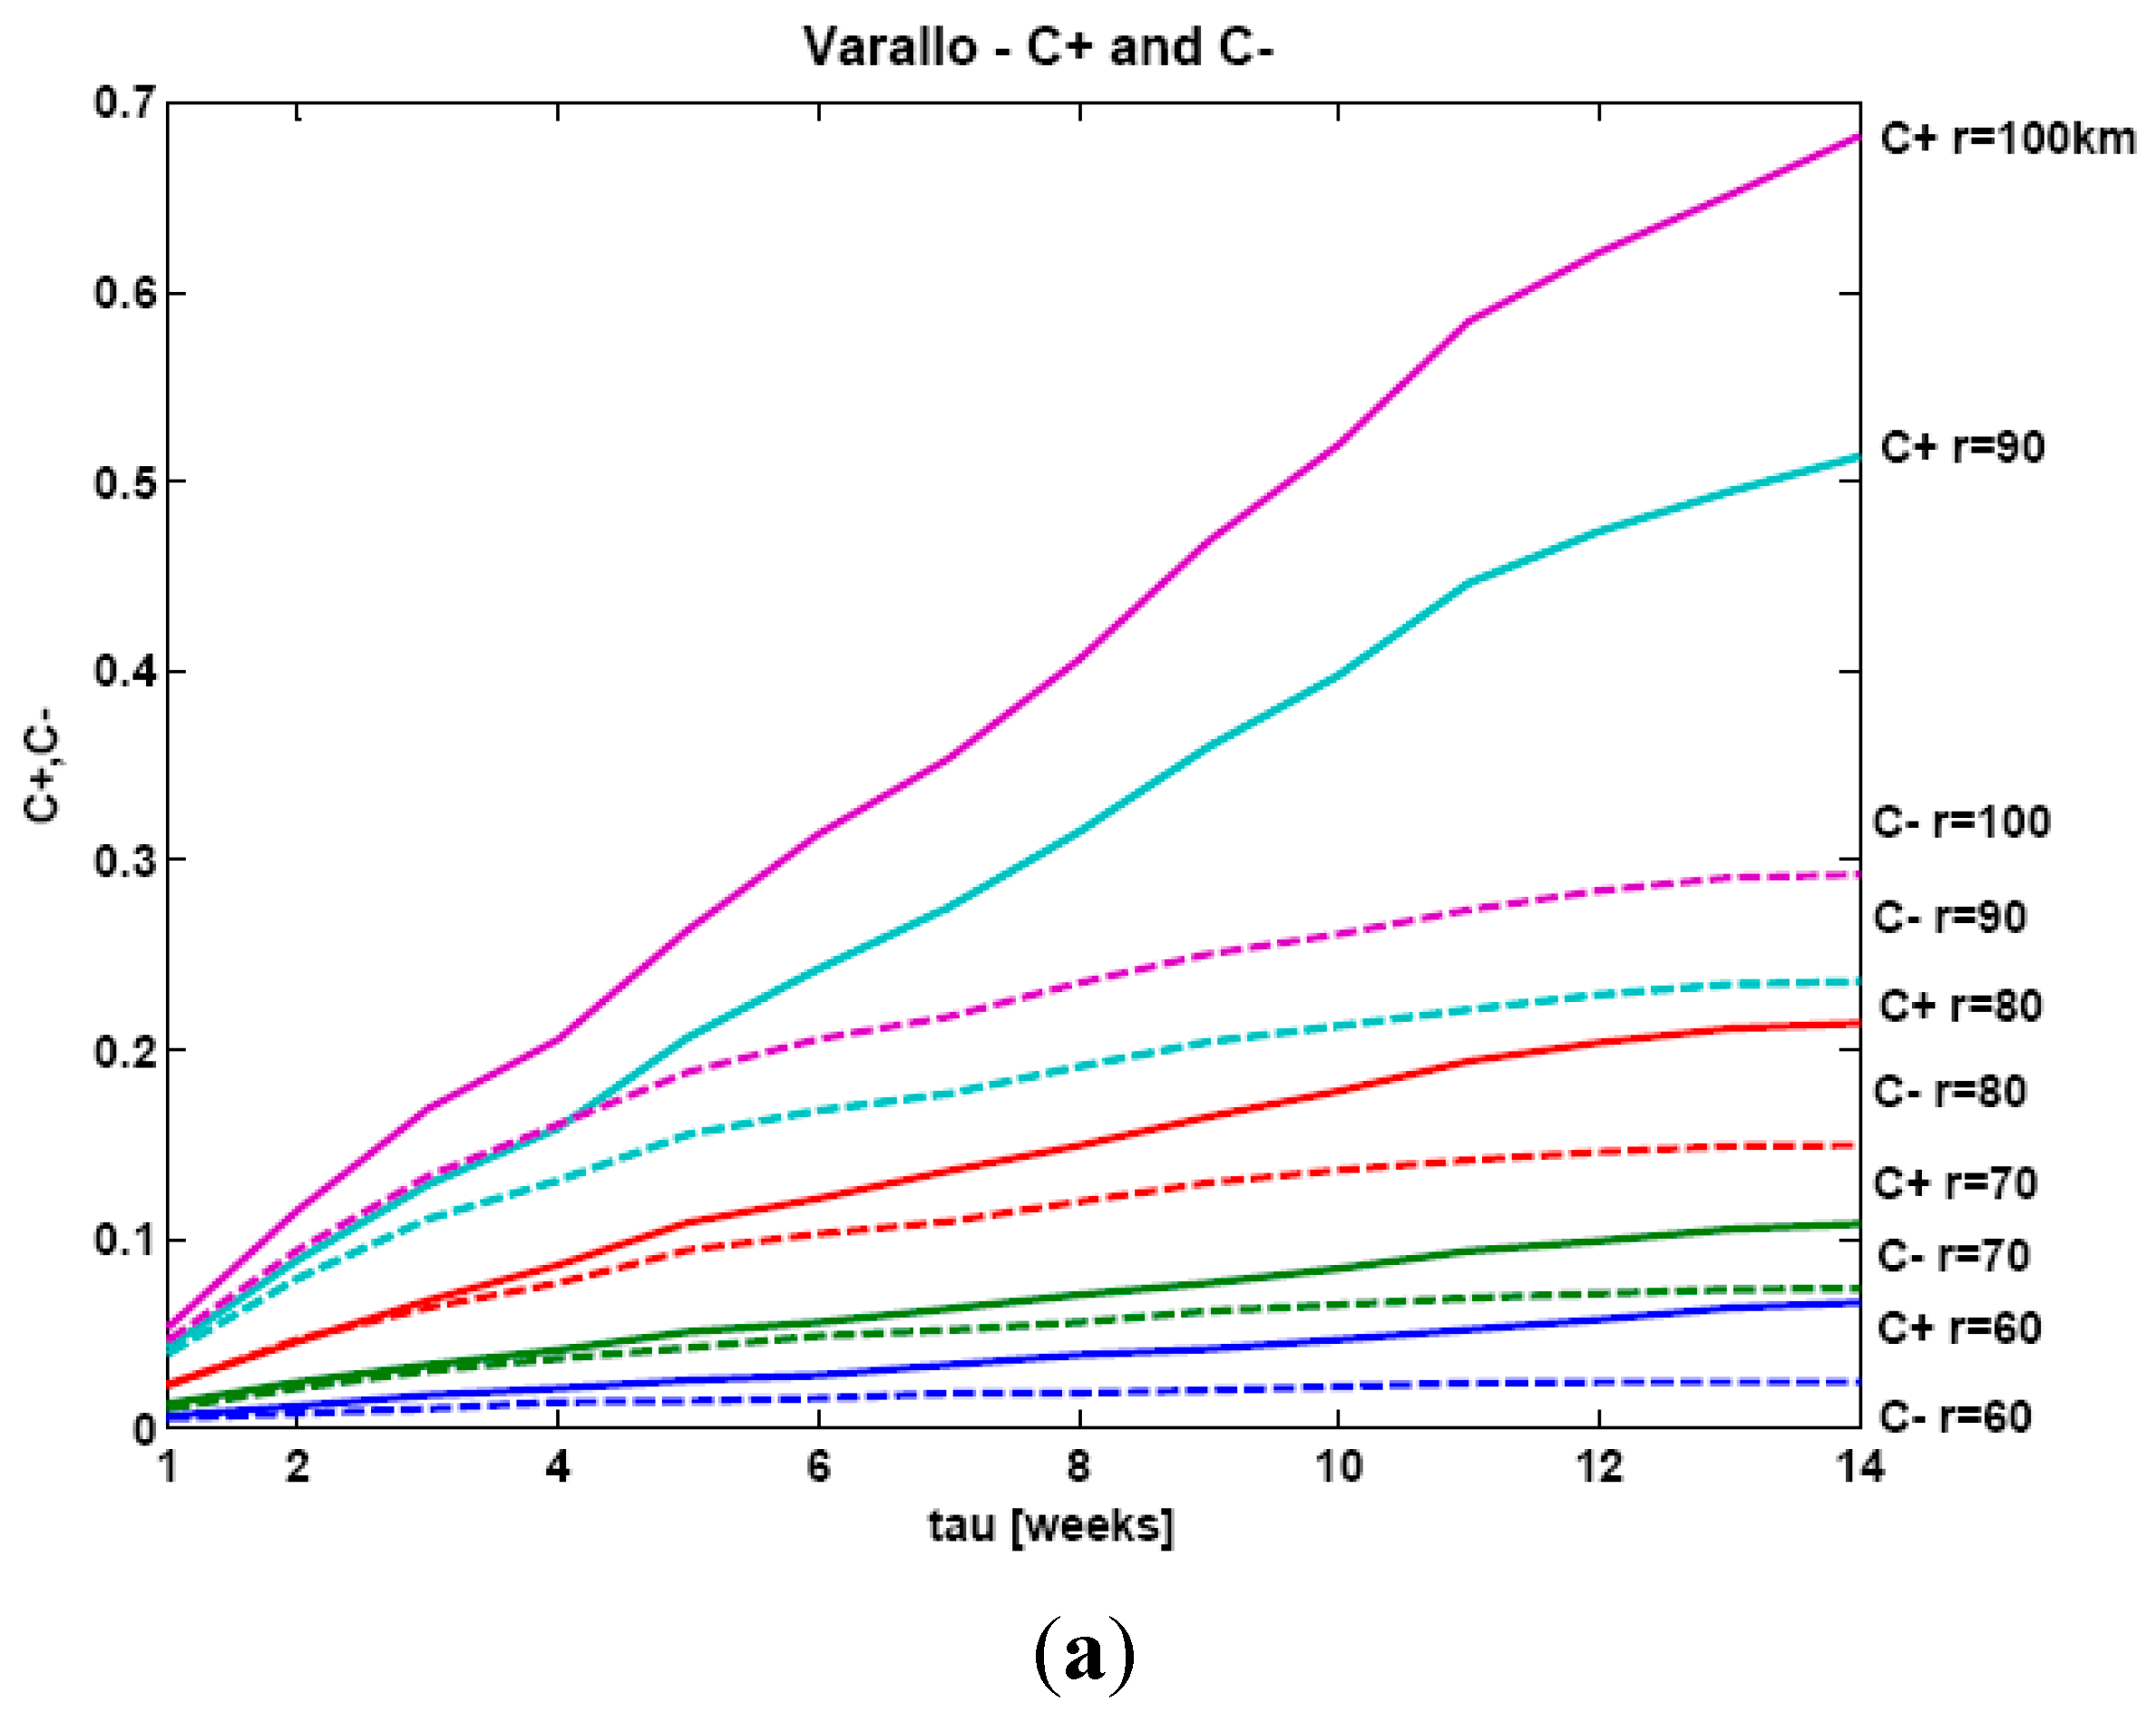
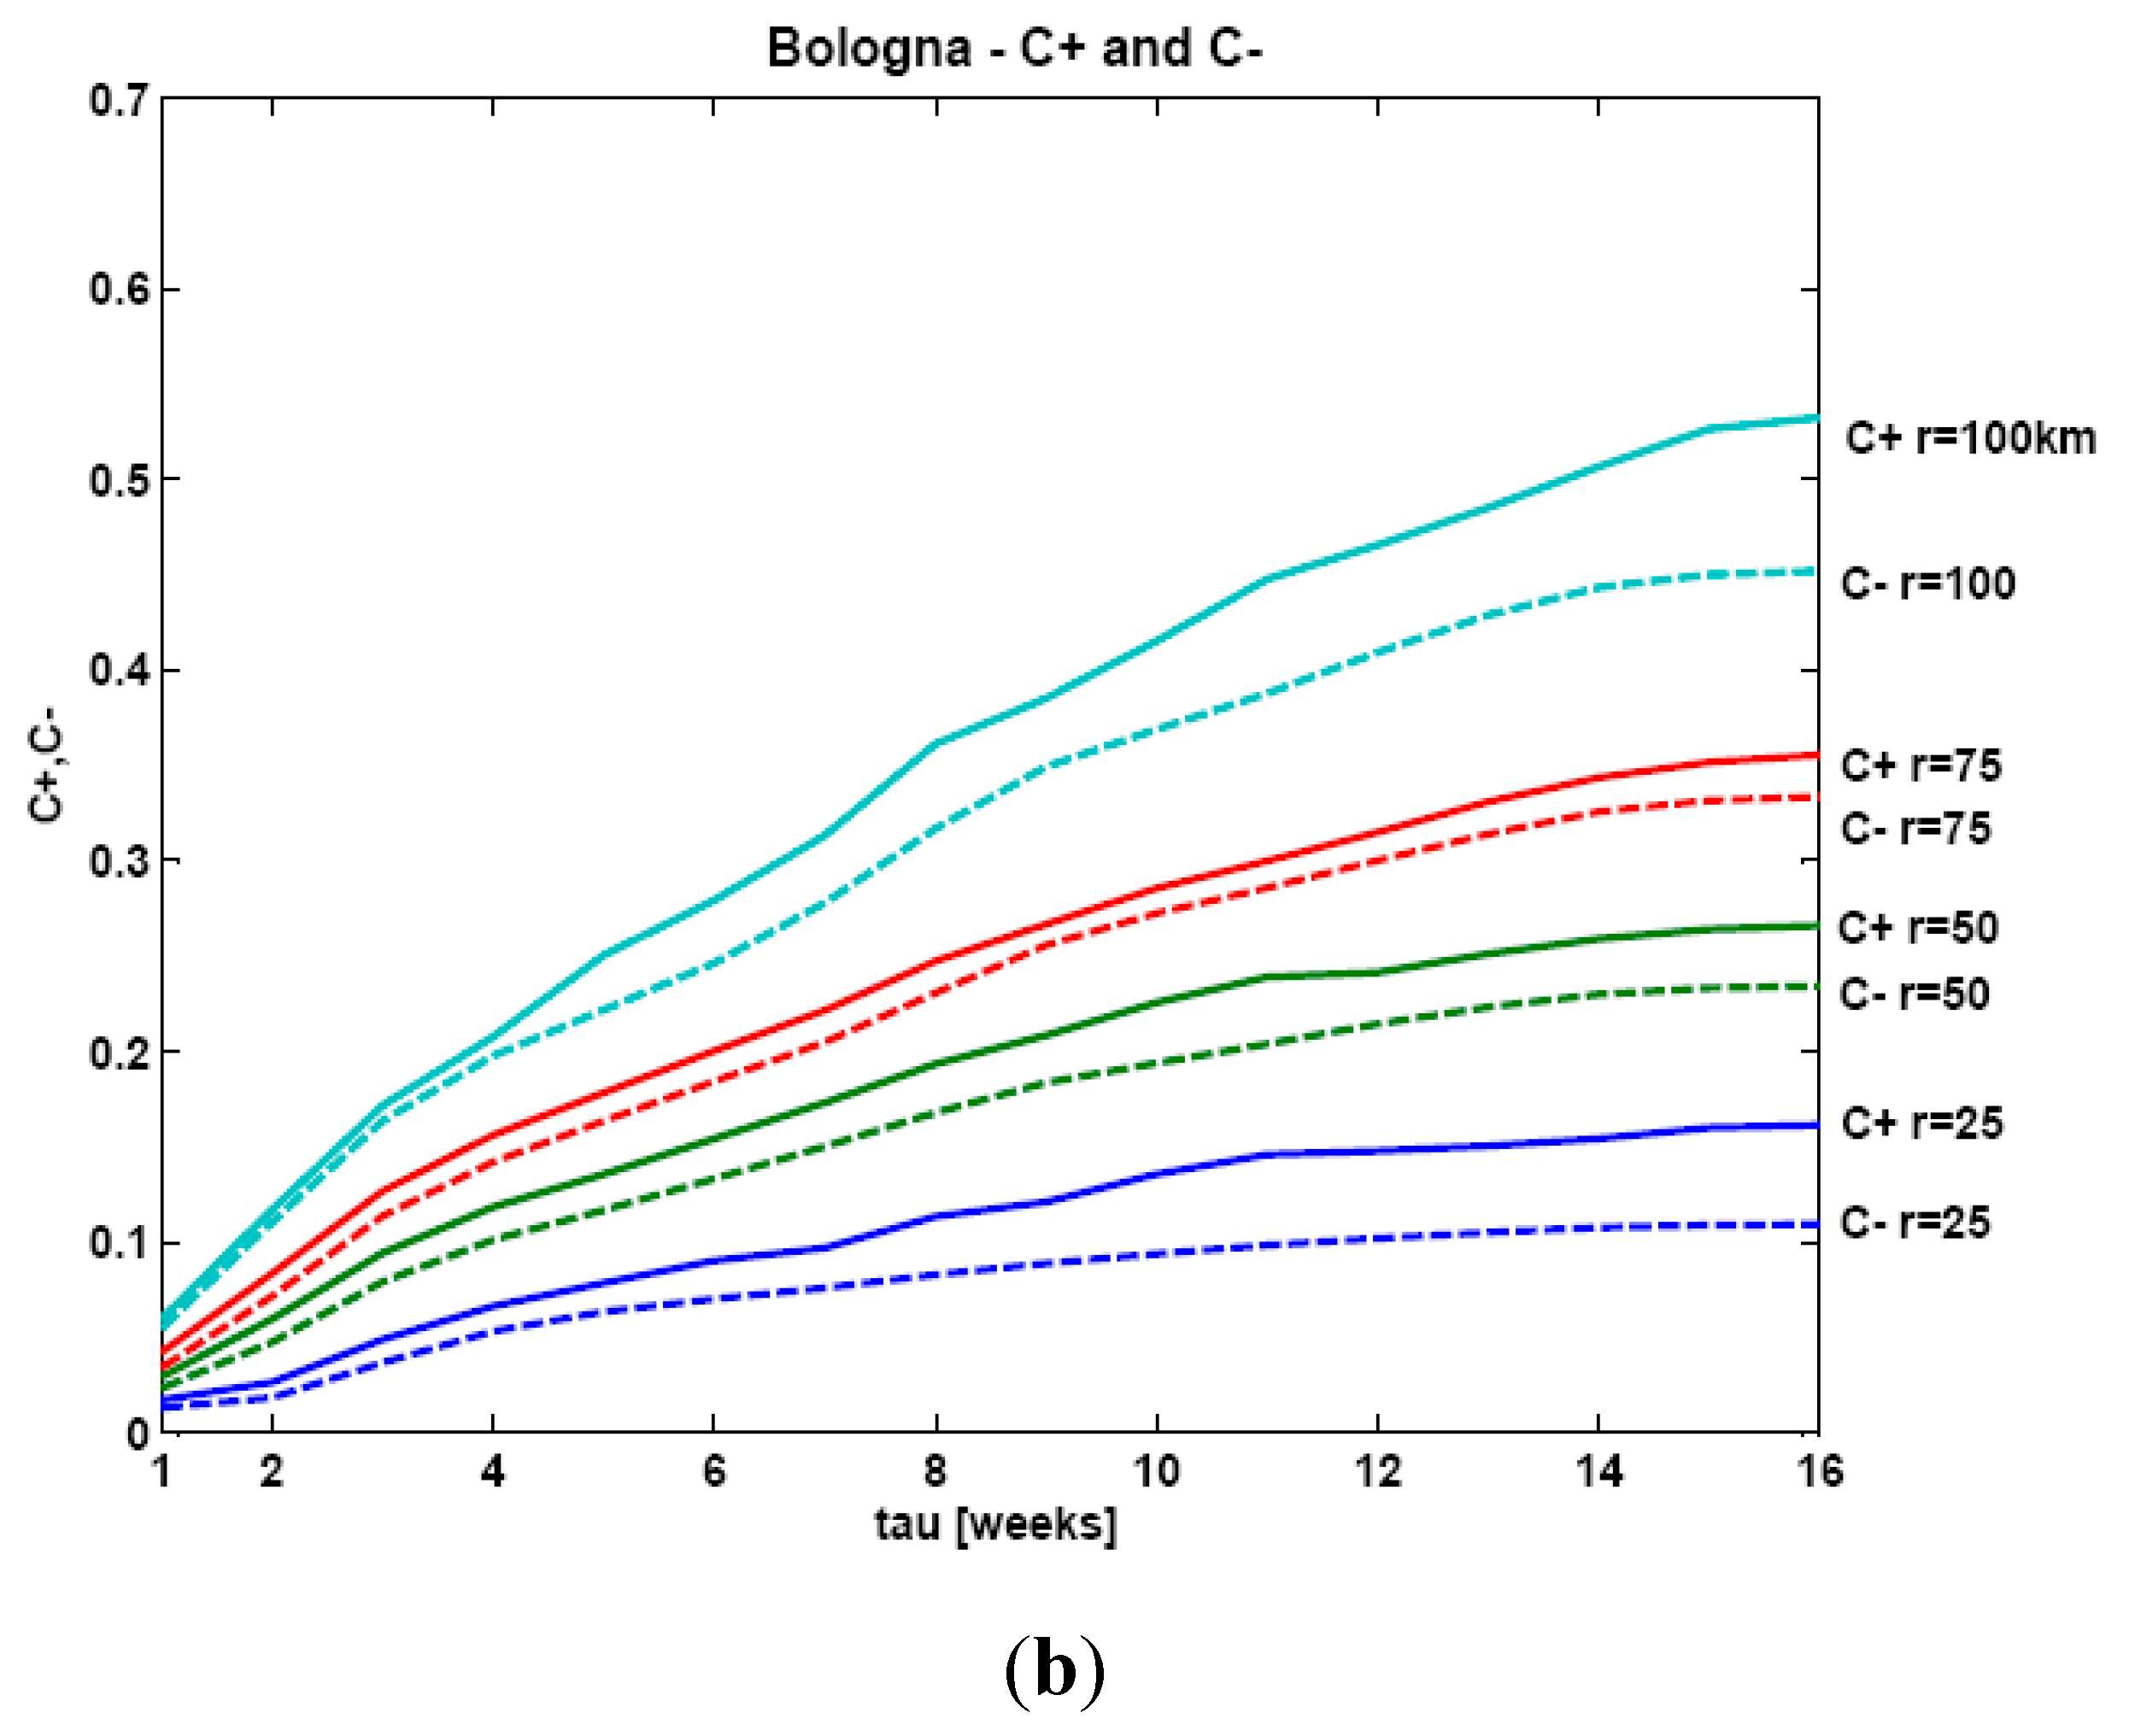
We applied the modified integral (Equation 6) to investigate the space-time correlation between the two above-mentioned regional seismic sequences and the AE time series from the Asinelli Tower and the Varallo Chapel (see
Figure 4 and
Figure 6).
The AE signals originating from damage sources definitely localized in the building’s masonry are filtered out. In this way, we can preliminarily distinguish between environmental contributions due to crustal trembling (external source) and structural damage contributions (inner sources localized by means of triangulation techniques [
18]). Then, by applying the modified Grassberger-Procaccia correlation integral to the remaining AE data series and to the earthquake sequence, we obtained the cumulative probabilities
C±(
r, τ) as functions of time
C±r(τ) for different values of range
r. This provides two-dimensional plots, which are easier to read than a three-dimensional representation of
C±(
r, τ).
Figure 9a,b show that
C+r >
C−r for all considered values of range
r, suggesting that AE bursts are more likely to precede earthquakes than to follow them. The interpretation of this evidence is that the monitored structures behave as receptors of microseismic precursive activity during the preparation of a seismic event,
i.e., as sensitive earthquake receptors.
Figure 9.
Modified correlation integrals C±r(τ), both considering AEs as earthquake “precursors” (+) and as “damage aftershocks” (−), plotted as functions of the time separation τ for different values of the spatial range r for: (a) Chapel XVII and area around the city of Varallo; (b) Asinelli Tower and area around the city of Bologna.
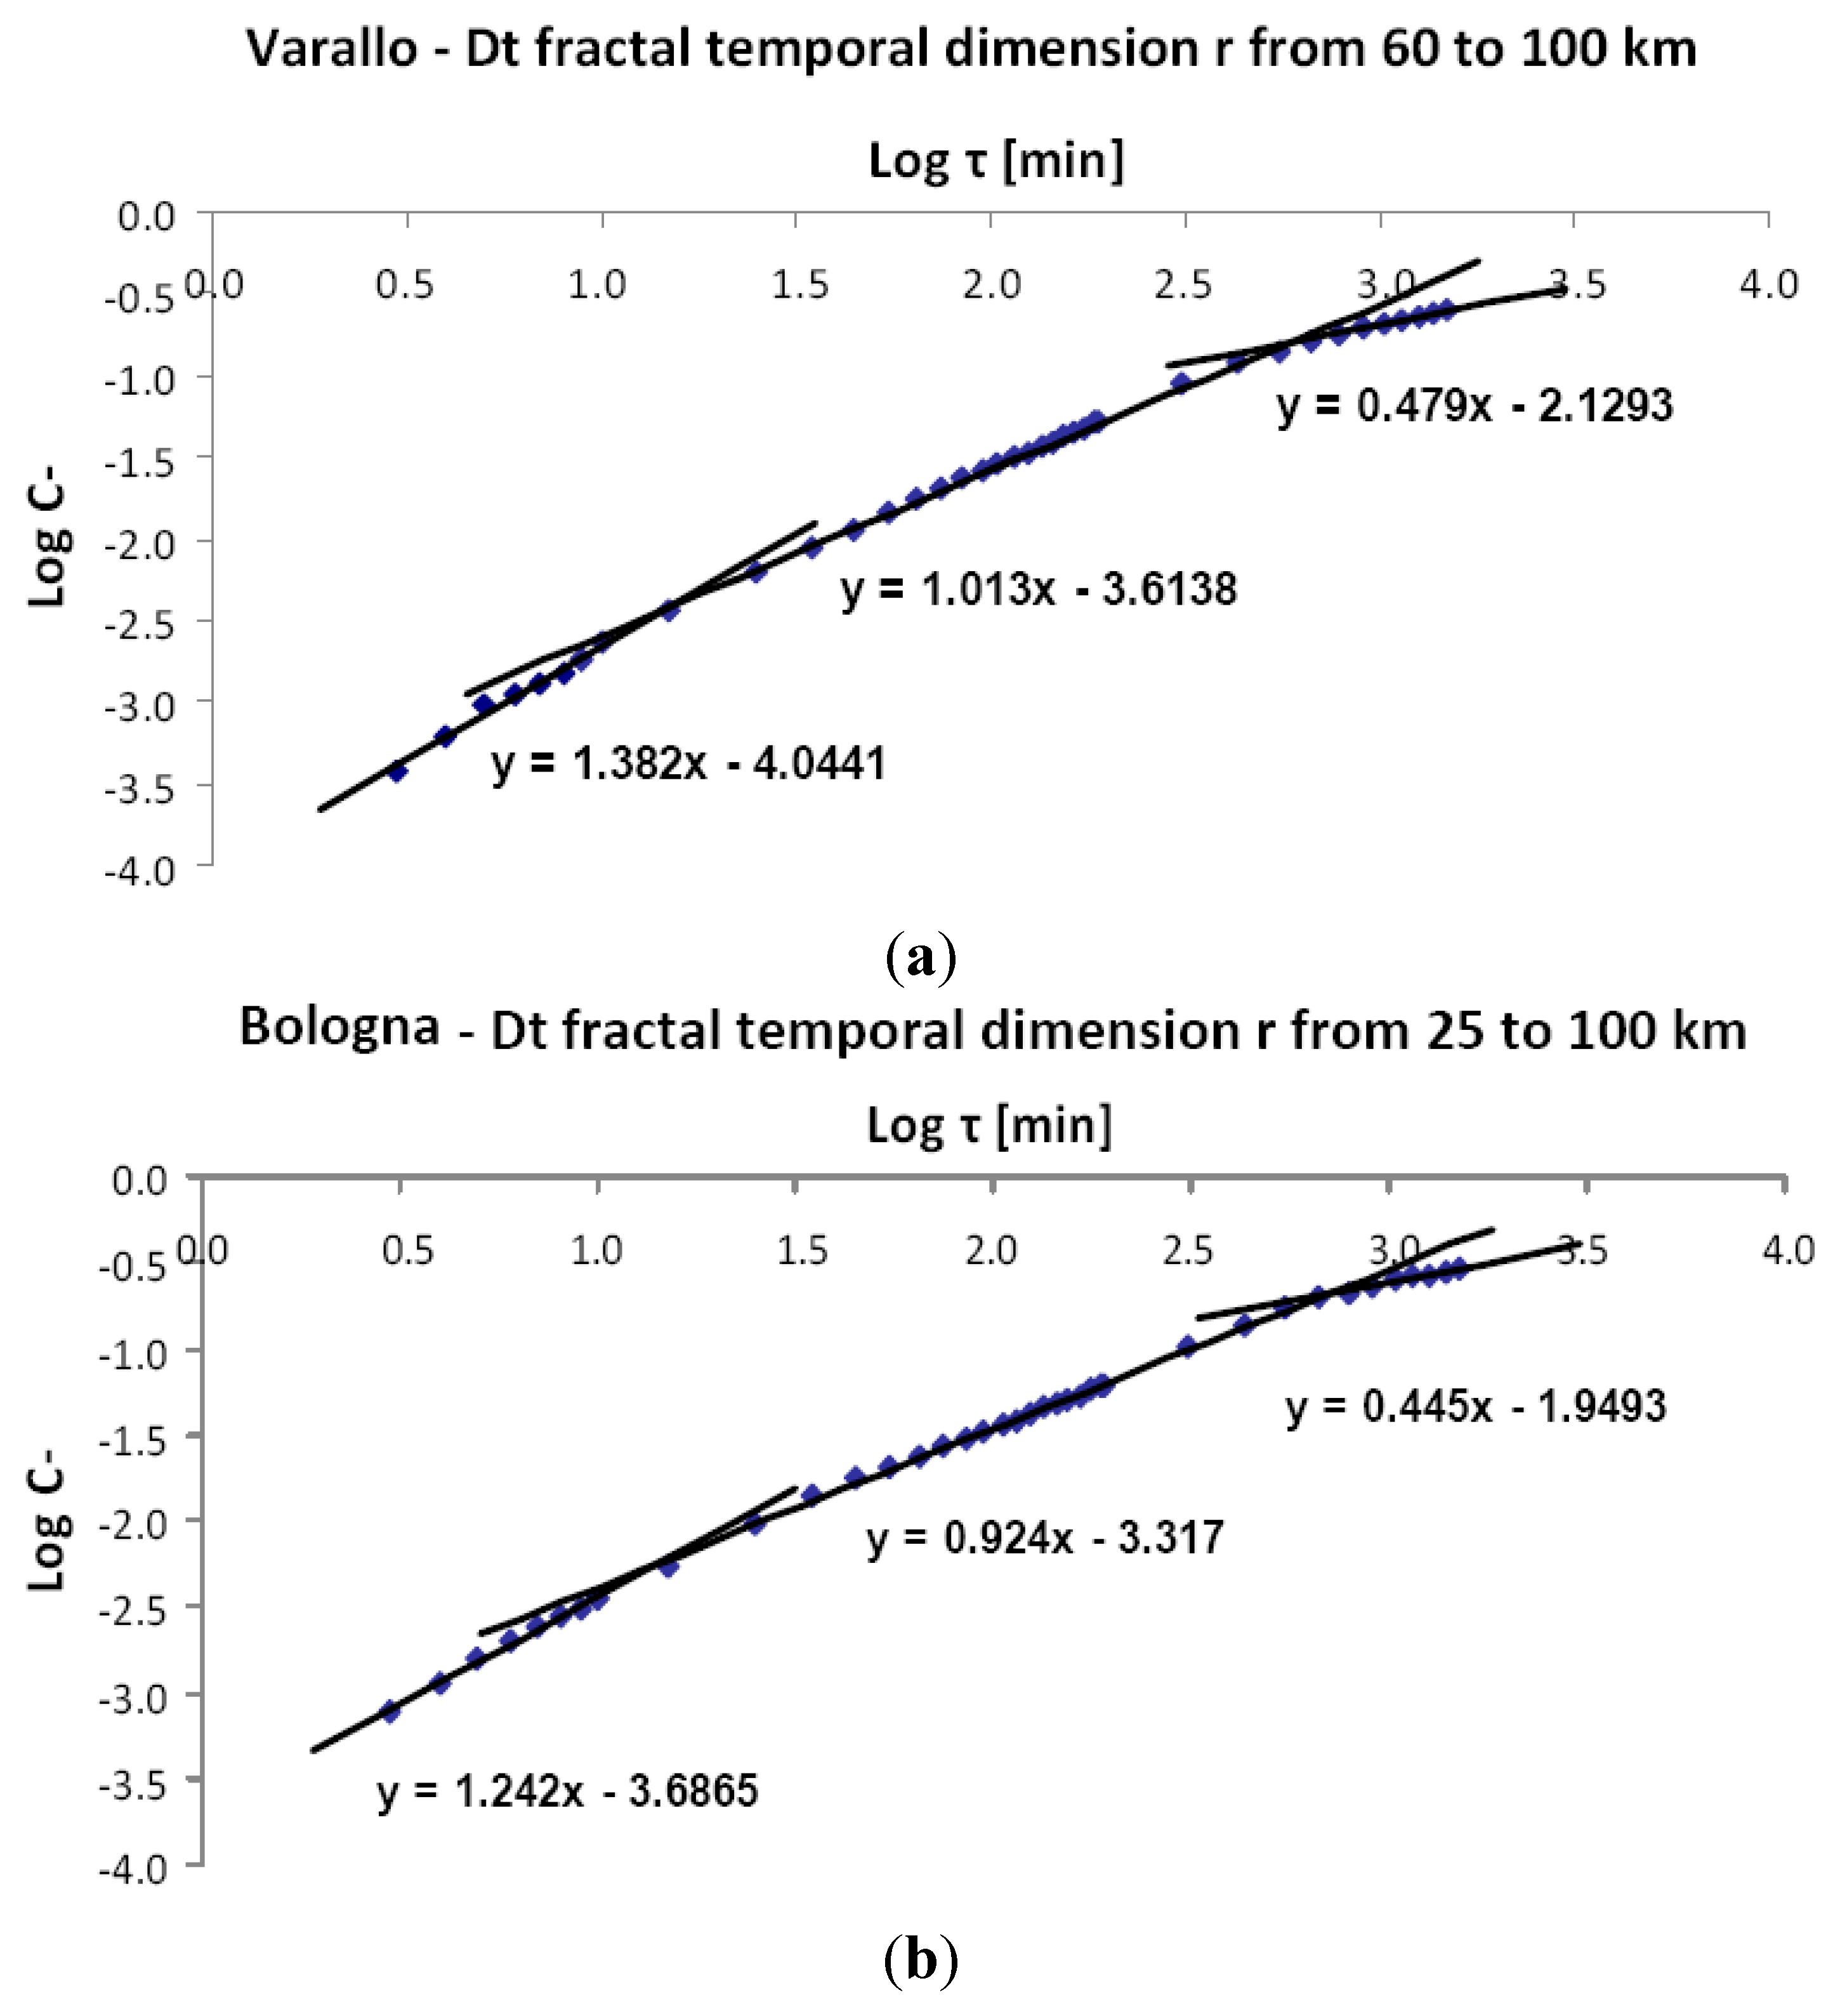
6. AE Clustering in Time as a Seismic Precursor or an Aftershock
Since the cumulative probabilities C±r(τ) are represented in a time domain ranging from 1 to 14–16 weeks, shorter values of τ are further investigated.
In particular, time coupling of regional seismicity to AE activity from Chapel XVII and the Asinelli Tower is analyzed in terms of Dt for τ ranging from 3 to 24 h after an earthquake occurrence, and from 10 min to 24 h before an earthquake occurrence.
The varying local slope
Dt of Log
C− vs. Log τ reveals that the AE activity following seismic events is not equally probable over the time (see
Figure 10a,b). For short time delays, τ = 3–10 min, high values of the time fractal dimension,
Dt = 1.38 and 1.24, indicate tight coupling of the AE activity to the earthquakes. In other words, AE bursts following an earthquake are more likely to occur within τ = 3–10 min after the seismic event. Then, such short time delays suggest a triggering action exerted by nearby earthquakes on damage processes of Chapel XVII and the Asinelli Tower. Contrarily, for τ ranging from 1.0 × 10
3 to 1.440 × 10
3 min, the obtained low values of
Dt, 0.48 and 0.45, suggest that the effects of nearby earthquakes on the structural damage evolution disappear after 24 h.
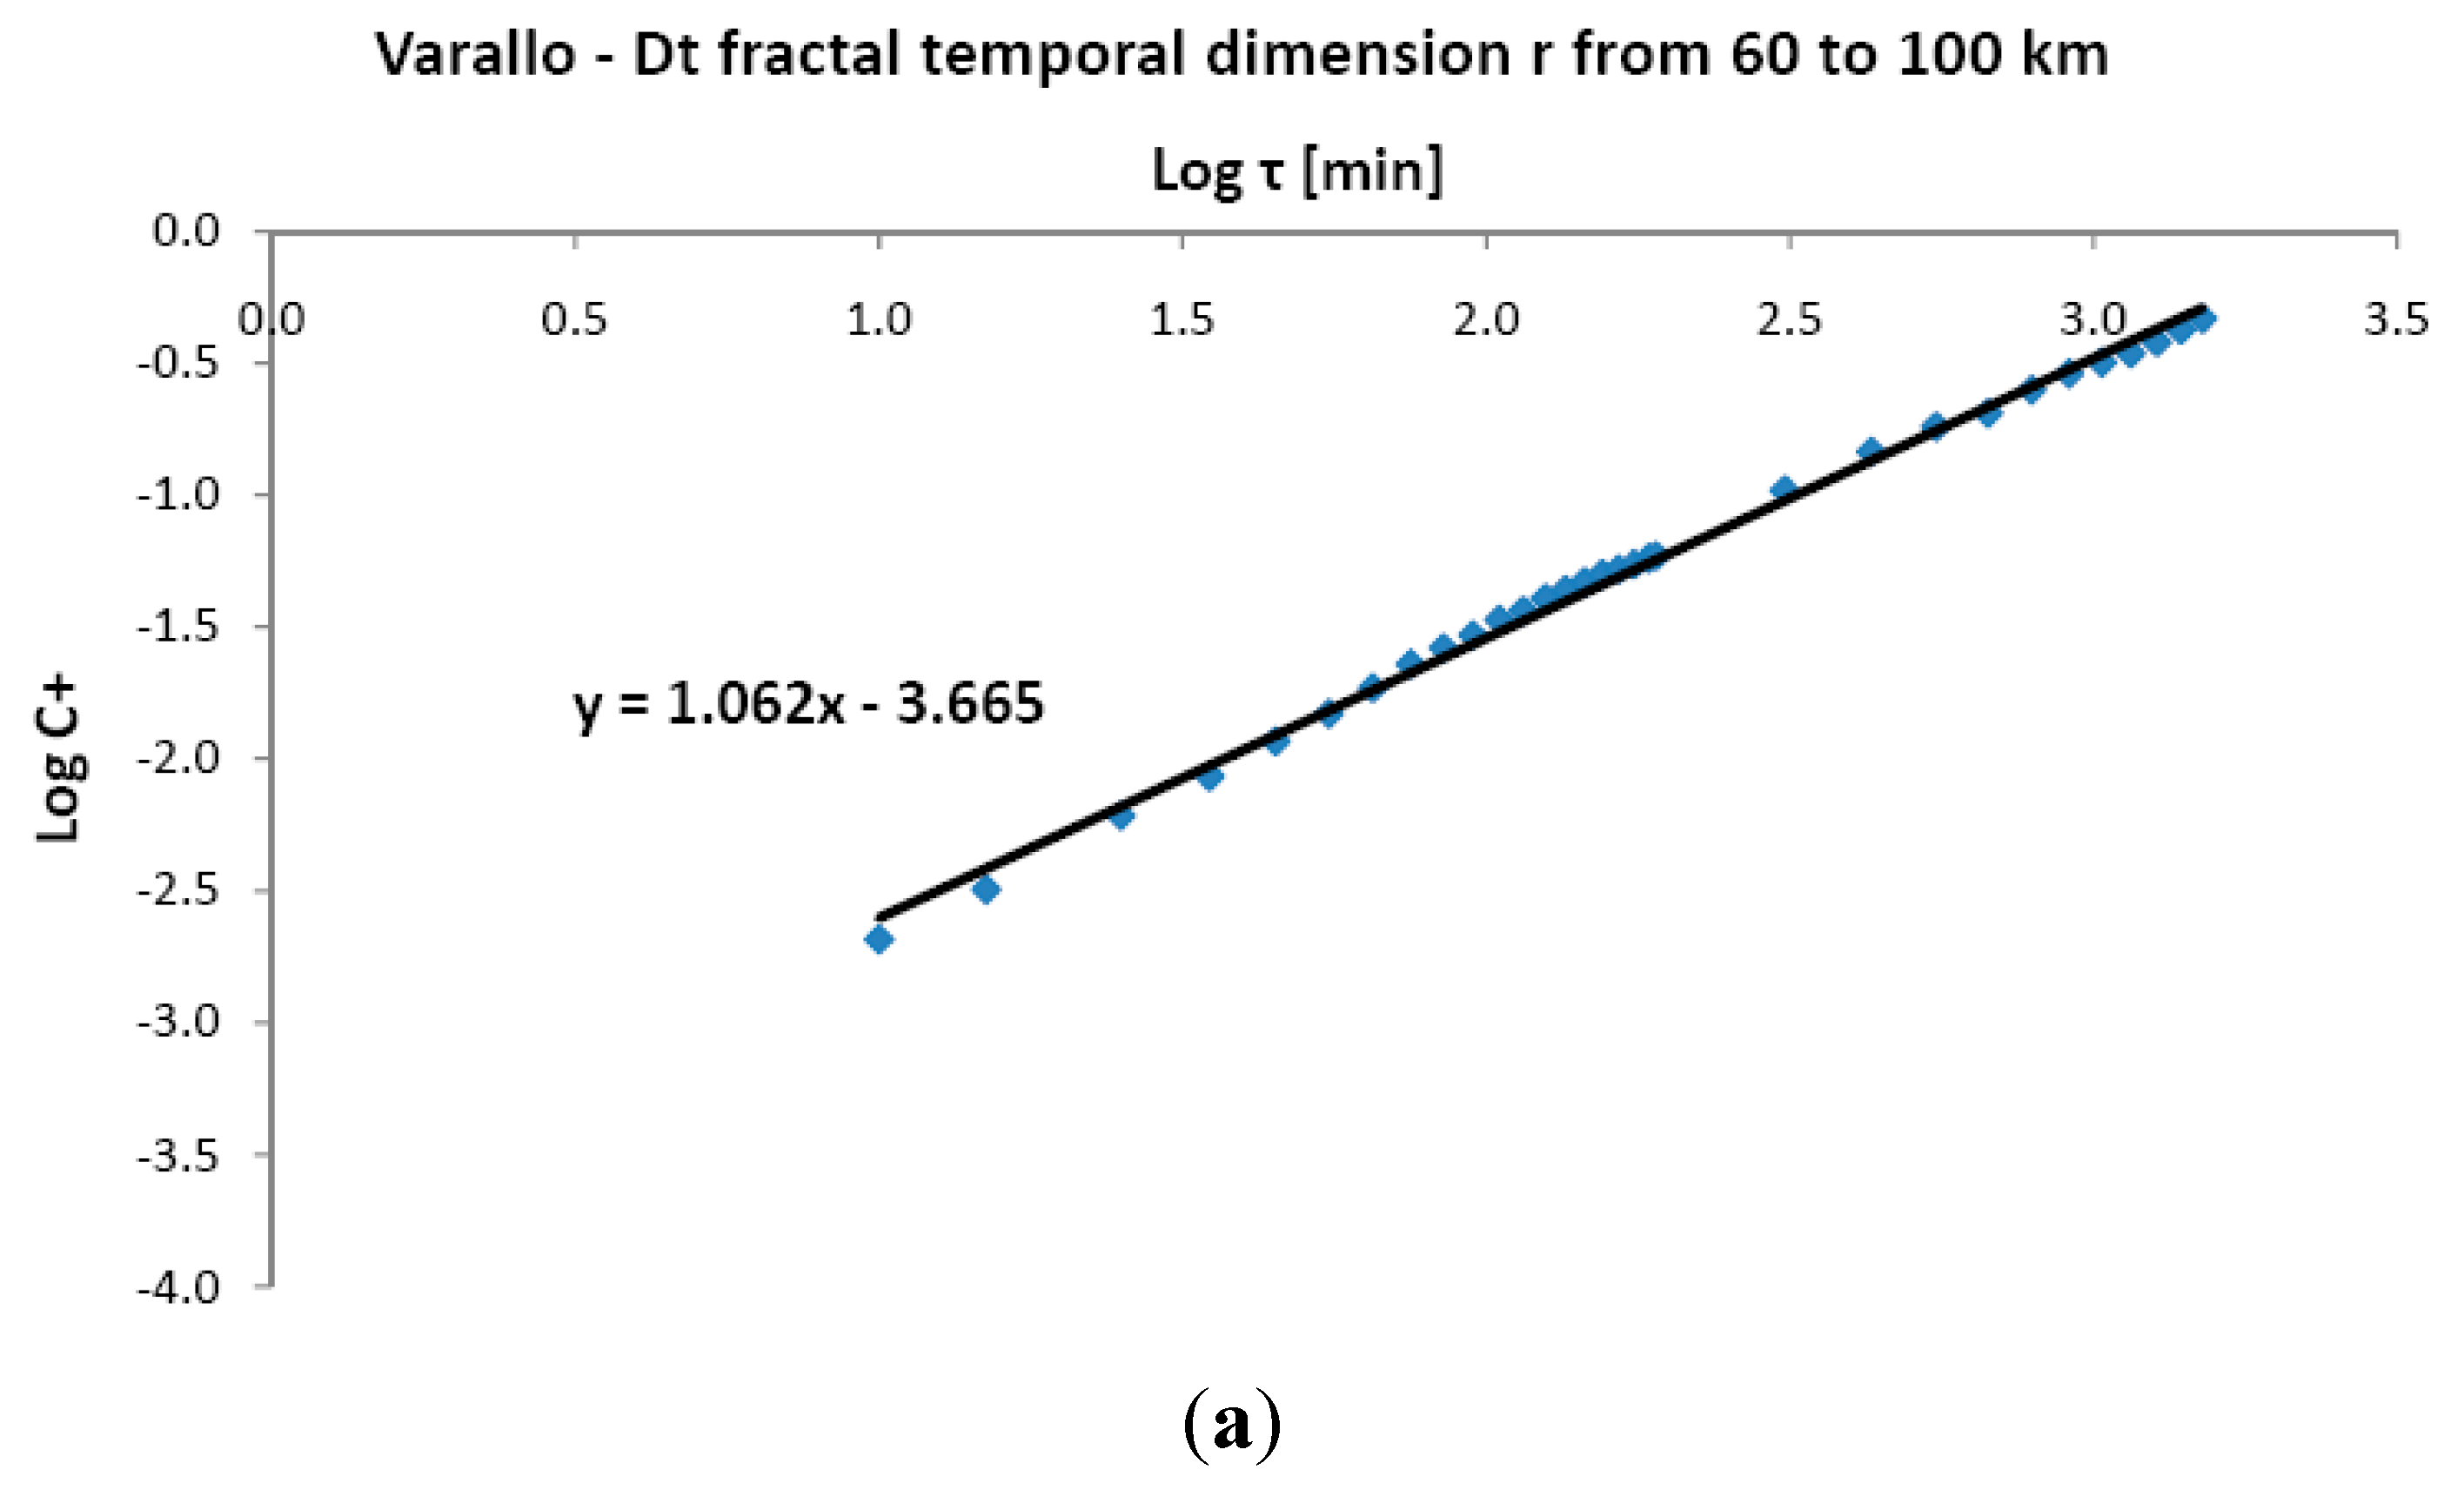
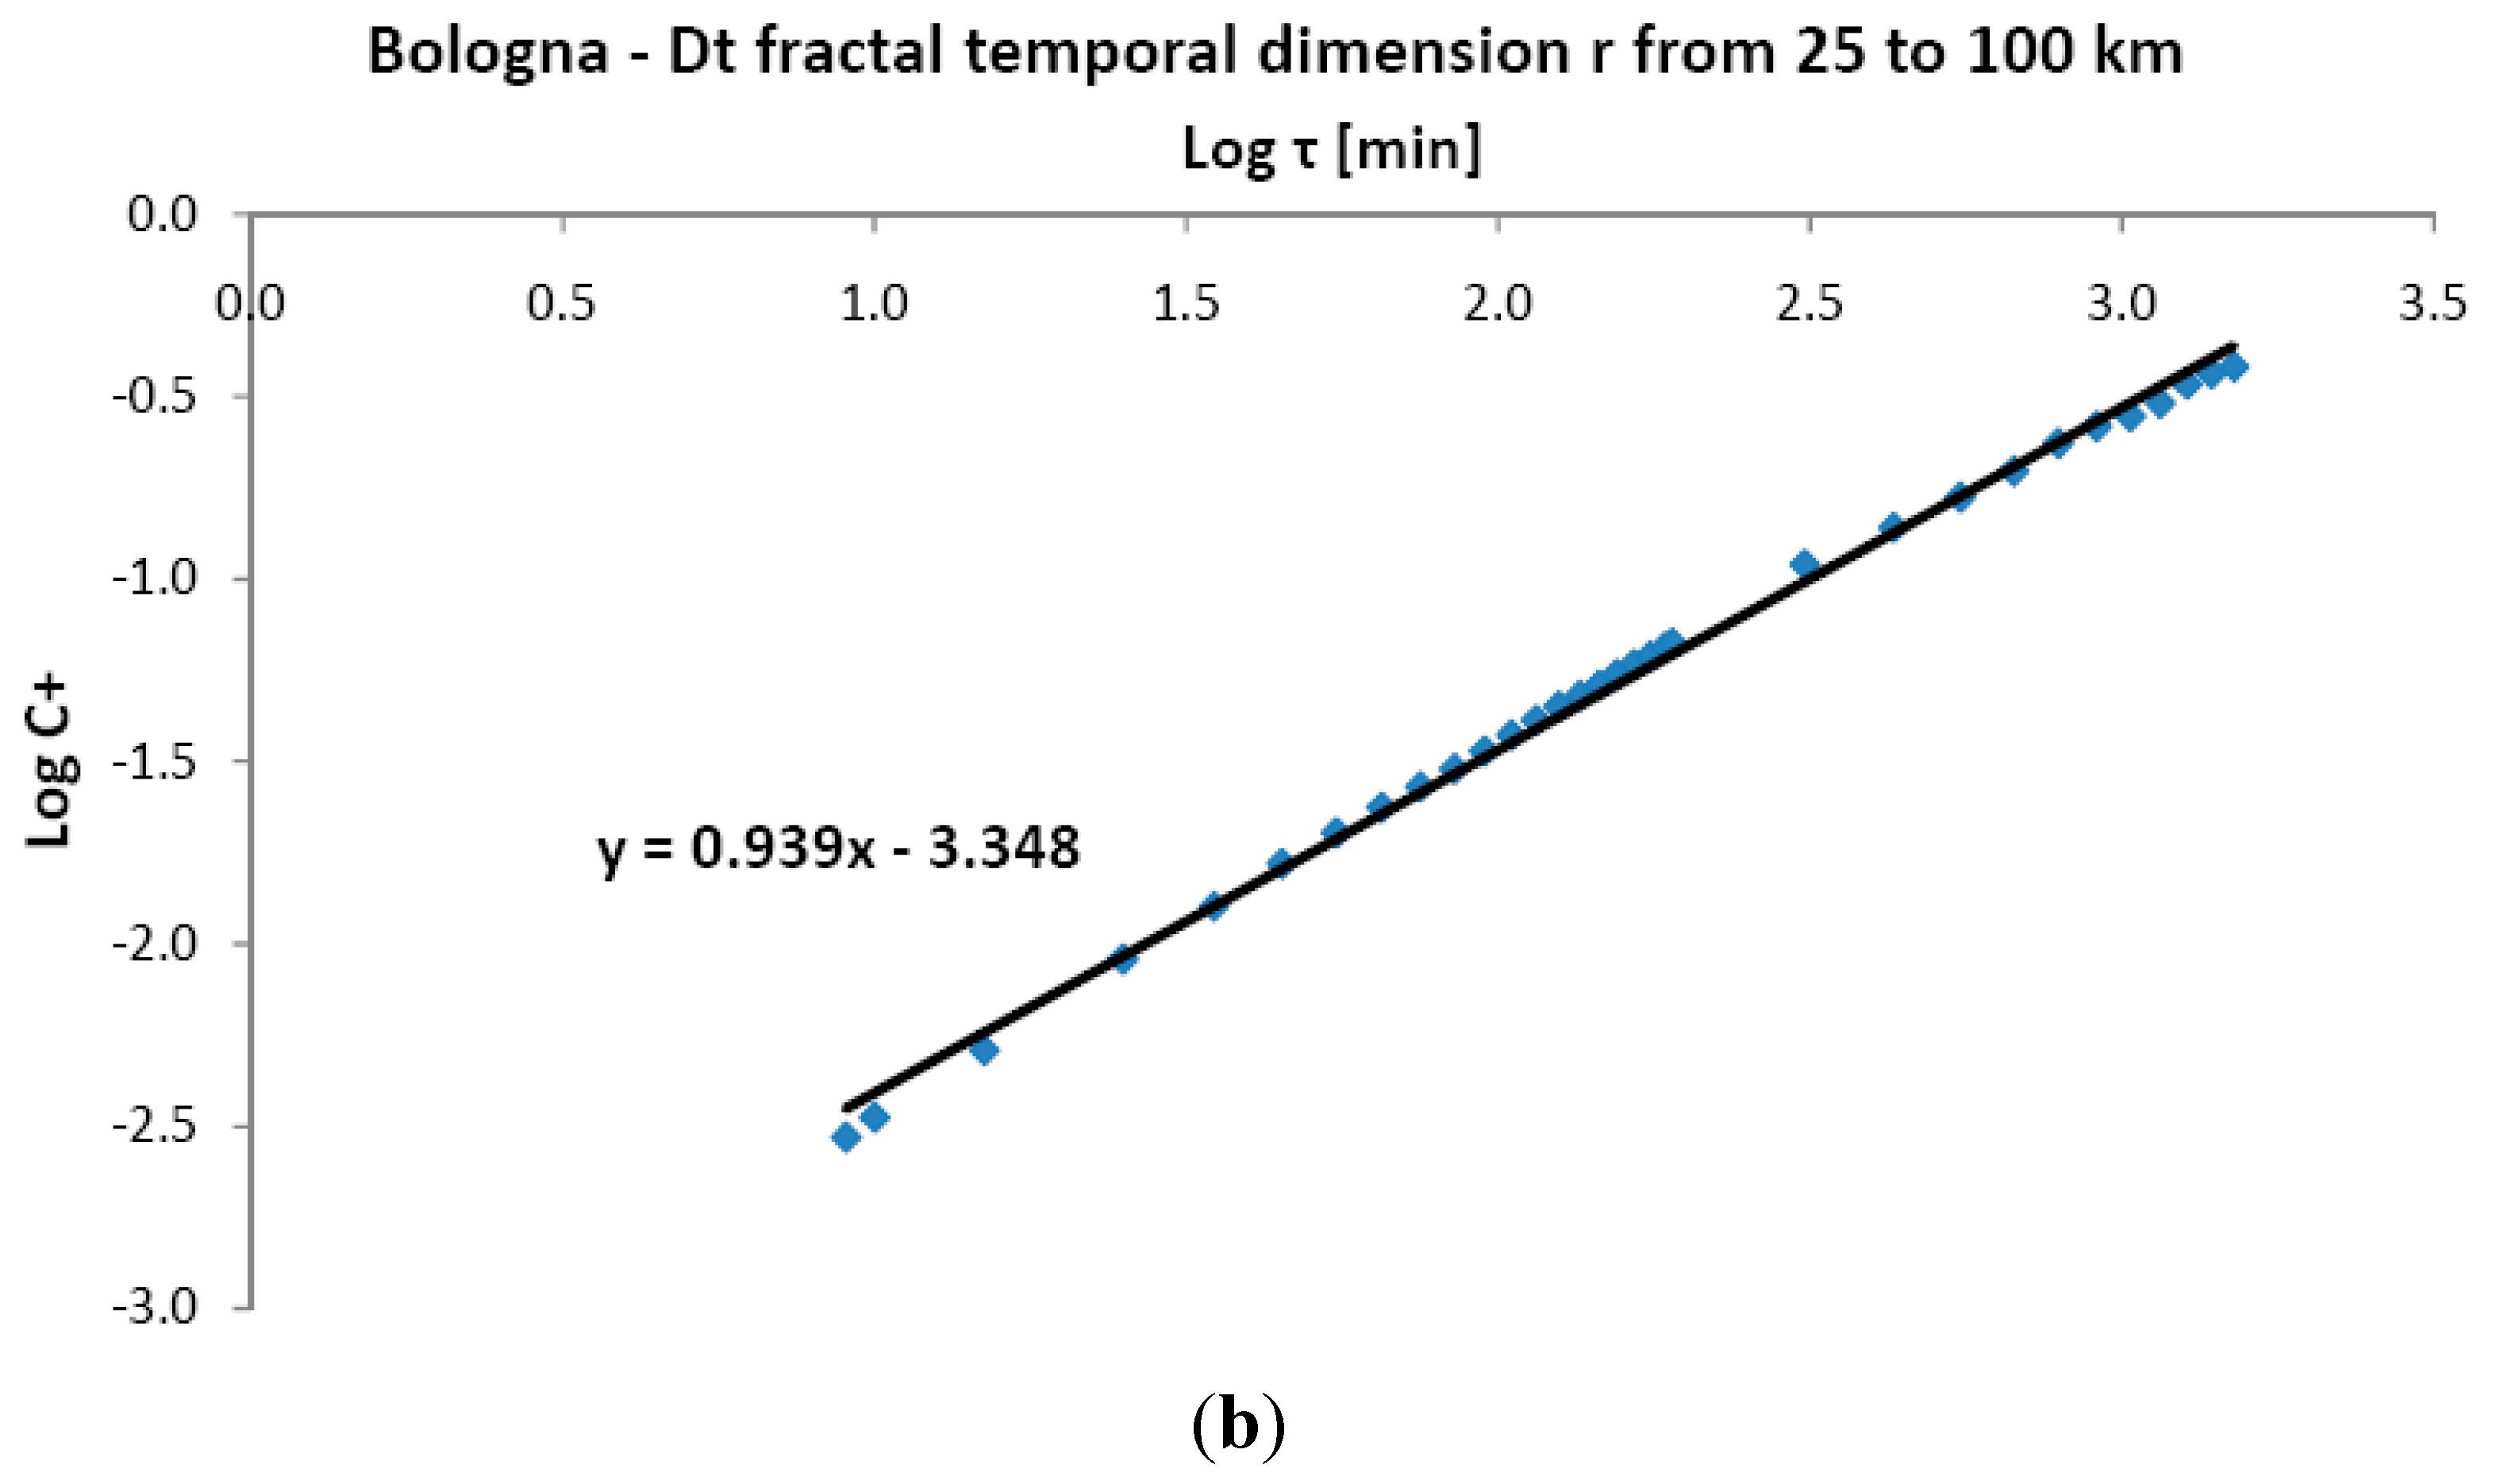
In regards to the AE events preceding earthquakes,
i.e., considering AE as “seismic precursors”, the linear bi-logarithmic plots of
C+ (
Dt = 1.06 and 0.94) shown in
Figure 11 describe a uniform probability density of finding AE events prior to an earthquake for a wide range of time intervals, up to
τ = 1.440×10
3 min. In other words, we observe a constant AE activity in the 24 h preceding an earthquake. The absence of accelerating precursive activity in the presented case studies confirms the need for further investigation, possibly with the aid of electromagnetic seismic precursors.
Figure 10.
Analysis of time-clustering features of AE events considered as “seismic aftershocks” by the time correlation dimension Dt, as a local slope of Log C− vs. Log τ. The time range for τ is 3 min to 24 h. The selected seismic events are all those considered during the defined monitoring periods. (a) Chapel XVII (Varallo); (b) Asinelli Tower (Bologna).
Figure 11.
Analysis of time-clustering features of AE events considered “seismic precursors” by the time correlation dimension Dt, as the local slope of Log C+ vs. Log τ. The time range for τ is 10 min to 24 h. The selected seismic events are all those considered during the defined monitoring periods. (a) Chapel XVII (Varallo); (b) Asinelli Tower (Bologna).
7. Conclusions
In order to assess the seismic hazard in different areas, it is suggested to observe the spatial and temporal correlation of seismic events and monitored AEs. It emerges that AEs behave as earthquake precursors. A statistical method of analysis is proposed, based on the Grassberger-Procaccia integral. It gives the cumulative probability of the events’ occurrence in a specific area, considering the AE records and the seismic events during the same period of time. Two important constructions of Italian cultural heritage were considered: the “Sacred Mountain of Varallo” and “Asinelli Tower”. Given the interesting premises that emerged from this study, the Grassberger-Procaccia integral could also be applied more extensively in several monitoring sites belonging to different seismic regions, not only for defining the seismic hazard, but also to handle it as an effective tool for earthquake risk mitigation.
However, the authors are aware that a rigorous investigation to ascertain the existence of crustal stress crises crossing areas of a few hundred kilometers’ radius during the preparation of a seismic event would require simultaneous and numerous operations of AE monitoring sites, adequately placed in the territory.


 ,
, 


