Article

Digitizing Historical Aerial Images: Evaluation of the Effects of Scanning Quality on Aerial Triangulation and Dense Image Matching

by
Adam Kostrzewa
1,
Elisa Mariarosaria Farella
2,
Luca Morelli
2,3,
Wojciech Ostrowski
1,
Fabio Remondino
2,* and
Krzysztof Bakuła
1
1
Department of Photogrammetry, Remote Sensing and Spatial Information Systems, Faculty of Geodesy and Cartography, Warsaw University of Technology, 00-661 Warsaw, Poland
2
3D Optical Metrology Unit, Bruno Kessler Foundation (FBK), Via Sommarive 18, 38123 Trento, Italy
3
Department of Civil, Environmental and Mechanical Engineering (DICAM), University of Trento, 38122 Trento, Italy
*
Author to whom correspondence should be addressed.
Appl. Sci. 2024, 14(9), 3635; https://doi.org/10.3390/app14093635
Submission received: 6 April 2024 / Revised: 21 April 2024 / Accepted: 22 April 2024 / Published: 25 April 2024
(This article belongs to the Special Issue Geo-Processing of Historical Aerial Images)

Abstract

:
In the last decade, many aerial photographic archives have started to be digitized for multiple purposes, including digital preservation and geoprocessing. This paper analyzes the effects of professional photogrammetric versus consumer-grade scanners on the processing of analog historical aerial photographs. An image block over Warsaw is considered, featuring 38 photographs acquired in 1986 (Wild RC10, Normal Aviogon II lens, 23 × 23 cm format) with a ground sampling distance (GSD) of 4 cm. Aerial triangulation (AT) and dense image matching (DIM) procedures are considered, analyzing how scanning modalities are important in the massive digitization of analog images for georeferencing and 3D product generation. The achieved results show how consumer-grade scanners, unlike more expensive photogrammetric scanners, do not possess adequate recording quality to ensure high accuracy and geometric precision for geoprocessing purposes. However, consumer-grade scanners can be used for time and cost-efficient applications where a partial loss of data quality is not critical.

1. Introduction

A few decades after the birth of photography, aerial photography has revolutionized the cartography and mapping field. From the earliest innovative experiments (by means also of balloons, kites, or pigeons), aerial photography has offered unprecedented vantage points of the world and broadened its knowledge. With the advent of World War I, airplanes started to be used for reconnaissance and mapping by both sides on the field, with aerial observers engaged in the manual sketching of maps depicting the situation on the ground [1,2,3]. Between the two World Wars, improvements in cameras, films, and hardware boosted aerial photogrammetry for surveying and mapping purposes.
The collected photographs are nowadays part of immense national collections, with millions of historical aerial pictures, sometimes damaged or at risk due to poor conservation conditions (mostly negligence during wartimes or inadequate and uncontrolled environments for storage, especially for temperature and humidity). Therefore, the long-term preservation of these films or paper prints is increasingly becoming a priority for archives, institutions, and National Mapping and Cadastral Agencies (NMCAs) [4] responsible for ensuring access to irreplaceable historical information for the most disparate purposes, such as land use and land cover–LULC—studies, urban planning, flooding and environment monitoring, archaeological investigations, glacier changes, bomb crater detection, etc. [5,6,7,8,9,10,11,12,13].
Besides applying different physical protection methods (like encapsulating paper prints in envelopes) or experimenting with re-photography techniques [14], the scanning/digitization of historical photographs was identified as a preferable and permanent solution for preserving their content since the advent of the digital era. Indeed, with the beginning of digital photogrammetry in the 1990s, digital image processing became part of the photogrammetric practice [15], and the use of specialized photogrammetric scanners and ad hoc pipelines for aerial image digitization [16] started to be included in the photogrammetric processing workflow [17]. In Refs. [18,19,20] evaluated the quality of images digitized with regular/standard scanners as an alternative to professional solutions, considering that funds, hardware, and time restrictions for NMACs usually limit the number of analog photos digitized in their archives. Results showed that aerial photographs scanned by a non-professional scanner satisfy accuracy requirements for topographic mapping not better than the 1:5000 scale.
Photogrammetric scanners, such as Leica DSW 700, Vexcel UltraScan 5000, Zeiss SCA, etc., were realized with linear or area sensors and designed explicitly for aerial imageries. They were born to ensure high geometric and radiometric accuracy in the analog-to-digital transformation process, besides performing, in many cases, also part of the photogrammetric tasks, like measurements of fiducials and the generation of image pyramids [16]. Fiducial marks are sets of physical marks generally positioned on the corners or edge-centers of aerial photographs that are useful for defining the reference for spatial measurements. The coordinates of fiducial marks [21], focal length, principal point, and distortion parameters for determining the interior orientation (IO) of the historical photographs are generally reported in the calibration certificates. However, this information is frequently missing for the oldest photographs, and a virtual reference system needs to be established for the pixel-to-image coordinates transformation [22,23].
In the case of images acquired for mapping purposes with flights conducted under adequate weather conditions and stereo-coverage/overlap, the potential of their digitization is amplified by the possibility of extracting geometric information through photogrammetric processes [22,24]. The development in the last years of more efficient tools and algorithms for the 3D processing of digital images and the increasing automation of the reconstruction process opened new opportunities for the full exploitation of historical images [23,25,26]. The fully automatic matching of image features included in current photogrammetric software is typically based on traditional hand-crafted approaches, such as SIFT [27], ORB [28], or SURF [29].
Although these methods proved to be effective for image matching tasks, in the last years, deep-learning approaches and hybrid processing pipelines have also emerged and been demonstrated to often overcome common limitations of traditional methods, e.g., multi-temporal data, radiometric changes, etc. [30,31,32,33,34]. Learning-based methods started to be applied to historical images for 4D urban reconstruction purposes [26,35,36]. At the same time, the improved performance of conventional and learning-based dense image matching algorithms [37,38,39,40] open unprecedented chances of revitalizing vast collections of historical photographs through the extraction of detailed and accurate digital surface models (DSMs), facilitating scene understanding and supporting multi-temporal studies [41,42,43,44,45].

Aim of the Paper

Since photogrammetric scanners are expensive and not as commonly available anymore and as historical image collections are vast, it is important to understand the potential and results of consumer-grade scanners with respect to high-end photogrammetric scanners. Nowadays, most of the first-generation photogrammetric scanners (i.e., the most diffuse in mapping agencies and archives) are not manufactured anymore, and they require periodic maintenance, with frequent difficulties and high costs in the case of repairs [17]. Therefore, in this paper, we want to investigate and shed light on the possible benefits and limitations of professionals versus consumer-grade scanners to find the best trade-off among investment costs, data quality, and the amount of content digitally preserved. 
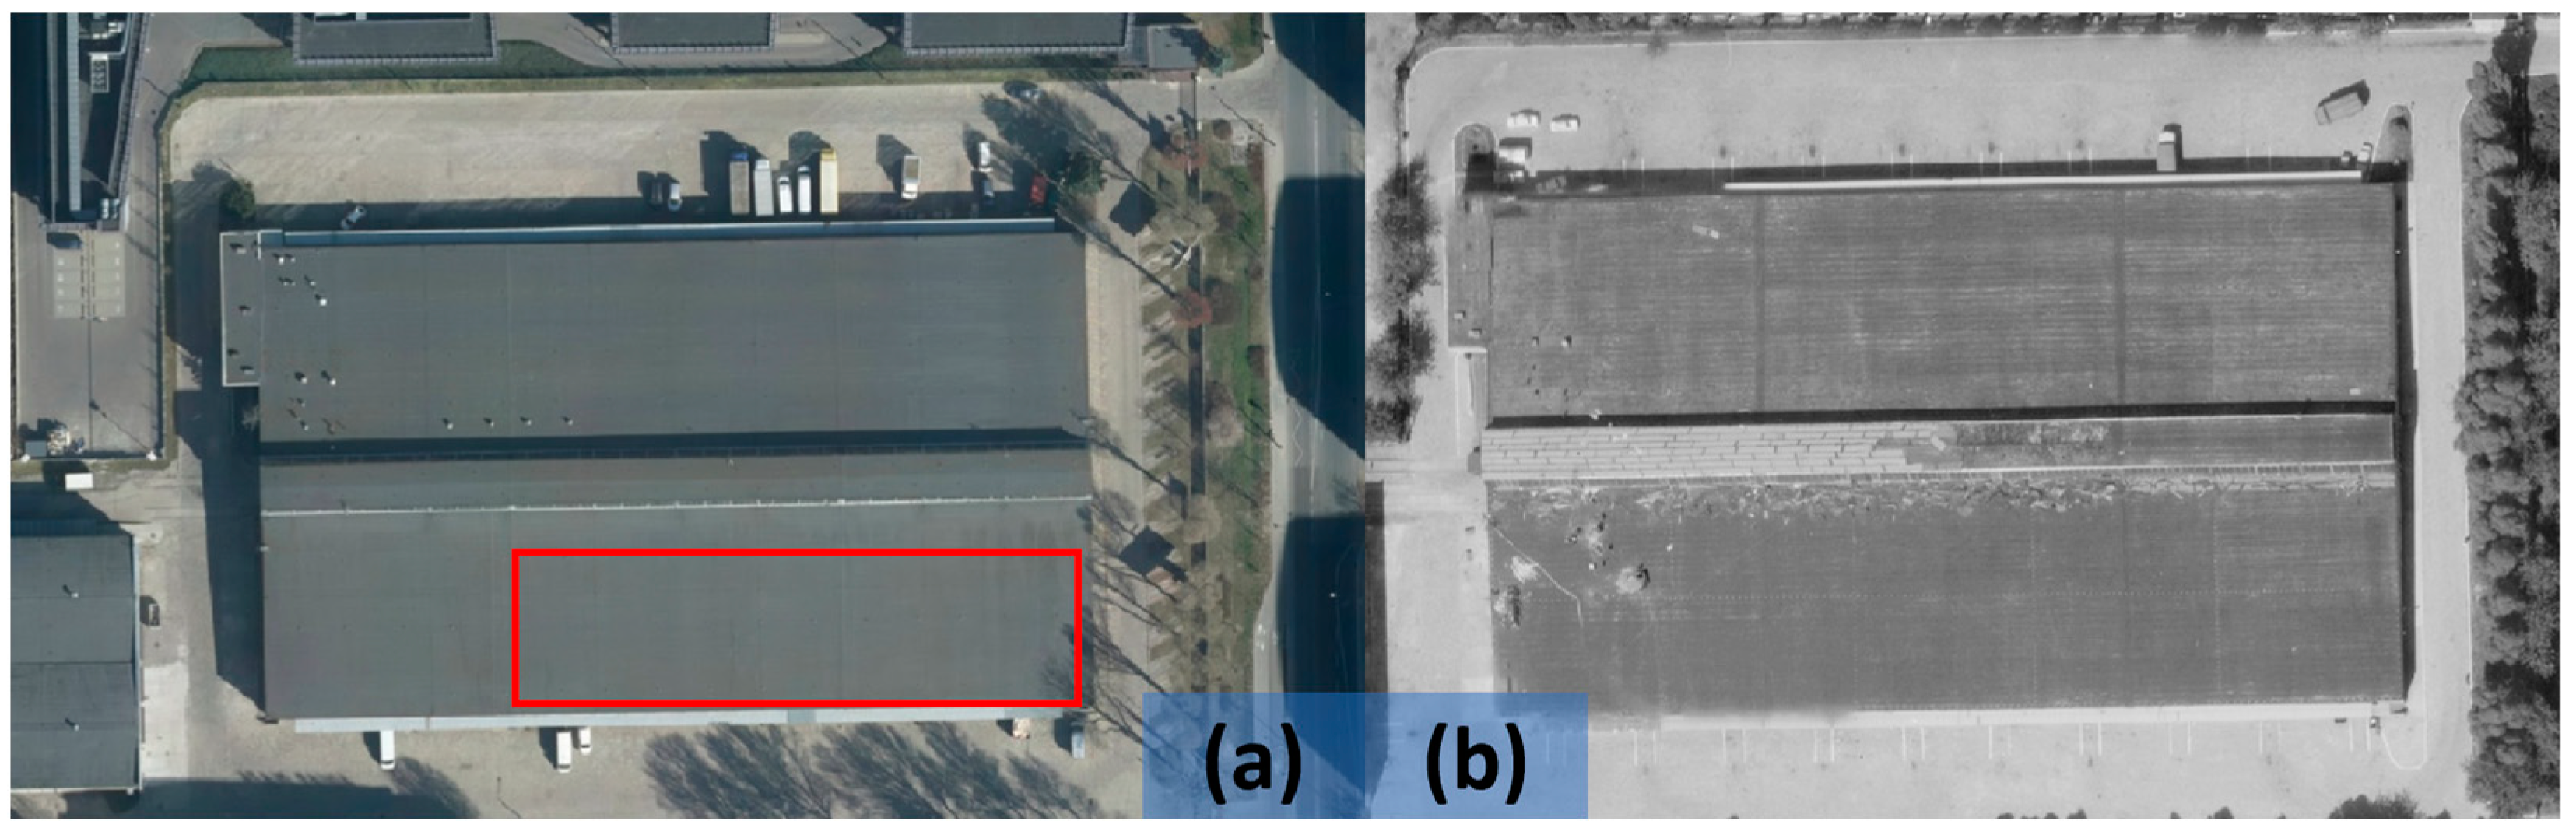
Figure 1 shows a part of a historical photograph digitized with two different scanning technologies at the same magnification and unchanged contrast. Although the image contents are frequently preserved with both solutions, the effects of scanning choices still need to be investigated in terms of potentialities and bottlenecks for 3D reconstruction purposes. Thus, the following sections examine the impact and outcomes of aerial triangulation (AT) and dense image matching (DIM) when using two different scanning solutions (professional vs. consumer-grade instruments) for the digitization of analog historical aerial photographs.

2. Materials and Methods

2.1. Image Dataset and Reference Data

The study area is located in the Warsaw district of Służewiec (Poland—Figure 2). This area was a former industrial part of the city that was converted into the new business center. It covers 5.765 km2 and counts almost 640 residential buildings built between 1986 and 2012, which are mainly unchanged. Many production buildings were adapted (often partially) to new functions, with a large variability of shapes in a relatively small area. Figure 3 shows the test area, as visible in the orthoimages produced from the 1986 and the 2021 aerial datasets (Figure 3a and Figure 3b, respectively).
The 1986 analog images were acquired in May 1986 on a 23 × 23 cm film with a Wild RC10 photogrammetric camera and a Normal Aviogon II lens (focal length of 213.75 mm). The block consists of 38 photographs acquired for surveying purposes in 5 strips north–south oriented, at the scale of 1:3000. The analogue photographs were scanned with a professional/photogrammetric and a consumer-grade/regular scanner with a resolution corresponding to a ground sampling distance (GSD) of 4 cm (Table 1).
To properly georeference the archival images (Figure 4a), a GNSS RTK surveying campaign was carried out using a Leica VIVA GS15 receiver. The 3D coordinates of 154 stable-over-time ground points were acquired in correspondence with features (such as manhole covers) that remained unchanged over the last 40 years. Figure 4a shows the camera network derived from the 1986 aerial block while Figure 4b and Figure 5 show the distribution and locations of unchanged points measured in the field. To improve the accuracy of GNSS, we used the precise satellite positioning system ASG-EUPOS (Active Geodetic Network–EUPOS). It is a project of a reference station system designed for Poland carried out by the Polish authority for geodesy–Head Office of Geodesy and Cartography. It is a part of the European Position Determination System (EUPOS). Using different observation methods, reference station systems can provide real-time corrections that are used by GNSS receivers in the field to calculate positions with better precision [46]. The accuracy of the 154 GNSS points measured in kinematic (RTK) resulted in 0.03 (horizontal) and 0.05 m (vertical).
Among the available GNSS-based ground points, 44 well-distributed points clearly visible in the historical dataset (Figure 6a) were used for the photogrammetric aerial triangulation (AT) process (31 check points [CPs] and 13 ground control points [GCPs]).
On the other hand, an airborne laser scanning (ALS) point cloud acquired in 2012 (Figure 6b) was used to assess the quality of the dense image matching (DIM) process with historical images (Section 3.2). The ALS data obtained with LiDAR technology has a density of 12 pts/m2 and a vertical accuracy of 0.10 m [47]. The remaining 110 GNSS-based ground points were used for the vertical accuracy assessment of the DIM point cloud (Section 3.2.1).

2.2. Methodology and Processing Workflow

The processing workflow used to analyze the impact and effects of scanning quality on AT and DIM accuracy is shown in Figure 7. The experiments were performed using the same image dataset scanned with different technologies (photogrammetric and consumer-grade scanners) and the same image coordinates of the GCPs and CPs, testing two photogrammetric tools: Trimble Inpho (ver. 5.7.2.) and Agisoft Metashape (ver. 1.8.4.) (referred to in the following sections simply as Inpho and Metashape, respectively). We compared the AT results (Section 3) obtained using the two processing tools, as well as the effect of camera self-calibration.
In the analog era of aerial photogrammetry, airborne sensors were equipped with at least four fiducial markers that were helpful in determining the relationship between the image and the camera space. Their image coordinates (x, y) were determined and certified in the camera calibration process to unambiguously resolve the interior orientation of each image. An example measurement of the fiducial markers in Inpho is shown in Figure 8.
The AT in Metashape also included camera self-calibration for the calculation of additional parameters. No self-calibration in Match-AT Inpho was performed due to the limited flexibility in using additional parameters. Therefore, it was more valuable to compare AT results from professional software for large-format aerial photography (Inpho) vs. software dedicated to close-range photogrammetry and low-altitude imaging (Metashape). Once the initial transformation between the pixel and camera coordinate systems was computed, GCPs and CPs were measured in Inpho and used for the AT in both tools. However, a manual correction of point projections was necessary in Metashape with the consumer-grade scanner data. Indeed, some offsets were evident due to geometric distortions introduced in the scanning process.
Finally, the quality of the derived DIM products was evaluated against reference ground truth data (Section 2.1), comparing dense point clouds elaborated with the two different processing parameters.

3. Results

3.1. Aerial Triangulation (AT)

3.1.1. Interior Orientation with Fiducial Marks

The Wild RC10 camera was calibrated on 3 March 1988. Fiducials were manually measured on both consumer-grade and photogrammetric datasets in Inpho and Metashape and an affine transformation was computed. Table 2 reports some statistics on the quality of fiducial measurements in Inpho. Sigma0 is the root of the square sum of residuals divided by the number of observations minus the unknowns. The root mean square error (RMSE) is calculated as the root of the squared sum of residuals divided by the number of observations. The achieved values show that the measurement of fiducial markers was performed on the photogrammetric dataset with an average accuracy for all images of about 0.6 pixel whereas an accuracy of 3–4 pix was observed for the consumer-grade dataset (1 pix corresponds to 14 µm).

3.1.2. Bundle Adjustment

The image coordinates of 44 GNSS-based points (31 GCPs and 13 CPs) were measured in Inpho and used for the AT also in Metashape to avoid further measurement bias in the image observations. Considering that the camera shows limited radial distortions, the Metashape frame camera model was used, which corresponds to a central projection camera with Brown’s distortion model. With the optical center at the original position, the Brown’s distortion model divides the total distortions into two components in polar coordinates along the radius and in tangential directions with the center on the imaging plane.
Table 3 reports interior and additional parameters, including estimated errors (standard deviation), computed in Metashape: focal length (F), principal point coordinates (Cx, Cy), affinity and skew-non-orthogonality transformation coefficients (B1 and B2), radial distortion coefficient (K1, K2, K3), and tangential distortion coefficients (P1 and P2).
The focal length was not estimated, as the value reported in the camera calibration certificate was considered reliable. This is a common approach in the case of working with historical aerial images [22,48]. The principal point values (Cx, Cy) in the photogrammetric dataset are very close to the values that are recorded in the camera’s calibration report (Cx = Cy = −6 µm). In the consumer-grade dataset the principal point coordinates were moved more than 0.5 px. B1 and B2 values for a consumer-grade scanner are 25–30 times higher than values for the professional-grade scanner; this means that the consumer-grade scanner images have much higher affine distortions caused by the lower quality scanning mechanism. It is worth noting that errors for every parameter (Cx, Cy, B1, B2, K1, K2, K3) are 2–3 times higher for the consumer-grade scanner compared to the professional scanner.
AT results have been evaluated in terms of root mean square error (RMSE) of CPs (Table 4). The photogrammetric dataset outperforms the regular outputs with both software (with more marked differences in the Inpho results), underling the importance of high-quality scanners to maximize the accuracy in the 3D object space. Comparing AT results for a single dataset (photogrammetric or consumer-grade), the use of self-calibration in Metashape reduces the impact of the scanning technology and improves the achieved results.

3.2. Dense Image Matching (DIM)

The dense image matching algorithms in Inpho (Match-T) and Metashape are entirely different. In Inpho, the “3 px” default parameter (3× GSD) for the generation of dense point clouds/DSM is used [49]. On the other hand, the “high” level—2× GSD—is the usually adopted option in Metashape. With these two approaches, densities of 69 pts/m2 (Inpho) and 156 pts/m2 (Metashape) are expected. To expand the DIM analysis, a 1 px (1× GSD) point cloud density in Inpho and the “medium” density (4× GSD) are also chosen. In each configuration, a dense point cloud is generated and compared with the available reference data (Section 2.1).

3.2.1. Analysis Based on Reference Points

A digital elevation model (DEM) with a pixel size of 10 cm was generated in ESRI ArcGIS Pro (ver. 2.8), rasterizing each image-based DIM point cloud using the binning maximum interpolation type and void fill method using the nearest neighbor. The elevation data were compared with available 110 GNSS measurements (the points not used in the AT process). Results are reported in Table 5 and visualized on the histogram in Figure 9.
The results do not show significant differences. The mean of height differences varies between 0 and 3 cm, which proves that there is no systematic error (constant offset between surfaces). Only the photogrammetric dataset processed with Inpho at 3 pix obtained a higher average value of almost 6 cm.
The RMSE values for the photogrammetric set in both software are in the range of 20–22.5 cm. The RMSE for the regular dataset in Inpho reaches values closer to those of the photogrammetric dataset, 20.7–23.7 cm, while in Metashape, it is higher—29.1–30.7 cm. This may also be caused by the fact that these point clouds are sparser than the Inpho results. The maximum and minimum values do not necessarily indicate the poor quality of the performed dense image matching; it could also be due to terrain changes between the historical images (1986) and the reference data (2012).

3.2.2. Analysis Based on DSM Profiles of Ground Areas

The available LiDAR DSM (Section 2.1) was used to geometrically verify the DIM results. However, the time difference between the available LiDAR and the image-matching DSMs (ca 26 years) suggested performing comparisons based on profiles in unchanged areas. This would avoid considering vegetation growth, landscape changes, urbanization, demolishment, or the installation of new facilities. Three sample areas, sectioned by 30 m lines, were selected: (1) an unaltered asphalt road characterized by an unambiguous and relatively even surface plane (Figure 10), (2) a concrete open-air basketball court (Figure 11) and (3) an unaltered parking lot (Figure 12). In all three areas, height differences along the profiles show large discrepancies with respect to the reference LiDAR. Table 6 reports the RMSEs of the differences with values up to 50 cm in the case of the consumer-grade scanner dataset. Profiles from the photogrammetric scanner dataset are generally less noisy, highlighting the importance of the scanning capabilities. Table 6 also shows that high-density image matching generally produces more noisy results. Note that these reported results are restricted to the tested scanners and depend on the specific software and version evaluated.

3.2.3. Analysis of Roof Areas

Several examples of unaltered building roofs were selected. First, a profile crossing a high building is considered. Figure 13a reports the different profiles for each point cloud. The dataset scanned with a consumer-grade scanner and processed in Metashape presents a height offset of about 1 m with respect to the other data. It is also worth noting the transition between the ground and the roof, with a significant smoothing effect, except for Inpho, on the photogrammetric dataset. The shaded side of the building proves that both DIM methods struggle to reconstruct the ground near the building.
Other building roof areas were instead compared with the available LiDAR reference using a cloud-to-cloud distance within CloudCompare [50]. Visual examples are reported in Figure 14, Figure 15 and Figure 16, whereas statistics (total number of points, point density in the chosen area, average deviation of points from the reference cloud, and standard deviation) are presented in Table 7, Table 8 and Table 9.
In all examples, the lowest mean values are obtained in the photogrammetric dataset, whereas in the consumer-grade dataset, for both DIM methods, errors are much larger. After analyzing the standard deviation values, we note that the value is similar for each set, meaning that the data are internally consistent in the same range (comparable noise).
These examples of building roofs show how the photogrammetric dataset provides significantly better results with up to 1–2 GSD size accuracy and contains fewer outlier points. The dataset from the consumer-grade scanner provides more significant uncertainty and a larger average obtained against the reference LiDAR data.

4. Discussion

Historical aerial photographs are an invaluable cultural resource, allowing us to study information on land cover and land use changes with high spatial and temporal resolution. The scanning of such datasets is the first step of the digitization process. To obtain the highest accuracy, photogrammetric scanners should be preferred to consumer-grade scanners, even if they are much cheaper instruments. Photogrammetric scanners, in fact, have been manufactured to minimize scanning artifacts and the distortion or loss of spatial and radiometric resolution during digitalization [17].
Digital copies of analog photos made by consumer-grade scanners provide insufficient resolution and geometric accuracy. In processing the camera’s interior orientation while measuring the fiducial marks, it provided lower measurement accuracy between the 2.5–5.5 pixel size (35–77 µm) compared to measurements on the photogrammetric scanner data of a 0.2–1.1 pixel size (3–15 µm), which implicates less accurate measures of 5–10 times on the digital images.
The successive bundle adjustment and AT are affected by errors in image measurements. First, unchanged terrain details were measured in the field using GNSS technology and used as GCPs and CPs. Typically, to collect 4D ground control points, fast and cheap methods consisting of geo-referenced maps or orthoimages are used to derive planimetric coordinates and DSM or trigonometric fix points for altimetric coordinates [24]. Topographic surveying methods, which are more time-consuming, are less often performed for this purpose [22]. Point coordinates measured with the GNSS method provided reliable reference data with excellent accuracy to perform some analyses to check the quality of products from historical images. In the AT process, better results were obtained for the photogrammetric scanner than for the consumer-grade scanner (sigma naught of 8.4 µm and 0.6 px with respect to 12.8 µm and 0.9 px, respectively). For the RMSE of check points, an accuracy of X = 13, Y = 10, and Z = 12 cm in Metashape was obtained compared to the RMSE of X = 43, Y = 23, and Z = 23 cm in Inpho software. Applying self-calibration to both datasets in Metashape improved the results obtained in the AT process by 0.4 pix for sigma in the photogrammetric set and 0.2 pix for sigma in the regular set. The RMSE of check points with camera self-calibration improved results significantly for the consumer-grade dataset. The total XYZ RMSE was reduced from 54 cm in Inpho to 36 cm in Metashape. It means that a camera calibration for computing additional parameters like B1, B2 (affinity and skew-non-orthogonality), K1, K2, K3 (radial distortion coefficients), P1, and P2 (tangential distortion coefficients) effectively improves the quality of measurements in images scanned with a consumer-grade scanner.
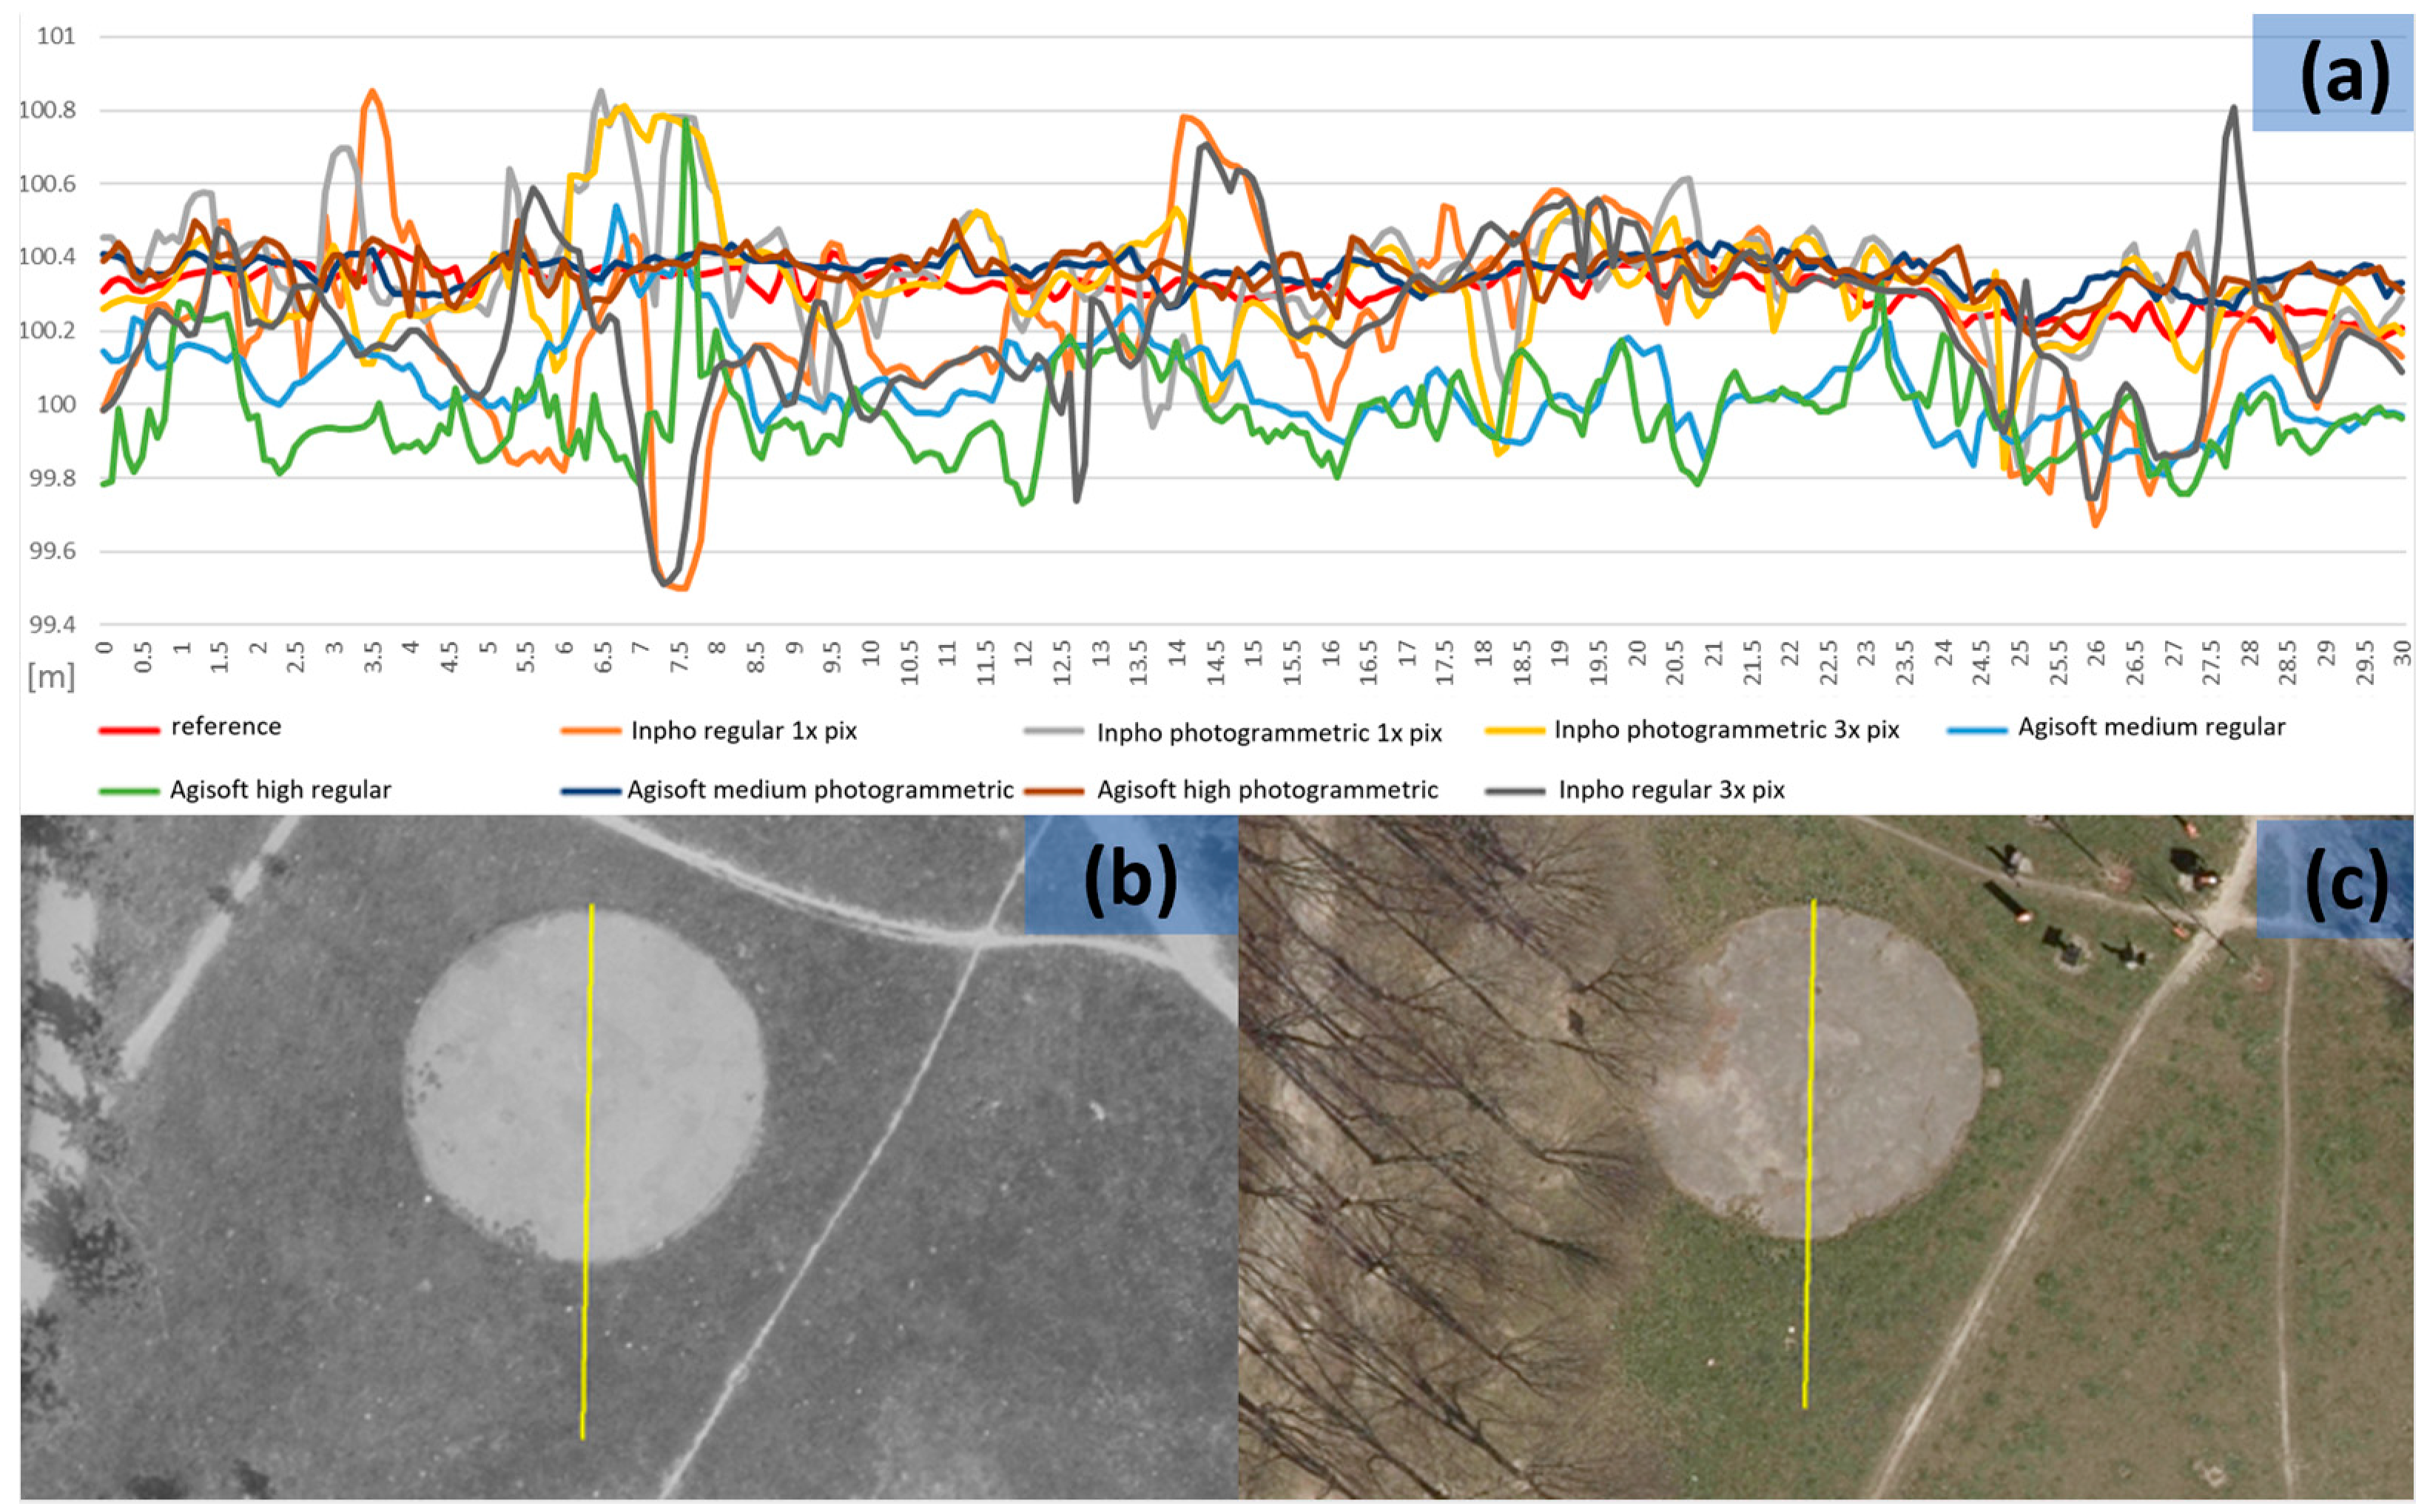
In the analyses of the DIM results, it was shown that the photogrammetric scanners allow us to derive more accurate point clouds with respect to consumer-grade scanners. Based on the results, it should be concluded that regular scanners do not have enough scanning quality to ensure high-resolution accuracy and geometric precision when working with digital forms of analog aerial images, in contrast to specialized photogrammetric scanners. This result has been also shown by [19], underlying that desktop scanners used in the photogrammetry process require complex and unique additional calibration. The used profiles and point cloud deviations demonstrated that the photogrammetric scanner dataset provide primarily 50% better results than a consumer-grade dataset.

5. Summary and Conclusions

There is an important and current trend in various mapping agencies: the scanning of historical aerial photo collections for archival purposes in order to preserve them, make them available to a wider audience, and protect these materials from damage or loss of their properties due to aging or poor storage conditions.
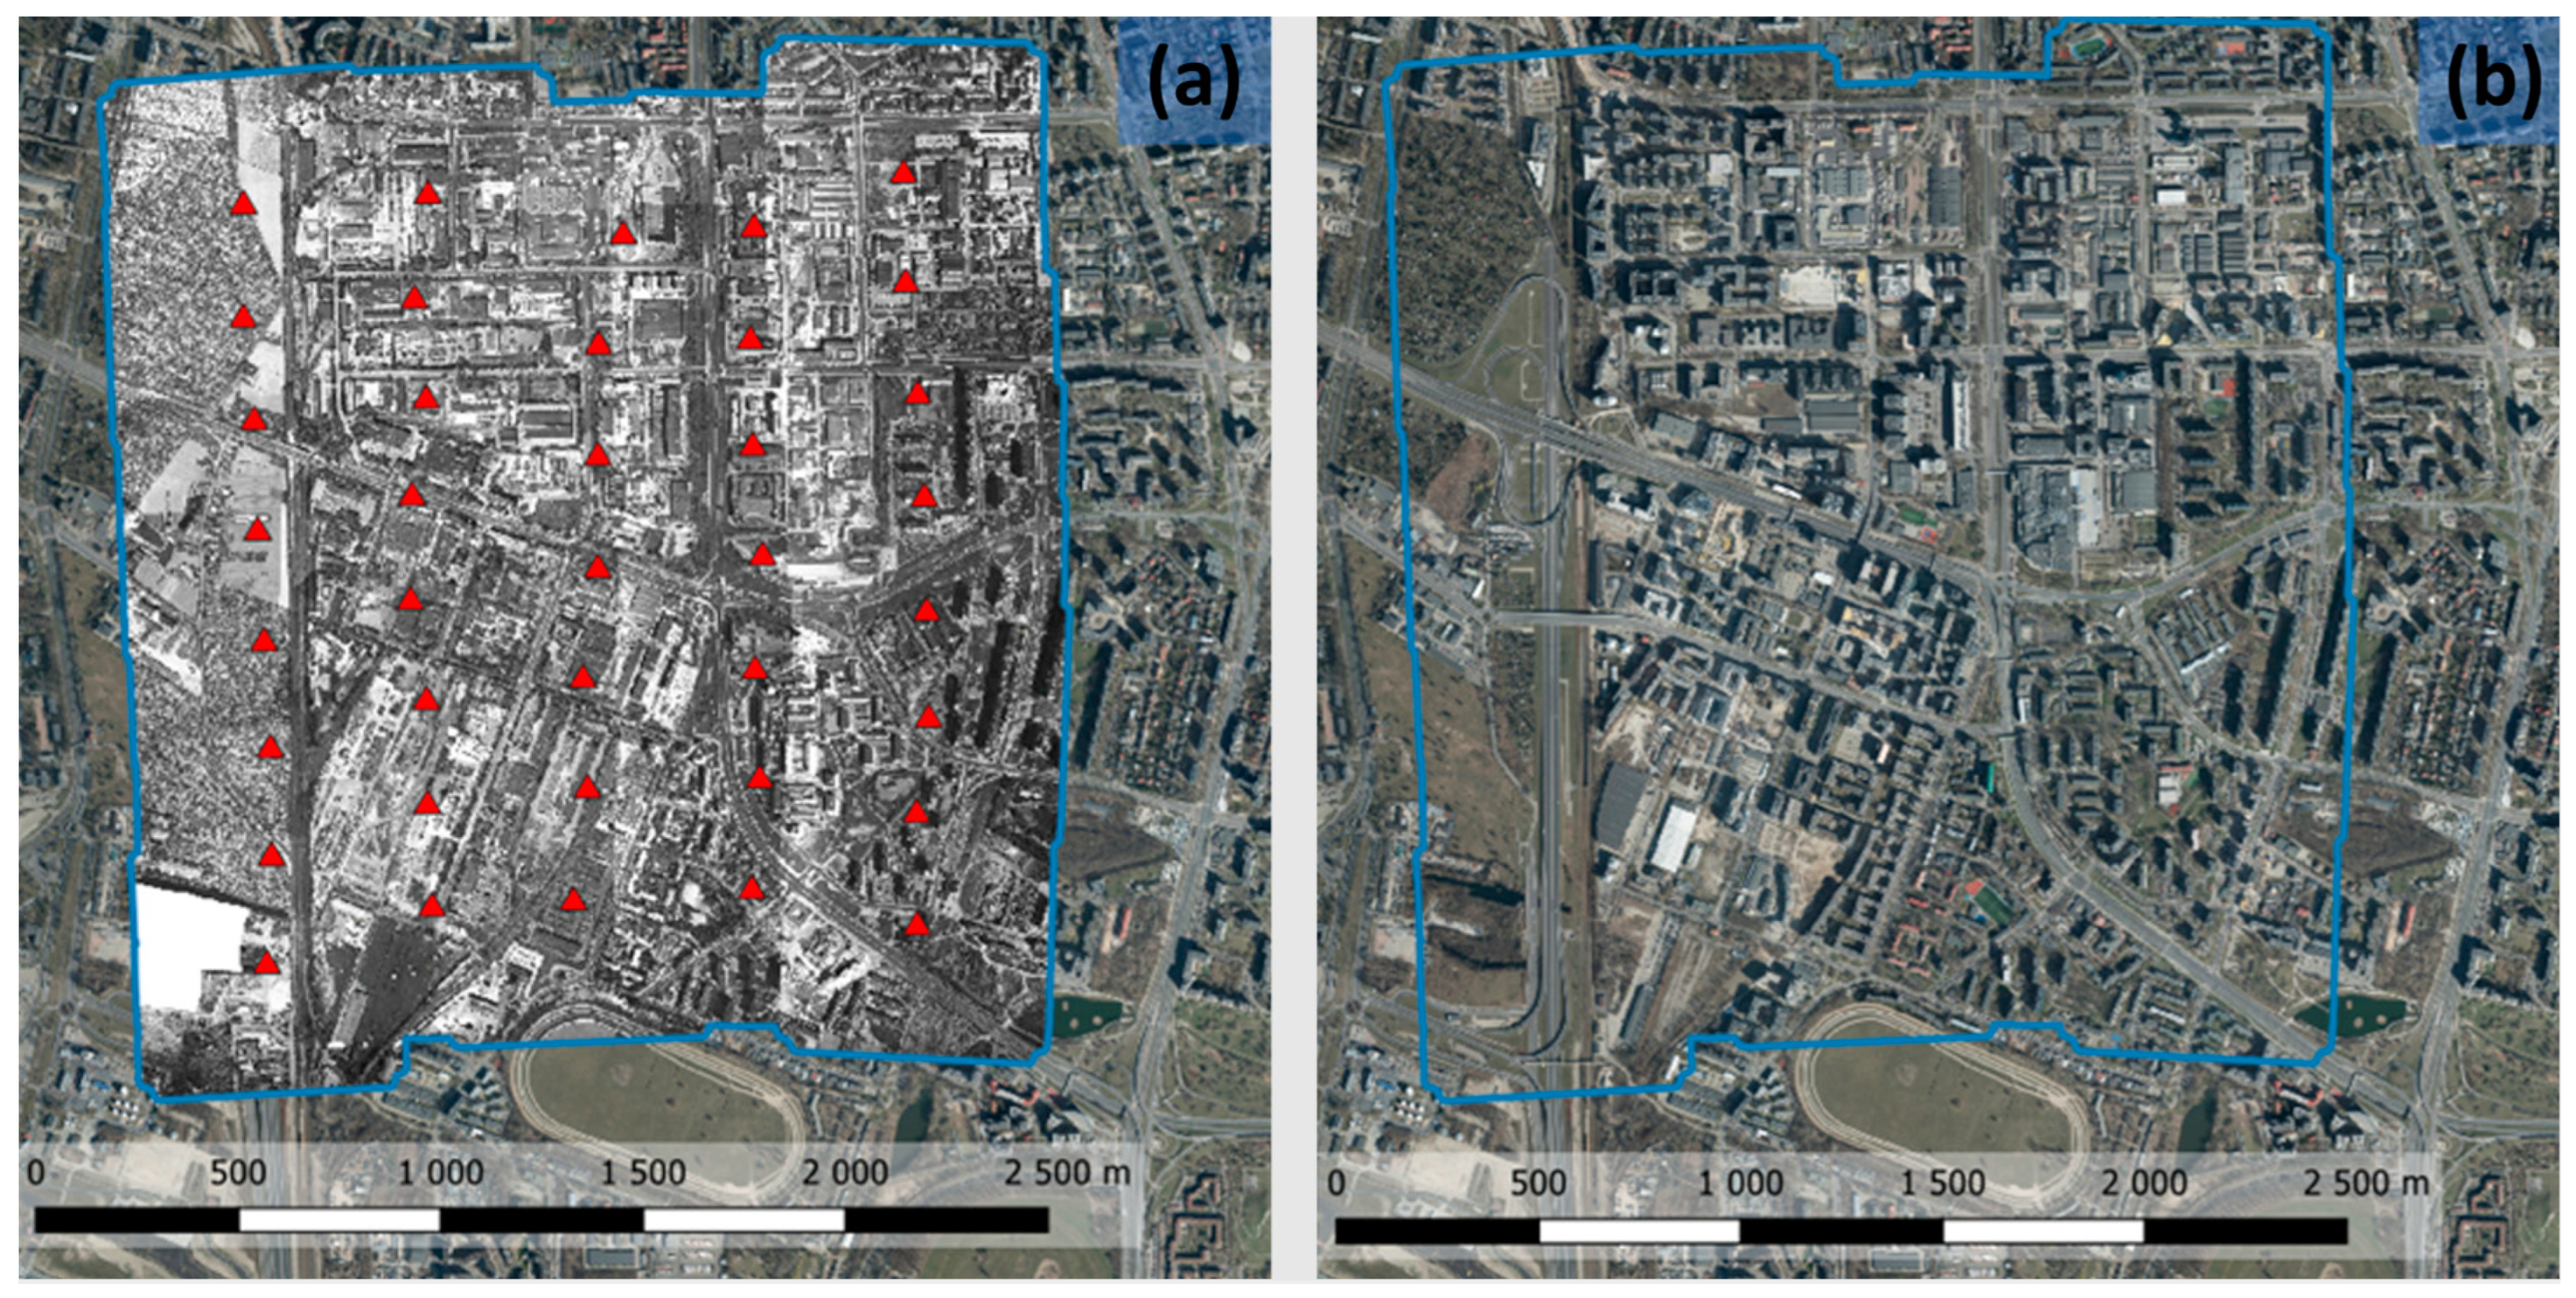
This article aimed to analyze the results of aerial triangulation and dense image matching in the context of comparing two scanning instruments: a Leica DSW 700 photogrammetric scanner and a consumer-grade EPSON V750 PRO scanner. The test area was the area of Warsaw’s Służewiec district, with 38 large-format images acquired with a Wild RC10 analog aerial camera in May 1986.
The authors verified and reported with visual and numerical examples how the scanning method affects the use of photogrammetric data and what recommendations should be followed for mass scanning and archiving of analog aerial photographs so that photogrammetric processing can use data with the highest possible quality. The research practically showed how geometric and radiometric resolution of scanned analog data affect aerial triangulation and dense image matching.
It is recommended to use photogrammetric scanners to obtain the highest possible accuracy from historical aerial blocks acquired for mapping purposes. Therefore, the use of low-cost consumer-grade tools in the scanning process of historical aerial images can significantly reduce the extraction of all geometric information hidden in an aerial analog film. Results show that a consumer-grade scanner provides less qualitative data, affecting the accuracy of the resulting products than digital copies made with a photogrammetric scanner. Consumer-grade scanners should not be recommended for detailed surveys; however, their application in 3D products makes it possible to accept a much lower quality of the final products, such as point clouds, DSM, DTM and orthophotos. Most of the errors are caused just in the initial steps related to interior orientation and aerial triangulation. To mitigate the impacts of certain distortions caused by a consumer-grade scanner, it is worth using photogrammetric software that performs a camera self-calibration, which ensures the removal of specific residual errors.
Considering future research, it is necessary to study the errors introduced at the scanning stage using different types of film and material. It would also be advisable to further investigate multi-epoch bundle block adjustment processing [51,52]. Moreover, other DIM algorithms could be tested, evaluating how errors in the generated point clouds vary according to the land cover and land use types (e.g., forests, farmland, etc.). Photogrammetric archival data have enormous potential for the analysis of human impact on the natural environment. Automatic analyses of derived digital elevation models and orthophotos provide the opportunity to conduct interesting multi-temporal considerations. However, the accuracy and proper processing of archival materials is the first and key stage of their processing.

Author Contributions

Conceptualization: A.K., W.O., K.B., E.M.F., L.M. and F.R.; methodology: A.K., W.O., E.M.F., L.M. and K.B.; investigation: A.K., W.O., E.M.F. and L.M.; resources: K.B. and F.R.; data curation: A.K., W.O., E.M.F. and L.M.; writing—original draft preparation: A.K., W.O., E.M.F., L.M., K.B. and F.R.; writing—review, and editing: A.K., E.M.F., K.B. and F.R.; visualization: A.K.; supervision: K.B. and F.R.; project administration: K.B. and F.R.; funding acquisition: K.B. and F.R. All authors have read and agreed to the published version of the manuscript.

Funding

The activities were partly funded by EuroSDR.

Institutional Review Board Statement

Not applicable.

Informed Consent Statement

Not applicable.

Data Availability Statement

The raw data supporting the conclusions of this article will be made available by the authors on request.

Conflicts of Interest

The authors declare no conflicts of interest.

References

  1. Cosgrove, D.; Fox, W.L. Photography and Flight; Reaktion Books: London, UK, 2010. [Google Scholar]
  2. Kilpatrick, A. World War I Remains in Scotland: Aerial Photography as Heritage. In Conflict Landscapes and Archaeology from Above; Routledge: London, UK, 2016; pp. 91–104. [Google Scholar]
  3. Fradley, M. British inter-war aerial photogrammetric mapping in the MENA region: Archives, access and research potential. Levant 2021, 53, 336–346. [Google Scholar] [CrossRef]
  4. Giordano, S.; Mallet, C. Archiving and Geoprocessing of Historical Aerial Images: Current Status in Europe; EuroSDR Official Publication No. 70; EuroSDR: Paris, France, 2019. [Google Scholar]
  5. Merler, S.; Furlanello, C.; Jurman, G. Machine learning on historical air photographs for mapping risk of unexploded bombs. In Proceedings of the 13th International Conference on Image Analysis and Processing (ICIAP2005), Lecture Notes in Computer Science, Cagliari, Italy, 6–8 September 2005; Volume 3617, pp. 735–742. [Google Scholar]
  6. Bolch, T.; Pieczonka, T.; Benn, D.I. Longest time series of glacier mass changes in the Himalaya based on stereo imagery. Cryosphere Discuss. 2010, 4, 2593–2613. [Google Scholar]
  7. Patias, P.; Kaimaris, D.; Stylianidis, E. Change detection in historical city centers using multi-source data: The case of historical center of NicosiaCyprus. In Proceedings of the 23rd International CIPA Conference, Prague, Czech Republic, 12–16 September 2011. [Google Scholar]
  8. Nebiker, S.; Lack, N.; Deuber, M. Building Change Detection from Historical Aerial Photographs Using Dense Image Matching and Object-Based Image Analysis. Remote Sens. 2014, 6, 8310–8336. [Google Scholar] [CrossRef]
  9. Tomscha, S.A.; Sutherland, I.J.; Renard, D.; Gergel, S.E.; Rhemtulla, J.M.; Bennett, E.M.; Daniels, L.D.; Eddy, I.; Clark, E.E. A guide to historical data sets for reconstructing ecosystem service change over time. BioScience 2016, 66, 747–762. [Google Scholar] [CrossRef]
  10. Ratajczak, R.; Crispim-Junior, C.F.; Faure, E.; Fervers, B.; Tougne, L. Automatic Land Cover Reconstruction from Historical Aerial Images: An Evaluation of Features Extraction and Classification Algorithms. IEEE Trans. Image Process. 2019, 28, 3357–3371. [Google Scholar] [CrossRef]
  11. Poli, D.; Casarotto, C.; Strudl, M.; Bollmann, E.; Moe, K.; Legat, K. Use of historical aerial images for 3D modelling of glaciers in the Province of Trento. Intern. Arch. Photogramm. Remote Sens. Spat. Inf. Sci. 2020, 43, 1151–1158. [Google Scholar] [CrossRef]
  12. Farella, E.M.; Malek, S.; Remondino, F. Colorizing the past: Deep learning for the automatic colorization of historical aerial images. Imaging 2022, 8, 269. [Google Scholar] [CrossRef]
  13. Ginzler, C.; Piermattei, L.; Marty, M.; Waser, L.T. Four nationwide Digital Surface Models from airborne historical stereo-images. In Proceedings of the EGU General Assembly 2024, Vienna, Austria, 14–19 April 2024. [Google Scholar]
  14. Luman, D.E.; Stohr, C.; Hunt, L. Digital reproduction of historical aerial photographic prints for preserving a deteriorating archive. Photogramm. Eng. Remote Sens. 1997, 63, 1171–1179. [Google Scholar]
  15. McGlone, J.C. Manual of Photogrammetry, 6th ed.; ASPRS: Baton Rouge, LA, USA, 2013. [Google Scholar]
  16. Baltasavias, E.P. On the performance of photogrammetric scanners. In Photogrammetric Week ’99; Fritsch, D., Spiller, R., Eds.; Wichmann Verlag: Osnabrück, Germany, 1999; pp. 155–174. [Google Scholar]
  17. Schulz, J.; Cramer, M.; Herbst, T. Evaluation of Phase One Scan Station for Analogue Aerial Image Digitisation. PFG–J. Photogramm. Remote Sens. Geoinf. Sci. 2021, 89, 461–473. [Google Scholar] [CrossRef]
  18. Baltsavias, E.P.; Käser, C. Quality evaluation of the DSW200, DSW300, SCAI and OrthoVision photogrammetric scanners. In Proceedings of the OEEPE Workshop on “Automation in Digital Photogrammetric Production”, Paris, France, 21–24 June 1999; OEEPE Official Publication, 1999; pp. 111–134. [Google Scholar]
  19. Mitrovic, M.; Cvijetinovic, Z.; Mihajlovic, D. Procedures and experiences on using desktop scanner for orthophoto production. In Proceedings of the ISPRS 2004 Commission IV-Geo-Imagery Bridging Continents. XXth ISPRS Congress, Istanbul, Turkey, 12–23 June 2004; pp. 53–58. [Google Scholar]
  20. Ruzgienė, B.; Bagdžiūnaitė, R.; Ruginytė, V. Scanning aerial photos using a non-professional scanner. Geod. Cartogr. 2012, 38, 118–121. [Google Scholar] [CrossRef]
  21. Sun, C.; Wu, X. Automatic segmentation of fiducial marks using attribute-based mathematical morphology. J. Electron. Imaging 2001, 10, 560–566. [Google Scholar]
  22. Nocerino, E.; Menna, F.; Remondino, F. Multi-temporal analysis of landscapes and urban areas. Int. Arch. Photogramm. Remote Sens. Spat. Inf. Sci. 2012, 39, 85–90. [Google Scholar] [CrossRef]
  23. Farella, E.M.; Morelli, L.; Remondino, F.; Mills, J.P.; Haala, N.; Crompvoets, J. The EuroSDR TIME benchmark for historical aerial images. Int. Arch. Photogramm. Remote Sens. Spat. Inf. Sci. 2022, 43, 1175–1182. [Google Scholar] [CrossRef]
  24. Redecker, A.P. Historical aerial photographs and digital photogrammetry for impact analyses on derelict land sites in human settlement areas. Int. Arch. Photogramm. Remote Sens. Spat. Inf. Sci 2008, 37, 5–10. [Google Scholar]
  25. Knuth, F.; Shean, D.; Bhushan, S.; Schwat, E.; Alexandrov, O.; McNeil, C.; Dehecq, A.; Florentine, C.; O’Neel, S. Historical Structure from Motion (HSfM): Automated processing of historical aerial photographs for long-term topographic change analysis. Remote Sens. Environ. 2022, 285, 113379. [Google Scholar] [CrossRef]
  26. Maiwald, F.; Feurer, D.; Eltner, A. Solving photogrammetric cold cases using AI-based image matching: New potential for monitoring the past with historical aerial images. ISPRS J. Photogramm. Remote Sens. 2023, 206, 184–200. [Google Scholar] [CrossRef]
  27. Lowe, G. Sift-the scale invariant feature transform. Int. J. 2004, 2, 2. [Google Scholar]
  28. Rublee, E.; Rabaud, V.; Konolige, K.; Bradski, G. ORB: An efficient alternative to SIFT or SURF. In Proceedings of the 2011 International Conference on Computer Vision, Barcelona, Spain, 6–13 November 2011; pp. 2564–2571. [Google Scholar]
  29. Bay, H.; Tuytelaars, T.; Van Gool, L. Surf: Speeded up robust features. In Proceedings of the Computer Vision–ECCV 2006: 9th European Conference on Computer Vision, Graz, Austria, 7–13 May 2006; pp. 404–417. [Google Scholar]
  30. Jin, Y.; Mishkin, D.; Mishchuk, A.; Matas, J.; Fua, P.; Yi, K.M.; Trulls, E. Image matching across wide baselines: From paper to practice. Int. J. Comput. Vis. 2021, 129, 517–547. [Google Scholar] [CrossRef]
  31. Morelli, L.; Bellavia, F.; Menna, F.; Remondino, F. Photogrammetry now and then-from Hand-Crafted to Deep-Learning Tie Points. Int. Arch. Photogramm. Remote Sens. Spat. Inf. Sci. 2022, 48, 163–170. [Google Scholar] [CrossRef]
  32. Peppa, M.V.; Morelli, L.; Mills, J.P.; Penna, N.T.; Remondino, F. Handcrafted and learning-based tie point features-comparison using the EuroSDR RPAS benchmark dataset. Int. Arch. Photogramm. Remote Sens. Spatial Inf. Sci. 2022, XLIII-B2-2022, 1183–1190. [Google Scholar]
  33. Remondino, F.; Morelli, L.; Stathopoulou, E.; Elhashash, M.; Qin, R. Aerial triangulation with learning-based tie points. Int. Arch. Photogramm. Remote Sens. Spat. Inf. Sci. 2022, XLIII-B2-2022, 77–84. [Google Scholar]
  34. Marelli, D.; Morelli, L.; Farella, E.M.; Bianco, S.; Ciocca, G.; Remondino, F. ENRICH: Multi-purposE dataset for beNchmaRking In Computer vision and pHotogrammetry. ISPRS J. Photogramm. Remote Sens. 2023, 198, 84–98. [Google Scholar] [CrossRef]
  35. Maiwald, F.; Lehmann, C.; Lazariv, T. Fully automated pose estimation of historical images in the context of 4D geographic information systems utilizing machine learning methods. ISPRS Int. J. Geo-Inf. 2021, 10, 748. [Google Scholar] [CrossRef]
  36. Münster, S.; Maiwald, F.; Bruschke, J.; Kröber, C.; Dietz, R.; Messemer, H.; Niebling, F. Where are we now on the Road to 4d Urban History Research and Discovery? ISPRS Ann. Photogramm. Remote Sens. Spat. Inf. Sci. 2021, 8, 109–116. [Google Scholar] [CrossRef]
  37. Rothermel, M.; Haala, N. The potential of dense matching for the generation of high-quality digital elevation models. Int. Arch. Photogramm. Remote Sens. Spat. Inf. Sci. 2012, 38, 271–276. [Google Scholar] [CrossRef]
  38. Remondino, F.; Spera, M.G.; Nocerino, E.; Menna, F.; Nex, F. State of the art in high-density image matching. Photogramm. Rec. 2014, 29, 144–166. [Google Scholar] [CrossRef]
  39. Wang, X.; Wang, C.; Liu, B.; Zhou, X.; Zhang, L.; Zheng, J.; Bai, X. Multi-view stereo in the Deep Learning Era: A comprehensive review. Displays 2021, 70, 102102. [Google Scholar] [CrossRef]
  40. Stathopoulou, E.K.; Remondino, F. A survey of conventional and learning-based methods for multi-view stereo. Photogramm. Rec. 2023, 38, 374–407. [Google Scholar] [CrossRef]
  41. Mölg, N.; Bloch, T. Structure-from-Motion Using Historical Aerial Images to Analyse Changes in Glacier Surface Elevation. Remote Sens. 2017, 9, 1021. [Google Scholar] [CrossRef]
  42. Sevara, C.; Verhoeven, G.; Doneus, M.; Draganits, E. Surfaces from the visual past: Recovering high-resolution terrain data from historic aerial imagery for multitemporal landscape analysis. J. Archaeol. Method Theory 2018, 25, 611–642. [Google Scholar] [CrossRef] [PubMed]
  43. Carturan, L.; Bondesan, A.; Carton, A.; Cazorzi, F.; Cucchiaro, S.; De Marco, J.; Piermattei, L. The glaciated landscape across the First World War front: Quantitative reconstructions based on digitized historical images and modern techniques. Geogr. Fis. E Din. Quat. 2020, 43, 143–155. [Google Scholar]
  44. Grottoli, E.; Biausque, M.; Rogers, D.; Jackson, D.W.; Cooper, J.A.G. Structure-from-motion-derived digital surface models from historical aerial photographs: A new 3D application for coastal dune monitoring. Remote Sens. 2020, 13, 95. [Google Scholar] [CrossRef]
  45. Mestre-Runge, C.; Lorenzo-Lacruz, J.; Ortega-Mclear, A.; Garcia, C. An Optimized Workflow for Digital Surface Model Series Generation Based on Historical Aerial Images: Testing and Quality Assessment in the Beach-Dune System of Sa Ràpita-Es Trenc (Mallorca, Spain). Remote Sens. 2023, 15, 2044. [Google Scholar] [CrossRef]
  46. Ryczywolski, M.; Oruba, A.; Leończyk, M. The precise satellite positioning system ASG-EUPOS. In Proceedings of the International Conference GEOS 2008 Proceedings, Prague, Czech Republic, 27–28 February 2009. [Google Scholar]
  47. Kurczyński, Z.; Bakuła, K. Generation of countrywide reference digital terrain model from airborne laser scanning in ISOK project. Arch. Fotogram. Kartogr. i Teledetekcji Wyd. Spec. Monogr. Geod. Technol. Pomiar. 2013, 59–68. [Google Scholar]
  48. Aguilar, M.A.; Aguilar, F.J.; Fernández, I.; Mills, J.P. Accuracy assessment of commercial self-calibrating bundle adjustment routines applied to archival aerial photography. Photogramm. Rec. 2013, 28, 96–114. [Google Scholar] [CrossRef]
  49. Heuchel, T.; Köstli, A.; Lemaire, C.; Wild, D. Towards a next level of quality DSM/DTM extraction with Match-T. Proc. Photogramm. Week 2011, 11, 197–202. [Google Scholar]
  50. Cloud Compare. 3D Point Cloud and Mesh Processing Software Open Source Project. 2011. Available online: https://www.danielgm.net/cc (accessed on 4 April 2024).
  51. Ressl, C.; Karel, W.; Piermattei, L.; Puercher, G.; Hollaus, M.; Pfeifer, N. Multi-epoch bundle block adjustment for processing large dataset of historical aerial images. In Proceedings of the EGU General Assembly 2020, Online, 4–8 May 2020; EGU2020-22544. [Google Scholar]
  52. Zhang, L.; Rupnik, E.; Pierrot-Deseilligny, M. Feature matching for multi-epoch historical aerial images. ISPRS J. Photogramm. Remote Sens. 2021, 182, 176–189. [Google Scholar] [CrossRef]
Figure 1. A view comparing the same image detail from a historical aerial picture scanned with the consumer-grade scanner EPSON V750 PRO (a) and with the photogrammetric scanner Leica DSW 700 (b).
Applsci 14 03635 g001
Figure 2. Test area in Służewiec district, Warsaw, Poland (highlighted red area).
Applsci 14 03635 g002
Figure 3. Aerial view of the Służewiec district in Warsaw with (a) the sub-block of 38 historical images acquired in 1986 and (b) the orthophoto from 2021.
Applsci 14 03635 g003
Figure 4. (a) Aerial camera network for the 1986 block. (b) Point distribution in the field.
Applsci 14 03635 g004
Figure 5. Examples of stable-over-time points measured in the field: points identified in the historical dataset (left panel) and the corresponding points in the modern orthophoto (right panel).
Applsci 14 03635 g005
Figure 6. (a) The distribution of CPs and GCPs used in the AT process; (b) reference DSM from LiDAR data (2012).
Applsci 14 03635 g006
Figure 7. Processing workflow used for the experiments.
Applsci 14 03635 g007
Figure 8. Measurement of fiducial marks on historical images within Trimble Inpho.
Applsci 14 03635 g008
Figure 9. Histogram of vertical differences between the four DEMs and the GNSS measurements (110 points).
Applsci 14 03635 g009
Figure 10. Analysis based on profile (a) no. 1 (road): orthophoto from 1986 (b) and 2012 (c).
Applsci 14 03635 g010
Figure 11. Analysis based on DSM profile (a) no. 2 (park and basketball pitch): orthophoto from 1986 (b) and 2012 (c).
Applsci 14 03635 g011
Figure 12. Analysis based on DSM profile (a) no. 3 (parking lot near a building): orthophoto from 1986 (b) and 2012 (c).
Applsci 14 03635 g012
Figure 13. Profile line (a) crossing the building: orthophoto overview from 1986 (b) and 2012 (c).
Applsci 14 03635 g013
Figure 14. The roof area of the first building (red polygon, ca 10 × 30 m) for the cloud-to-cloud comparison: views in the 2012 orthophoto (a) and in the 1986 dataset (b).
Applsci 14 03635 g014
Figure 15. The roof area of the second building (red polygon, ca 25 × 55 m) for the cloud-to-cloud comparison: views in the 2012 orthophoto (a) and in the 1986 dataset (b).
Applsci 14 03635 g015
Figure 16. The roof area of the first building (red polygon, ca 5 × 25 m) for the cloud-to-cloud comparison: views in the 2012 orthophoto (a) and in the 1986 dataset (b).
Applsci 14 03635 g016
Table 1. Characteristics of the employed dataset with the photogrammetric camera and the scanners tested in the experiments. Please note the memory space of an image scanned with a photogrammetric scanner is compressed 4–5 times with respect to a consumer-grade scanner.
PropertiesConsumer-Grade ScannerPhotogrammetric Scanner
Scanner nameEPSON V750 PROLeica DSW 700
Resolution (dpi)18001800
Defined pixel size (µm)1414
Average size (MB)1271402
CameraWild RC 10
Date of the acquisition5–6 May 1986
Scale1:3000
Average GSD4 cm
Focal length213.75 mm
Format23 × 23 cm
Overlap60/40
Mean flying height682 m
Table 2. Statistics of the affine transformation for consumer-grade and photogrammetric scanner datasets performed in Inpho to determine the interior orientation of each scanned image.
ScannerConsumer-GradePhotogrammetric
RMSE
Min/Average/Max values [µm]
17.5/24.3/38.71.5/4.4/7.4
Sigma0
Min/Average/Max values [µm]
35.0/48.6/77.33.1/8.8/14.9
Table 3. Results (values and estimated errors) of the self-calibration executed in Metashape on the photogrammetric and consumer-grade/regular datasets.
DatasetPhotogrammetricConsumer-Grade
ParameterValueErrorValueError
F213.75 mm-213.75 mm-
Cx−0.37228 px0.016−0.47829 px0.044
Cy−0.40745 px0.017−0.97128 px0.049
B10.019940.00082−0.511540.00190
B2−0.023470.00078−0.685360.00180
K1−0.004220.00006−0.007250.00013
K20.016560.000280.030450.00062
K3−0.019650.00040−0.039650.00088
P10.000060.0000030.000720.00001
P2−0.000050.000002−0.000040.00001
Table 4. The AT accuracy for the consumer-grade and photogrammetric datasets.
MetashapeInpho
DatasetConsumerPhotogram.ConsumerPhotogram.
Ground Control Point RMSEX [m]0.1400.1260.2500.112
Y [m]0.1280.1260.3020.138
Z [m]0.1270.1240.1570.097
XY [m]0.1890.1780.3920.178
Total [m]0.2280.2170.4220.202
Image [pix]0.8650.7410.9140.602
Check Point RMSEX [m]0.1980.1340.4330.126
Y [m]0.1120.1160.2290.098
Z [m]0.2760.1660.2310.116
XY [m]0.2270.1770.4900.160
Total [m]0.3580.2420.5420.197
Image [pix]0.8990.5730.9140.602
Table 5. Comparing vertical values of the four DEMs with respect to GNSS measurements (110 points).
Image Matching ScenarioMean Value [m]Min Value [m]Max Value [m]RMSE [m]
MetashapePhotogrammetric dataset—2× GSD−0.026−0.6490.6150.200
Photogrammetric dataset—4× GSD−0.027−0.8190.7160.207
Consumer-grade dataset—2× GSD−0.001−0.9250.9290.307
Consumer-grade dataset—4× GSD0.001−0.9290.8790.291
InphoPhotogrammetric dataset—1× GSD−0.010−0.9360.7660.222
Photogrammetric dataset—3× GSD0.020−0.9500.7880.225
Consumer-grade dataset—1× GSD0.006−0.7480.5300.207
Consumer-grade dataset—3× GSD0.056−0.7890.8610.237
Table 6. RMSE results for the three selected profiles in the image-based DSMs.
Image Matching ScenarioRMSE [m]
Profile 1Profile 2Profile 3
Metashape 2× GSD—photogrammetric0.1870.0750.119
Metashape 4× GSD—photogrammetric0.1690.0660.100
Metashape 2× GSD—consumer-grade0.3270.3650.538
Metashape 4× GSD—consumer-grade0.2980.2870.542
Inpho 1× GSD—photogrammetric0.3850.1580.186
Inpho 3× GSD—photogrammetric0.3580.1510.154
Inpho 1× GSD—consumer-grade0.3300.2540.200
Inpho 3× GSD—consumer-grade0.3780.2310.294
Table 7. Statistics for the cloud-to-cloud analysis of roof 1 (Figure 14).
Image Matching ScenarioTotal No. of PointsDensity [pt/m2]Avg. Dist. [m]Stand. Dev. [m]
Metashape 2× GSD—photogrammetric34,092113.6−0.1210.108
Metashape 4× GSD—photogrammetric12,73942.3−0.1320.112
Metashape 2× GSD—consumer-grade10,12133.5−0.1700.127
Metashape 4× GSD—consumer-grade395213.0−0.0880.129
Inpho 1× GSD—photogrammetric144,267474.60.0540.123
Inpho 3× GSD—photogrammetric24,84381.50.0570.123
Inpho 1× GSD—consumer-grade145,365475.0−0.2890.128
Inpho 3× GSD—consumer-grade25,59783.4−0.2410.129
Table 8. Statistics for the cloud-to-cloud analysis of roof 2 (Figure 15).
Image Matching ScenarioTotal No. of PointsDensity [pt/m2]Avg. Dist. [m]Stand. Dev. [m]
Metashape 2× GSD—photogrammetric210,986137.1−0.0450.082
Metashape 4× GSD—photogrammetric53,74234.9−0.0470.079
Metashape 2× GSD—consumer-grade219,964142.7−0.2820.104
Metashape 4× GSD—consumer-grade53,26934.5−0.2820.099
Inpho 1× GSD—photogrammetric838,064543.10.0060.089
Inpho 3× GSD—photogrammetric129,27683.70.0440.090
Inpho 1× GSD—consumer-grade820,612531.10.1790.075
Inpho 3× GSD—consumer-grade134,26186.80.1650.072
Table 9. Statistics for the cloud-to-cloud analysis of roof 3 (Figure 16).
Image Matching ScenarioTotal No. of PointsDensity [pt/m2]Avg. Dist. [m]Stand. Dev. [m]
Metashape 2× GSD—photogrammetric17,544159.5−0.0520.081
Metashape 4× GSD—photogrammetric411737.1−0.0520.078
Metashape 2× GSD—consumer-grade15,978142.7−0.2880.097
Metashape 4× GSD—consumer-grade404335.8−0.2530.129
Inpho 1× GSD—photogrammetric62,523548.4−0.0610.085
Inpho 3× GSD—photogrammetric10,00187.0−0.0630.079
Inpho 1× GSD—consumer-grade61,339528.8−0.1530.064
Inpho 3× GSD—consumer-grade970983.00.1740.065
Disclaimer/Publisher’s Note: The statements, opinions and data contained in all publications are solely those of the individual author(s) and contributor(s) and not of MDPI and/or the editor(s). MDPI and/or the editor(s) disclaim responsibility for any injury to people or property resulting from any ideas, methods, instructions or products referred to in the content.

