1. Introduction
Atherosclerosis stands as a formidable adversary in cardiovascular medicine, characterized by the insidious accumulation of plaques within the arterial walls. This complex process, which heralds the onset of numerous cardiovascular diseases, often initiates with the formation of fatty streaks (FS) in the aorta. These early lesions, predominantly manifesting in the aortic arch and abdominal aorta, mark a critical juncture in the cascade of events that may escalate to more advanced stages of atherosclerosis, including the development of fibrous plaques and culminating in cardiovascular disease. The progression from benign fatty streaks to obstructive atherosclerotic plaques involves a multifaceted interplay of inflammatory cells and extracellular lipid accumulation, laying the groundwork for significant arterial blockage and compromised cardiovascular health [
1].
Historically, the exploration of FS and their contribution to atherosclerosis has been approached through a molecular and biochemical lens, focusing on the cellular activities and chemical mediators within the FS regions. This perspective has underscored the role of damage-associated molecular patterns (DAMPs), which are released following cellular distress or death, and cytokines, which are pivotal in activating the endothelial lining of the arteries [
2]. Furthermore, the activated cells within the evolving plaque secrete matrix proteases, enzymes capable of degrading the extracellular matrix and facilitating the penetration and accumulation of inflammatory cells and lipids [
3]. This biochemical narrative, while foundational, provides only a partial view of the complex mechanisms at play in atherosclerosis development.
The mechanical forces acting upon the arterial walls, particularly endothelial shear stress (ESS), have emerged as critical factors influencing the initiation and progression of atherosclerosis. ESS, the frictional force exerted by blood flow on the endothelial layer, varies significantly across different vascular regions, influenced by factors such as blood velocity, vessel geometry, and the presence of vascular lesions like FS. Understanding how FS alters the distribution of ESS and, by extension, affects endothelial function and plaque progression requires sophisticated analytical tools capable of simulating these complex biomechanical interactions.
In response to this challenge, the present study leverages a hybrid approach that combines the precision of computational fluid dynamics (CFD) simulations with the versatility of numerical analysis. CFD simulations have revolutionized our ability to visualize and quantify the fluid dynamics within cardiovascular systems, offering a window into the intricate patterns of blood flow and shear forces that traditional experimental models cannot provide. This computational method allows for a detailed examination of how variations in blood flow dynamics, induced by the presence of FS, impact ESS distribution and contribute to the pathological landscape of atherosclerosis. By integrating CFD with numerical analysis performed through MATLAB, this study aims to bridge the gap between mechanical forces and biochemical processes in atherosclerotic progression, offering novel insights into the mechanical underpinnings of plaque development.
This approach is not without precedence; numerous studies have underscored the utility of CFD in elucidating the relationship between blood flow dynamics and vascular pathology. For instance, research utilizing ANSYS CFX for CFD simulations has illuminated the significant correlation between simulated arterial characteristics and actual measurements of arterial lumen area, wall area, and plaque burden, reinforcing the hypothesis that regions subjected to low ESS are hotspots for plaque accumulation and growth. In contrast, innovative mathematical and agent-based modeling techniques have offered alternative perspectives on cardiovascular dynamics, enriching our understanding of the systemic nature of atherosclerosis [
4,
5,
6].
By adopting Autodesk CFD for its proven efficacy in interface and performance assessments, complemented by MATLAB’s analytical prowess, this study aspires to offer a comprehensive view of the role of FS in modulating ESS and its implications for endothelial integrity and atherosclerosis progression. This paper delineates our methodologies, from model construction to simulation execution, presents the resultant data, and engages in a critical discussion of our findings within the broader context of cardiovascular research. It aims to contribute to the ongoing dialogue on atherosclerosis by providing a fresh perspective on the mechanical aspects of disease progression, ultimately guiding future investigations and interventions in this pivotal area of human health.
2. Methods
2.1. Simulations
Simulation models are gaining more importance in understanding the complex mechanisms and dynamics of the human cardiovascular system. To explore the functioning of the aorta, we developed a model that focuses on blood flow, considering the biomechanical factors in blood vessels.
Simulation of blood flow in the aorta is performed using Autodesk CFD 2023 (Version 20221213). The details of the simulation settings are fully described in
Table 1 and
Figure 1.
2.2. Geometry
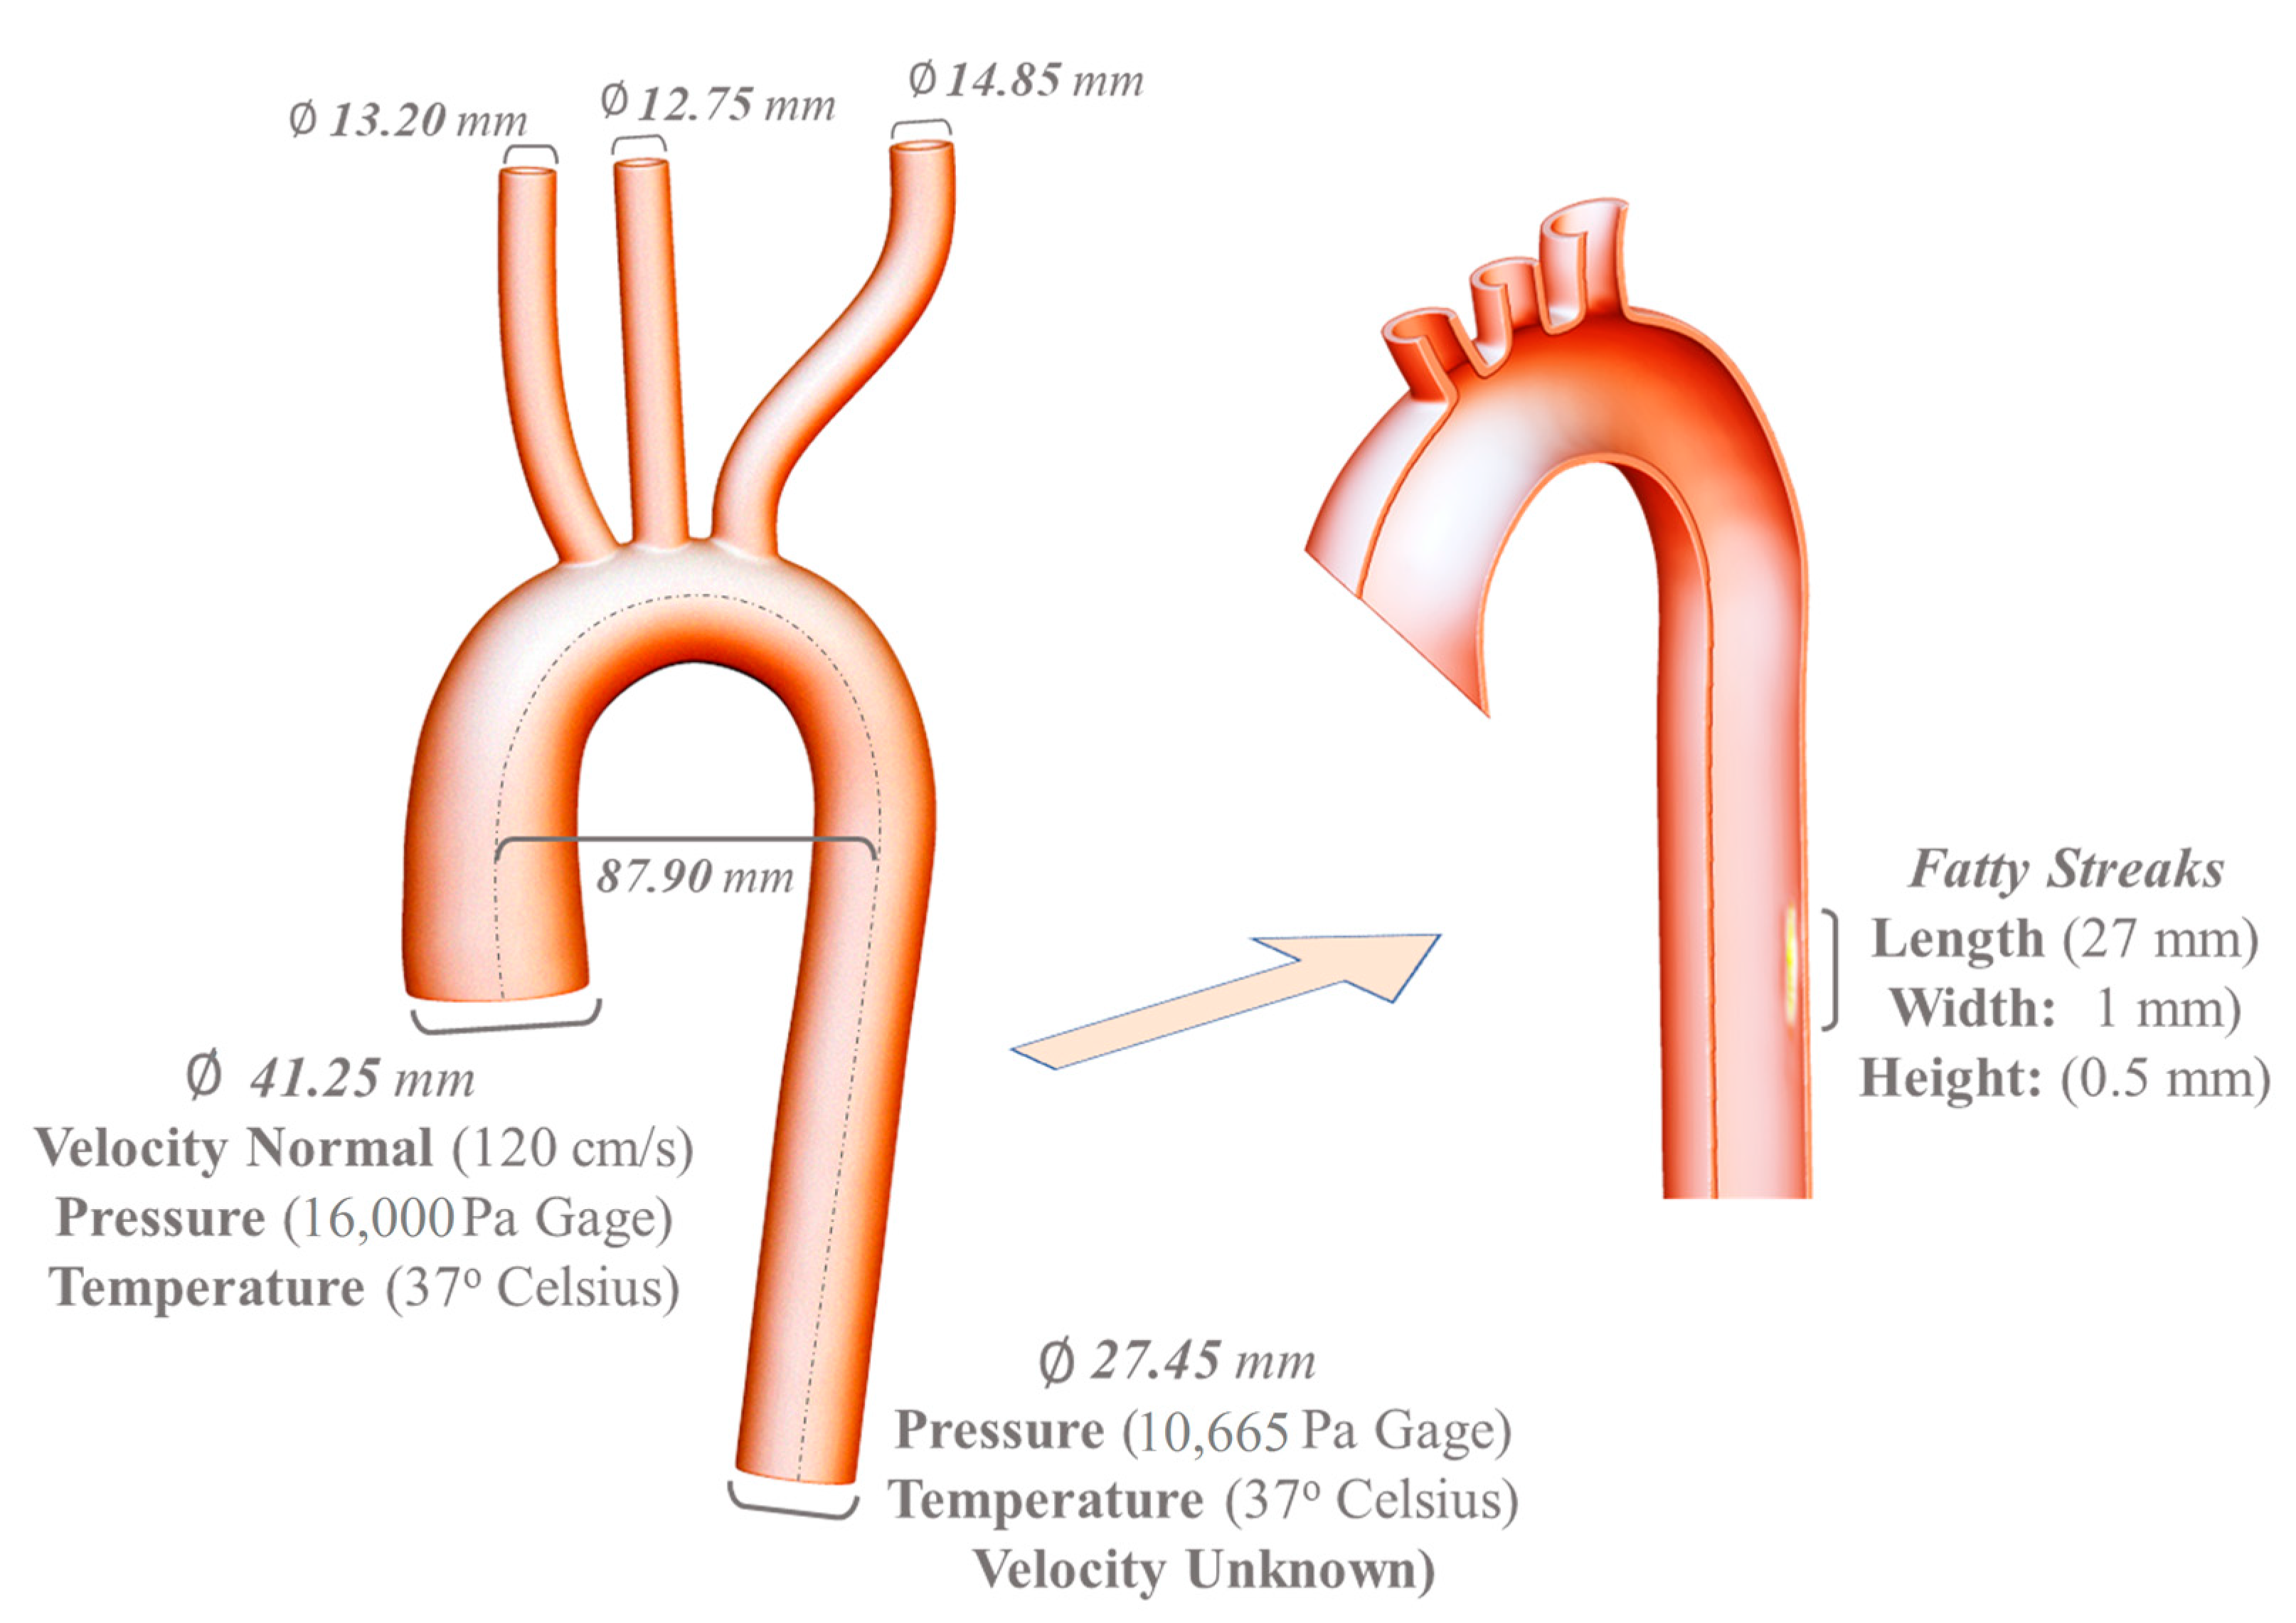
A simplified aorta model was created in Autodesk AutoCAD 2023 using the loft tool. The model includes an inlet with a diameter of 41.25 mm, an aortic arch with a diameter of 87.9 mm, a Brachiocephalic artery outlet with a diameter of 13.2 mm, an LCC artery with a diameter of 12.75 mm, a Left Subclavian artery with a diameter of 14.85 mm, and a main outlet of the aorta with a diameter of 27.45 mm. The angle between the descending aorta and the horizontal plane is 80 degrees [
7]. Five canoe-shaped plaques resembling FS were created using the revolve tool, with a maximum height ranging from 2.2 mm to 4.5 mm and a length of 50 mm. The union tool was used to combine the aorta and FS 15 cm below the aortic arch, resulting in a maximum height of FS outside of the aortic wall and inside the lumen of the aorta of 0.5 mm to 3 mm and a length of 27 mm.
2.3. Visualization of ESS Distribution
In order to visualize the spatial distribution of Endothelial Shear Stress (ESS) in the aorta, both 2D and 3D contour plots were generated using MATLAB. The ESS data, along with the corresponding spatial coordinates for 33,421 different points, were first imported from the CFD simulation in CSV format. For the 3D contour plot, a three-dimensional grid was created within the range of the spatial coordinates. The ESS values were then interpolated at the points in this grid using the ‘scatteredInterpolant’ function in MATLAB, which performs a natural neighbor interpolation. The ‘contourslice’ function was used to create the 3D contour plot, with the contours colored according to the interpolated ESS values. For the 2D contour plot, the ‘contour’ function was used to create contours in the three different anatomical planes, with the contours colored according to the ESS values. In both cases, a color map was used to map the ESS values to colors, with blue representing low ESS and red representing high ESS. The ‘colorbar’ function was used to add a color bar to the plots, providing a visual reference for the ESS values. The resulting contour plots provide a visual representation of the spatial distribution of ESS in the aorta, highlighting regions of high and low ESS.
2.4. Handling of Outliers in ESS Data
The presence of outliers in the Endothelial Shear Stress (ESS) data can potentially distort the visualization and interpretation of the ESS distribution. To ensure the accuracy and reliability of the analysis, a systematic approach was adopted to identify and handle these outliers. The mean and standard deviation of the ESS values were first calculated. An outlier was then defined as a data point that deviated by more than three standard deviations from the mean ESS value. This threshold was chosen based on the empirical rule, which states that for a normal distribution, about 99.7% of the data falls within three standard deviations of the mean. The outliers identified by this method were then excluded from the subsequent analysis. This approach helped to mitigate the impact of extreme ESS values that could be due to measurement errors or other anomalies in the CFD simulation. By handling these outliers, a more accurate and representative visualization of the ESS distribution in the aorta was achieved.
2.5. Solved Equations
This study employs the Petrov–Galerkin method for numerical stability and accuracy in solving the Navier–Stokes equations, which govern fluid flow and are fundamental to the computational fluid dynamics (CFD) analysis of blood flow in the aorta. This method optimizes the weighting functions in the finite element method to reduce numerical oscillations and improve solution accuracy, particularly in advective transport problems [
8].
For turbulence modeling, this study utilizes the k-epsilon (k-ε) model, a standard two-equation model for simulating turbulence kinetic energy (k) and its dissipation rate (ε). This model is chosen for its effectiveness in high Reynolds number flows typical of arterial blood flow. The k-epsilon model is calibrated as follows to accurately capture the flow dynamics and turbulence characteristics in the aortic environment, especially in regions with fatty streaks:
Turbulence Intensity: 0.05, indicating moderate turbulence at the inlet, suitable for arterial flow.
Turb/Laminar Ratio: Set to 0.3, to balance turbulent and laminar viscosity effects, acknowledging the predominance of laminar in the flow.
Wall Function Parameters: Including surface roughness set to model the interaction of flow with the arterial wall and fatty streaks. Specific parameters like Wall Parameter (7.76), Van Driest Damping Constant, and others are adjusted according to standard practices for k-ε model application in cardiovascular flow [
9].
Incorporating the Energy Equation into our turbulence modeling framework, we have applied the Boussinesq approximation to estimate eddy viscosity. This approximation allows us to assume that the density variations are negligible, except where they appear in buoyancy forces. By solving the Energy Equation:
We derive the temperature distribution within the flow field, which is critical for accurate computation of the eddy viscosity coefficient via the turbulent kinetic energy and its dissipation rate.
The obtained eddy viscosity, along with the turbulence kinetic energy and its dissipation rate, directly informs our k-epsilon model, ensuring that the model reflects not only the mechanical turbulence but also the thermal energy transport effects within the aortic flow.
3. Results
3.1. Quantitative Changes in ESS
The results of this study indicate that there are quantitative changes in ESS when fatty streaks are present in the aortic wall. The ESS map in the presence of FS shows a distinctive corridor candidate highlighted in yellow with an oval shape. (
Figure 2a) This region is not detected in the same geographical area without the presence of fatty streaks. (
Figure 2b) The data for these changes are presented in
Figure 2c,d, which depict the ESS values for 700 different longitudinal points of fatty streak position in both models. The graph of the aorta without fatty streaks (
Figure 2d) is relatively linear in relation to the position and has an average ESS value of 3.5 Pa. However, when fatty streaks are added, there is a clear and significant change in ESS, as shown in the graph in
Figure 2c, which has a double-peaked shape with the first peak at 6.8 Pa and the second peak at 6.3 Pa.
The impact of fatty streaks (FS) on endothelial shear stress (ESS) is a nuanced aspect of atherosclerosis that has often been overlooked in the literature. While the presence of FS is typically associated with the biochemical progression of atherosclerotic disease, its mechanical implications are not as widely recognized. Our findings suggest that FS can induce significant fluctuations in ESS, particularly at lower blood velocities. These fluctuations are evidenced by an increased standard deviation (Standard Deviation (SD) = 2.41 (Pa), Mean 3.2 (Pa)) of ESS measurements, highlighting the oscillatory nature of shear stress in affected areas. Such insights compel a reevaluation of FS beyond their traditional role as mere precursors to more advanced plaques, implicating them as active mechanical participants in the early stages of atherosclerotic development. This recognition of FS as influential mechanical entities may prompt further investigation into their role in endothelial dysfunction and vascular pathology (
Table 2).
3.2. Contour Plots of ESS
As depicted in
Figure 3a, areas with an ESS greater than 5.5 Pa exhibit a distribution resembling a metaphorical dam on the surface of the FS. This occurs under conditions of a blood velocity of 120 cm/s and blood pressure ranging from 16,000 to 10,665 Pa. Upon increasing the blood velocity and pressure in the simulation by 40%, the areas with an ESS under 4.5 decreased in size by 80% (
Figure 3b). Moreover, areas with an ESS exceeding 5.5 form a continuous shape, effectively eliminating spaces of low ESS that were previously trapped between the high ESS surface, thereby creating conditions suitable for a metaphorical dam reservoir.
3.3. Vectoral Investigation of the Second Peak of ESS
Our study discovered that the presence of fatty streaks in the aortic wall leads to a change in the direction of the ESS in the Y-Z Plane (parallel to the FS basis) in the region where the second peak of the ESS graph occurs. In a model without fatty streaks, the ESS values in the Y-Z plane start with negative values, increase to zero at the Y-coordinate center, and continue to rise as the Y-coordinate point increases. However, in an artery with fatty streaks, the ESS values exhibit quintic function behavior on the negative side of the Y-axis, peaking at a positive value before decreasing to a negative value on the positive side of the Y-axis and then increasing again. This phenomenon can be observed in
Figure 4.
3.4. Future Implications of Altered ESS Distribution
Assuming that lipids and other atherosclerotic plaque factors are influenced by the altered distribution of ESS, we can explore the progression of these forces and their potential implications as atherosclerosis advances. This study analyzed this in five different scenarios, as depicted in
Figure 5. In each scenario, an influx of more lipids and cells into the LDL accumulation region (
Figure 5) resulted in an increase in the thickness of the hypothetical dam structure.
As atherosclerosis progresses, the metaphorical dam-like structure becomes more pronounced, and the differences in ESS become more evident. This can potentially trap more plaque material within space, significantly accelerating atherosclerosis progression. Thus, early intervention and preventive measures are crucial in managing atherosclerosis.
4. Discussion
This study employed a hybrid approach, using both Autodesk CFD and MATLAB, to investigate the effects of fatty streaks on the endothelial shear stress distribution in a simplified model of the aorta. This hybrid approach allowed us to leverage the strengths of both software tools, thereby overcoming the weaknesses inherent in each when used independently. Autodesk CFD facilitated comprehensive and accurate simulation of blood flow dynamics, while MATLAB enabled detailed numerical analysis of the simulation results.
The choice of the Petrov–Galerkin model for our simulation was primarily motivated by its ability to enhance the accuracy of the computational fluid dynamics simulation. The Petrov–Galerkin model employs a method of error minimization that provides a more accurate representation of the endothelial shear stress distribution in the aorta, thereby enhancing the reliability of our simulation results.
The presence of fatty streaks in the aorta presents a significant challenge in terms of the complexity of calculations for endothelial shear stress. This is particularly true when considering the dynamic nature of blood flow in the arteries. However, the use of CFD simulation and numerical analysis in tandem greatly simplifies this task, making it a viable approach for studying the effects of fatty streaks on endothelial shear stress.
Our results revealed that the presence of fatty streaks leads to significant alterations in the ESS distribution. This alteration can be viewed from three main angles. Firstly, a higher standard deviation (SD) in ESS distribution in the presence of FS at low blood velocity compared to high blood velocity indicates oscillations in ESS, which are believed to be an important factor in disease development. Secondly, there is an 80% increase in regions with ESS less than 4.5 (
Figure 3) at lower blood velocities. This observation is crucial because plaque typically occurs in regions with lower ESS [
10]. Finally, as the plaque progresses, the area that remains stable in terms of ESS extends longitudinally (
Figure 5), which suggests that the presence of fatty streaks can lead to a ‘dam-like’ effect, potentially trapping lipids and other inflammatory cells within the arterial wall. This dam-like effect, coupled with the increased permeability associated with elevated ESS, as shown in previous studies [
11], may serve as an entry point for these elements, thereby contributing to the progression of atherosclerosis. These findings underscore the potential of early intervention strategies to mitigate the progression of atherosclerosis by controlling the factors influencing ESS and endothelial permeability.
This ESS change not only pushes LDL and other lipids into these spaces [
12], but it can also stimulate inflammatory reactions, starting to propagate macrophage recruitment, which is one of the major contributing factors to the development of atherosclerotic plaques [
13].
Furthermore, our results align with the study “Acute and chronic exposure to shear stress have opposite effects on endothelial permeability to macromolecules”, suggesting that an increase in blood flow could potentially counteract the increase in permeability, thereby acting as a preventative measure against atherosclerosis progression [
14].
While acknowledging the limitations of our study, it is important to highlight that our findings regarding the effects of fatty streaks on endothelial shear stress distribution are not solely dependent on the simplified model of the aorta. The observed phenomenon, where areas of high ESS join with increased blood flow, is fundamentally related to the hill-like shape of the fatty streaks and the nature of the ESS function.
This implies that our findings should hold true, even in more complex models of any artery and under more complex flow conditions. The hill-like shape of the fatty streaks and the increase in blood flow are intrinsic factors that would influence the ESS distribution, regardless of the complexity of the artery model or flow conditions.
Therefore, while future research could certainly benefit from incorporating more realistic models of the aorta and considering a broader range of factors, our findings provide a fundamental understanding of the impact of fatty streaks on ESS distribution and atherosclerosis progression.
5. Conclusions
The hybrid approach, which utilized both Autodesk CFD for simulation and MATLAB for numerical analysis, proved to be a valuable tool in understanding the complex dynamics of blood flow in the presence of fatty streaks.
While this study used a simplified model of the aorta, the fundamental findings related to the hill-like shape of the fatty streaks and the nature of the ESS function should hold true in more complex models and flow conditions.
Future research should aim to build upon these findings, incorporating more realistic models of the aorta and considering a broader range of factors that may influence the development and progression of atherosclerosis. The insights gained from this study could prove invaluable in guiding the development of more effective strategies for the prevention and treatment of atherosclerosis.
In conclusion, our study elucidates the significant impact of fatty streaks (FS) on the distribution of endothelial shear stress (ESS) within the arterial environment, offering three pivotal observations that contribute to the understanding of atherosclerosis pathogenesis. Firstly, we report a notable augmentation in the standard deviation of ESS in regions affected by FS under low blood velocity conditions. This phenomenon suggests the presence of oscillatory shear stress patterns, which may play a critical role in atherosclerosis development. Secondly, our findings indicate an increase in regions of low ESS, known to be susceptible to plaque formation, particularly at diminished blood velocities. Lastly, the progression of plaque is linked with an extension of areas displaying stable ESS, suggesting that FS might facilitate zones favorable to lipid and inflammatory cell entrapment.
These insights not only underscore the necessity for early atherosclerosis intervention but also highlight the modulation of ESS and endothelial permeability as promising targets for therapeutic strategies. The integration of Autodesk CFD for simulation and MATLAB for numerical analysis in our hybrid approach has been instrumental in deciphering the intricate dynamics of blood flow influenced by fatty streaks. Despite utilizing a simplified aorta model, the core observations concerning the hill-like shape of FS and the behavior of the ESS function are anticipated to remain valid in more sophisticated models and under varied flow conditions.
To further address the limitations highlighted during the review, we acknowledge the challenges associated with validating our model through clinical studies, given the current technological constraints in non-invasively observing fatty streaks. This limitation emphasizes the reliance on computational simulations as a critical tool for advancing our understanding of early atherosclerotic changes. As such, our study not only contributes to the body of knowledge on the pathophysiology of atherosclerosis but also underscores the urgent need for technological advancements in medical imaging. The development of AI-enhanced imaging techniques capable of identifying early markers of atherosclerosis represents a promising frontier for future validation efforts.
Looking ahead, future research should focus on refining our findings by employing more realistic models of the aorta and incorporating a wider array of factors influencing atherosclerosis development and progression. Enhanced computational models, coupled with emerging imaging technologies, hold the potential to significantly advance our comprehension and management of atherosclerosis. The insights gleaned from our study are poised to inform the development of more efficacious prevention and treatment strategies, ultimately contributing to the reduction in atherosclerosis-related morbidity and mortality.


