Article

The Effect of Moisture Content on the Electrical Properties of Graphene Oxide/Cementitious Composites

1
Faculty of Civil Engineering and Mechanics, Kunming University of Science and Technology, Kunming 650500, China
2
Yunnan Key Laboratory of Disaster Reduction in Civil Engineering, Kunming 650500, China
3
International Joint Laboratory for Green Construction and Intelligent Maintenance of Yunnan Province, Kunming 650500, China
4
Faculty of Civil Aviation and Aeronautics, Kunming University of Science and Technology, Kunming 650500, China
*
Authors to whom correspondence should be addressed.
Appl. Sci. 2024, 14(7), 2819; https://doi.org/10.3390/app14072819
Submission received: 1 March 2024 / Revised: 20 March 2024 / Accepted: 25 March 2024 / Published: 27 March 2024
(This article belongs to the Special Issue Effects of Temperature and Humidity on Cement Materials)

Abstract

:
Due to its ability to improve mechanical properties when incorporated into cement, graphene oxide (GO) has received extensive attention from scholars. Graphene oxide is also a filler that improves the self-sensing properties of cement composites (CCs). However, existing studies have not focused sufficient attention on the electric conductivity of cement composites filled with graphene oxide (GO/CCs) and their mechanisms, especially polarization. This study examines the effects of water content and temperature on the electrical conductivity of GO/CCs. GO/CC polarization phenomena are analyzed to reveal the conductive mechanism. The results show that water has a significant influence on the electrical conductivity of GO/CCs. With increasing water loss, the electrical resistivity of GO/CCs increases by four orders of magnitude. For the same water content, a 0.1% GO concentration significantly decreases the resistivity of GO/CCs. Temperature can significantly enhance the current intensity of GO/CCs; furthermore, there is a quadratic relationship between current intensity and temperature. The conductive mechanism of GO/CCs is attributed to the interaction between ionic conductivity and electronic conductivity.

1. Introduction

Cement concrete and cement composites (CCs) are the most commonly used materials in civil engineering. Cement is a powdered material used for making concrete and other construction materials. Cement acts as a binder in concrete, mixing with sand, gravel, and water to form a solid concrete structure. Cement composites are cement blended with other materials such as fibers, lightweight minerals, etc., to enhance the specific properties of cement. Cement is an important component in concrete and cement composites. Under the influence of the environment, cement concrete and concrete composites deteriorate gradually. Due to the lack of effective monitoring tools, it is difficult to obtain the real-time service status of large infrastructures [1]. According to previous research and engineering experience, concrete structural damage or deterioration can be detected and effectively disposed of at an early stage. This prevents irreversible structural damage and potential safety incidents, thereby protecting the safety of people and properties [2]. Low sensitivity, high cost, poor durability, and fragility are the disadvantages of conventional strain sensors, such as resistive strain gauges, fiber optic sensors, and piezoelectric ceramics. The use of these instruments in the inspection of large civil engineering buildings is limited, and their service life is typically shorter than the design service life of most modern civil engineering structures. When buried inside the structure of a building, these sensors can cause cracks inside the building. In addition, the sensor material has a different coefficient of expansion than concrete, which can lead to damage within the structure as a result [3]. Currently, the modification of cement and CCs is a better method. Cement and cement composite materials have deformation- and damage-sensing properties. After the installation of strain sensors, the sensors have the same life as the civil engineering structure and do not cause internal damage. The use of strain sensors is the most promising research area for structural health monitoring [4,5].
The application of carbon nanomaterials in cement has received a lot of attention from researchers. These carbon nanomaterials include carbon black, carbon nanotubes, graphene and its derivatives, etc. [6,7]. The addition of carbon nanomaterials to cementitious materials can improve many aspects of electrical conductivity, mechanical properties, crack resistance, durability, and thermal conductivity [6,7,8,9]. It is widely accepted that the dispersion of carbon nanomaterials is still the key factor inhibiting the performance of composites. As a typical derivative of graphene, graphene oxide (GO) is usually regarded as a monolayer of graphene with oxygen-containing functional groups attached to the surface. Due to the oxygen-containing functional groups attached to the surface of GO, it has better dispersibility than other carbon nanomaterials [10]. There has been an investigation into cement composites (CCs) filled with graphene oxide (GO) (GO/CCs), and the addition of GO enhances the cement’s self-sensing properties and thermoelectric properties. GO can promote cement hydration [11,12], and the cement matrix can form a denser microstructure [13,14,15]. Despite the high cost of GO manufacturing, the optimal GO content is usually in the range of 0.03 wt% to 0.1 wt% [12,13,14]. The cost is not prohibitive from the point of view of manufacturing the sensor and monitoring it over time. It has been found that the tunneling effect of carbon nanomaterials is an important factor affecting the pressure-sensitive properties of cement composites [16]. As graphene has a unique two-dimensional structure, its structure allows electrons to move at high speeds on the graphene surface, with very short electron migration paths and almost no interference from lattice impurities and defects. Therefore, graphene and its derivatives have very high electron mobility and excellent electrical conductivity. When the distance between graphene layers is short enough (usually less than a few nanometers), electrons can jump between neighboring graphene layers via the quantum tunneling effect, thus achieving electron conduction [17,18,19]. This phenomenon of jumping electron conduction is the tunneling effect [20,21,22]. When the GO/CC specimen generates compressive strain, the distance of GO dispersed in the cement matrix is shortened, and more GO can generate a tunneling effect, which increases the electrical conductivity and increases the rate of change in GO/CC resistance. Therefore, GO can enhance the pressure-sensitive performance of GO/CCs [23]. Increasingly, GO is seen as promising for the development of cementitious materials for monitoring purposes [24,25].
There are, however, many mechanisms of GO/CCs that have not yet been explained. In general, it is believed that the conductive mechanism of GO is electronic, and the presence of ions in cement micropores is also conductive. The two mechanisms operate simultaneously [22]. As cement-based sensors operate in a natural environment, changes in ambient temperature and humidity affect the water content and temperature of the cement material, which has an impact on its electrical conductivity. Therefore, changes in water content can interfere with the sensing signal, which can have an impact on the application of the sensor. Water plays a significant role in the electrical conductivity and polarization effect of CCs [23,24]. In the case of pure cement specimens, the ionic conductivity of water causes polarization when measuring material resistance with a DC power supply. To eliminate the influence of the polarization effect caused by moisture, most researchers choose to dry specimens as much as possible before experiments. However, the dry state is not the final use state of cement. When cement is hydrated, tiny voids form and pore water exists in the pores. The conductivity mechanism and polarization of GO/CCs are not fully understood. Wei et al. consider that polarization effects are not expected in dry samples. Polarization effects only occur if the specimen contains water [25]. Zeng et al. mentioned that few studies have focused on the conductive properties of GO/CCs, and it is necessary to further investigate the mechanism of their electrical conductivity properties [26]. In addition, Chung et al. suggest that, from another perspective, polarization phenomena can be used as information to characterize the properties of cement composites. Polarization-based sensing (sensing based on the change in polarization due to a stimulus) is distinguished from widely studied resistance-based sensing (sensing based on the change in resistance due to a stimulus) [22]. For these reasons, it is necessary to investigate the electrical conductivity, DC polarization effect, and the mechanism of electrical conductivity of GO/CCs, and to explore the electrical conductivity of GO/CCs under the influence of multiple environmental factors [27,28,29]. In addition to water content, temperature is also a significant factor affecting the electrical conductivity of CCs [22,30]. Due to the temperature gradient between the surface and the interior of the cement, previous studies investigating the effect of temperature generally employed the method of leaving the specimen in the environment for a period of time before determining its electrical conductivity [27]. However, this method does not reflect the effect of changing ambient temperatures on the material’s conductivity intuitively [31].
The purpose of this study is to investigate the effect of GO concentration and the water content of the specimens on the conductivity and polarization phenomena. In this study, GO/CC specimens were gradually dried six times from a fully saturated state to a dry state. The DC power supply was switched on after each drying procedure, and its resistivity was calculated by collecting the current intensity. In order to analyze the polarization effect, the change in the current curve was recorded. To determine the effect of continuously changing ambient temperature on the conductivity of the specimens energized with a 0.05% concentration, a temperature experiment was conducted. This study reveals the effect of water content and temperature on GO/CC’s conductive properties. In particular, the polarization of GO/CC was investigated and the phenomenon of spike fluctuation in the current curve was found for the first time. This further revealed GO/CC’s conductive mechanism and informs the application of cement-based sensors in natural environments.

2. Materials and Methods

2.1. Materials

The cement material used was standard P.O42.5 ordinary silicate cement, and its chemical composition is shown in Table 1. Polycarboxylate superplasticizers (PCs) (Hunan Zhongyan Building Material Science and Technology Co., Ltd., Changsha, China) were used as the water-reducing agent. The water used for cement was first-grade deionized water with conductivity lower than 0.1 µs/cm (Kehua Test Reagent Co., Ltd., Quanzhou, China). A 20-mesh copper mesh (Yingtan Zhongzhen Copper Science and Technology Co. Reagent Co., Ltd., Hengshui, China) was used as the electrode. An amount of 10 mg/mL of GO hydrogel (Chengdu Organic Chemical Co., Ltd., Chengdu, China), and its chemical and physical properties according to the supplier’s information are shown in Table 2.

2.2. Fabrication of GO/CCs
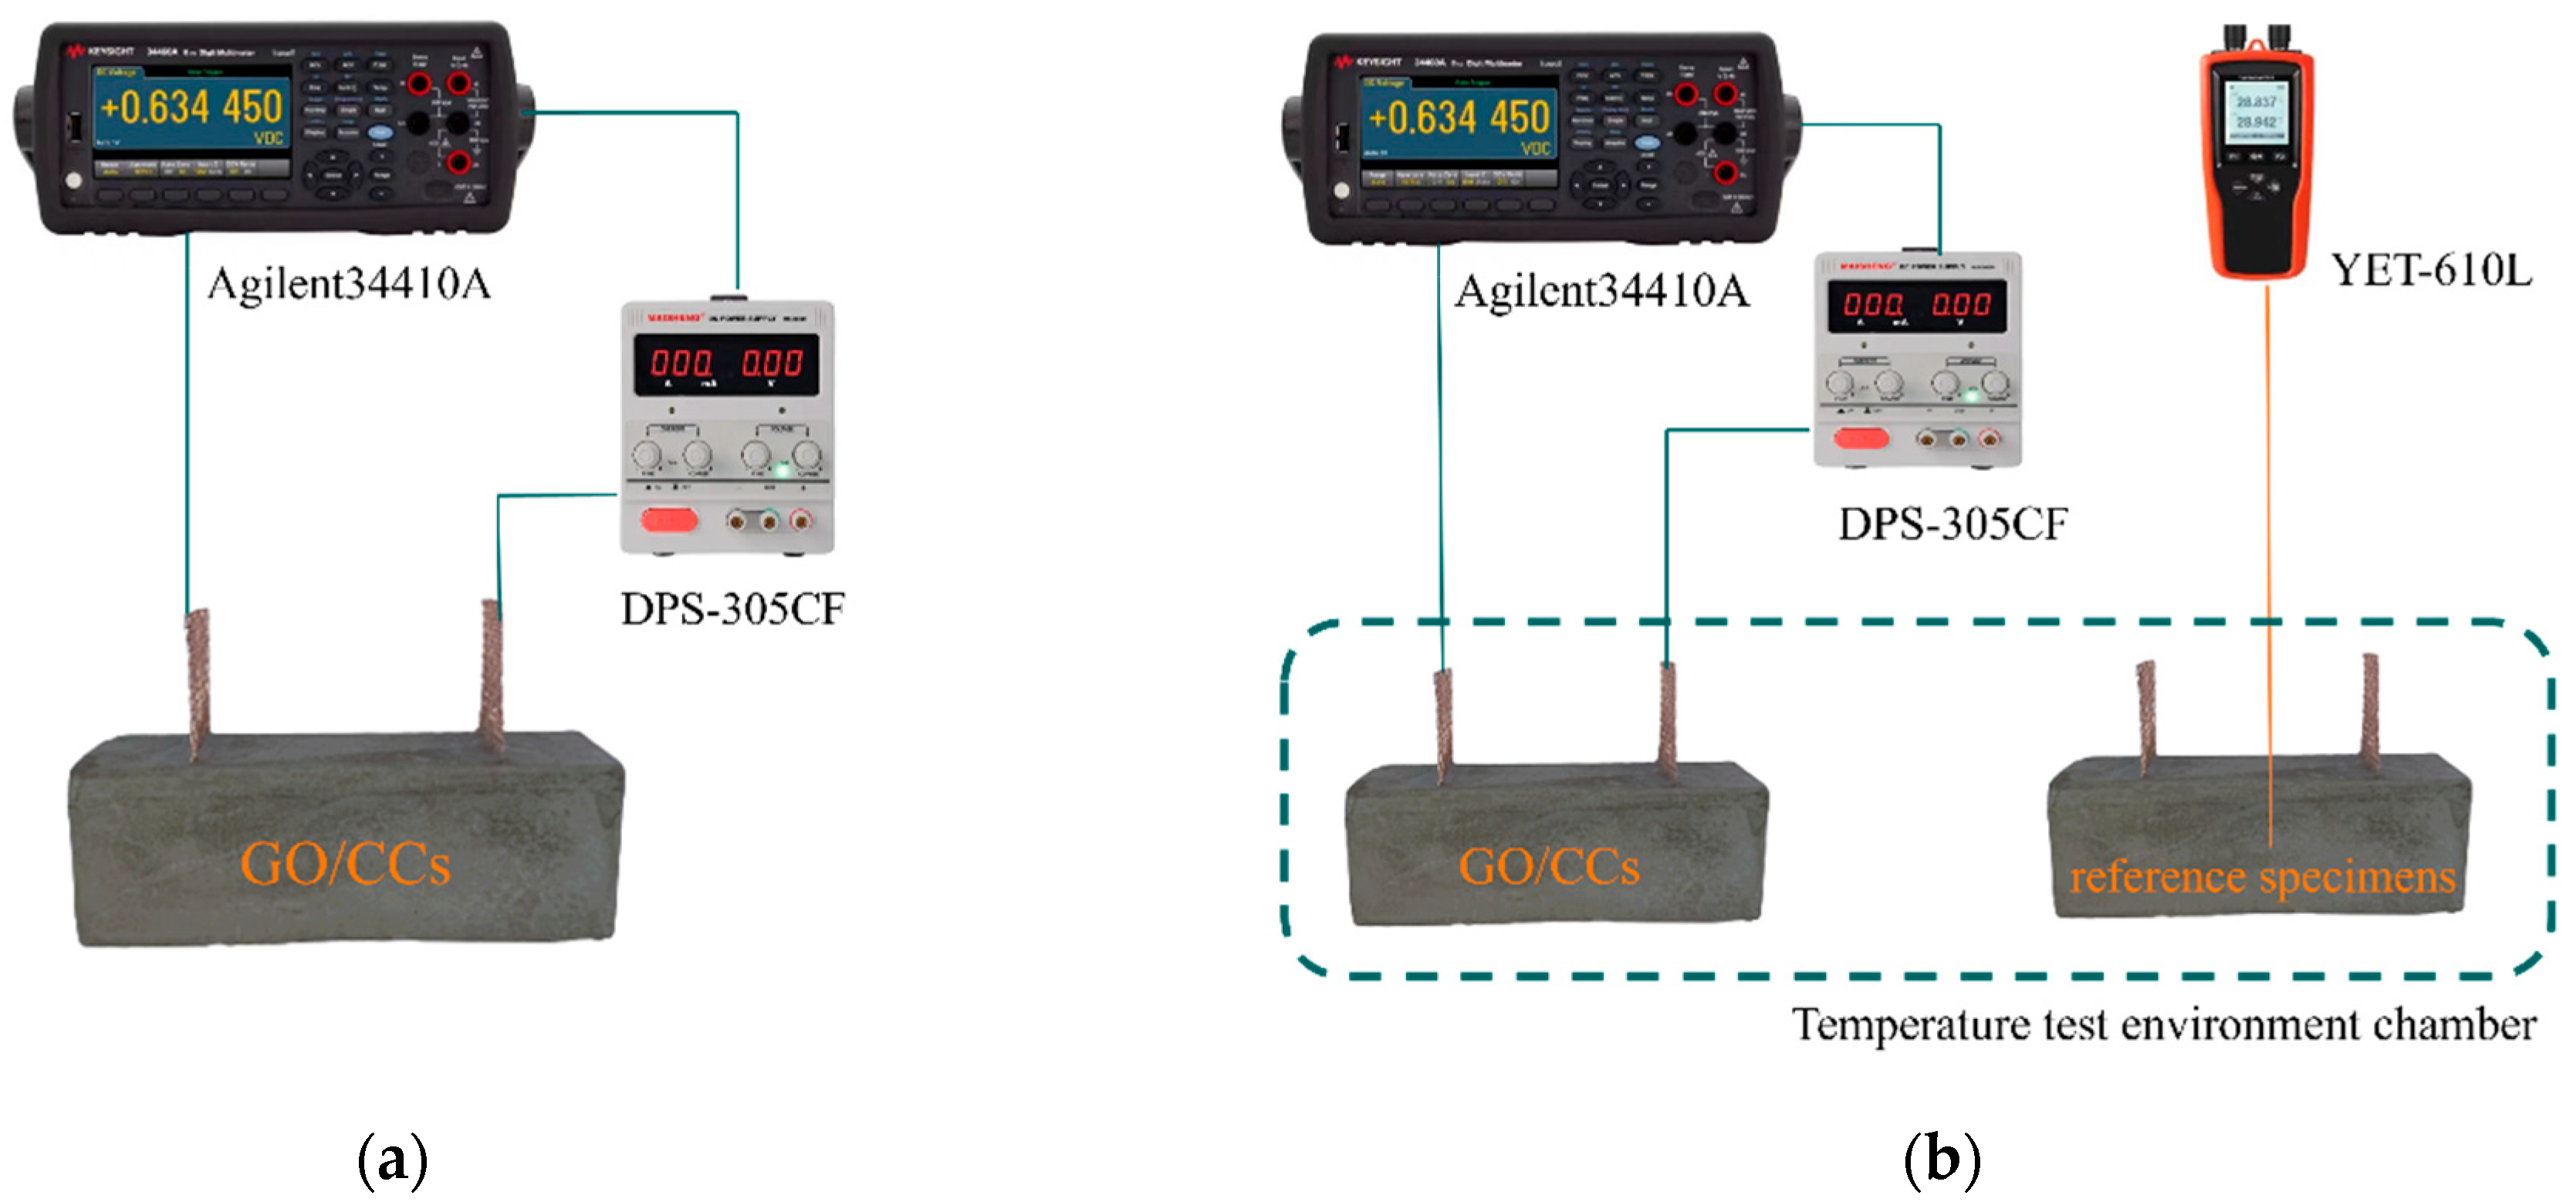
Five GO concentrations of 0%, 0.025%, 0.05%, 0.075%, and 0.1% were prepared to further refine the GO concentration in the previous study [32,33]. Table 3 shows the preparation ratio, and the preparation process is shown in Figure 1.
Figure 1 shows the process of fabrication of the GO/CC samples using an NJ-160A cement mortar mixer (Shaoxing Shangyu Yu Yueda Instrument Factory, Shaoxing, China), following the “GB/T1346-2011 test procedure [33]”. Magnetic Stirring Instrument obtained from Gongyi Chuangyuan Instrument Manufacturing Co., Ltd., Zhengzhou, China. Ultrasonic Instrument obtained from Kunshan Ultrasonic Instrument Co., Ltd., Suzhou, China. The mold dimensions were 20 mm × 20 mm × 60 mm. All molds were cleaned prior to filling. Vibrating and compacting procedures were carried out to remove air bubbles and ensure proper compaction of the specimens. Before the end of the vibration, 20 mm × 35 mm of 20-mesh copper mesh was inserted as an electrode at a distance of 10 mm from the edge. The distance between the two electrodes was 40 mm. Due to the temperature difference between the inside and the surface of the cement specimen, a set of reference specimens was prepared for collecting the internal temperature of the GO/CC specimens when the ambient temperature changed. In the center of the reference specimen, a T-type thermocouple with a diameter of 0.5 mm was embedded. To ensure reproducibility, three parallel specimens were produced for each GO concentration and the reference specimen.

2.3. Methods

The water content of the cement specimen was expressed indirectly through the water loss (WL) value, which was calculated using the following formula:
WL = [(w1 − w2)/w1] × 100%,
After the specimen was cured in the curing environment for 28 days, it was taken out and placed in an oven at 50 °C for 1 h to remove the surface moisture. The weight of the sample was weighed as the initial weight w1, and then the specimen was placed in the oven at 50 °C to dry step by step; the sample was weighed as w2 after the same time interval of drying each time. Maintaining the same drying time ensures the consistency of the drying conditions. All specimens were removed from the oven and allowed to cool to room temperature for 30 min before being tested for electrical conductivity and polarization. Three specimens were tested for each GO concentration level when the WL of the specimens was reduced by approximately 2%.
The conductivity and polarization of the GO/CCs were determined using the method shown in Figure 2a. A DC-regulated power supply DPS-305CF from Dongguan Maisheng Power Technology Co., Ltd. was used to provide a constant voltage (U) of 10 V, and an Agilent 34410A digital multimeter was used to collect the intensity of the current through the specimen (I). It was calculated that R = U/I is the resistance between the two electrodes according to Ohm’s law. In general, the calculated resistance of cementitious materials was converted to volume resistivity, taking into account the effect of different geometries and properties of the specimens. The volume resistivity was calculated using the following formula:
ρ = RA/L,
where L is the distance between the two electrodes inserted in the specimen and A is the cross-sectional area of the copper electrode in mutual contact with the cementitious material. The electrode distances, L, cross-sectional areas, A, and voltages, U, of each specimen in this experiment were the same.
The 0.05% GO concentration specimens were selected to test the effect of temperature on their electrical conductivity. In order to exclude the effect of water, the specimens were dried to a water loss of not less than 9%. The experiments are shown in Figure 2b. The temperature change interval was set from 10 °C to 70 °C, and the ambient temperature rose 15 °C each time, four times in total, from 10 °C to 70 °C. A reference specimen was placed in the same experimental environment, and the temperature change at the center of the specimen was collected through the embedded thermocouple wires.

3. Results and Discussion

3.1. Water Loss of GO/CCs

Figure 3 shows the WL curves of GO/CC specimens under the same drying time. The GO/CC specimens were classified into six states based on their drying times: I, II, III, IV, V, and VI. Table 4 demonstrates the average water loss of specimens at each state. With the same drying time, GO/CCs with high GO concentrations always lost water faster than GO/CCs with low GO concentrations. In stages I–III, the difference in WLs between specimens with different GO concentrations is small. With the increase in drying time, the difference in the WL of specimens with different GO concentrations was larger in stages IV–VI. At stage VI, the difference in water loss between the specimens with the lowest and highest GO concentration was the highest, with a difference of 1.1%. A previous study found that the addition of carbon nanomaterials to cement can promote the hydration reaction of cement, reduce cement porosity, and form a denser microstructure. It can be assumed that the addition of GO increased more continuous micropores, which promoted the diffusion of moisture from the center to the edges [34]; the drying rate was determined to be related to microstructure change.
At the same drying state, GO/CCs with a high GO concentration almost always had higher water loss than those with a low GO concentration. As shown in Table 4, the water content decreased from 7.963 to 7.868 when GO increased from 0.075% to 0.1% (drying state V). This result is because the WL was calculated before the start of the specimen conductivity experiment. During the experiment it was found that if the specimen was dry, it slowly absorbed water from the environment, which resulted in a small decrease in WL; however, the decrease was insignificant. When measuring the 0.075% specimen, the 0.1% specimen absorbed moisture slightly during the waiting process; therefore, the WL of the 0.1% specimen tested was slightly smaller than that of the 0.075% specimen. This occurred in some of the specimens because the difference in WL was small; thus, the absorption of moisture resulted in only a small decrease in WL.

3.2. Conductivity of GO/CCs

3.2.1. Effect of Water Loss on Electrical Conductivity

Figure 4a shows the relationship between the average current intensity of the specimens and the water loss for different GO concentrations in GO/CCs. For WL ≤ 6%, the current intensity decreased linearly with the increase in WL, and the data of resistivity variation with WL for five specimens, 0%, 0.025%, 0.05%, 0.075%, and 0.1%, were fitted linearly; the results are shown as a straight line in Figure 4a. The R2 values were 0.98633, 0.98542, 0.98863, 0.99341, and 0.99151, respectively. When WL ≥ 6%, the decrease in the current intensity became slower and showed a tendency to form an arc. Figure 4b shows the change in volume resistivity of GO/CCs with water loss. When GO/CCs are saturated with water, the volume resistivity is about 50 Ω·m. With the loss of water, the resistivity rises stepwise to about 70, 150, and 400 Ω·m. After a WL of more than 6%, the variability increases dramatically, with the resistivity rising to 1200 Ω·m. After a WL of more than 8%, the resistivity increases to 10,000 Ω·m. Therefore, the volume resistivity of GO/CCs changes the most when the WL exceeds 8%. Therefore, the WL greatly influences the electrical conductivity of GO/CCs, and the increase in electrical conductivity of specimens with different GO concentrations is slightly different. In contrast to the change in GO concentration, water loss has a greater effect on electrical conductivity. According to Yoo et al., the addition of GO (0.05%) reduces the electrical resistivity of the cement, and the conduction mechanism in the cement changes from ionic conduction to combined ionic and electronic conduction [6]. The microstructure of the cement specimen contains numerous microscopic pores, allowing for a higher retention of pore water. In a water-saturated state, ions dissolved in this pore water can conduct between these pores, leading to ionic conductivity. Moisture is a carrier of ionic conductivity, and with increasing WL, the moisture connected in the microscopic pores gradually decreases and ion migration becomes more difficult. Thus, the ionic conductivity in the material decreases linearly with decreasing moisture content [17]. Figure 4 illustrates that the electrical conductivity of GO/CCs at higher moisture content levels is mainly determined by the ionic conductivity in the pore water. Compared with the specimens with 0% GO concentration, the decreasing trend of current intensity of the specimens with 0.025–0.1% GO concentrations demonstrated similar results, thus indicating that ionic conductivity is a dominant factor in the electrical conductivity of GO/CCs.

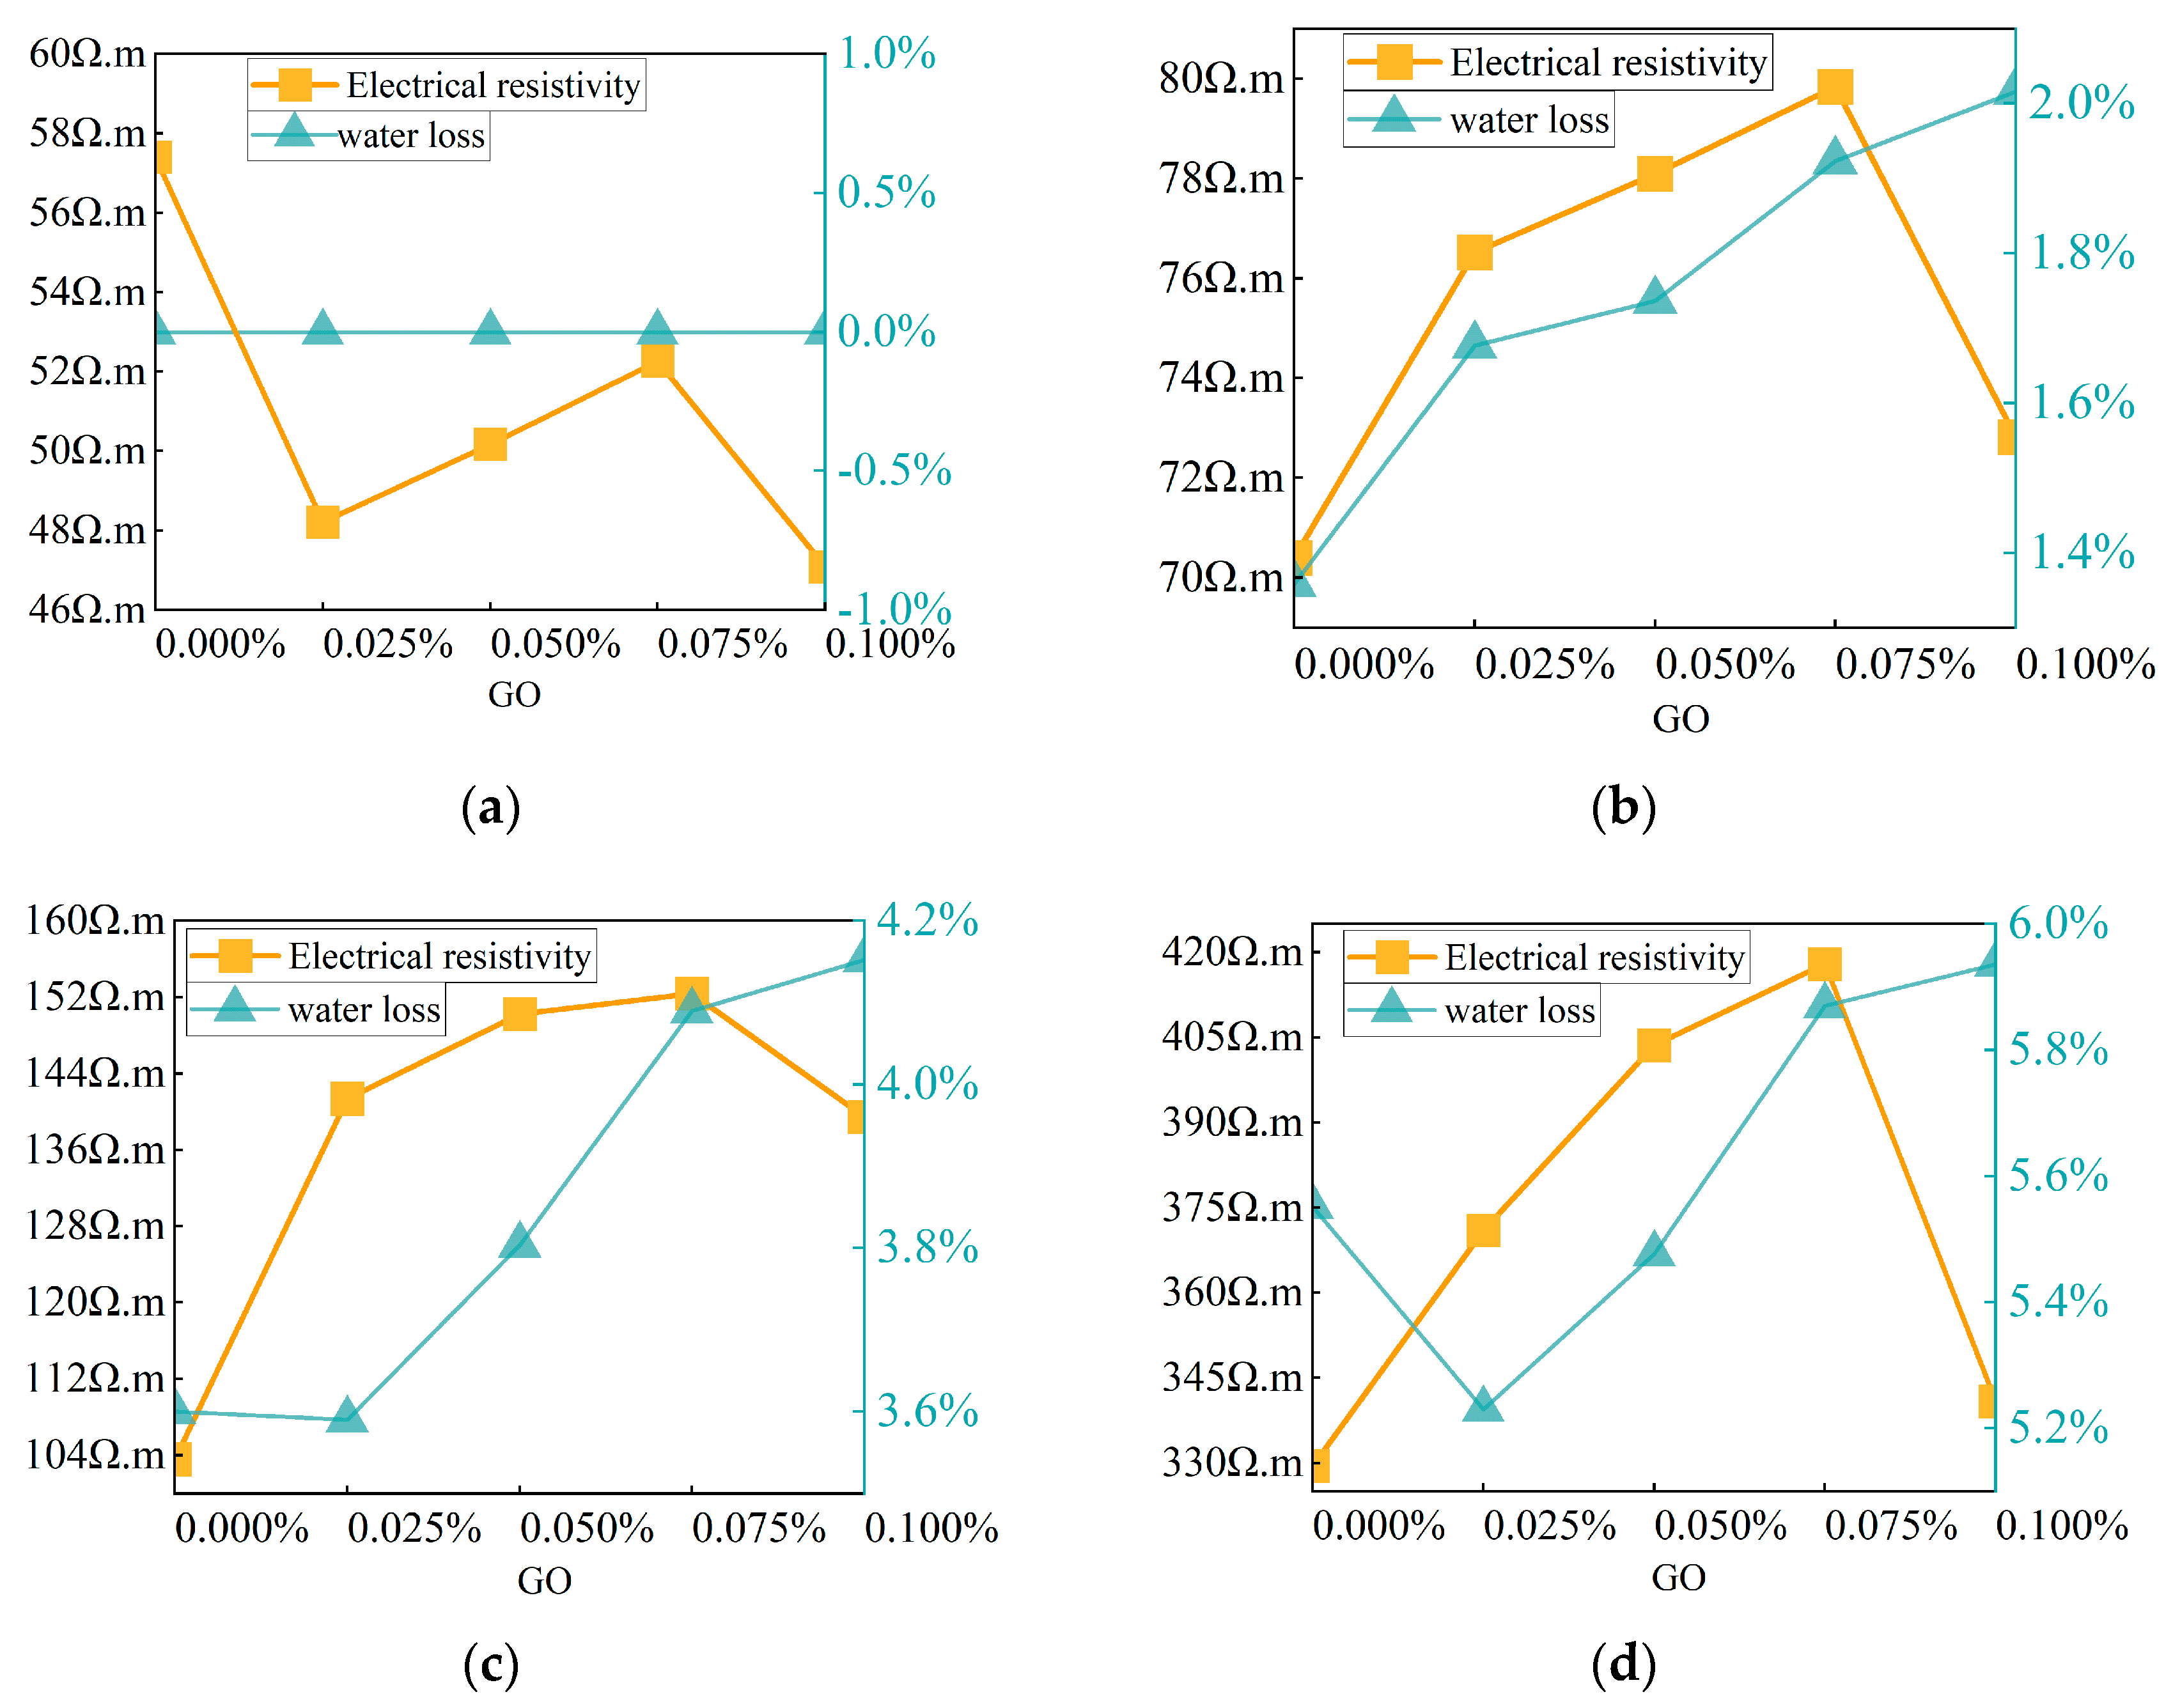
3.2.2. Effect of Different GO Concentrations on Electrical Conductivity

Expanding on the results presented in the previous section, the electrical resistivity of GO/CCs is positively correlated with WL, but the electrical conductivity is still affected by GO concentration when the specimen WL is the same. Figure 5 demonstrates the WL of specimens with different GO-doping concentrations after different drying times and the resulting resistivity values. In Figure 5a, the specimen is in a water-saturated state and thus the specimen’s electrical conductivity is largely governed by ionic conductivity, while the electronic conductivity caused by the increased GO concentration of GO is hardly significant. Therefore, the resistivity of the specimen shown in the figure does not correlate with the GO concentration. As shown in Figure 5b–f, with an increase in GO concentration, the resistivity of the specimen increases first and is followed by a decrease. The probable reason is that the higher GO concentration specimens had higher WL for the same drying time. The addition of 0.025%, 0.05%, and 0.075% GO concentrations reduced resistivity, but this effect failed to counteract the increase in resistivity due to water loss; therefore, the conductivity results showed a decrease with increasing GO concentration. However, the resistivity of the 0.1% GO concentration specimens showed completely different results at different stages. Although more water was lost at 0.1% GO than at 0%, 0.025%, 0.05%, and 0.075% concentrations (the WL of 0.1% was almost the same as the WL of 0.075%), the resistivity of the 0.1% GO concentration specimen was substantially lower. A possible reason is the percolation threshold effect of CCs [17]. It is considered that a 0.1% GO concentration in GO/CCs reaches the percolation threshold in the cement matrix, forming a complete conductive network with a substantial decrease in electrical resistivity. Therefore, the addition of GO at 0.1% concentration significantly reduced the electrical resistivity of GO/CCs, and GO may have reached the percolation threshold at 0.1% GO concentration.

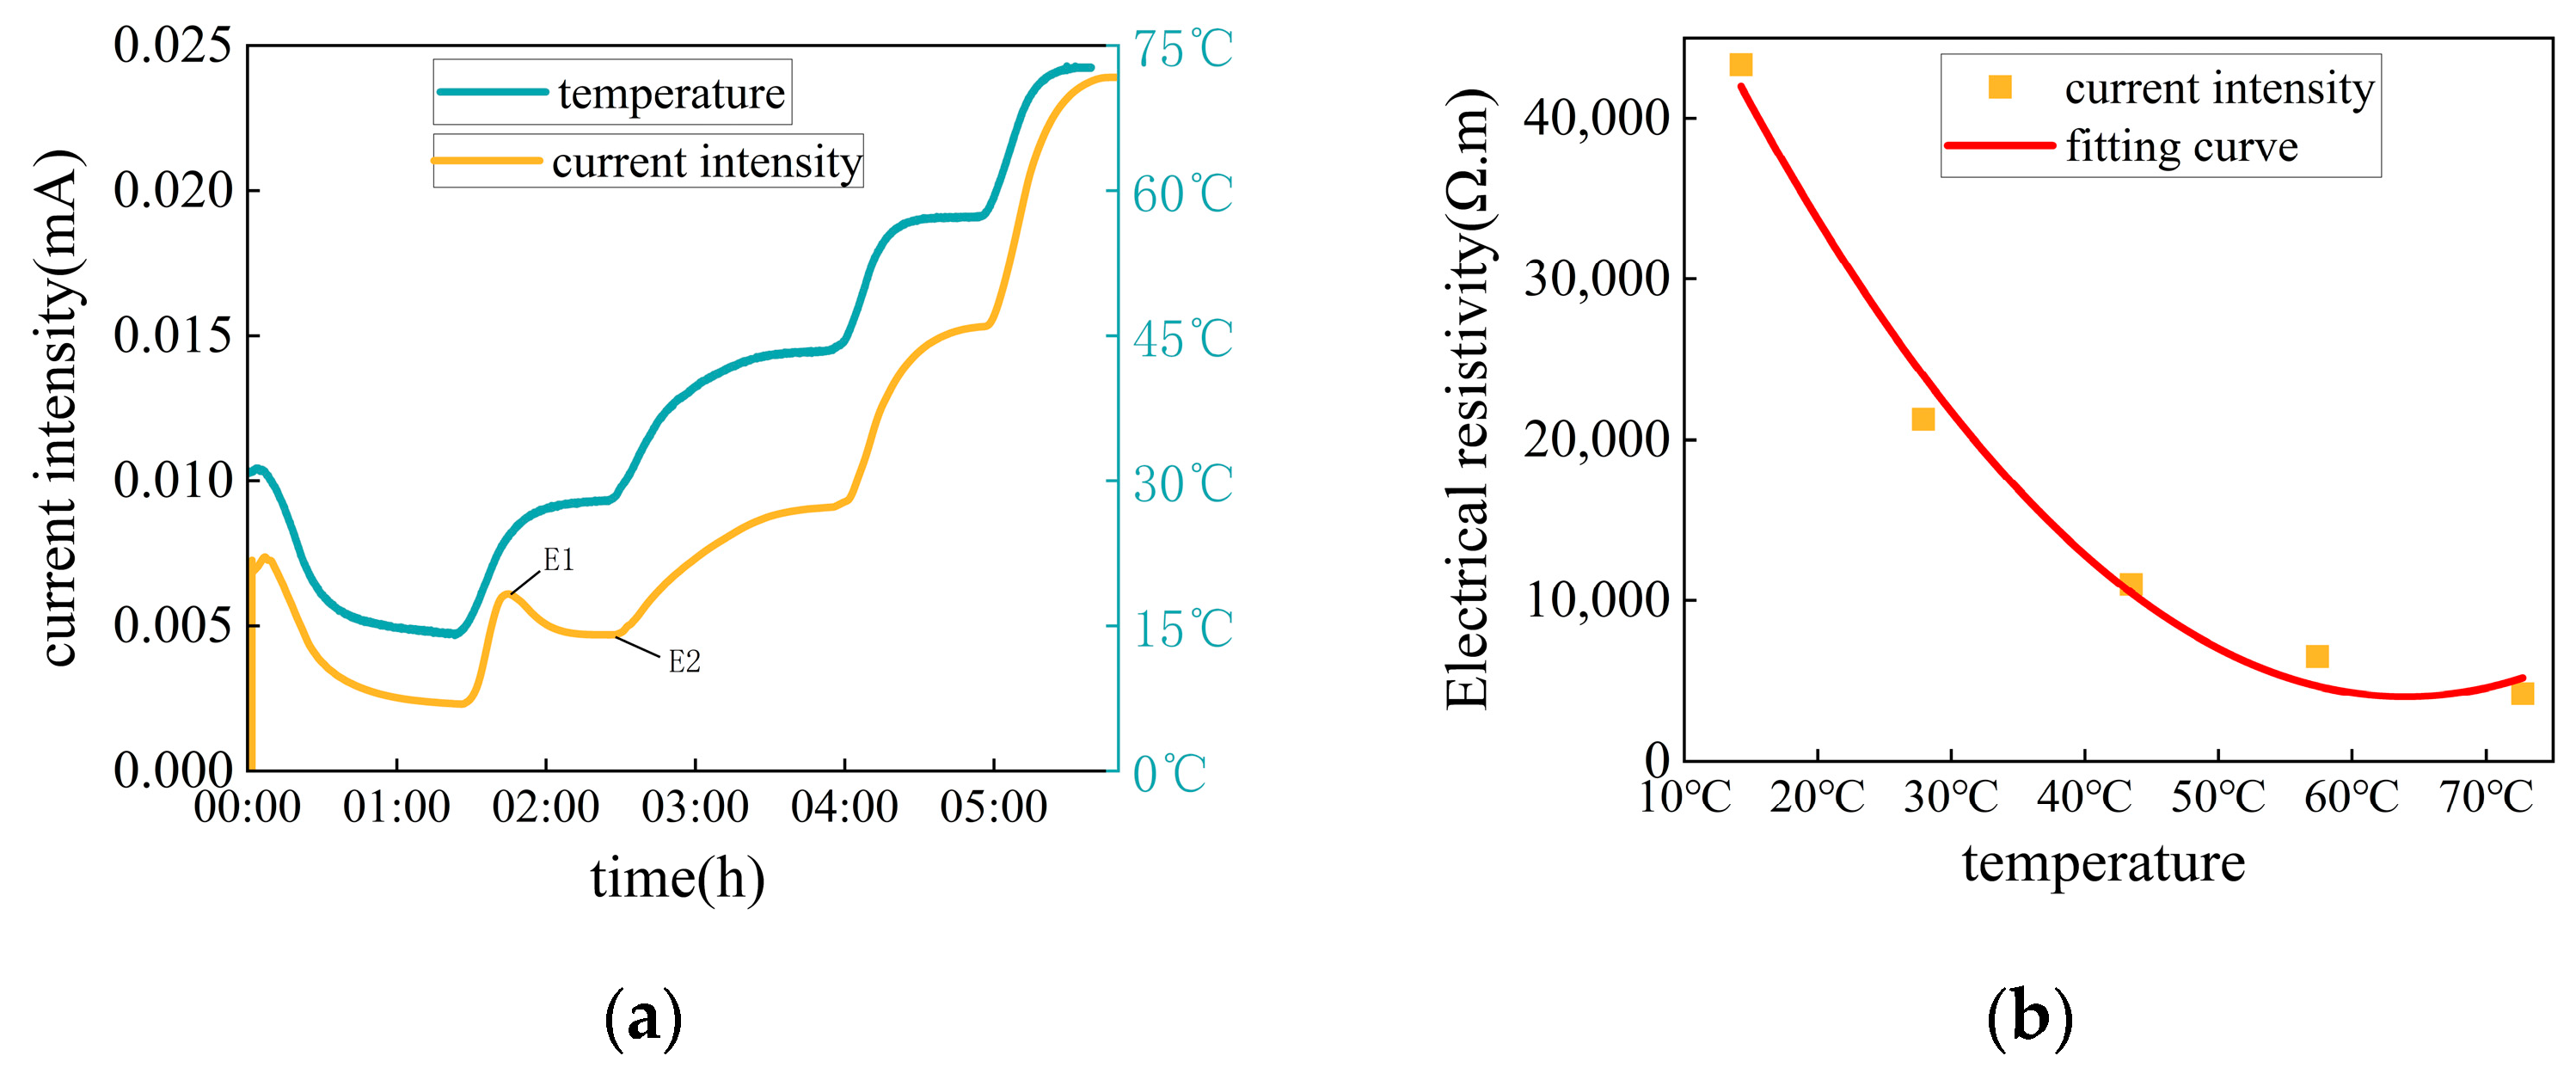
3.2.3. Effect of Temperature on Electrical Conductivity

The GO/CC specimens with WL of 11.09% and 0.05% of GO concentration were subjected to temperature sensitivity tests. In Figure 6a, it can be seen that the trend for the current intensity of GO/CCs is basically the same as the temperature trend. The difference is that when the temperature of the specimens was increased from 10 °C to 25 °C and then stabilized, the current intensity of the specimens changed from an increase to a sudden decrease. This phenomenon was observed in all three parallel specimen tests, but not in the other heating intervals. The value of the current intensity drop, Id = IE1 − IE2, is about 0.001408 mA. It may be that polarization causes this drop. When the ambient temperature stabilizes, the current intensity of the specimen also stabilizes. When the temperature of carbon nanomaterials increases, the tunneling effect is strengthened and more GO conductive networks are formed, thus increasing the electrical conductivity [27].
Figure 6b represents the volume resistivity of the specimen after temperature stabilization. The volume resistivity of the specimen at five different temperatures was fitted. As shown in Equation (3), the volume resistivity versus the temperature curve is a quadratic parabola, R2 = 0.97269. This empirical equation exhibits the volume resistivity of a GO/CC specimen (GO = 0.05%, WL = 11.9%) at different temperatures.
y = 66,832.5939 − 1963.35339 × x + 15.34342 × x2,
Considering that this experiment only measured the conductivity of GO/CCs with temperature for a single GO concentration and drying state, further studies are necessary to determine polarization effects and conductivity with temperature.

3.3. Polarization of GO/CC Specimens

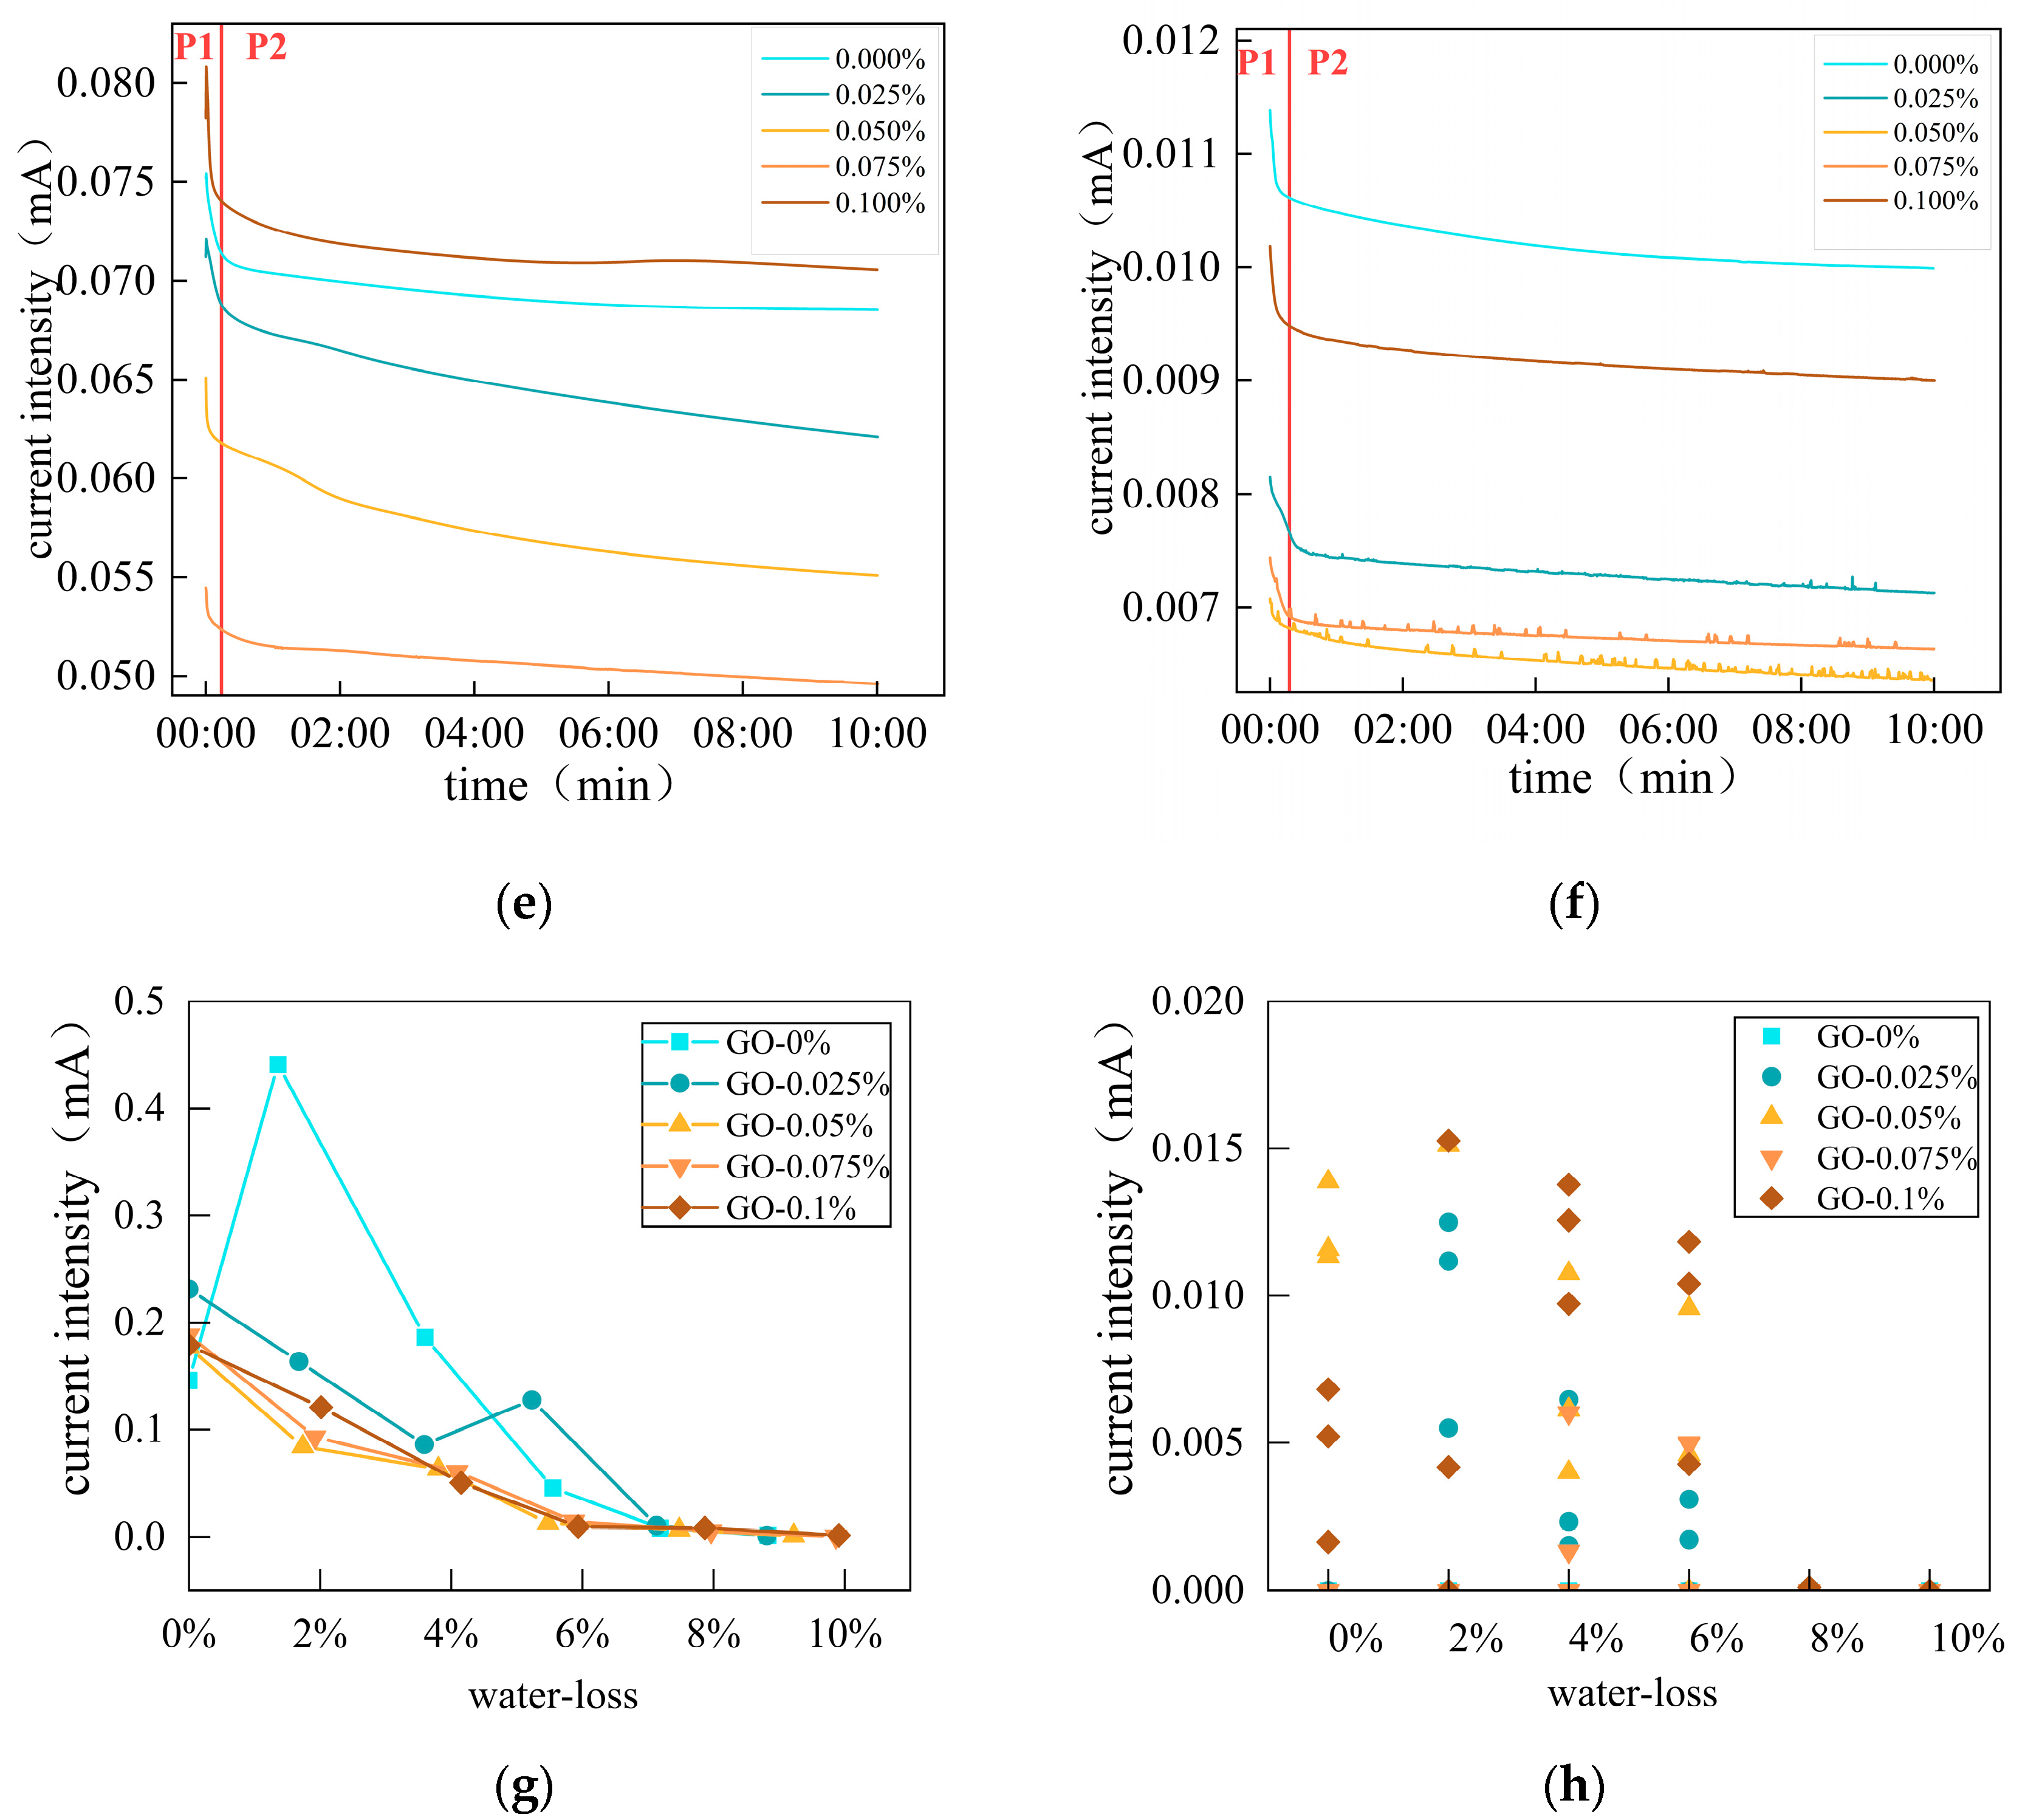
3.3.1. Polarization of GO/CCs with Different GO Concentrations and Drying States

In Figure 7a–f, we can observe the specimen current intensity’s decreasing curve during stages I–VI of water loss. During the ten-minute energization period, it is apparent that the current intensity decreases gradually, that is, the resistivity increases gradually. The current intensity drop can be divided into two stages: P1 and P2. The current intensity of the P1 section decreases rapidly, and the current of P2 shows a slow drop trend. The specimens with different GO concentrations in the six drying states showed similar situations. Figure 7g shows the decrease in current intensity with decreases in water loss, and that this decrease is of the same magnitude after WL > 8% for all GO concentration specimens. The decrease in current intensity of GO/CC specimens with different GO concentrations shows different results for WL < 8%. The decrease in current intensity for specimens with 0% and 0.025% GO concentration is significantly larger, whereas there are large ups and downs for specimens with WL = 2% and 6%. When the WL was more than 8%, the drop values of GO/CCs with 0.05%, 0.075%, and 0.1% GO concentrations were more stable. Furthermore, when the WL was less than 8%, the drop values showed a linear correlation with WL. The drop values of the specimens with high GO concentrations of 0.05%, 0.075%, and 0.1% were smaller than those of the specimens with low GO concentrations of 0% and 0.025%.
At the I, II, III, and IV drying states, as shown in Figure 7, the current curves of the specimens without added GO still showed a large downward trend after ten minutes of energization. This phenomenon may be related to the high moisture content of the specimens, contributed to by the connection of water in the microscopic pores. Ions are constantly migrating towards the poles. Charges in the form of ions cannot enter the electronic conductor via conduction, and so they collect at both ends of the conductor connection: positive ions at one end, and negative ions at the other. Opposite electric fields are formed relative to the power source [22]. Therefore, the current intensity of the specimen decreases over an extended period of time. The gradual enhancement in the opposite electric field causes the decreasing trend to change from fast to slow, such as in the P1 and P2 stages. For the specimen with 0.025% GO concentration, due to the lower GO concentration, the decreasing amplitude in the I, II, III, IV, and V drying states is almost the same as that of the blank group; the current rebound phenomenon occurs only in the II and III drying states. This is because the conductivity of the specimen is still dominated by ionic conductivity, and the electronic conductivity of GO fails to have a large impact. Compared with the specimens with 0% and 0.025% GO concentrations, the current trend of the specimens with 0.05%, 0.075%, and 0.1% GO concentrations was obviously stabilized after a period of energization. Not only did the decreasing trend slow down significantly, but the current rebound phenomenon was observed at different drying states. Therefore, it is concluded that the addition of GO can attenuate the polarization, slow down the decreasing trend of the current, and lead to a rebound of the current.
The current rebound phenomenon was analyzed for different specimens. The rebound phenomenon is affected by both GO concentration and WL. Figure 7h demonstrates the current intensity uplift values of the rebound phenomenon at different drying states for different GO concentrations. It is shown that the current intensity rebound phenomenon was not observed for specimens with 0% GO concentration drying states. It can be assumed that the addition of GO led to this phenomenon. It was found that the current rebound phenomenon did not occur in almost all specimens at WL ≥ 8%; this may be due to the weak ionic conductivity of the specimens at high water loss rates. The occurrence of the rebound phenomenon is considered to be related to ionic conductivity and GO addition. As shown in Figure 7f, at drying state VI, the phenomenon of spike fluctuations in the current intensity curves of the specimens was observed; therefore, further investigation was carried out for each GO concentration specimen at drying state VI.

3.3.2. Spike Fluctuation of the Current Curve at Low Moisture Content State

Figure 8 shows the current curves for drying state VI. The WL values of the specimens at this point are greater than 8.8%. There were three parallel specimens for each GO concentration to ensure the reproducibility of the experimental phenomena. As shown in the figure, the GO/CCs with GO concentrations of 0.025%, 0.05%, and 0.075% showed a spike fluctuation phenomenon. This was due to a sudden increase in current intensity followed by a return to the original current intensity in this state. This indicates a sudden decrease in resistance value followed by an immediate return to the original resistance value. This phenomenon occurs frequently in specimens with 0.05% and 0.075% GO concentrations and less frequently in specimens with 0.025% GO concentration. The current curve of the blank group without GO concentration is very smooth without any spike fluctuations. Therefore, GO concentration is believed to be responsible for this phenomenon. Interestingly, the current curves of the specimens with 0.1% GO concentration were similarly smooth, which may be a result of the combined effect of ionic and electronic conductivity; however, higher GO concentration (0.1%) did not lead to a more pronounced phenomenon. This result may be due to the fact that the GO/CCs with 0.1% GO concentration reached the percolation threshold, forming a conductive network with a conductivity dominated by electronic conductivity and less affected by ionic conductivity [17]. There is a complex interaction between ionic conductivity and electronic conductivity [34]. Some scholars have equated this to a parallel resistive equivalent circuit consisting of pore water, cement, and carbon nanomaterials [35]. Figure 9 shows the electronic and ionic conduction mechanism of microscopic GO/CCs in two-dimensional form. The blue part represents the pore water in the microscopic cracks of the cement, where water-based ionic conductivity exists. The black hexagon represents the GO particles dispersed in the cement matrix. The yellow arrows between neighboring GO particles indicate the pathway of the electron tunneling effect, and the green arrows indicate the migration pathway of ion-conducting ions.
Electrical resistivity is a reliable indicator of composite self-perception. It has been shown that two mechanisms exist for CC conductivity. Ionic conductivity is present in cement matrix pore water and electronic conductivity is generated by carbon nanomaterials. The ionic conductivity is caused by the movement of ions such as Ca+, Na+, OH , and (SiO42−) in the cement matrix pore fluid. Electronic conductivity is caused by electron movement on the surface of carbon nanomaterials. The electrons can jump between neighboring carbon nanomaterials to form a tunneling effect, or they can produce contact conductivity through connected carbon nanomaterials. The final electrical conductivity of GO/CCs is the result of the combined effect of ionic conductivity and electronic conductivity [22,32].
Ya Wei et al. argued that water forms an energy barrier in the moving direction of the carrier [36]. This solid–liquid interface constitutes an energy barrier in the direction of the movement of the carrier [25]. According to Mao et al., when the bare ion is near and above the molecule sheet, it can capture electrons from the graphene fragment via polarization interaction [37]. The more probable cause is that the ions in the water are preventing electron migration. Since ionic conductivity coexists with electronic conductivity, ions migrating in water may prevent electron movement between two neighboring GO particles. Thus, two GO particles are not able to generate a tunneling effect, disrupting a part of the electron-conducting network. The GO particles on the upper left were unable to migrate electrons with the GO particles on the lower left as a result of ion migration in water, as shown in Figure 9. Due to this, the addition of GO to specimens with a high water content has a less significant effect on electrical conductivity, and electrical conductivity is dominated by ionic conductivity, which decreases with increasing WL.
In the lower water content state, the pore water decreases, the ionic conductivity gradually weakens, and the ion migration gradually decreases. In this instance, the ions pass intermittently through the spacing between two GO particles, which has an intermittent effect on the tunneling effect of electron leaps. Therefore, the conductive network of the GO particles is intermittently connected and disconnected, leading to spike fluctuations in the current. The current rebound phenomenon in the specimens may be caused by the gradual connection of the electronic network after the ionic conductivity is weakened.

3.4. SEM of GO/CC Specimens

Figure 10 shows the microscopic morphology of pure cement and a GO/CC specimen (×5000). It can be seen that there are a large number of holes, pores, and burr-like crystals in pure cement, the surface burrs are many and very messy, the larger holes provide more space for the growth of needle-like crystals, and its microstructure is relatively loose. In the specimen with 0.05% GO, the pores and burr-like crystals in the cement matrix were significantly reduced, the pore size was smaller, and the microscopic morphology was denser than pure cement. Upon further observation of the specimens with 0.1% GO doping, almost no burrs or pores could be seen, and the surface was very smooth and dense; although some tiny pores (see SEM enlargement) could still be found, the whole microstructure was denser. It is generally believed that the addition of GO helps to refine and evenly distribute the pores in a cement matrix, making the microstructure denser and improving the mechanical strength of the material. Zhang et al. concluded that the high dosage of GO resulted in finer microscopic pores than the low dosage, which aided the water loss. During drying, water is first lost from the edges of the material; evaporated water diffuses from the core of the specimen to the edges, and this diffusion is facilitated in highly doped specimens [35]. A similar morphology was observed in this SEM, where the specimens with 0.1% doped material had finer micropores, which explains the phenomenon that the highly doped specimens always lost water faster than the low-doped specimens. The distribution of a large number of pores was observed for both the cement net paste and the GO/CCs. These pores can hold a higher amount of pore water. Therefore, in the aqueous state, the ions dissolved in the pore water can conduct between these pores and produce ionic conductivity.

4. Conclusions

  • Water content is the main factor affecting the electrical conductivity of GO/CCs. The conductivity of GO/CCs decreases linearly with the increase in water loss, and the rate of conductivity decreases slowly when water loss exceeds 6%. The addition of GO has little effect on conductivity when the water content is close to saturation. When the water content is not saturated, a 0.1% GO concentration can significantly increase the electrical conductivity of GO/CCs.
  • Temperature has a significant effect on the conductivity of GO/CCs, and the current intensity of GO/CCs increases tenfold when the temperature is increased from 10 °C to 70 °C. The fitted curves yield a quadratic correlation between the conductivity of GO/CCs and the temperature change.
  • The addition of GO attenuates the polarization phenomenon of GO/CCs. When water loss is <8% and the GO content is ≥0.05%, the current intensity value decrease during the polarization of GO/CCs is linearly correlated with water loss. This could be used to gauge the water content of GO/CCs.
  • The combined effect of ion migration in the water and electron migration on the GO surface constitutes the conductive mechanism of GO/CCs. Ion migration interferes with the electron migration paths, which are connected when the ionic conductivity is weakened.
This study reveals the conductivity mechanism of GO/CCs and the effects of water content and GO doping on their conductivity. The conductivity of GO/CCs originates from the combined effect of ionic conductivity in microscopic pore water and the electronic conductivity on the surface of GO. In particular, the polarization of GO/CC was investigated and the phenomenon of spike fluctuation in the current curve was found for the first time. GO is believed to be the cause of this phenomenon. Cement-based sensors should be considered for waterproofing treatment or the elimination of moisture perturbation. This provides a reference for the design of cement-based sensors for GO/CCs and advances the application of cement-based sensors in natural environments.

Author Contributions

Conceptualization, Z.L., H.X. and K.Z.; methodology, Z.L., H.X. and F.Y.; supervision, H.X.; formal analysis, Z.L. and K.Z.; investigation, Z.L.; resources, R.G.; data curation, R.G.; writing—original draft preparation, Z.L.; writing—review and editing, K.Z. and H.X.; visualization, F.Y.; software, F.Y. and R.G. All authors have read and agreed to the published version of the manuscript.

Funding

This research was funded by the National Natural Science Foundation of China (Grant No. 11962009).

Institutional Review Board Statement

Not applicable.

Informed Consent Statement

Not applicable.

Data Availability Statement

The data presented in this study are available upon request from the corresponding author.

Acknowledgments

The authors would like to thank the Yunnan Key Laboratory of Disaster Reduction in Civil Engineering. We also thank Yuxia Suo for the guidance and assistance provided to the first author of this study.

Conflicts of Interest

The authors declare no conflicts of interest.

References

  1. Han, B.; Ding, S.; Yu, X. Intrinsic self-sensing concrete and structures: A review. Measurement 2015, 59, 110–128. [Google Scholar] [CrossRef]
  2. Lin, Y.; Du, H. Graphene reinforced cement composites: A review. Constr. Build. Mater. 2020, 265, 120312. [Google Scholar] [CrossRef]
  3. Cassese, P.; Rainieri, C.; Occhiuzzi, A. Applications of Cement-Based Smart Composites to Civil Structural Health Monitoring: A Review. Appl. Sci. 2021, 11, 8530. [Google Scholar] [CrossRef]
  4. Downey, A.; Garcia-Macias, E.; D’Alessandro, A.; Laflamme, S.; Castro-Triguero, R.; Ubertini, F. Continuous and embedded solutions for SHM of concrete structures using changing electrical potential in self-sensing cement-based composites. In Proceedings of the Nondestructive Characterization and Monitoring of Advanced Materials, Aerospace, and Civil Infrastructure, Portland, OR, USA, 25–29 March 2017; p. 10169. [Google Scholar] [CrossRef]
  5. Reddy, P.N.; Kavyateja, B.V.; Jindal, B.B. Structural health monitoring methods, dispersion of fibers, micro and macro structural properties, sensing, and mechanical properties of self-sensing concrete—A review. Struct. Concr. 2021, 22, 793–805. [Google Scholar] [CrossRef]
  6. Yoo, D.-Y.; You, I.; Zi, G.; Lee, S.-J. Effects of carbon nanomaterial type and amount on self-sensing capacity of cement paste. Measurement 2019, 134, 750–761. [Google Scholar] [CrossRef]
  7. Yu, H.; Lei, Y.; Pei, C.; Wei, L.; Zhu, J.H.; Xing, F. Enhancing the mechanical and functional performance of carbon fiber reinforced cement mortar by the inclusion of a cost-effective graphene nanofluid additive. Cem. Concr. Compos. 2022, 134, 104777. [Google Scholar] [CrossRef]
  8. Zhang, P.; Wang, M.; Han, X.; Zheng, Y. A review on properties of cement-based composites doped with graphene. J. Build. Eng. 2023, 70, 106367. [Google Scholar] [CrossRef]
  9. Verma, P.; Chowdhury, R.; Chakrabarti, A. Effect of adding highly reduced graphene oxide (rGO) nanosheets based nanomaterial on cement composites. Mater. Today Proc. 2023, in press. [Google Scholar] [CrossRef]
  10. Gladwin Alex, A.; Kedir, A.; Gebrehiwet Tewele, T. Review on effects of graphene oxide on mechanical and microstructure of cement-based materials. Constr. Build. Mater. 2022, 360, 129609. [Google Scholar] [CrossRef]
  11. Lu, D.; Shi, X.; Zhong, J. Interfacial bonding between graphene oxide coated carbon nanotube fiber and cement paste matrix. Cem. Concr. Compos. 2022, 134, 104802. [Google Scholar] [CrossRef]
  12. Meng, S.; Ouyang, X.; Fu, J.; Niu, Y.; Ma, Y. The role of graphene/graphene oxide in cement hydration. Nanotechnol. Rev. 2021, 10, 768–778. [Google Scholar] [CrossRef]
  13. Rezakhani, D.; Jafari, A.H.; Hajabassi, M. Durability, mechanical properties and rebar corrosion of slag-based cement concrete modified with graphene oxide. Structures 2023, 49, 678–697. [Google Scholar] [CrossRef]
  14. Kong, X.; Wang, R.; Zhang, T.; Sun, R.; Fu, Y. Effects of graphene oxygen content on durability and microstructure of cement mortar composites. Constr. Build. Mater. 2022, 354, 129121. [Google Scholar] [CrossRef]
  15. Yoon, H.N.; Jang, D.; Kil, T.; Lee, H.K. Influence of various deterioration factors on the electrical properties of conductive cement paste. Constr. Build. Mater. 2023, 367, 130289. [Google Scholar] [CrossRef]
  16. Fan, Y.; Yang, J.; Ni, Z.; Hang, Z.; Feng, C.; Yang, J.; Su, Y.; Weng, G.J. A two-step homogenization micromechanical model for strain-sensing of graphene reinforced porous cement composites. J. Build. Eng. 2023, 71, 106546. [Google Scholar] [CrossRef]
  17. Jiang, L.; Liu, Z.; Yu, Y.; Ben, X. The effect of graphene on the conductivity of magnesium sulfate cement. Constr. Build. Mater. 2021, 312, 125342. [Google Scholar] [CrossRef]
  18. Han, J.; Pan, J.; Cai, J. Self-sensing properties and piezoresistive effect of high ductility cementitious composite. Constr. Build. Mater. 2022, 323, 126390. [Google Scholar] [CrossRef]
  19. Qi, G.; Wang, Q.; Zhang, R.; Guo, Z.; Zhan, D.; Liu, S. Effect of rGO/GNP on the electrical conductivity and piezoresistance of cement-based composite subjected to dynamic loading. Constr. Build. Mater. 2023, 368, 130340. [Google Scholar] [CrossRef]
  20. Edwards, N.J.; Lin, Y.; Du, H.; Ruan, D. Effect of graphene oxide on cement mortar under quasi-static and dynamic loading. J. Build. Eng. 2023, 74, 106783. [Google Scholar] [CrossRef]
  21. Duan, Z.; Zhang, L.; Lin, Z.; Fan, D.; Saafi, M.; Castro Gomes, J.; Yang, S. Experimental test and analytical modeling of mechanical properties of graphene-oxide cement composites. J. Compos. Mater. 2018, 52, 3027–3037. [Google Scholar] [CrossRef]
  22. Chung, D.D.L.; Xi, X. A review of cement-based materials as electroceramics. Ceram. Int. 2023, 49, 24621–24642. [Google Scholar] [CrossRef]
  23. Li, H.; Xiao, H.; Ou, J. Electrical property of cement-based composites filled with carbon black under long-term wet and loading condition. Compos. Sci. Technol. 2008, 68, 2114–2119. [Google Scholar] [CrossRef]
  24. Fan, Y.; Ni, Z.; Mu, S.; Hang, Z.; Wang, Y.; Feng, C.; Su, Y.; Weng, G.J. Hybrid micromechanical modelling and experiments on electrical conductivity of graphene reinforced porous and saturated cement composites. Cem. Concr. Compos. 2023, 141, 105148. [Google Scholar] [CrossRef]
  25. Wei, J.; Zhang, Q.; Zhao, L.; Hao, L.; Nie, Z. Effect of moisture on the thermoelectric properties in expanded graphite/carbon fiber cement composites. Ceram. Int. 2017, 43, 10763–10769. [Google Scholar] [CrossRef]
  26. Zeng, H.; Qu, S.; Tian, Y.; Hu, Y.; Li, Y. Recent progress on graphene oxide for next-generation concrete: Characterizations, applications and challenges. J. Build. Eng. 2023, 69, 106192. [Google Scholar] [CrossRef]
  27. Dong, W.; Li, W.; Lu, N.; Qu, F.; Vessalas, K.; Sheng, D. Piezoresistive behaviours of cement-based sensor with carbon black subjected to various temperature and water content. Compos. Part B Eng. 2019, 178, 107488. [Google Scholar] [CrossRef]
  28. Dong, W.; Li, W.; Vessalas, K.; He, X.; Sun, Z.; Sheng, D. Piezoresistivity deterioration of smart graphene nanoplate/cement-based sensors subjected to sulphuric acid attack. Compos. Commun. 2021, 23, 100563. [Google Scholar] [CrossRef]
  29. Dong, W.; Li, W.; Zhu, X.; Sheng, D.; Shah, S.P. Multifunctional cementitious composites with integrated self-sensing and hydrophobic capacities toward smart structural health monitoring. Cem. Concr. Compos. 2021, 118, 103962. [Google Scholar] [CrossRef]
  30. Zhou, Z.; Xie, N.; Cheng, X.; Feng, L.; Hou, P.; Huang, S.; Zhou, Z. Electrical properties of low dosage carbon nanofiber/cement composite: Percolation behavior and polarization effect. Cem. Concr. Compos. 2020, 109, 103539. [Google Scholar] [CrossRef]
  31. Del Moral, B.; Baeza, F.J.; Navarro, R.; Galao, O.; Zornoza, E.; Vera, J.; Farcas, C.; Garcés, P. Temperature and humidity influence on the strain sensing performance of hybrid carbon nanotubes and graphite cement composites. Constr. Build. Mater. 2021, 284, 122786. [Google Scholar] [CrossRef]
  32. Guo, R.; Suo, Y.; Xia, H.; Yang, Y.; Ma, Q.; Yan, F. Study of Piezoresistive Behavior of Smart Cement Filled with Graphene Oxide. Nanomaterials 2021, 11, 206. [Google Scholar] [CrossRef] [PubMed]
  33. Suo, Y.; Guo, R.; Xia, H.; Yang, Y.; Yan, F.; Ma, Q. Study on modification mechanism of workability and mechanical properties for graphene oxide-reinforced cement composite. Nanomater. Nanotechnol. 2020, 10, 184798042091260. [Google Scholar] [CrossRef]
  34. Zhang, J.; Heath, A.; Abdalgadir, H.M.T.; Ball, R.J.; Paine, K. Electrical impedance behaviour of carbon fibre reinforced cement-based sensors at different moisture contents. Constr. Build. Mater. 2022, 353, 129049. [Google Scholar] [CrossRef]
  35. Wang, H.; Zhang, A.; Zhang, L.; Wang, Q.; Yang, X.H.; Gao, X.; Shi, F. Electrical and piezoresistive properties of carbon nanofiber cement mortar under different temperatures and water contents. Constr. Build. Mater. 2020, 265, 120740. [Google Scholar] [CrossRef]
  36. Wei, Y.; Cui, Y.; Wang, Y. Ionic thermoelectric effect of pure cement paste and its temperature sensing performance. Constr. Build. Mater. 2023, 364, 129898. [Google Scholar] [CrossRef]
  37. Mao, F.; Zhang, C.; Gao, C.Z.; Dai, J.; Zhang, F.S. The effects of electron transfer on the energy loss of slow He2+, C2+, and C4+ ions penetrating a graphene fragment. J. Phys. Condens. Matter 2014, 26, 085402. [Google Scholar] [CrossRef] [PubMed]
Figure 1. Flow chart of GO/CC specimen preparation.
Applsci 14 02819 g001
Figure 2. Schematic diagram of the experiment: (a) current intensity acquisition method; (b) ambient temperature sensitivity test.
Applsci 14 02819 g002
Figure 3. (a) Specimen weight variation with drying time; (b) variation in water loss with drying time.
Applsci 14 02819 g003
Figure 4. Effect of water loss on electrical conductivity: (a) specimen conductivity variation with water loss; (b) specimen electrical resistivity with water loss.
Applsci 14 02819 g004
Figure 5. The electrical resistivity of the specimens with varying GO concentrations at different drying states: (a) drying state I; (b) drying state II; (c) drying state III; (d) drying state IV; (e) drying state V; (f) drying state VI.
Applsci 14 02819 g005aApplsci 14 02819 g005b
Figure 6. The plot of current intensity versus temperature for the 0.05% GO/CC: (a) effect of temperature on current intensity; (b) current intensity versus temperature change fitting curve.
Applsci 14 02819 g006
Figure 7. Polarization phenomenon and current intensity change: (a) drying state I; (b) drying state II; (c) drying state III; (d) drying state IV; (e) drying state V; (f) drying state VI; (g) specimen current intensity drop value; and (h) specimen current strength recovery value.
Applsci 14 02819 g007aApplsci 14 02819 g007b
Figure 8. Current curve spike fluctuation phenomenon of GO/CCs in low water content state. Current curves of different GO concentration specimens: (a) 0% GO concentration; (b) 0.025% GO concentration; (c) 0.05% GO concentration; (d) 0.075% GO concentration; and (e) 0.1% GO concentration.
Applsci 14 02819 g008
Figure 9. Two-dimensional planar schematic of the microscopic electrical conductivity mechanism of GO/CCs.
Applsci 14 02819 g009
Figure 10. SEM of pure cement specimens and GO/CC specimens with 0.05% and 0.1% GO dosages.
Applsci 14 02819 g010
Table 1. Chemical composition of cement.
ComponentSiO2CaOAl2O3MgOSO3Fe2O3
Percentage (%)24.9951.428.263.712.514.03
Table 2. Chemical and physical properties of GO *.
Diameter
(μm)
Thickness
(nm)
LayersPurityElement (%)
CarbonOxygenSulfur
0.5–30.55–1.2<3>99%68.4430.920.63
* GO: graphene oxide.
Table 3. Mix proportions of cement pastes.
Cement (g)w/cDeionized Water (g)GO (%)GO (g)PCs (g)
5000.351750.00003.6
5000.351750.0250.1253.6
5000.351750.0500.253.6
5000.351750.0750.3753.6
5000.351750.1000.53.6
Table 4. Water loss of GO/CC specimens.
GO ConcentrationDrying State IDrying State IIDrying State IIIDrying State IVDrying State VDrying State VI
Water Loss
0.000%0.000%1.358%3.600%5.552%7.188%8.830%
0.025%0.000%1.677%3.590%5.230%7.130%8.813%
0.050%0.000%1.737%3.803%5.477%7.477%9.223%
0.075%0.000%1.923%4.090%5.870%7.963%9.867%
0.100%0.000%2.016%4.152%5.936%7.868%9.912%
Disclaimer/Publisher’s Note: The statements, opinions and data contained in all publications are solely those of the individual author(s) and contributor(s) and not of MDPI and/or the editor(s). MDPI and/or the editor(s) disclaim responsibility for any injury to people or property resulting from any ideas, methods, instructions or products referred to in the content.

