1. Introduction
One of the most fascinating and actively studied subfields in nanotechnology and composites is polymer composites, which have shown promise as high-performance, multipurpose materials. The mechanical or other physical features of the filler can be integrated with the properties of the polymer matrix, such as flexibility and low density, by incorporating it into the polymer matrix [
1]. Conductive polymer composites (CPCs) are one of the most significant and fascinating topics in polymer composite research, which has been ongoing for several decades, because of its versatility, simplicity of production, and adjustable features [
2].
In order to create CPCs, conductive fillers are added to different polymers, as the majority of polymers are not conductive. When a certain filler level is achieved in the polymer matrix, a spike in conductivity can be seen with increasing conductive filler content. It is common to refer to this phenomenon as the electrical percolation threshold (Pc) [
3]. More work focuses on employing conductive fillers, such as graphene, carbon black (CB), carbon fibers (CFs), graphite flakes (GFls), carbon nanotubes (CNTs), and carbon black (CB), to create conductive networks inside a polymer matrix [
4].
Recent progress in electronic devices, personal computers, electromagnetic interference shielding, aircraft accessories, light-emitting diode chips, sensing materials, auto parts, household appliances, mine pipes, medical devices, smart biomaterial for tissue engineering, etc., requires antistatic, electric, and thermal conductive light-weight materials. Correspondingly, CPCs are one of the most significant functional materials in decades [
5,
6].
High-performance and inexpensive conductive polymer composites are made possible by the effective creation of conductive filler networks in polymer matrices, while other elements like polymer assembly and crystallization must also be considered. The formation effectiveness of conductive networks has been found to be significantly impacted by the distribution of conductive particles, usually carbon fillers like CB and CNTs, in polymer matrices [
7]. The superior properties of various nanomaterials can be translated from the nanoscale to the macroscale by polymeric materials acting as matrices or substrates. This has the potential to take nanomaterials from the research lab into real-world technological applications that could completely transform the plastics industry as a whole [
8].
The production of high-performance and highly functional composite materials for cutting-edge applications is promised by the reinforcement of normally softer and inactive polymers or resins with nanoparticles with unusual mechanical and functional characteristics [
9,
10].
Significant progress in the field of polymer nanocomposites might be facilitated by the recent invention of certain 2D materials, such as large area 2D sheets and 2D heterostructures, and by emerging trends in 2D nanotechnology. Using 2D sheets as fillers makes it possible to precisely position nanomaterials into or onto polymer matrices/substrates while maintaining precise control over the surface/interface layer, the distances between the nano inclusions, and precise structural control at the atomic level—all of which are impractical with conventional polymer nanocomposite materials. Two-dimensional nanofillers are one type of reinforcement used in polymer nanocomposites that have garnered a lot of attention lately because of their exceptional all-around qualities for structural and multifunctional reinforcement [
11].
Functional additives, such as activated carbon (AC) [
12], CB [
13], carbon nanodots (CNDs) [
14], CNTs [
15], graphene (GR), and graphite nanoparticles (GNs) [
16], all of which increased the electrode materials’ electrochemical activity, are clearly able to improve the performance of the electrode materials. For instance, Glebova et al. showed that thermally expanded graphite (EG) can enhance the Nafion membrane thermal stability for fuel cell applications [
17].
Carbon nanomaterials (0D: carbon dots, fullerenes, and nanodiamonds; 1D: carbon nanohorns, graphene nanoribbons, and single and multi-walled CNT; 2D: GR, graphene oxide (GO); 3D: graphite (Gr), thermally expanded graphite (EG), and so on [
18,
19]) have been used as a promising option because they offer several advantages, including high chemical stability, a large surface-active area, good flexibility, thermal conductivity, high electrical conductivity, long-term stability, and environmental friendliness with definite geometry.
Polymer composites with nanoparticles added have improved mechanical characteristics [
20], as well as thermal and electrical conductivity [
21], as compared to traditional fibers. As a result, these materials have a wide range of practical applications, including automotive [
22], aerospace [
23], electronics [
24], medical devices [
25], safety, protective clothing [
26], and constructions and buildings. Researchers are interested in two-dimensional (2D) layered materials because of their special optical, mechanical, thermal, and electrical characteristics [
27]. Until now, the 2D carbon compounds that are already on the market, such graphene and graphdiyne, have only been able to interweave units of single carbon atoms into periodic networks. In paper [
28], the idea of employing big molecules or clusters as separate structural components for creating novel 2D carbon materials was reported. These materials consist of a few atoms or monomer units; they are thin sheets with a weak interlayer and covalent in-plane bonding, as well as layer-substrate interactions, which give them distinct physical and chemical characteristics. This includes hexagonal boron nitride (h-BN) with graphene [
29].
By guaranteeing sufficient electrical and thermal conductivity, superior bipolar plate processability, and low weight, polymer composites can take the role of metals as fuel cell components. Gr, CB, CNTs, graphene nanosheets (nGrs), and carbon fiber (CF) are examples of conductive fillers that can enhance the electrical properties of CPCs [
30].
Many advancements have been made in polymer-graphene nanocomposites, which are composed of graphene scattered inside a polymer matrix [
31]. Numerous methods, including melt-blending, electrospinning, and chemical vapor deposition, may be used to create these graphene-containing materials. The results can include sheets, membranes, and nanofibers in a range of sizes and forms. Nonetheless, the kind of polymers used in polymer nanocomposites as well as the unequal dispersion of graphene provide constraints that may reduce the final material’s performance characteristics.
Among thermoplastics, high-performance polymers like polysulfone (PSU) stand out for their remarkable mechanical qualities and thermal stability. PSU’s exceptional qualities—such as its strength, toughness, thermal, mechanical, and chemical properties—as well as its capacity to create polymeric membranes with a variety of uses, make it a popular material in contemporary technology [
32].
In our previous research [
33], we studied PSU-based composite materials using the solution method to create the composite and fill it with natural (NG), artificial (AG), and expanded (EG) graphites. Studying the thermal conductivity, we found that composites containing 70 wt. % NG had the highest conductivity, which was around 4.26 W/m·K. Later, in article [
34], we made substantial enhancement in the technique for making composite materials, sticking to the process of mixing a filler with a polymer in solution to make composites. It allowed us to increase the thermal conductivity of NG-filled composites by up to 7.35 W/m·K. It was found that NG gives the superior conductive behavior of composites.
The idea of the present paper is to add nanosized carbon black particles in polysulfone matrix to increase their own conductive properties to create, in combination with 2D graphite structures, an effective conductive net. Additionally, such combination of nano and 2D fillers is awaiting to provide high mechanical behavior in the obtaining composite materials.
3. Results and Discussion
3.1. Structure of Filler Powders
Morphology, Microstructure, and Particle Size Distribution
Natural graphite particles have a layered structure with carbon atoms organized in a honeycomb lattice and a plane spacing of 0.35 nm. SEM examination reveals a range of graphite flake sizes. Graphite particles are generally prismatic platelets, with well-defined basal planes and edge diameters. The graphite sheets appear to be big sheets with smooth and resilient surfaces and particle sizes of up to 180 μm. Natural graphite has flat particles with an average size of about 200 × 500 μm and a thickness of about 15–20 μm, and, as can be seen in
Figure 2a,b, natural graphite particles consist of highly oriented thin 2D graphene-like sheets packed in packs. This structure facilitates their intercalation when producing particles of thermally expanded graphite, which thus proceeds in two stages: splitting the packs into individual plates and splitting the plates into few-layer graphene. Due to the lamellar shape of the particles, the bulk density of natural graphite is not high, and it was 0.464 g/cm
3 and the tapping density was 0.584 g/cm
3.
A fine structure is observed in the artificial graphite particles, formed at the stage of obtaining the “green billet” due to the flow of coal tar pitch filled with coke particles during the pressing process. The AG particles seemed to be a random aggregation of microscopic particles in a spherical shape,
Figure 2c,d. Magnitudes of bulk and tapping densities were 0.797 and 0.952 g/cm
3, respectively.
We employed carbon fillers of various sizes to produce very efficient conductive structures. Carbon black particles are aggregates bonded by low molecular weight polymer and van der Waltz forces, with typical sizes ranging from 1 to 15 μm.
Figure 2e,f shows such a structure provides excellent dispersion of CB into individual particles in diverse solvents, polymers, and rubbers, including those with sizes less than 0.1 μm. Bulk and tapping densities were 0.352 and 0.390 g/cm
3.
3.2. Dispersion of Filler Particles in the PSU Matrix
Uniform particle distribution and strong adhesion between graphite filler particles and a polymer matrix are critical for composite quality, especially at temperatures above the polymer’s glass transition temperature (Tg). Powder particle shape and size are critical in defining the powder to the binder ratio and the degree of particle alignment, which impact thermal, electrical, and mechanical characteristics. Under ideal compression circumstances, the plate-like particles would result in increased packing density.
The SEM images (
Figure 3a,b) of unfilled PSU with different resolutions indicate that unfilled polysulfone solution has a dense embedded nonporous structure consisting of a dense top surface layer, which provides the mechanical strength.
Looking at the SEM micrographs, we can observe how well the filler particles are distributed through the matrix. The NG plates embedded in the polymeric matrix provide good heat transfer compared to AG. NG flakes are introduced in the matrix perpendicular to the direction of the pressure applying at consolidation. The NG particles are overlapping with one another (
Figure 3c,e), resulting in significant contact areas between the particles, which increases heat and electrical transmission in this direction. As the NG content of the material increases, the overlap density increases and the thickness of the polysulfone interlayers decreases. In the case of AG fillers (
Figure 3d,f), the filler particle has a spherical shape and a smaller size as compared to NG, making it simpler to produce a denser composite but with more pores that enhance the mechanical properties of the composite. The filler and polymer mixed to produce a massive agglomeration, which reduces as the filler quantity increases.
Figure 4a,b depicts the morphology of the composite materials at various CB concentrations. The CB aggregates are mixed together to create spherical or linear agglomerates in these photos. The carbon black articles are dispersed in the polymeric matrix well, resulting in a classic island-sea shape. The number of overlaps of polymer interlayers between graphite particles reduces as the filler content of EG increases as shown in
Figure 5b–d, which should lead to a decline in the material’s mechanical properties. Additional grinding of EG particles enhanced uniformity of their distribution inside the polymer matrix, reduced the number of aggregates and brought the structure of the material closer to that of NG-containing composites.
The hybrid mixture of carbon black and graphite can affect polymer structure, viscosity, and graphite flake orientation inside the polymer matrix. Carbon black is known to have a high aspect ratio, which implies it creates a network-like structure inside the polymer, increasing stiffness and mechanical strength. Graphite flakes, on the other hand, can generate a more layered structure due to their plate-like morphology, increasing the composite’s conductivity. SEM images of such hybrid mixture filled composites are given in
Figure 5.
3.3. Composites Density and Porosity
We tested the density of the composite using hydrostatic techniques to investigate the effect of increasing filler content on the density and thermal conductivity of the composite.
As previously stated, we measured the density of the samples acquired here. We can observe how the density grew as the filler material increased.
We may conclude that the composite preparation conditions, particularly the applied pressure in sample preparation technology, had a significant impact on the density of the composite, allowing for better thermal conductivity values and higher electrical conductivity in the composites. When graphite particles are put into the matrix, they create agglomerates that are randomly dispersed throughout the matrix, influencing the reported characteristics.
Figure 6 depicts the change in heat conductivity of the composite as its density changes.
By combining carbon black and natural graphite as fillers, both elements contribute to the composite’s decreased heat conductivity. These fillers disturb the thermal routes inside the matrix, lowering the overall rate of heat transmission. The magnitude of the drop, however, is determined by parameters such as filler content, dispersion, and matrix properties. In the case of using carbon black with artificial graphite as fillers, we can see the enhancement in thermal conductivity compared to using just AG as filler, which can be shown in
Figure 7.
Two different series of samples of the same fillers content was used in the measurements; thus, two experimental points were given for every composite.
The porosity of the composite including AG and NG as fillers increased as the filler content increased as shown in
Figure 8. Such increase is associated with the formation of filler agglomerates in the polymer matrix, which grow as the filler concentration increases. An uneven distribution of carbon black and graphite fillers might result in increased porosity in some places. Proper filler dispersion and homogeneous distribution can assist to improve porosity throughout the composite. We may also assume that reducing the compaction pressure during compression allows for the formation of voids or pores, increasing the total porosity of the composite.
The results of composite porosity using CB as a filler are significantly lower than the results of using different types of graphite as fillers. Carbon black dispersion inside the matrix is critical to preventing agglomeration and ensuring uniform distribution. The use of effective mixing procedures and proper processing settings can aid in achieving optimal dispersion and minimizing vacuum formation.
The viscosity of the matrix material can be adjusted to limit the possibility of porosity development. The use of CB as a filler boosts the composite’s viscosity and provides improved flow and wetting of the carbon black particles, allowing for compact packing and decreased porosity.
3.4. Thermal Conductivity
Because of the high thermal properties of NG due to its layered structure, increasing the content of NG in the composite can improve thermal conductivity. Furthermore, well-dispersed graphite particles ensures good thermal contact and effective heat conduction, implying that increased loadings of graphite particles might improve heat transmission inside the material. In addition to the excellent crystalline structure, high aspect ratio, and large crystallite size of NG, the composite filled with NG as a filler has the best thermal conductivity, where the NG particles lay on each other and form big contact areas, which leads to reaching a higher conductivity. And as the filler content is higher than 50 wt. %, the composite density became higher, and the NG particles compacted with each other with fewer pores, which led to a bigger increase in thermal conductivity.
Thus, using AG as a filler, the thermal conductivity seems to increase rapidly as the filler content increases, causing the filler particles to be in close contact with one another.
Figure 9 shows that the maximum thermal conductivity of the PSU-based composite was found to be of 17.47 W/m·K and 3.45 W/m·K for composites filled with 70 wt. % of NG and AG, respectively.
In the case of using CB as a filler, which is made up of small particles of elemental carbon, there was no effect on the heat conductivity of the composite. We may explain this by the fact that carbon black particles establish contact points or junctions with one another, forming heat barriers. These contact sites obstruct direct heat transmission, lowering total thermal conductivity. As a result, despite the fact that carbon black possesses inherent heat conductivity, the contact resistance between particles restricts its real influence.
Because of the shape compatibility of the filler particles, the introduction of 4 wt. % CB with synthetic graphite improved the thermal conductivity of the composite, resulting in the construction of continuous thermal channels between the filler particles. The opposite effect was observed when CB was combined with NG, where CB separated the natural graphite sheet, resulting in a reduction in thermal conductivity of the composite, as is shown in
Figure 10.
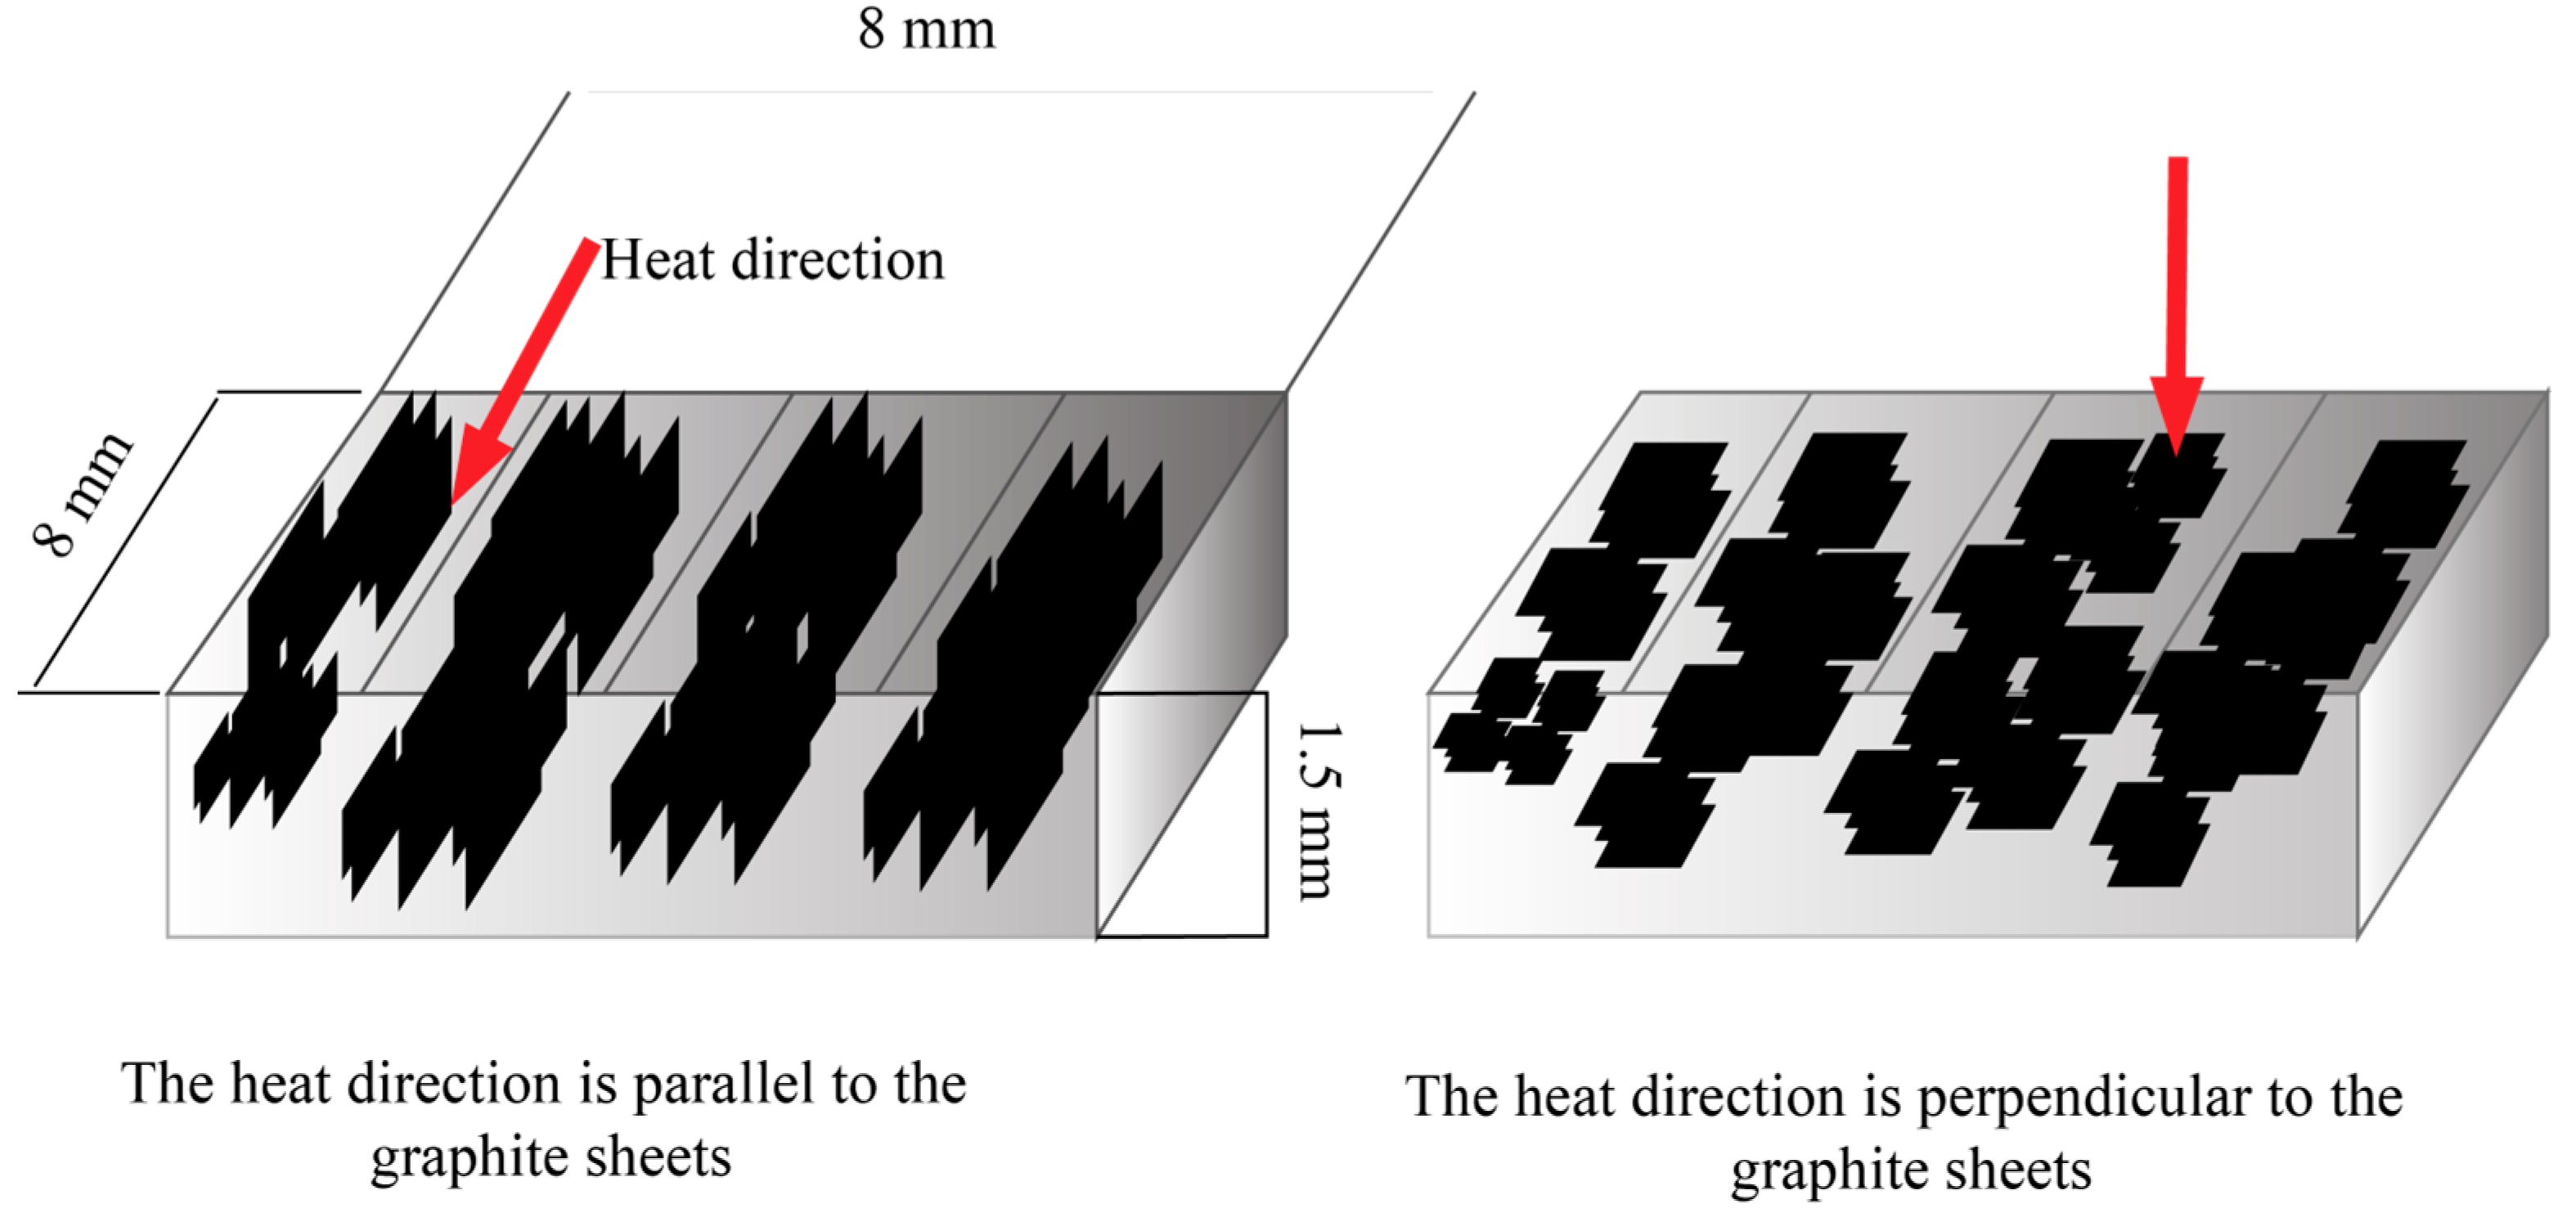
Because of the strong carbon–carbon bonding within the layers, graphite is a highly conductive substance along its basal plane. However, because of the weaker interlayer bonding, thermal conductivity perpendicular to the planes (through-plane conductivity) is often lower. When graphite is incorporated into a polymer matrix, the orientation and interfacial contact between the graphite particles and the surrounding polymer matrix can impact the composite’s thermal conductivity as is shown in
Figure 1.
Increasing the amount of graphite in the composite can improve heat conductivity. Increasing the volume percentage of graphite in the composite can take advantage of its high heat conductivity. However, graphite loading generally has an upper limit before declining results are detected. The particular thermal conductivity values of the polymer composite filled with natural graphite will be determined by the exact composition, manufacturing factors, and graphite material utilized, and they may be enhanced based on the fillers employed. CB was employed as a second filler with NG in this example. As previously stated, CB enhances the viscosity of the composite material, and as shown in the SEM micrographs, the orientation of the NG sheets was improved and the sheets in the composite were more regular. As we can see in
Figure 11, the forming efficient conductive paths using CB as a second filler with NG.
Figure 12 shows the thermal conductivity of the PSU-based composite filled with NG and NG + CB measured along the sample plane.
It should be noted that whereas in the previous paper [
34], we reported the thermal conductivity magnitude measured along the direction of the pressure application at the samples’ consolidation, in the present study we compared the thermal conductivity measured both along the direction of the pressure application at the samples’ consolidation and in the direction normal to the pressure application direction. As is illustrated in
Figure 11, flake-shape particles of NG are oriented along the sample plane, i.e., perpendicular to the pressure application direction. Comparing data presented in
Figure 10 and
Figure 12, one should note that the thermal conductivity of the composite containing 70 wt. % NG measured normally to the sample plane was found to be of about 17 W/m·K, whereas in the direction along sample plane the same composite exhibit thermal conductivity magnitude was about 27 W/m·K. Addition of CB enhance the difference in the conductive between various direction, composite containing 66 wt. % of NG and 4 wt. % of CB possess thermal conductivity in the direction perpendicular to sample plane of about 10 W/m·K, whereas thermal conductivity in the in-plane direction was found to be more than 37 W/m·K. Moreover, comparing the curve 5 in
Figure 12a with the curves 3 and 4 in
Figure 12b, it should be concluded that addition of CB to composite filled with NG increased the thermal conductivity in the in-plane direction significantly. It should be noted that such an increase was found only for highly filled composites; for composites with filler content of 30 wt. %, the addition of CB provided no positive effect, as can be seen by comparing the curve 1 in
Figure 12a with the curves 1 and 2 in
Figure 12b.
Table 2 and
Table 3 collect the experimental results of thermal conductivity measurements. It is seen that for all the NG-containing samples, thermal conductivity in the in-plane direction, i.e., along the NG flakes’ orientation, is higher than in the direction normal to the sample plane. It should be noted that composites filled with AG measurements do not show any difference between thermal conductivity in various directions. It is evidently because of the near-spherical shape of AG particles, so detailed measurements of in-plane thermal conductivity for this filler were not provided.
3.5. Mechanical Properties
ISO 291: 2008 and ASTM D790 [
41] standards were used to conduct three-point flexural testing. The test was carried out using universal testing equipment manufactured by Zwick Roell (Group, Ulm, Germany). Using a hot press, the samples were formed into rectangles (80 × 10
3 mm).
The flexural strength magnitude for unfilled PSU was found to be about 124 MPa, and the maximum achieved value for composite containing 30 wt. % of AG is 38.74 MPa, as shown in
Figure 13. It shows that at a enough low filler content, the particles dispersed throughout the polymeric matrix well, which allows mechanical stresses to be transferred between two composites components. Increasing the filling degree induces a rise in the elastic modulus, which results in a corresponding decrease in deformability for all materials. Variations in the strength of a substance’s qualities occur depending on the morphology of the filler.
Figure 13 shows that when NG is used as a filler, the flexural strength depends strongly on the filler quantity, and the flexural strength maximum was achieved at 30 wt. % of the filler. Increasing the filler content is accompanied by decreasing the magnitude of flexural strength. Such a decrease may be associated with the fact that graphite sheets are piled on top of each other and overlapped to form a composite. The amount of interlayered polymer between the graphite particles reduces as the filler concentration increases, which results in lower adhesion capabilities and a reduction in the composite mechanical properties. Furthermore, in addition to the graphite sheets’ structural pores, pores between the composite and the matrix appear at a high filling degree.
As a consequence, we may conclude that increasing the filler amount decreases flexural strength because the graphite filler causes the polysulfone composite to become more brittle.
Figure 14 shows the flexural test curves of PSU-based composites filled with CB, to study the effect of CB on the composite properties. Increasing the carbon black loading in the composite will typically reduce flexural strength. Carbon black particles have been shown in studies to disrupt the polymer matrix and function as stress concentrators, resulting in poorer interfacial bonding and lower mechanical characteristics. The lower filler concentration of CB indicates that the filler is effectively spread throughout the polymeric matrix, allowing mechanical loads to be transferred between the two components even with low filler amounts. Increased filling causes an increase in the elastic modulus, resulting in a decrease in deformability for all materials.
To study the effect of adding CB as a second filler with graphite in composite material based on PSU, three-point flexural testing was applied as we can see in
Figure 15. Incorporating CB with graphite in a composite may reduce the material’s flexural strength. CB is a typical component used to increase the electrical conductivity of composites, but graphite is frequently added due to its outstanding mechanical qualities, such as high strength and rigidity. When CB is introduced to the composite, it spreads evenly throughout the matrix, producing conductive channels. The addition of CB, on the other hand, might disturb the structure and bonding between graphite particles, resulting in decreased interfacial strength. This can have a detrimental influence on the composite’s flexural strength.
Furthermore, the presence of CB has the potential to induce agglomeration, resulting in high concentration locations. These agglomerated patches can operate as stress concentrators, weakening the overall composite and leading to flexural strength loss. As one can see from
Figure 15, the flexural strength of the composite filled with CB + NG did not change that much compared to the flexural strength of the composite filled with just NG. but adding CB to a PSU-based composite filled with AG led to an increase in the flexural strength of the composite using 2 wt. % of CB; however, as we used 4 wt. % of CB, the flexural strength decreased as well as for the composite filled with 70 wt. % AG.
To clarify the effect of additives on mechanical properties, tables were created showing the highest values of flexural strength depending on the filler content. The mechanical properties of the studied composites are given in
Table 4. As can be seen, the flexural strength of unfilled PSU is about 124 MPa and by using graphite materials as fillers the flexural strength dropped to 51 MPa max.
As we saw, adding graphite to a polymer can increase electrical and thermal conductivity. However, it can also make the composite more brittle or fragile due to the rigid nature of graphite particles. The flexural strength of graphite is about 34 MPa. The highly filled polymeric composite material was expected to be more brittle than the unfilled polymer, but as the results show we can assume that the flexural strength of the highly filled composite is not bad compared to the graphite properties, such as high brittleness.
3.6. Electrical Conductivity
The mechanical properties and electrical conductivity of composite materials are generally influenced by the conductive filler’s dispersion, shape, and orientation in an insulating polymer base matrix. Because the size of filler particles usually is several micrometers, a relatively high content of filler is usually required to achieve the threshold percolation value. A high filler concentration might result in poor mechanical characteristics and the use of unnecessary materials.
Table 2 shows the PSU composite filled with NG and AG electrical conductivity depending on filler content. Electrical conductivity rises continuously at any degree of loading concentration. For 30 and 70% wt. %, NG’s electrical conductivity spans from 0.0305 S/cm to 52.9 S/cm, whereas filling up to 70 wt. % with AG allows to reach only the magnitudes of 3.8 S/cm. Such a difference is associated with the formation of conducting networks and the well-distributed NG sheets inside the polymer. As a result, it is evident that conductivity is affected by factors such as the filler content of the composite and how much of it is absorbed into the matrix. The huge graphite flakes in case of the NG filler made up the composite showed the lowest resistance at all concentration in comparison with the small flake filler of AG. Because the grain and crystallite sizes impact the electrical conductivity of carbon composites, large flake filler composites display superior conductivity, as predicted.
Carbon black is known for its high electrical conductivity, which makes it a desirable filler material for improving the thermal and electrical properties of composites. When incorporated into a polysulfone-based composite, CB particles can enhance the composite’s thermal and electrical conductivity by creating pathways for heat and electrical transfer. From the result we can see that the higher concentrations of CB will often enhance the electrical conductivity of the composite. This is because the greater abundance of CB particles allows for more effective material conduction. However, it is crucial to remember that there may be a threshold of diminishing returns where more CB additions will no longer significantly improve thermal conductivity. The result of the thermal and electrical conductivity of the composite filled with CB are shown in
Table 5.
To see the effect of using hybrid fillers in composite materials on the electrical conductivity, we measured the electrical conductivity of the composite filled with CB + NG and CB + AG with different filler contents, and the result are shown in
Table 3.
In the case of using CB + NG as fillers, we can see that the electrical conductivity of the composite increased 2 times while using 30 wt. % CB + NG) as fillers. In the case of using 70 wt. % (CB + NG) we can see the enhancement was not that great, due to the decrease in the content of NG in the matrix and the effect of CB, which was well dispersed in the matrix. In the case of using CB + AG as fillers, we did not see an enhancement in electrical conductivity due to the decrease in AG content in the composite.
4. Summary and Conclusions
Bipolar cells are a crucial component of polymer electrolyte membrane fuel cell stacks. A wide range of conductive materials for bipolar plate manufacture metal, graphite, and composite have been produced. Polymer composites filled with carbon particles are thought to be the most promising composite bipolar plate contender. Carbon/polymer composites outperform pure metal and graphite in terms of cost, weight, corrosion resistance, and machinability.
Our research aims to generate high filled composites with high density and low porosity in order to attain high conductivity characteristics in composites. Several forms of graphite were employed as fillers, including AG, NG, and CB, to study the effect of filler type, size of the particles, and aspect ratio on the conductive properties and mechanical behavior of composites. In comparison to AG and CB, utilizing NG as a filler resulted in a denser and lower porosity composite. To create a better conductive structure, we suggested using CB particles as a second filler with NG and AG. Depending on the properties of the composite filled with CB, we found that using 2 and 4 wt. % of CB with NG as second filler will enhance the composite material conductivity. So, as a result we could achieve the goal we wanted and we enhanced the thermal and electrical conductivity of the composite by producing a more perfect structure, to decrease material porosity and to increase material density. Adding graphite type fillers to the polymer did not improve the mechanical properties of the composite as well as using CB as filler; however, we noticed that the flexural strength of the composite decreased compared to unfilled polysulfone. This can be explained by the difference in properties between the filler and the polymer, as we know that the graphite material was considered as a fragility material, which led to a decrease in the flexural strength of the composite.


