Article

Breast Cancer Diagnosis Using YOLO-Based Multiscale Parallel CNN and Flattened Threshold Swish

by
Ahmed Dhahi Mohammed
* and
Dursun Ekmekci
*
Department of Computer Science, Faculty of Computers & Information, Karabük University, Karabük 78050, Turkey
*
Authors to whom correspondence should be addressed.
Appl. Sci. 2024, 14(7), 2680; https://doi.org/10.3390/app14072680
Submission received: 13 January 2024 / Revised: 10 March 2024 / Accepted: 16 March 2024 / Published: 22 March 2024
(This article belongs to the Special Issue Advance in Deep Learning-Based Medical Image Analysis)

Abstract

:
In the field of biomedical imaging, the use of Convolutional Neural Networks (CNNs) has achieved impressive success. Additionally, the detection and pathological classification of breast masses creates significant challenges. Traditional mammogram screening, conducted by healthcare professionals, is often exhausting, costly, and prone to errors. To address these issues, this research proposes an end-to-end Computer-Aided Diagnosis (CAD) system utilizing the ‘You Only Look Once’ (YOLO) architecture. The proposed framework begins by enhancing digital mammograms using the Contrast Limited Adaptive Histogram Equalization (CLAHE) technique. Then, features are extracted using the proposed CNN, leveraging multiscale parallel feature extraction capabilities while incorporating DenseNet and InceptionNet architectures. To combat the ‘dead neuron’ problem, the CNN architecture utilizes the ‘Flatten Threshold Swish’ (FTS) activation function. Additionally, the YOLO loss function has been enhanced to effectively handle lesion scale variation in mammograms. The proposed framework was thoroughly tested on two publicly available benchmarks: INbreast and CBIS-DDSM. It achieved an accuracy of 98.72% for breast cancer classification on the INbreast dataset and a mean Average Precision (mAP) of 91.15% for breast cancer detection on the CBIS-DDSM. The proposed CNN architecture utilized only 11.33 million parameters for training. These results highlight the proposed framework’s ability to revolutionize vision-based breast cancer diagnosis.

1. Introduction

The advent of domain-specific architectures like Tensor Processing Units (TPUs) and Graphical Processing Units (GPUs) has revolutionized the capabilities of Convolutional Neural Networks (CNNs) in the field of Computer Vision [1]. Notably, in biomedical imaging [2,3,4], the integration of CNNs is transforming diagnostic approaches, particularly in the early-stage detection of diseases. Breast Cancer (BC), characterized by the abnormal growth of malignant cells within breast tissues, can spread to other parts of the body if left untreated [5]. BC is the second-leading cause of tumor-related deaths among females. The early diagnosis of malignant cells is crucial, as it significantly increases the life expectancy of the patient [6]. Recent advancements in medical technologies have introduced various diagnostic tools, including Magnetic Resonance Imaging (MRI) [7], Computed Tomography (CT) scans [8], photoacoustic imaging [9], and microwave imaging [10]. Among these, mammography has emerged as a particularly effective method for Breast Cancer Diagnosis (BCD). Mammography is a non-invasive and less painful screening technique compared to other methods [11,12,13]. In mammograms, two primary indicators of cancer are identified: masses and calcifications. Generally, masses or tumors exhibit sharp and irregular edges. Calcifications, which may appear as coarse, granular, popcorn-like, or ring-shaped formations with a higher density and scattered distribution, can sometimes signal early tumor development.
In recent years, numerous mammogram-based breast cancer diagnosis systems have been proposed [12,14,15,16,17,18,19]. However, there are still challenges that need addressing to enhance the performance of BC detection systems. These challenges include variations in the illumination, lesion scale, lesion class, and dynamic breast sizes in mammograms. During the early stages of the disease, lesions appear smaller in mammogram images. As the disease progresses, the lesions occupy a larger area, leading to variations in lesion size at different stages, even if the lesion type remains the same. The ‘You Only Look Once’ (YOLO) detection technique, a single-stage detection method, has been widely used for BCD in recent years [5,11,19,20,21,22]. However, its loss function is not scale-invariant and is biased towards smaller lesions [23]. Additionally, traditional activation functions (ReLU, Leaky ReLU, etc.) used in their backbone architectures often lead to dead neurons and gradient vanishing issues. Addressing these challenges is crucial to enhancing the diagnostic process’s efficiency and providing more accurate, efficient, and reliable diagnoses. This could potentially lead to earlier detection and improved treatment outcomes for breast cancer patients.

1.1. Current State-of-the-Art in BCD

In recent years, a myriad of expert systems have been developed for the diagnosis of breast cancer using mammograms, primarily falling into two categories: (i) conventional image processing techniques and (ii) deep learning-based diagnosis [24]. Traditional image processing approaches in breast cancer detection involve steps like image enhancement, handcrafted feature extraction, and feature classification. Previously, widely recognized feature extraction methods such as Local Binary Patterns (LBP) [25], Gray Level Cooccurrences Matrix (GLCM) [25,26], Histogram of Oriented Gradients (HOG) [26], and Scale Invariant Feature Transform (SIFT) [25,27] have been utilized. Simultaneously, machine-learning classifiers like Support Vector Machine (SVM) [25], Naive Bayes (NB) [28], and Random Forest (RF) [25,28] have been employed to distinguish between malignant and benign tumors in mammographic images. The effectiveness of these traditional diagnostic systems heavily relies on the precision of the hand-crafted feature extraction techniques and the efficiency of the classification algorithms [24]. Specifically, crafting optimal and robust features for tumor identification presents significant challenges due to inherent limitations such as interclass variations and deformations within mammographic images. However, with the introduction of domain-specific hardware architectures, such as GPUs and TPUs, and the consequent advancements in computational power, deep learning-based classifiers have surged in popularity for breast cancer detection [29]. These modern approaches leverage the ability of deep learning models to automatically learn feature representations from mammograms, bypassing the need for manual feature extraction. This shift towards deep learning has revolutionized the Computer-Aided Diagnosis (CAD) system for breast cancer detection, enabling the development of models that are not only more accurate but also capable of handling the complex variations found in breast tissues and tumor appearances [30]. In the domain of BCD, the literature describes deep learning-based techniques for the analysis of mammogram images.
Baccouche et al. [5] have made a significant contribution with their YOLO-based fusion model, designed for the classification and detection of breast cancer using mammogram images. Their methodology involved augmenting the training dataset and employing a convolutional neural network (CNN), specifically the DarkNet model, in various configurations. The most efficient configuration, termed the fusion model, demonstrated promising results in breast cancer detection when evaluated using the CBIS-DDSM and INBreast datasets. However, this approach has limitations—notably, the YOLO model’s low suitability for mammogram images and the fact that the backbone CNN ignores multiscale features [31], which are vital for early-stage lesion detection and handling class variations.
Zhao et al. [11] proposed a CAD system for mammogram analysis based on YOLOv3, a deep-learning model. Their system encompasses three key stages: preprocessing, application of the YOLOv3 model, and evaluation. The model is distinct in its dual capability of locating masses and classifying various categories such as microcalcification, mass, benign, and malignant lesions. They developed three specialized training models using the CBIS-DDSM dataset: a general model using all images, a mass-specific model, and a microcalcification-focused model.
Xie et al. [19] proposed a multiscale method for early-stage BCD, utilizing DenseNet and MobileNet as baseline CNN architectures. Their novel approach replaced the last polling layer of the baseline CNN with a multiscale module and incorporated a Breast Region Segmentation (BRS) module for image preprocessing. Evaluating their model using the INBreast benchmark, they found DenseNet to outperform MobileNet. However, they noted that DenseNet’s complexity and the extensive use of dense connection blocks led to model overfitting, while MobileNet, being more lightweight, overlooked multilevel features.
In a related study, Zhang et al. [20] introduced an enhanced version of the YOLOv3 network, termed an anchor-free-YOLOv3, specifically for mass detection in mammograms. They addressed common issues in bounding box regression by incorporating Generalized Intersection over Union (GIoU) loss instead of the traditional Mean Squared Error (MSE). To further refine object detection, they utilized focal loss, which counters the negative impact of a large number of easy negatives. Their feature fusion technique, the summation method, was integrated into the model’s top-down pathway.
Meng et al. [21] focused on evaluating the You Only Look Once version 5 (YOLOv5) for detecting and classifying breast lesions in dynamic contrast-enhanced MRI (DCE-MRI). Four YOLOv5 sub-models were tested on a dataset comprising over 2000 images, each of benign and malignant lesions. The study measured the precision, recall rate, and mean average precision to assess model performance. Among the sub-models, YOLOv5s outperformed others, with the highest precision (0.916) and mean average precision (0.894 for lesion detection. The study suggests YOLOv5s’s potential for clinical applications in the rapid and accurate diagnosis of breast lesions on DCE-MRI, indicating its value in AI-assisted imaging diagnosis.
Complementing these studies, Su et al. [22] developed the YOLO-LOGO model, combining the strengths of YOLO and LOGO (local-global) networks for mass detection and segmentation in mammograms. The process begins with the YOLOV5 model identifying mass locations, followed by cropping these masses from the images. The LOGO training approach then separately trains global and local transformer branches on both full and cropped images. The final segmentation decision is derived from merging these two branches. This innovative approach was validated using both the CBIS-DDSM and INbreast datasets, demonstrating enhanced balance in model performance for both training and segmentation tasks.
Saber et al. [32] focused on a deep transfer learning-based model, assessing various pre-trained models for BC classification. Their comparative study using the MIAS benchmark demonstrated that the VGG-16 architecture, based on transfer learning, surpassed other models like Inception V3, ResNet50, and Inception-V2 ResNet in performance. However, they observed that the VGG-16 model did not account for multiscale features, which are crucial for comprehensive lesion detection and classification.
Ibrokhimov et al. [33] introduced a two-stage deep-learning framework utilizing Faster-RCNN. Their model first extracted the Region of Interest (RoI) and then classified breast masses into different categories. Tested against the INBreast benchmark, their framework showed superior performance compared to baseline architectures, indicating effectiveness in both lesion detection and classification.
Table 1 provides a critical analysis and brief description of various BCD frameworks, highlighting their methodologies and areas for improvement.

1.2. Research Gap Analysis

The existing literature reveals several research gaps. First, while advancements in YOLO-based models for mammogram analysis show good results, these models often overlook the variation in lesion sizes at different stages of progression. This oversight can lead to misclassification, as lesions of similar lengths might be categorized incorrectly depending on their stage of development. Another significant challenge lies in the complexity and depth of neural networks. Deeper networks do not necessarily translate to increased efficiency, primarily due to the vanishing gradient problem. This issue slows down the training process in deep networks, as the gradient signal may diminish or even drop to zero, particularly in the shallower layers. Occasionally, gradients can also explode, reaching excessively high levels, thereby destabilizing the training process. Furthermore, the current YOLO models have limitations in their loss function and activation functions. The loss function is not scale-invariant and exhibits bias [23], which can disturb the accuracy of lesion detection. Additionally, the use of traditional activation functions like ReLU, Sigmoid, and LeakyReLU in these models may result in dead neurons and exacerbate the gradient vanishing problem [34]. Addressing these gaps requires further research on developing models that can accurately classify lesions regardless of their size and stage, improving the robustness of CNN against gradient issues, and enhancing the model to be more scale-invariant. Such advancements would significantly improve the precision of BCD systems.

1.3. Contributions

This research presents a BCD framework, significantly enhancing mammogram image analysis through various key contributions. First, the framework utilizes CLAHE for image enhancement. Then, a parallel CNN architecture is designed to extract features at multiple levels. This approach successfully minimizes information loss at the initial stages of the network. Further, dense connection blocks are integrated to extract multilevel features, addressing the challenge of class variation in lesion types. Additionally, a multiscale block is introduced, adeptly managing the scale variation problem often encountered in lesion detection across different stages of progression. A state-of-the-art activation function is used within the network, which effectively overcomes the issue of dead neurons. Moreover, an improved loss function is specifically designed to reduce the impact of lesion scale variation. These contributions collectively position this BCD framework as a cutting-edge solution in the field, offering substantial improvements in the detection and classification of breast lesions.

1.4. Organization

This paper is systematically structured to provide a comprehensive insight into our study. Section 2 presents Material and Methods for diagnosing breast cancer from mammograms using CNN. This section explains the datasets, methodologies, and algorithms implemented in developing the framework. Following this, Section 3 is dedicated to presenting and analyzing the results obtained from the application of the proposed CNN-based approach. It offers a detailed examination of the performance metrics, comparative analyses, and a discussion on the effectiveness of the model. The final section, Section 4, concludes the paper by summarizing our key findings and contributions.

2. Material and Methods

This research proposed a BCD framework using a parallel multi-scale CNN architecture.

2.1. Datasets for Performance Evaluation

In assessing the effectiveness of the proposed framework, we utilized two benchmark datasets, each tailored to evaluate distinct aspects of the framework’s performance in classification and detection. The first dataset, INbreast [35], comprises 410 digital mammograms from 115 different cases. Each image in this dataset is assigned a category based on the ‘Breast Imaging-Reporting and Data System (BI-RADS)’ by an expert radiologist. The dataset categorizes images into three groups: benign, malignant, and normal. It includes 116 positive case samples (benign and malignant) and 294 negative (normal) mammograms. Post-data augmentation, the dataset expanded to 2870 images, offering a robust base for evaluating the classification capability of the framework. The second dataset, the ‘Curated Breast Imaging Subset of the Digital Database for Screening Mammography’ (CBIS-DDSM) [36], is a recognized benchmark in digital mammogram-based breast cancer screening, encompassing 6775 cases with 10,239 images. We customized the CBIS-DDSM for our purposes, manually annotating the dataset using LabelImg, which is an open-source image annotation tool. During annotation, the bounding box coordinates were created. The Pascal VOC format was used to save annotations as XML files. This customization helped construct and train the breast cancer detection framework. This dual-dataset approach ensures a detailed assessment of the proposed framework’s capabilities in BCD.

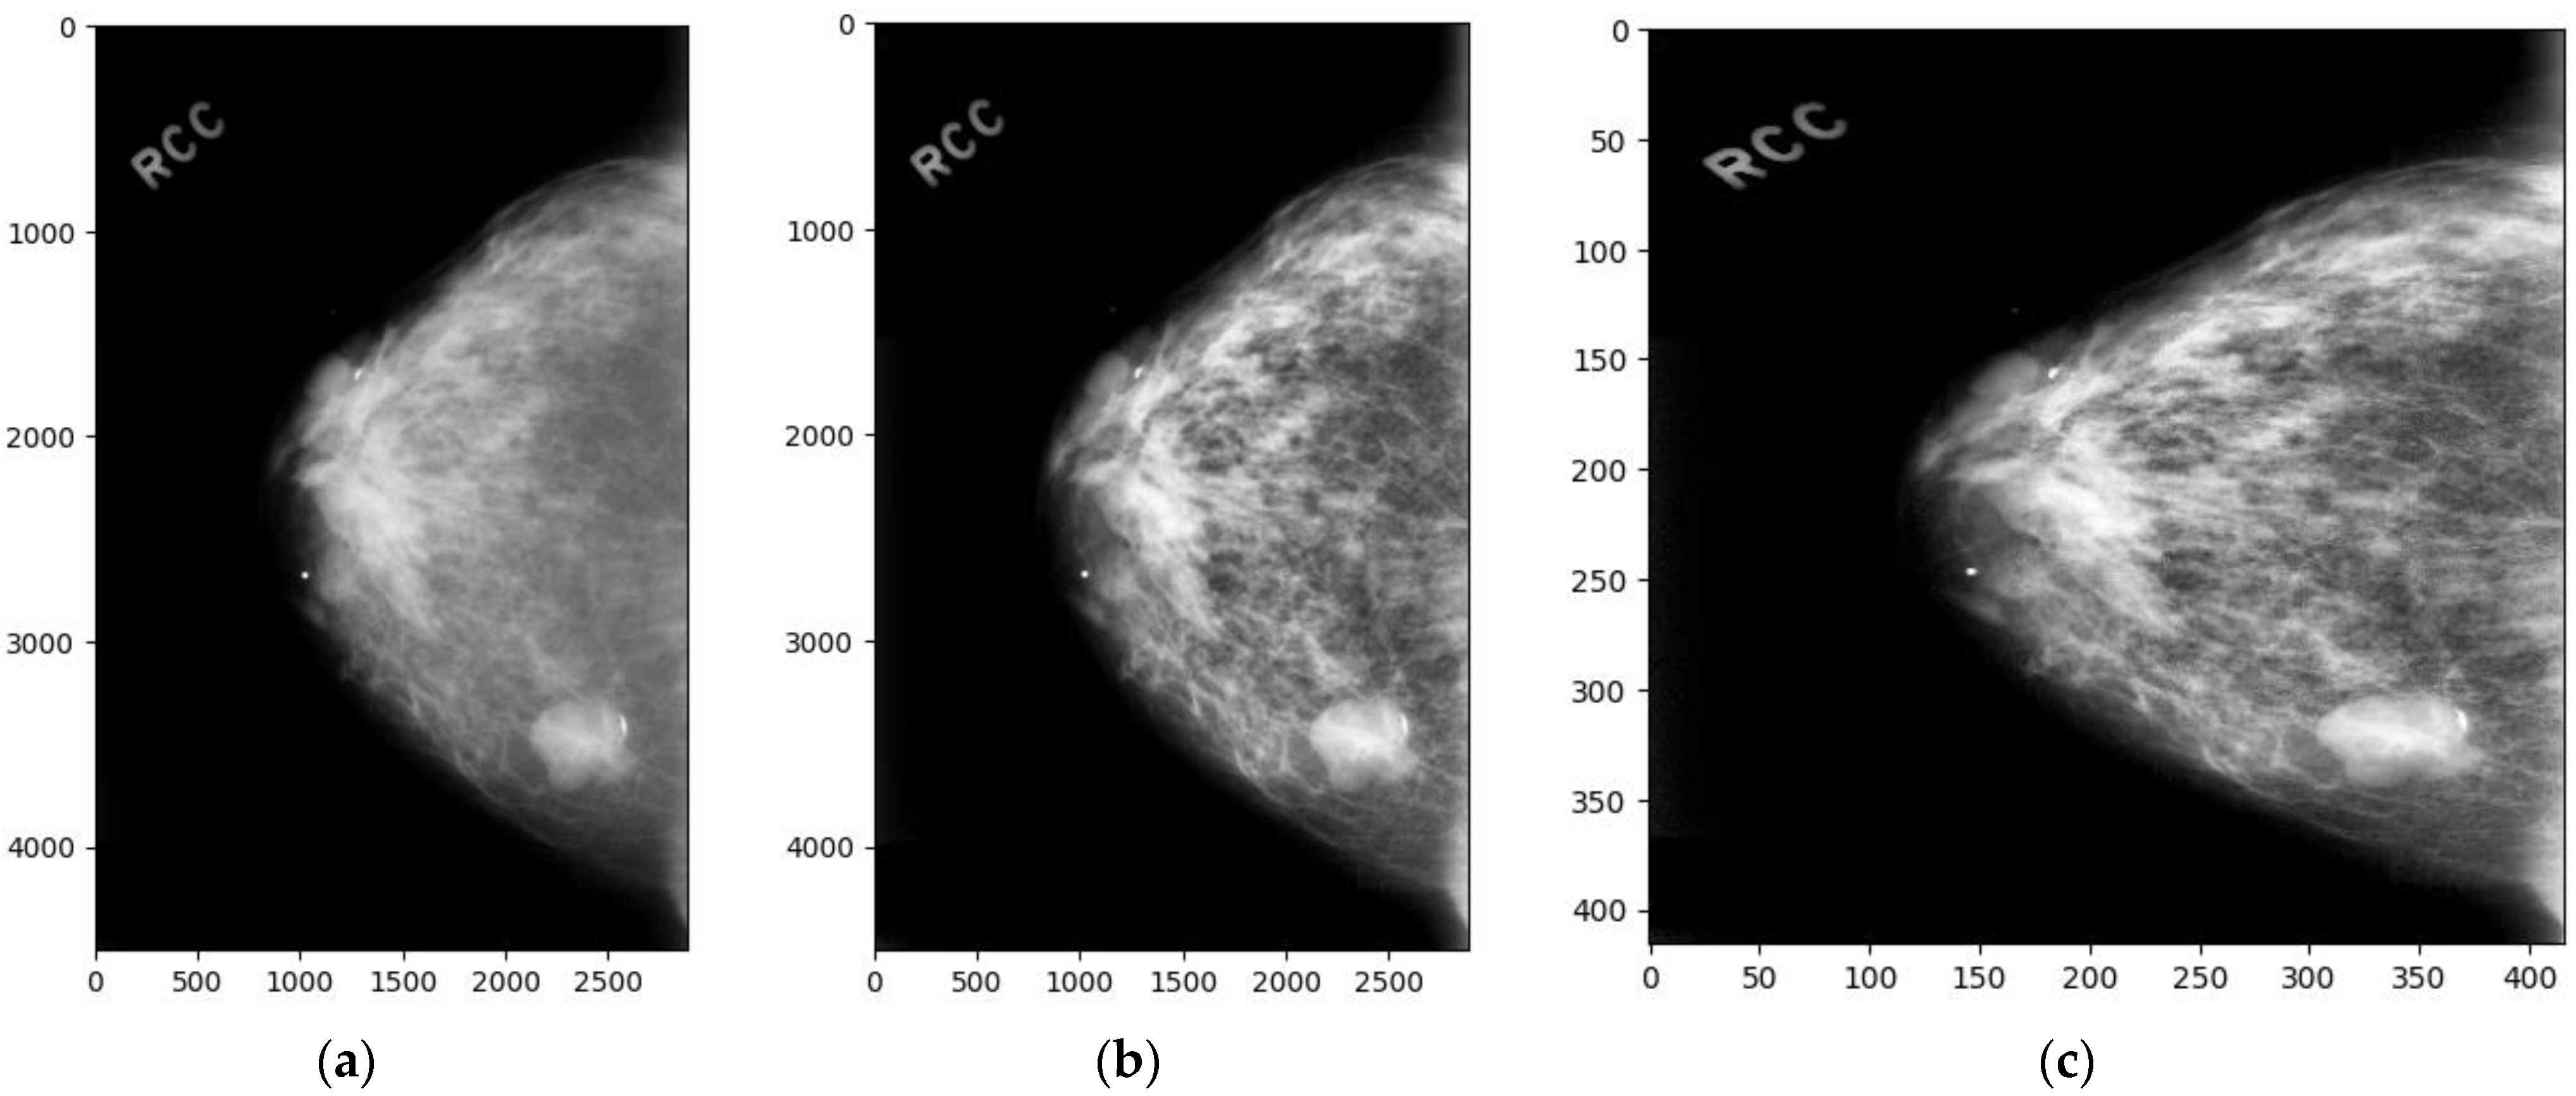
2.2. Image Preprocessing

In this study, we employed Contrast Limited Adaptive Histogram Equalization (CLAHE) to enhance the image quality of mammograms within the CBIS-DDSM and INbreast datasets. The optimization of CLAHE parameters was crucial to achieving a balance between enhancing the contrast of mammographic images and preventing the introduction of noise that could potentially obscure critical diagnostic details. After an extensive empirical evaluation aimed at maximizing the efficacy of lesion detection, we determined the optimal settings for CLAHE to be a clip limit of 2.0 and a tile grid size of 8 × 8. These parameters were chosen to ensure localized contrast enhancement that is essential for highlighting the subtle features of lesions, while the clip limit was set to mitigate the risk of over-enhancing the image, which could lead to noise amplification. This careful parameterization allows for a significant improvement in the visibility of pertinent features in mammograms, thereby facilitating the more accurate detection and analysis of breast cancer indicators. Following this enhancement, each image was resized to a uniform dimension of 416 × 416 pixels, as shown in Figure 1.
To mitigate the overfitting issue, we expanded the INbreast benchmark’s dataset using various geometric transformation-based augmentation methods. Flipping was employed, involving both horizontal and vertical axis transformations. We also applied image rotation at angles of 90°, 180°, and 270° to the original training samples. Lastly, we introduced noise injection, utilizing a matrix with a random Gaussian distribution. These methods effectively diversified the dataset, creating varied orientations of the same image and making it more robust in recognizing and classifying images with varying levels of noise and distortion. These augmentation methods collectively contribute to a more comprehensive training regime, reducing the risk of overfitting while improving the model’s performance.

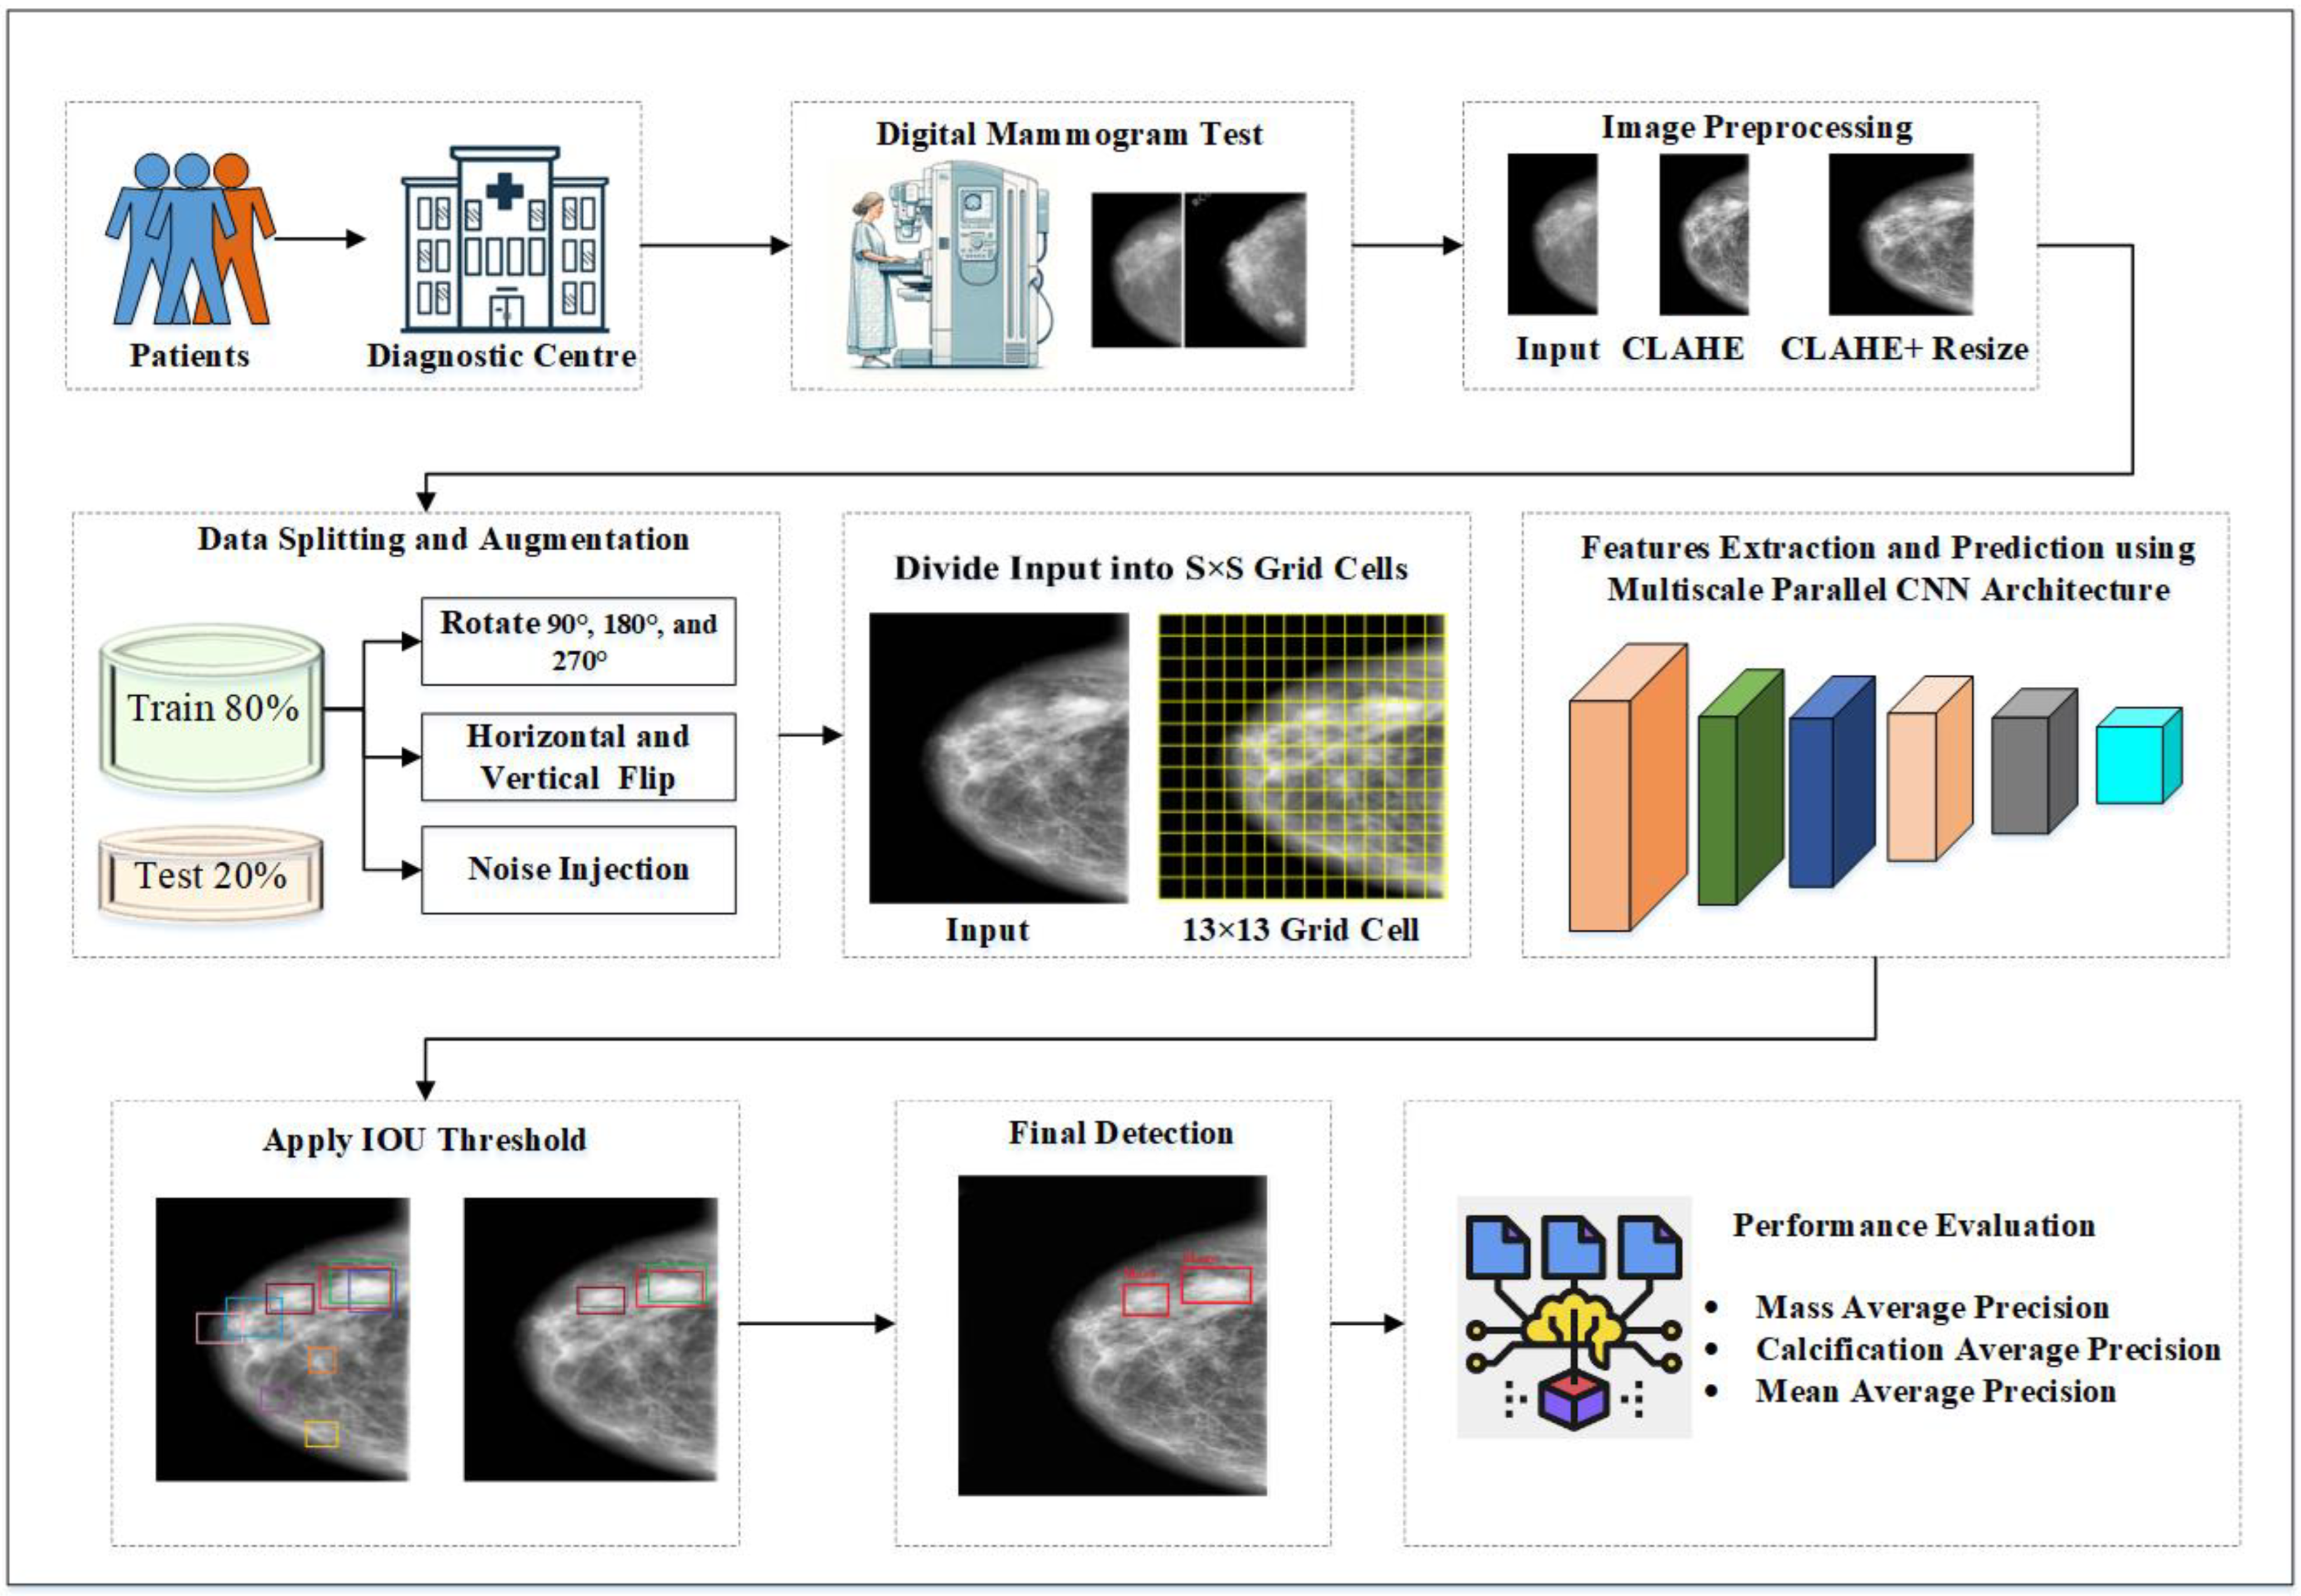
2.3. Breast Cancer Diagnosis Framework

The BCD framework localizes the suspected lesion regions in a mammogram image by generating Bounding Boxes (BBs) around the lesions and classifying them as mass or calcification. It processes the mammogram by dividing it into a grid S × S (i.e., 13 × 13). If the center coordinates (Cx, Cy) of a lesion’s BB fall into a Grid Cell (GC), that GC is accountable for identifying that lesion. Each GC (Si, Sj) calculates confidence scores for BBs overlapping it. The scores indicate the model’s certainty that the BB surrounds a lesion. If no lesion is present in a GC, the scores should be zero, and no BB is produced. Otherwise, the score equals the Intersection Over Union (IOU) between the Ground Truth BB ( GT BB   ) and Predicted BB ( P BB   ) , as expressed in Equation (1). Furthermore, each GC predicts four BBs in this case.
Conf BB i = P r ( Lesion )   IOU P BB GT BB
For each BB, the proposed CNN predicts five crucial information components: the Confidence Score, which indicates the likelihood of a lesion within the BB; the width and height of the BB, providing spatial dimensions; the two center coordinates (x, y), pinpointing the lesion’s location; and the conditional class probability P r   ( Class   i |   Lesion   ) , which estimates the probability of the lesion belonging to a specific class. This probability is conditioned on the presence of a lesion within the respective grid cell of the mammogram. Notably, the model is designed to predict only one set of class probabilities per GC, regardless of the number of BBs detected within that cell, ensuring focused and specific lesion characterization.
Figure 2 presents the block diagram of the proposed framework, illustrating the comprehensive workflow of the CAD system for breast cancer detection. It encapsulates the end-to-end process, from image preprocessing to the final diagnostic output, showcasing the integration of advanced techniques and architectures to achieve superior performance in BCD.

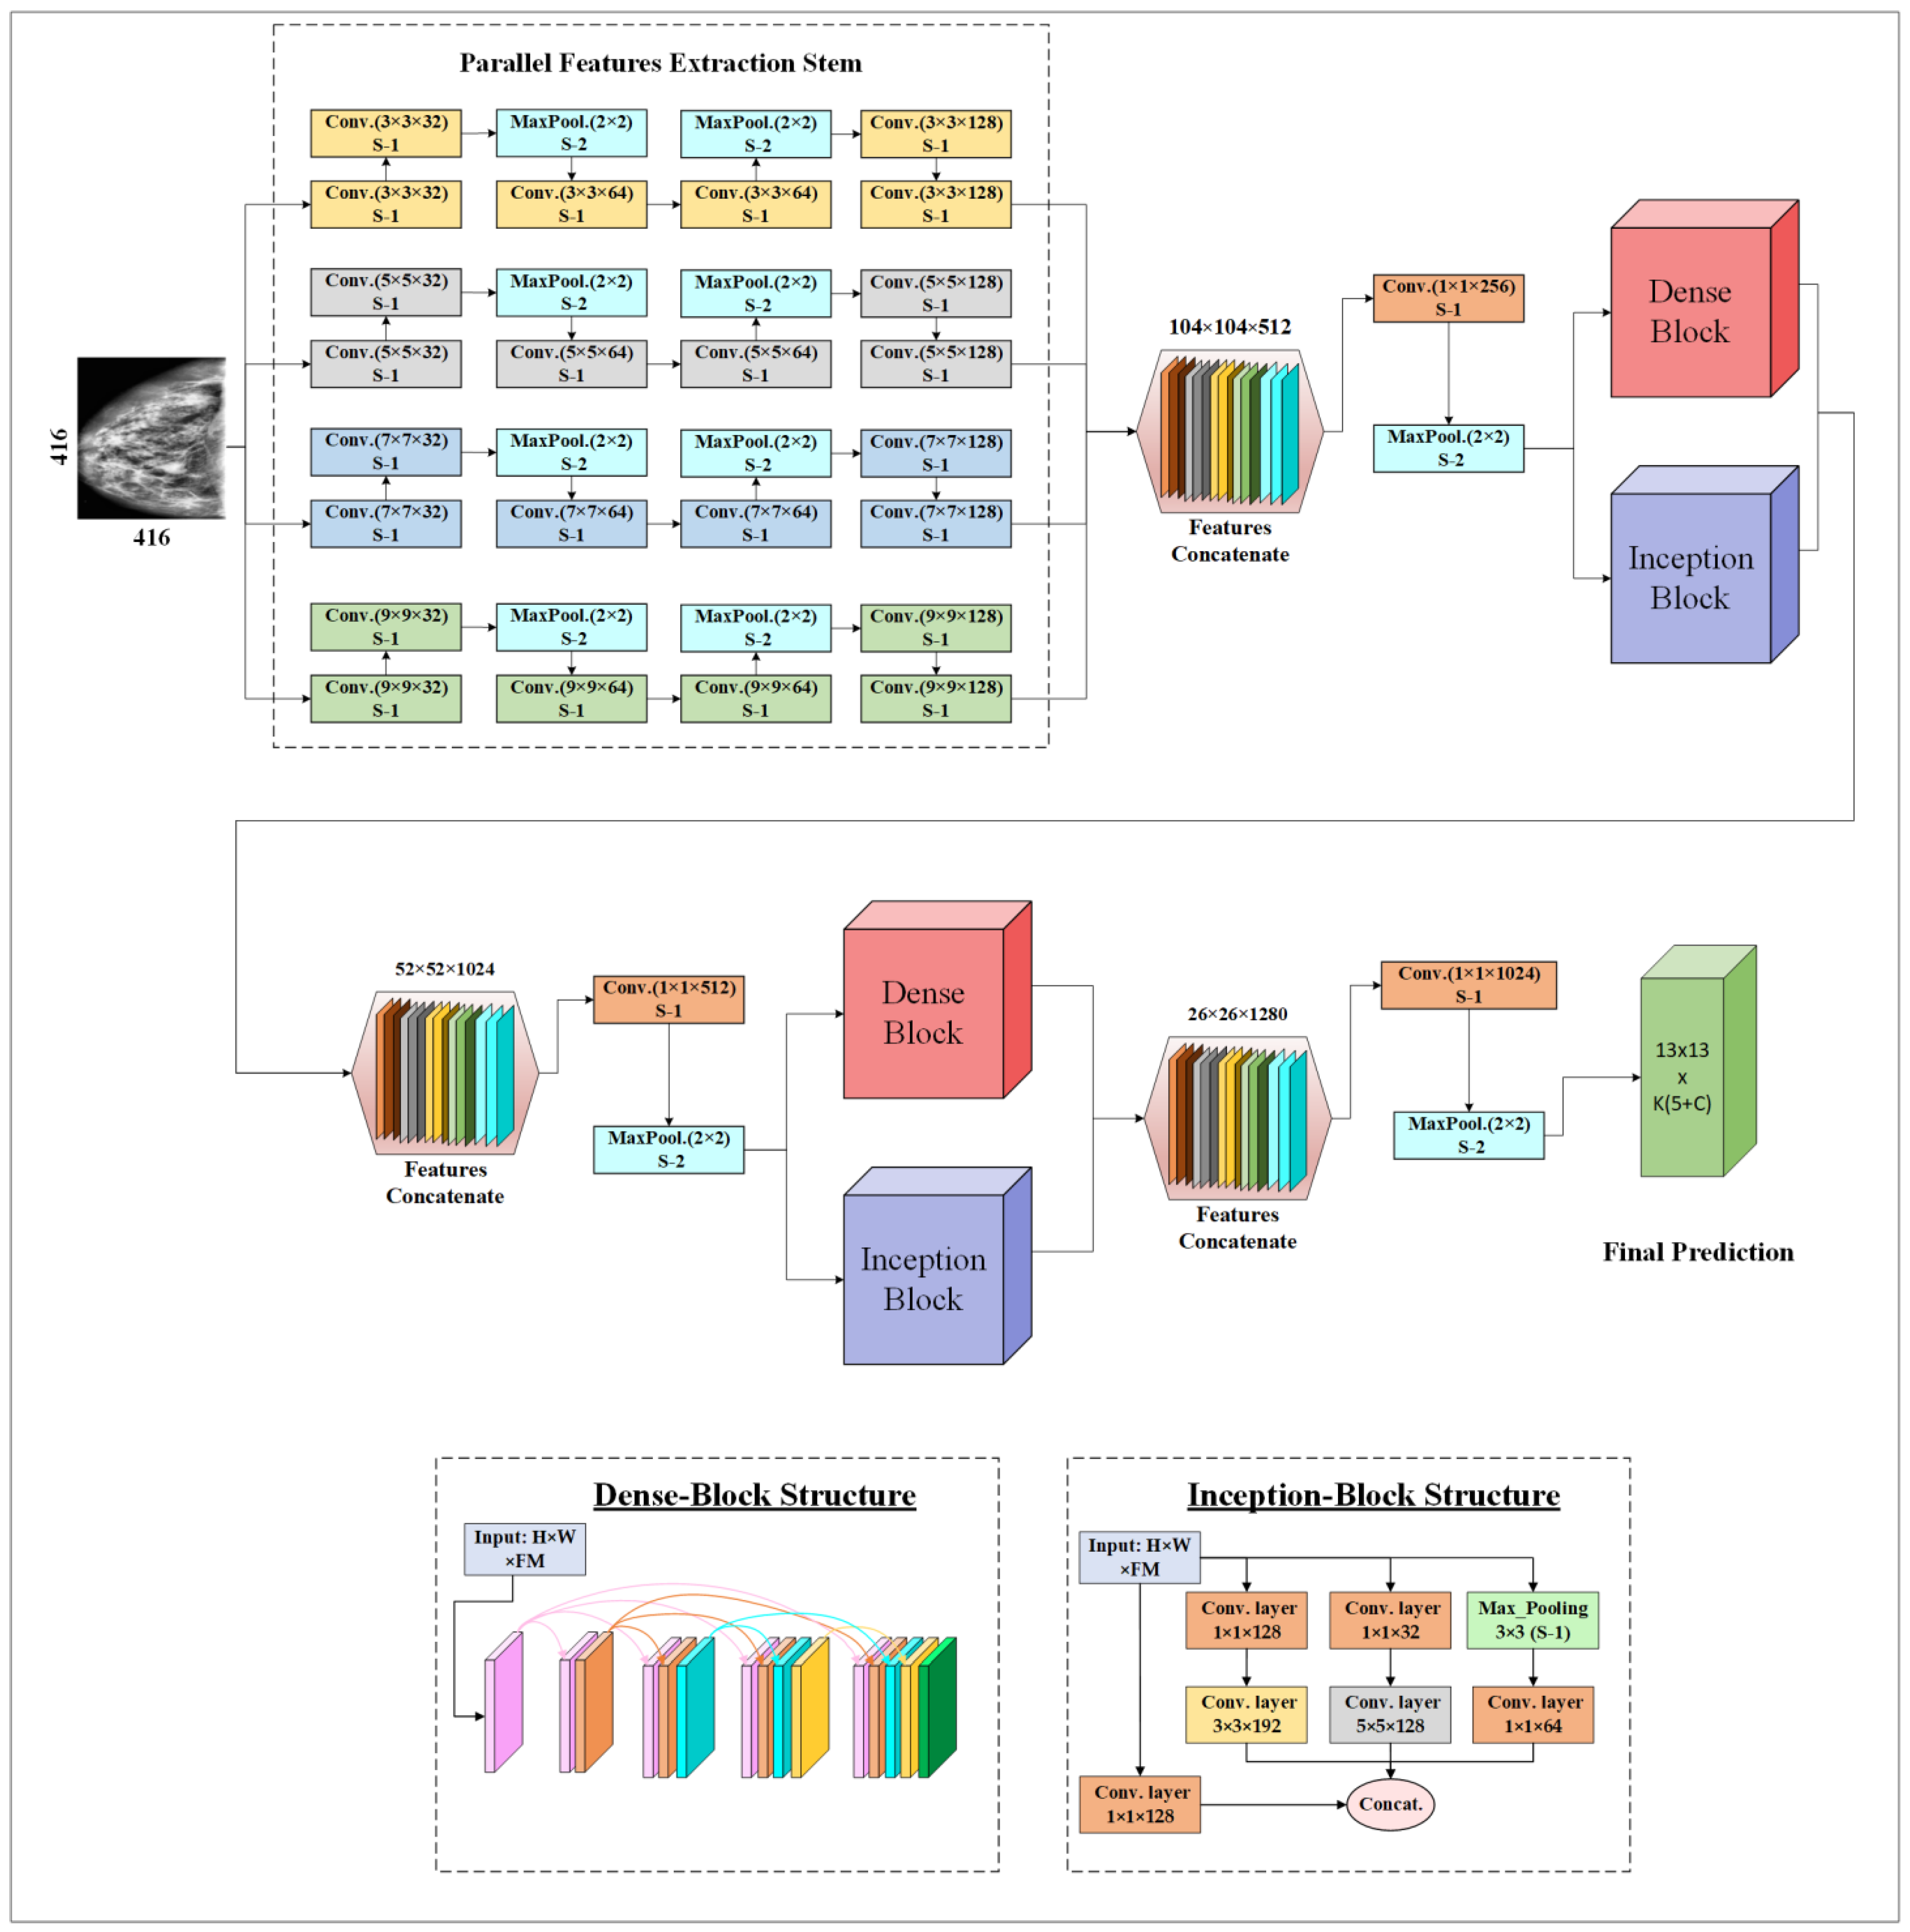
2.4. Proposed Backbone CNN Architecture

The proposed CNN backbone architecture extracts multiscale features using the Parallel Feature Extraction Stem (PFES), Dense Connection Blocks (DCB), and Inception Blocks (IB), as shown in Figure 3. The PFES extracts multiscale features using four differently sized filters (9 × 9, 7 × 7, 5 × 5, and 3 × 3) in its four parallel convolutional layers. These layers extract high-level features in a simple feed-forward manner. In the PFES, after two consecutive convolutional layers, a MaxPooling layer is introduced to downsample the feature maps. The output of the PFES results in 104 × 104-dimensional feature maps with 512 channels. Then, a 1 × 1 convolution is applied to reduce these feature maps to 256 channels. The 1 × 1 convolutional layer is strategically employed as a parameter reduction technique, effectively controlling the overall number of parameters within the network. This approach not only streamlines the model by minimizing computational complexity but also maintains the integrity of feature representation, ensuring efficient processing without compromising performance. MaxPooling layers are used to further reduce the sample dimensions to 52 × 52.
After extracting high-level features, these feature maps with dimensions of 52 × 52 × 256 are fed into the DCB and IB. Four CNN layers use 64 filters of a 3 × 3 size each. In the DCB, as the CNN model forward propagates, the relationship between the L-1th layer and the Lth layer is described in Equation (2).
x l = f ( x l 1   w l + b l )
where f presents the activation function (i.e., FTS), x l 1 is the input, w l are the kernel weights, ∗ is the sign for convolution operation, and b l represents the bias. In the dense connection block, the feature maps of layer L–1 are concatenated and used as the input for the next Lth layer.
DCB play a vital role in enhancing the model’s ability to analyze mammographic images. In DCB, each layer receives inputs from all preceding layers, facilitating the deeper and more efficient propagation of features throughout the network. This design significantly enhances feature reuse and ensures the generation of rich semantic feature maps. These maps are helpful in accommodating the vast irregularities observed in the appearances of breast tissues and the characteristics of lesions in mammograms. Furthermore, the enhanced information flow mitigates the risks of vanishing or exploding gradients, thereby improving the model’s training stability and performance across diverse classes.
IB, inspired by the principles of InceptionNet [37], are integrated into our system to harness their capability of extracting and leveraging features at multiple scales [31]. This block utilizes 1 × 1, 3 × 3, and 5 × 5 convolutional filters for extracting multiscale features. These features are particularly beneficial for addressing the scale variation of lesions, ranging from minute calcifications to larger masses. By capturing patterns at various scales, IB contribute to the model’s robustness, enabling it to more effectively identify breast cancer lesions of different sizes and shapes.
The output feature maps (52 × 52 × 1024) from the DCB and IB are concatenated. Then, a 1 × 1 convolution is applied to reduce these feature maps to 512 channels. MaxPooling layers are used to further reduce the sample dimensions to 26 × 26. Subsequently, the resultant feature maps with dimensions of 26 × 26 × 512 are passed through a second set of DCB and IB. Similar to the previous stages, features are concatenated, reduced in channel count, and dimensionally compressed. These processed features are then fed into the final output layers, which predict all the parameters associated with its GCs, vital for BCD.

2.5. Activation Function

In model training, the choice of an activation function is crucial, as it transforms input signals into output while introducing non-linearity, essential for effective classification. Traditional activation functions like Sigmoid, ReLu, and Tanh are commonly used, but each has limitations. For instance, Sigmoid and Tanh can lead to gradient disappearance in deep layers due to diminishing propagation values, and Sigmoid’s complex power operations can slow training. ReLu, despite its strong convergence rate, is prone to creating dead neurons and fails to constrain the scale of data points as the network depth increases. To overcome these drawbacks, newer and more stable activation functions like Flatten-T Swish (FTS) have been proposed. In our study, we adopt the FTS activation function for our proposed multilevel and multiscale CNN architecture, replacing ReLu. FTS, formulated in Equation (3), with a threshold of −0.20, offers enhanced stability and performance in handling data nonlinearity.
FTS ( x ) = { x 1 + e x + T h r   ,   i f   x 0 T h r     ,   i f   x < 0  

2.6. Loss Function

To accurately classify and localize bounding boxes (BBs) in the YOLO-BCD framework, we employ a dynamic approach to calculate the loss function. This includes several components, namely, BB localization loss ( L o s s L o c ), BB dimension loss ( L o s s D i m ), class confidence loss ( L o s s C o n f ), and classification loss ( L o s s C l a s s ) .
The general loss is illustrated in Equation (4).
L o s s ( P B B   , G T B B   ) = L o s s L o c + L o s s D i m + L o s s C o n f + L o s s C l a s s
The localization loss for bounding boxes is denoted as L o s s L o c and is detailed in Equation (5). This loss is calculated based on the center coordinates of predicted and ground truth BB, ensuring precise localization.
L o s s L o c = λ C o o r d i = 0 S   j = 0 S   k = 0 K     i j k L e s i o n [ ( C _ x   i j C _ x ´ i j k ) 2 + ( C _ y   i j C _ y ´ i j k ) 2 ]  
The dimensions of a BB are crucial and are determined using its width and height. We calculate the BB dimension loss, denoted as L o s s D i m , described in Equation (6). This calculation is pivotal for maintaining the accuracy of the BB size in the model’s predictions.
L o s s D i m = λ C o o r d i = 0 S   j = 0 S   k = 0 K     i j k L e s i o n   [ ( W i j W ´ i j k   W ´ i j k   ) 2 + ( H i j H ´ i j k   W ´ i j k   ) 2   ]
Alongside the dimensions and location, our model also predicts the class of each BB. To calculate the loss associated with the confidence score, we use Equation (7).
L o s s C o n f = λ N o L e s i o n i = 0 S   j = 0 S   k = 0 K     i j k N o L e s i o n [ ( C S i j C S ´ i j k ) 2 ] + λ V e h i c l e i = 0 S   j = 0 S   k = 0 K     i j k L e s i o n [ ( C S i j C S ´ i j k ) 2 ]
Furthermore, the classification result of each BB is denoted as C l a s s = [ C l a s s 1   ,   C l a s s 2   ,   , C l a s s c   ] T . Then, the P r   ( C l a s s l ) l     C denotes the GT, while the predicted probability of the lesion belonging to the l     class is denoted as P ´   ( C l a s s l ) l     C . The class loss is estimated as explained in Equation (8).
L o s s C l a s s = λ C l a s s i = 0 S   j = 0 S   k = 0 K   i j k L e s i o n     l = 0 C   [ P r i j   ( C l a s s l j ) log P ´ r i j     ( C l a s s l ) ]

2.7. Performance Evaluation Matrices

In this study, the performance of the proposed CNN architecture was rigorously evaluated using a comprehensive set of metrics, including precision, recall, F1-Score, accuracy, and mean Average Precision (mAP) [38,39]. These metrics were selected to provide a holistic assessment of the model’s effectiveness in terms of both its predictive accuracy and its ability to balance the trade-off between precision and recall, thereby offering a nuanced understanding of its overall performance in various operational contexts.

2.8. Experimental Setup and Implementation

The experiments were conducted on a Windows 10 computer equipped with an Intel Xeon E5-2643 3.3 GHz CPU, 32 GB of RAM (Intel, Santa Clara, CA, USA), and an NVIDIA Titan X GPU with 12 GB of memory (NVIDIA, Santa Clara, CA, USA). For model weight optimization, we utilized the adaptive moment estimation method, setting the momentum at 0.9 and the decay at 0.0005. The batch size was set to 32. The network underwent training for 145 epochs, starting with a learning rate of 0.001. This rate was specifically chosen based on our experimental conditions and the datasets used. Notably, we adjusted the learning rate to 10% of its initial value at the 20th and 70th epochs to optimize training efficacy. To gauge the lesion detection proficiency of our model, we measured the mean Average Precision (mAP) at an Intersection over Union (IoU) threshold of 0.5.

3. Results and Discussion

Two experiments were conducted to evaluate the performance of the proposed parallel multiscale CNN architecture.

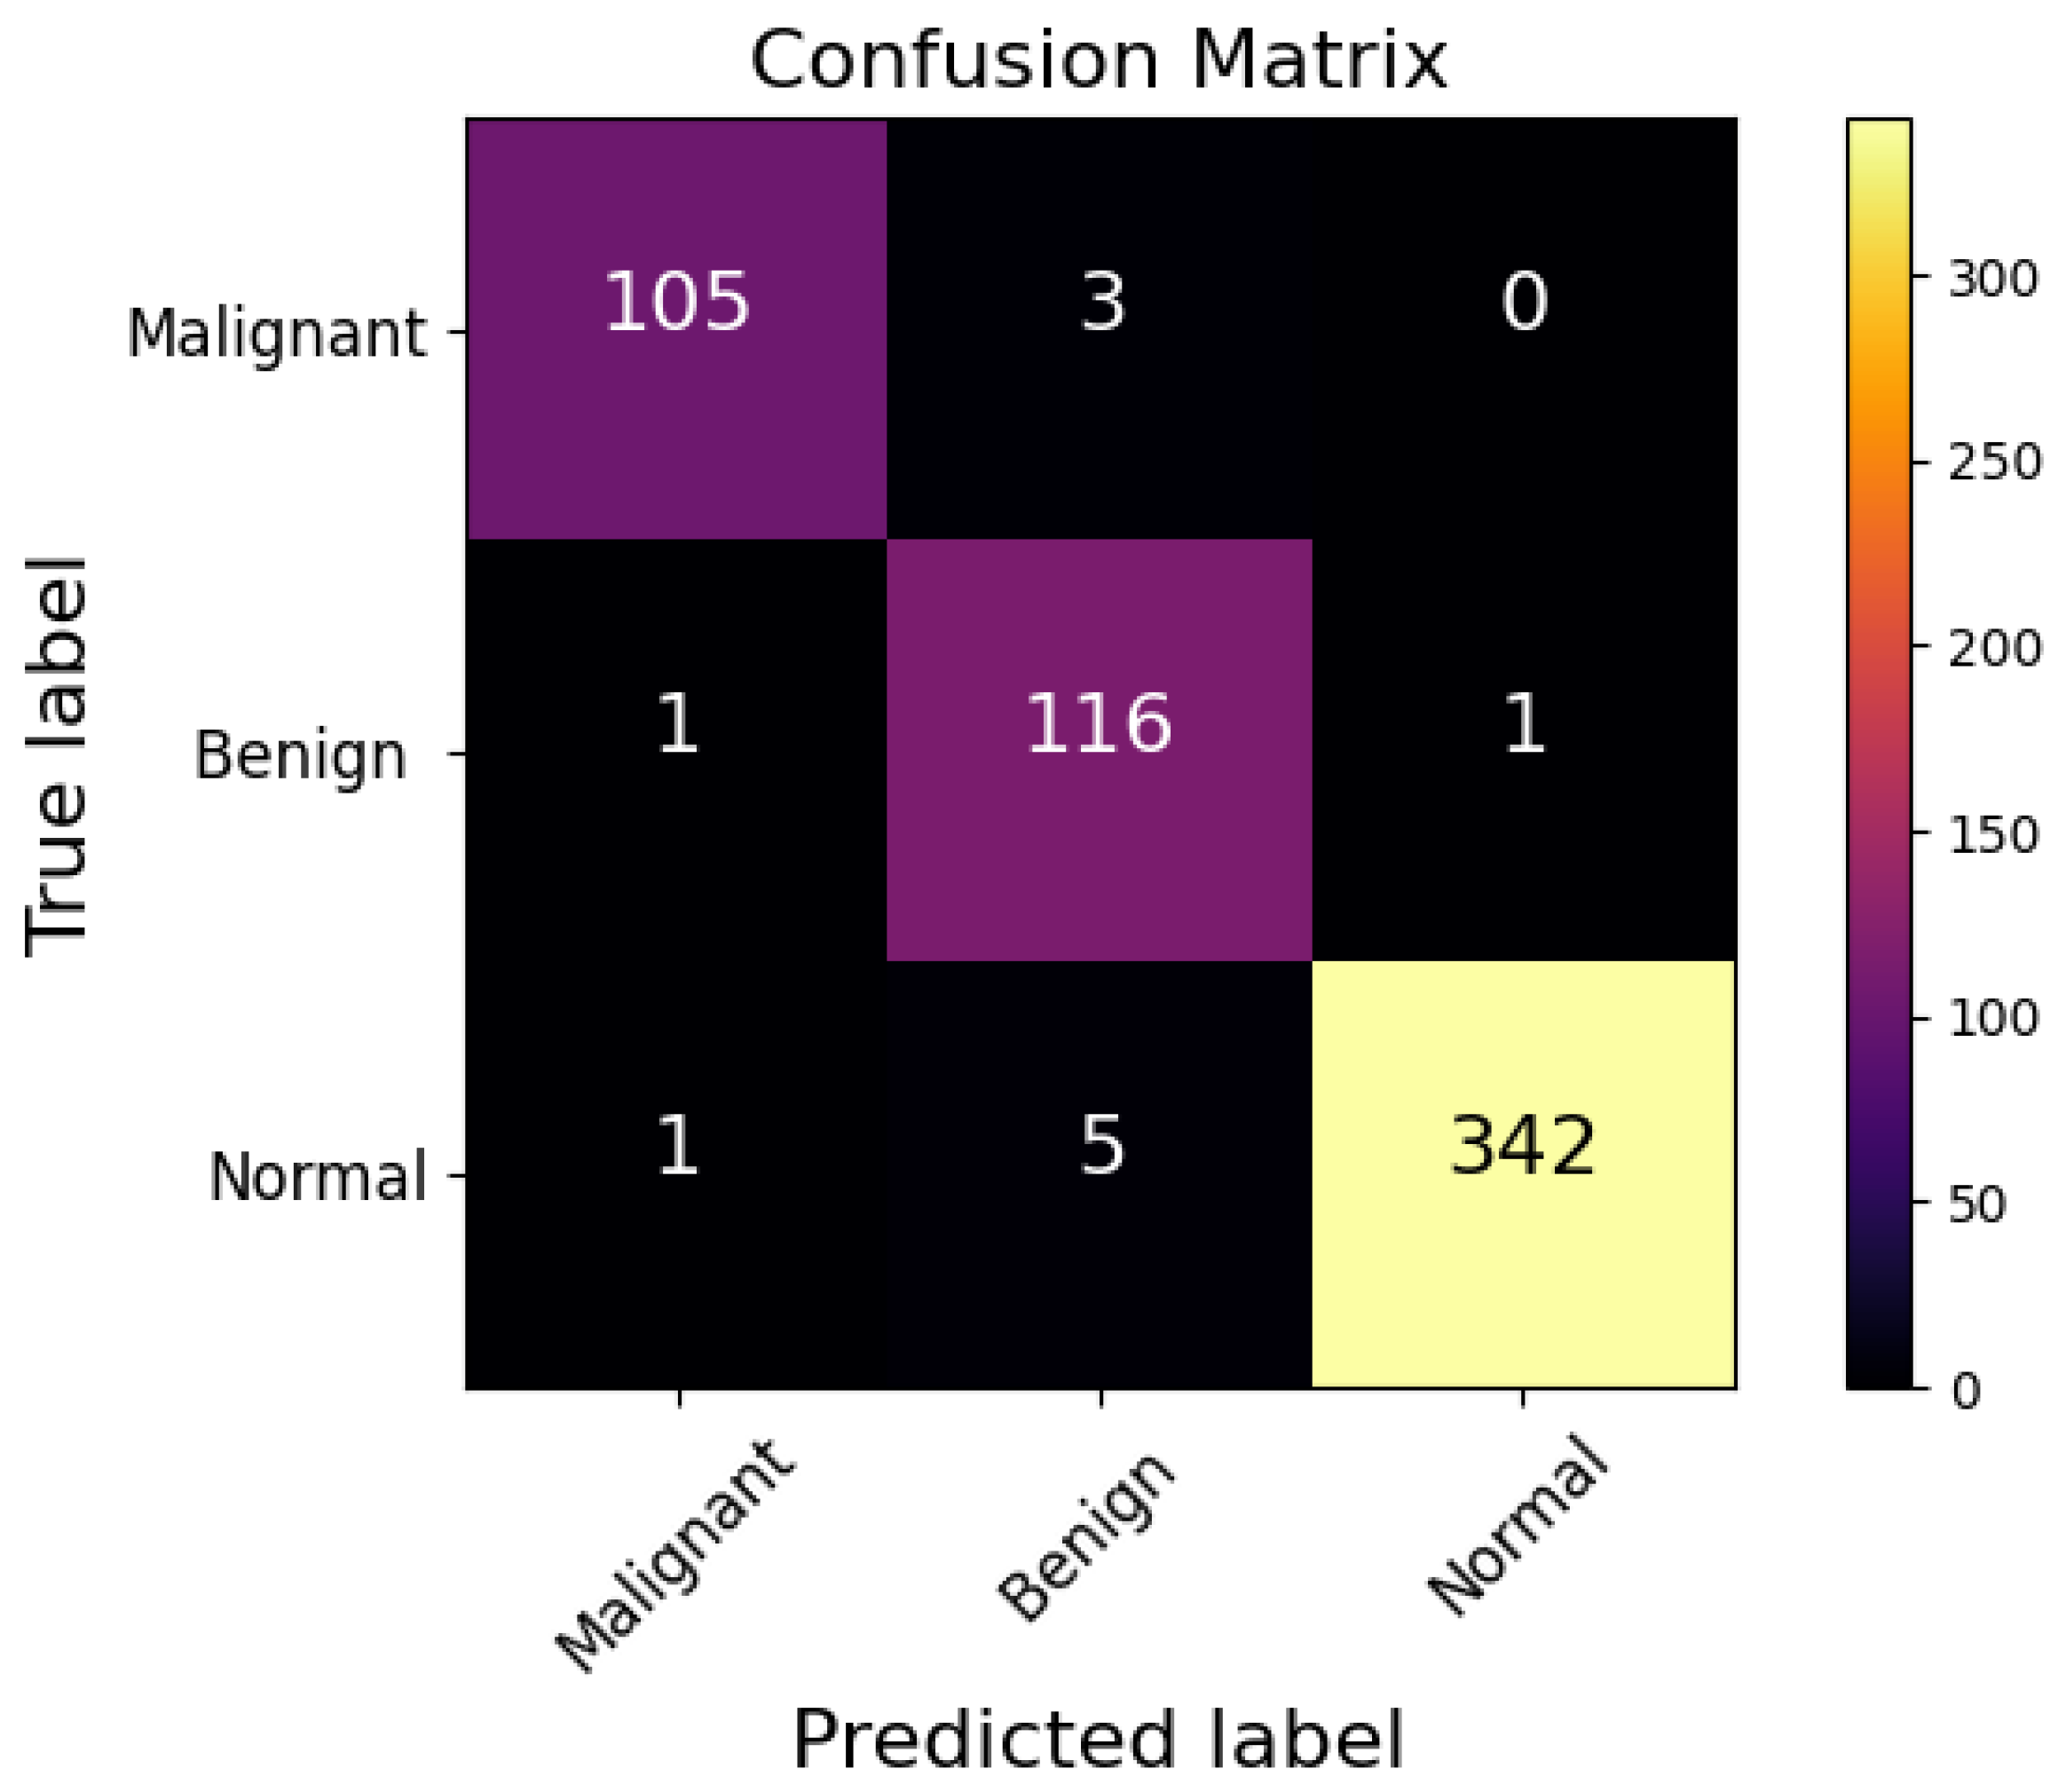
3.1. Breast Cancer Classification Comparative Analysis

In this experiment, the INbreast benchmark was utilized to evaluate the classification performance of the proposed CNN. The ability of the CNN architecture to classify breast cancer cases is evident from the confusion matrix presented in Figure 4. The proposed CNN model using the FTS activation function accurately identified 105 malignant, 116 benign, and 342 normal cases, demonstrating high precision across all categories. Despite its exceptional accuracy, the model had a few misclassifications: only three cases were incorrectly labeled as ‘Malignant’ and two were incorrectly labeled as ‘Benign’.
Based on the values from the confusion matrix, the precision, recall, F1-score, and accuracy of each model were calculated and are presented in Table 2. This comparative analysis of the breast cancer diagnosis results highlights the effectiveness of various frameworks. The Faster RCNN approach by Ibrokhimov et al. [33] achieved a precision of 84.36%, a recall of 85.23%, an F1-Score of 84.70%, and an overall accuracy of 87.80%. Meanwhile, the YOLO V3-based model proposed by Zhang et al. [20] marked an improvement, yielding a precision of 90.94%, a recall of 89.83%, an F1-Score of 90.36%, and an accuracy of 92.16%. Further advancements were observed in the YOLO V5-based framework by Meng et al. [21], which accomplished a precision of 92.08%, a recall of 91.31%, an F1-Score of 91.67%, and an accuracy of 93.72%. The YOLO-LOGO model by Su et al. [22] achieved 95.53% precision, 95.47% recall, 95.50% F1-Score, and 96.51% accuracy. We evaluated the impact of various activation functions on the classification accuracy of our proposed CNN model. By replacing traditional activation functions—specifically, Leaky ReLU—with a state-of-the-art activation function, namely, FTS, we observed a notable improvement. The implementation of the FTS activation function resulted in an increase in the classification accuracy by 0.52% compared to the baseline model utilizing Leaky ReLU. The proposed YOLO-BCD CNN architecture using the FTS activation function outperformed all, exhibiting a remarkable precision of 97.13%, a recall of 97.93%, an F1-Score of 97.51%, and the highest accuracy of 98.08%. These results illustrate the enhancement in breast cancer classification accuracy through advanced deep learning models, concluding in the superior performance of the proposed architecture.

3.2. Ablation Experiment Breast Cancer Detection

In our research, we assessed the impact of specific model components on breast lesion detection through ablation studies, focusing on multiscale features via IB, multilevel features through DCB, CLAHE for image enhancement, FTS activation function, and a scale-invariant loss function, revealing their crucial roles in enhancing detection performance. The results, presented in Table 3, illustrate the significant impact of different features on the detection process. By incorporating all characteristics, the proposed YOLO-BCD framework achieved a 91.15% mAP. Notably, the absence of multiscale and multilevel feature blocks resulted in mAP scores of 87.07% and 88.02%, respectively, highlighting their importance in capturing complex patterns. With the exclusion of image enhancement, the model achieved an 88.66% mAP. Excluding the scale-invariant loss function, the model attained an 89.94% mAP. Without the FTS activation function, YOLO-BCD achieved a 90.60% mAP.

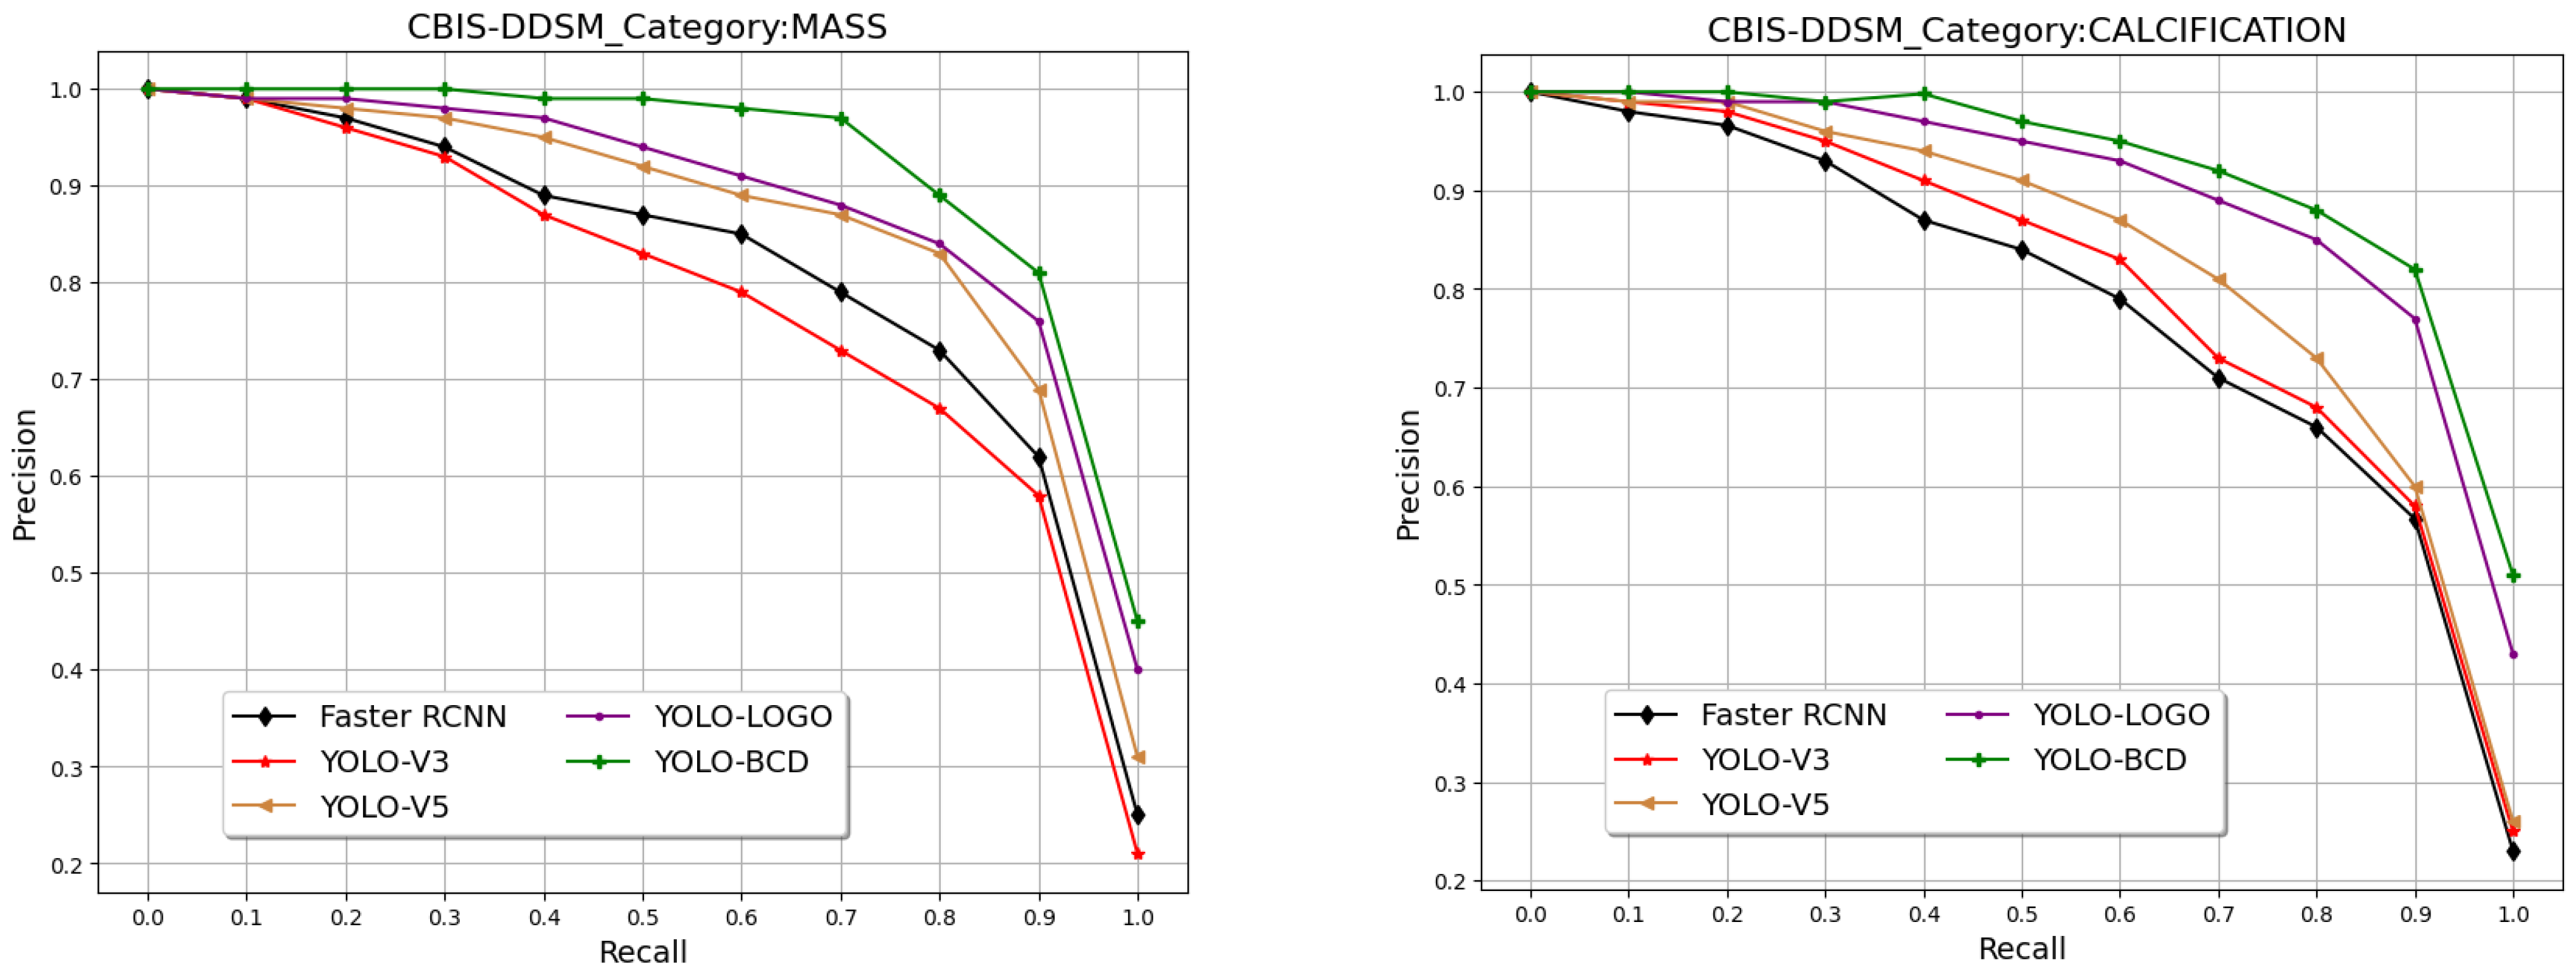
3.3. Breast Cancer Detection Comparative Analysis

The comparative analysis of the proposed YOLO-BCD framework against existing state-of-the-art BC detection schemes is detailed in Figure 5 and Table 4. Notably, Figure 5 illustrates that the proposed framework covers the maximum area under the PR-curve for both classes, indicating its superior balance between precision and recall over other frameworks. This is a critical indicator of the efficiency of a BC detection model, particularly in medical diagnostics, where both false positives and false negatives carry significant concerns.
Table 4 further reveals this point by presenting the Average Precision (AP) for each class and the mean Average Precision (mAP) across different models. The proposed YOLO-BCD framework demonstrates the highest average precision scores using the FTS activation function for both Mass (90.95%) and Calcification (Cal) (91.35%) detection, leading to an impressive mean Average Precision of 91.15%. This surpasses other models, such as the Faster RCNN by Ibrokhimov et al. [33], with an mAP of 79.30%, the YOLO V3-based model by Zhang et al. [20], with an mAP of 78.76%, YOLO V5 by Meng et al. [21], with an mAP of 83.84%, and YOLO-LOGO by Su et al. [22], with an mAP of 88.60%. These results collectively underscore the superior accuracy of the YOLO-BCD framework in detecting breast cancer indicators. In Figure 6, some qualitative results are presented to demonstrate the detection of breast cancer in test images from the CBIS-DDSM dataset.

4. Conclusions

This study introduces a novel YOLO-based BCD framework, designed for the accurate classification and detection of cancer tissues. To enhance the image clarity for more effective feature extraction by the CNN model, we adopted the CLAHE technique, which shows a 2.49 mAP improvement during evaluation. Data augmentation strategies were implemented to generate additional samples and mitigate overfitting risks. We proposed a parallel CNN architecture that utilizes multilevel and multiscale features. The model’s effectiveness was rigorously evaluated using publicly available datasets, including INbreast and CBIS-DDSM. The absence of multiscale and multilevel feature blocks resulted in lower mAP scores, highlighting their importance in capturing complex patterns. We employed an advanced activation function, namely, FTS, to prevent gradient vanishing and exploding issues in CNN training. The results reveal that the use of FTS instead of traditional LeakyReLU improved the mAP by 0.55. The scale-invariant loss function was utilized instead of the traditional YOLO loss function, improving the mAP by 1.21. Overall, it achieved an accuracy of 98.72% for breast cancer classification on the INbreast dataset and a mean Average Precision (mAP) of 91.15% for breast cancer detection on the CBIS-DDSM dataset. Notably, our proposed CNN architecture is computationally efficient, requiring only 11.33 million parameters for training. This optimization was achieved through careful model design, parameter reduction techniques, and the efficient use of the FTS activation function, ensuring that our system remains accessible for practical applications without compromising its effectiveness.

Author Contributions

Conceptualization, A.D.M. and D.E.; methodology, A.D.M.; software, A.D.M.; validation, A.D.M. and D.E.; formal analysis, A.D.M. and D.E.; investigation, A.D.M.; resources, A.D.M.; data curation, A.D.M.; writing—original draft preparation, A.D.M.; writing—review and editing, A.D.M.; visualization, A.D.M.; supervision, D.E.; project administration, A.D.M. and D.E.; funding acquisition, A.D.M. All authors have read and agreed to the published version of the manuscript.

Funding

This research received no external funding.

Institutional Review Board Statement

Not applicable.

Informed Consent Statement

Not applicable.

Data Availability Statement

The data supporting the findings of this research are presented within the manuscript and appropriately cited. More Data will be made available upon request. Access to data will be in accordance with ethical and legal considerations.

Conflicts of Interest

The authors declare no conflicts of interest.

References

  1. Jeon, W.; Ko, G.; Lee, J.; Lee, H.; Ha, D.; Ro, W.W. Deep learning with GPUs. Adv. Comput. 2021, 122, 167–215. [Google Scholar] [CrossRef]
  2. Anand, V.; Gupta, S.; Koundal, D.; Singh, K. Fusion of U-Net and CNN model for segmentation and classification of skin lesion from dermoscopy images. Expert Syst. Appl. 2023, 213, 119230. [Google Scholar] [CrossRef]
  3. Hasan, A.M.; Al-Waely, N.K.N.; Aljobouri, H.K.; Jalab, H.A.; Ibrahim, R.W.; Meziane, F. Molecular subtypes classification of breast cancer in DCE-MRI using deep features. Expert Syst. Appl. 2024, 236, 121371. [Google Scholar] [CrossRef]
  4. Van Do, Q.; Hoang, H.T.; Van Vu, N.; De Jesus, D.A.; Brea, L.S.; Nguyen, H.X.; Nguyen, A.T.L.; Le, T.N.; Dinh, D.T.M.; Nguyen, M.T.B.; et al. Segmentation of hard exudate lesions in color fundus image using two-stage CNN-based methods. Expert Syst. Appl. 2024, 241, 122742. [Google Scholar] [CrossRef]
  5. Baccouche, A.; Garcia-Zapirain, B.; Olea, C.C.; Elmaghraby, A.S. Breast lesions detection and classification via YOLO-based fusion models. Comput. Mater. Contin. 2021, 69, 1407–1425. [Google Scholar] [CrossRef]
  6. Sechopoulos, I.; Teuwen, J.; Mann, R. Artificial intelligence for breast cancer detection in mammography and digital breast tomosynthesis: State of the art. Semin. Cancer Biol. 2021, 72, 214–225. [Google Scholar] [CrossRef]
  7. Jessica, T. Contrast-Enhanced Spectral Mammography (Cesm) versus Breast Magnetic Resonance Imaging (Mri) in Breast Cancer Detection among Patients with Newly Diagnosed Breast Cancer: A Systematic Review. J. Med. Imaging Radiat. Sci. 2023, 54, S35–S36. [Google Scholar] [CrossRef]
  8. Koh, J.; Yoon, Y.; Kim, S.; Han, K.; Kim, E.K. Deep Learning for the Detection of Breast Cancers on Chest Computed Tomography. Clin. Breast Cancer 2022, 22, 26–31. [Google Scholar] [CrossRef]
  9. Kratkiewicz, K.; Pattyn, A.; Alijabbari, N.; Mehrmohammadi, M. Ultrasound and Photoacoustic Imaging of Breast Cancer: Clinical Systems, Challenges, and Future Outlook. J. Clin. Med. 2022, 11, 1165. [Google Scholar] [CrossRef]
  10. Moloney, B.M.; McAnena, P.F.; Elwahab, S.M.A.; Fasoula, A.; Duchesne, L.; Gil Cano, J.D.; Glynn, C.; O’Connell, A.; Ennis, R.; Lowery, A.J.; et al. Microwave Imaging in Breast Cancer—Results from the First-In-Human Clinical Investigation of the Wavelia System. Acad. Radiol. 2022, 29, S211–S222. [Google Scholar] [CrossRef]
  11. Zhao, J.; Chen, T.; Cai, B. A computer-aided diagnostic system for mammograms based on YOLOv3. Multimed. Tools Appl. 2022, 81, 19257–19281. [Google Scholar] [CrossRef]
  12. Belhaj Soulami, K.; Kaabouch, N.; Nabil Saidi, M. Breast cancer: Classification of suspicious regions in digital mammograms based on capsule network. Biomed. Signal Process Control 2022, 76, 103696. [Google Scholar] [CrossRef]
  13. Elkorany, A.S.; Elsharkawy, Z.F. Efficient breast cancer mammograms diagnosis using three deep neural networks and term variance. Sci. Rep. 2023, 13, 2663. [Google Scholar] [CrossRef] [PubMed]
  14. Kang, D.; Gweon, H.M.; Eun, N.L.; Youk, J.H.; Kim, J.A.; Son, E.J. A convolutional deep learning model for improving mammographic breast-microcalcification diagnosis. Sci. Rep. 2021, 11, 23925. [Google Scholar] [CrossRef]
  15. Haq, I.U.; Ali, H.; Wang, H.Y.; Lei, C.; Ali, H. Feature fusion and Ensemble learning-based CNN model for mammographic image classification. J. King Saud. Univ.—Comput. Inf. Sci. 2022, 34, 3310–3318. [Google Scholar] [CrossRef]
  16. Escorcia-Gutierrez, J.; Mansour, R.F.; Beleño, K.; Jiménez-Cabas, J.; Pérez, M.; Madera, N.; Velasquez, K. Automated Deep Learning Empowered Breast Cancer Diagnosis Using Biomedical Mammogram Images. Comput. Mater. Contin. 2022, 71, 4221–4235. [Google Scholar] [CrossRef]
  17. Sannasi Chakravarthy, S.R.; Rajaguru, H. Automatic Detection and Classification of Mammograms Using Improved Extreme Learning Machine with Deep Learning. IRBM 2022, 43, 49–61. [Google Scholar] [CrossRef]
  18. Salama, W.M.; Aly, M.H. Deep learning in mammography images segmentation and classification: Automated CNN approach. Alex. Eng. J. 2021, 60, 4701–4709. [Google Scholar] [CrossRef]
  19. Xie, L.; Zhang, L.; Hu, T.; Huang, H.; Yi, Z. Neural networks model based on an automated multi-scale method for mammogram classification. Knowl. Based Syst. 2020, 208, 106465. [Google Scholar] [CrossRef]
  20. Zhang, L.; Li, Y.; Chen, H.; Wu, W.; Chen, K.; Wang, S. Anchor-free YOLOv3 for mass detection in mammogram. Expert Syst. Appl. 2022, 191, 116273. [Google Scholar] [CrossRef]
  21. Meng, M.; Zhang, M.; Shen, D.; He, G.; Guo, Y. Detection and classification of breast lesions with You Only Look Once version 5. Future Oncol. 2022, 18, 4361–4370. [Google Scholar] [CrossRef] [PubMed]
  22. Su, Y.; Liu, Q.; Xie, W.; Hu, P. YOLO-LOGO: A transformer-based YOLO segmentation model for breast mass detection and segmentation in digital mammograms. Comput. Methods Programs Biomed. 2022, 221, 106903. [Google Scholar] [CrossRef] [PubMed]
  23. Ashraf, M.H.; Jabeen, F.; Alghamdi, H.; Zia, M.S.; Almutairi, M.S. HVD-Net: A Hybrid Vehicle Detection Network for Vision-Based Vehicle Tracking and Speed Estimation. J. King Saud. Univ.—Comput. Inf. Sci. 2023, 35, 101657. [Google Scholar] [CrossRef]
  24. Loizidou, K.; Elia, R.; Pitris, C. Computer-aided breast cancer detection and classification in mammography: A comprehensive review. Comput. Biol. Med. 2023, 153, 106554. [Google Scholar] [CrossRef]
  25. Vijayan, D.; Lavanya, R. Integration of Global and Local Descriptors for Mass Characterization in Mammograms. Procedia Comput. Sci. 2023, 218, 393–405. [Google Scholar] [CrossRef]
  26. Irshad Khan, A.; Abushark, Y.B.; Alsolami, F.; Almalawi, A.; Alam, M.; Kshirsagar, P.; Khan, R.A. Prediction of breast cancer based on computer vision and artificial intelligence techniques. Measurement 2023, 218, 113230. [Google Scholar] [CrossRef]
  27. Selvi, A.; Thilagamani, S.; Author, C. Scale Invariant Feature Transform with Crow Optimization for Breast Cancer Detection. Intell. Autom. Soft Comput. 2023, 36. [Google Scholar] [CrossRef]
  28. Lemons, K. A Comparison Between Naïve Bayes and Random Forest to Predict Breast Cancer. Int. J. Undergrad. Res. Creat. Act. 2023, 12, 10. [Google Scholar] [CrossRef]
  29. Malebary, S.J.; Hashmi, A. Automated Breast Mass Classification System Using Deep Learning and Ensemble Learning in Digital Mammogram. IEEE Access 2021, 9, 55312–55328. [Google Scholar] [CrossRef]
  30. Wen, X.; Guo, X.; Wang, S.; Lu, Z.; Zhang, Y. Breast cancer diagnosis A systematic review. Biocybern. Biomed. Eng. 2024, 44, 119–148. [Google Scholar] [CrossRef]
  31. Abduljabbar, M.; Al Bayati, Z.; Çakmak, M. Real-Time Vehicle Detection for Surveillance of River Dredging Areas Using Convolutional Neural Networks. Int. J. Image Graph. Signal Process. 2023, 5, 17–28. [Google Scholar] [CrossRef]
  32. Saber, A.; Sakr, M.; Abo-Seida, O.M.; Keshk, A.; Chen, H. A Novel Deep-Learning Model for Automatic Detection and Classification of Breast Cancer Using the Transfer-Learning Technique. IEEE Access 2021, 9, 71194–71209. [Google Scholar] [CrossRef]
  33. Ibrokhimov, B.; Kang, J.Y. Two-Stage Deep Learning Method for Breast Cancer Detection Using High-Resolution Mammogram Images. Appl. Sci. 2022, 12, 4616. [Google Scholar] [CrossRef]
  34. Alghamdi, H.; Turki, T. PDD-Net: Plant Disease Diagnoses Using Multilevel and Multiscale Convolutional Neural Network Features. Agriculture 2023, 13, 1072. [Google Scholar] [CrossRef]
  35. Moreira, I.C.; Amaral, I.; Domingues, I.; Cardoso, A.; Cardoso, M.J.; Cardoso, J.S. INbreast: Toward a Full-field Digital Mammographic Database. Acad. Radiol. 2012, 19, 236–248. [Google Scholar] [CrossRef] [PubMed]
  36. Lee, R.S.; Gimenez, F.; Hoogi, A.; Miyake, K.K.; Gorovoy, M.; Rubin, D.L. A curated mammography data set for use in computer-aided detection and diagnosis research. Sci. Data 2017, 4, 170177. [Google Scholar] [CrossRef] [PubMed]
  37. Szegedy, C.; Vanhoucke, V.; Ioffe, S.; Shlens, J.; Wojna, Z. Rethinking the Inception Architecture for Computer Vision. In Proceedings of the IEEE Conference On Computer Vision and Pattern Recognition, Las Vegas, NV, USA, 27–30 June 2016; pp. 2818–2826. [Google Scholar]
  38. Tharwat, A. Classification assessment methods. Appl. Comput. Inform. 2018, 17, 168–192. [Google Scholar] [CrossRef]
  39. Padilla, R.; Netto, S.L.; Da Silva, E.A.B. A Survey on Performance Metrics for Object-Detection Algorithms. In Proceedings of the 2020 International Conference on Systems, Signals and Image Processing (IWSSIP), Niteroi, Brazil, 1–3 July 2020; pp. 237–242. [Google Scholar] [CrossRef]
Figure 1. Dataset sample images: (a) the original image, (b) the enhanced image, and (c) the enhanced and resized image.
Applsci 14 02680 g001
Figure 2. Proposed YOLO-based BCD Framework.
Applsci 14 02680 g002
Figure 3. Proposed multiscale parallel CNN architecture.
Applsci 14 02680 g003
Figure 4. Confusion matrix of proposed CNN architecture.
Applsci 14 02680 g004
Figure 5. The PR curve of different breast cancer detection frameworks on the CBIS-DDSM test set.
Applsci 14 02680 g005
Figure 6. Qualitative Results of Breast Cancer Detection on the CBIS-DDSM Dataset.
Applsci 14 02680 g006
Table 1. Literature analysis.
AuthorMethodsDatasetLimitations
Vijayan et al. [25]They proposed a feature fusion strategy utilizing global (e.g., morphological features and GLCM) and local (e.g., SIFT and LBP) features for BCD.CBIS-DDSMThe reliance on predefined feature sets limits the adaptability and generalization of models across diverse mammogram datasets, and the complex shapes and sizes of lesions present significant challenges for models trained on specific features.
Irshad et al. [26]Utilized the HOG and GLCM handcrafted features for BCD.BreakHisHOG features are sensitive to geometric and photometric transformations, while GLCM-derived texture features are particularly vulnerable to noise in mammogram images.
Selvi et al. [27]Utilized the Kalman filter for noise removal and SIFT features in their BCD framework.CBIS-DDSMThe SIFT mechanism’s reliance on gradient orientation and magnitude can lead to limited effectiveness in capturing the complex textural details and slight intensity variations often present in mammographic images of breast cancer tissues.
Baccouche et al. [5]Proposed a YOLO V2-based framework that utilized Darknet19 CNN architecture for feature extraction and BCD.CBIS-DDSM and INbreast.DarkNet-19 is a feed-forward CNN that overlooks the importance of multi-level and multi-scale features. This oversight can lead to challenges such as gradient vanishing or exploding, limiting its effectiveness in managing class variation crucial for accurate BCD [23].
Zhao et al. [11]Proposed a YOLO v3-based framework that utilized Darknet53 CNN architecture for feature extraction and BCD.CBIS-DDSMAlthough DarkNet-53 utilizes multilevel features to mitigate the gradient vanishing problem, it still ignores multi-scale features, which are vital for a scale-invariant BCD framework.
Xie et al. [19]Utilized DenseNet and MobileNet CNN architectures for BCD.INbreastDenseNet’s computational complexity and extensive use of dense connection blocks can lead to model overfitting; on the other hand, MobileNet, while more lightweight, tends to overlook multi-level features.
Meng et al. [21]Proposed a YOLO v5-based framework that utilized Cross Stage Partial-DarkNet53 CNN architecture.DCE-MRIThe CSP-DarkNet53 architecture is computationally expensive, which hinders deployment in resource-constrained settings. Its feature integration does not optimally capture multi-scale details, which are critical for detecting subtle breast cancer signs.
Su et al. [22]Proposed the YOLO-LOGO framework based on YOLOV5 CNN architecture.CBIS-DDSM and INbreastThe YOLOv5 CNN architecture is computationally expensive and ignores multiscale features.
Saber et al. [32] Proposed a transfer learning-based BCD framework that utilized VGG-16 CNN architecture.MIASVGG-16 is a simple CNN architecture that ignores multilevel and multiscale features.
Ibrokhimov et al. [33]Proposed a Faster-RCNN-based framework for BCD. INBreastThe Faster-RCNN architecture, as a two-stage detector, first extracts RoIs and then performs classification, which slows down the detection process and increases the overall system complexity.
Table 2. Performance comparison of breast cancer classification using the INbreast dataset.
FrameworkActivation FunctionPrecision (%) Recall (%)F1-Score (%)Accuracy (%)
Faster RCNN
Ibrokhimov et al. [33]
ReLU84.3685.2384.7087.80
YOLO V3
Zhang et al. [20]
Leaky ReLU90.9489.8390.3692.16
YOLO V5
Meng et al. [21]
Leaky ReLU92.0891.3191.6793.72
YOLO-LOGO
Su et al. [22]
Leaky ReLU95.5395.4795.5096.51
YOLO-BCD (Proposed)Leaky ReLU96.3997.0396.7097.56
YOLO-BCD (Proposed)FTS97.1397.9397.5198.08
Table 3. Ablation Experiment using the CBIS-DDSM dataset.
Multi-Scale FeaturesMulti-Level FeaturesCLAHEActivation FunctionLoss FunctionMass AP%Cal AP%mAP%
FTSScale-invariant87.1786.9887.08
FTSScale-invariant88.4487.5988.02
FTSScale-invariant89.1488.1788.66
FTSYOLO Loss89.7790.1189.94
Leaky ReLUScale-invariant90.5590.6490.60
FTSScale-invariant90.9591.3591.15
(✘) represents feature exclusion; (✔) represents feature incorporation.
Table 4. Performance comparison using the CBIS-DDSM dataset.
FrameworkActivation FunctionMass AP%Cal AP%mAP%
Faster RCNN
Ibrokhimov et al. [33]
ReLU80.9477.6679.30
YOLO V3
Zhang et al. [20]
Leaky ReLU77.8379.7078.76
YOLO V5
Meng et al. [21]
Leaky ReLU85.4982.1883.84
YOLO-LOGO
Su et al. [22]
Leaky ReLU88.3188.8988.60
YOLO-BCD (Proposed)FTS90.9591.3591.15
Disclaimer/Publisher’s Note: The statements, opinions and data contained in all publications are solely those of the individual author(s) and contributor(s) and not of MDPI and/or the editor(s). MDPI and/or the editor(s) disclaim responsibility for any injury to people or property resulting from any ideas, methods, instructions or products referred to in the content.

