Article

Study on the Movement of Overlying Rock Strata and Surface Movement in Mine Goaf under Different Treatment Methods Based on PS-InSAR Technology

1
School of Resources, Environment and Materials, Guangxi University, Nanning 530004, China
2
Guangxi Higher School Key Laboratory of Minerals Engineering, Nanning 530004, China
*
Author to whom correspondence should be addressed.
Appl. Sci. 2024, 14(6), 2651; https://doi.org/10.3390/app14062651
Submission received: 8 February 2024 / Revised: 12 March 2024 / Accepted: 16 March 2024 / Published: 21 March 2024

Abstract

:
The goaf treatment of underground metal mines is an important link in mining, and it is particularly important to master the laws of overlying rock strata and surface movement of goaf. In this paper, Persistent Scatterer Interferometric Synthetic Aperture Radar (PS-InSAR) technology is used to monitor the surface subsidence of the Taibao lead-zinc mine, and the surface subsidence laws of goaf-closure, partial-filling, and full-filling treatments are analyzed by the time-series method. The findings indicate that the surface subsidence of the closed goaf is solely governed by the pillars, with the quality of these pillars playing a pivotal role in controlling such subsidence. Factors like stope span also influence the surface subsidence of partially filled goaf. Prior to compaction, it is primarily the pillars that control surface subsidence; however, after compaction, filling and pillars jointly regulate this phenomenon. Notably, in filled goaf, the quality of both roof and pillars significantly impacts surface subsidence. Before compaction occurs, control over surface subsidence is not evident, yet post-compaction, the filling is effective and tends to stabilize this process. The research findings are significant in enhancing goaf’s treatment efficacy, mitigating surface damage and minimizing ecological environmental impact.

1. Introduction

The extraction of underground mineral resources disrupts the initial stress equilibrium within the rock mass, resulting in stress redistribution and movement, deformation, and fracturing of overlying strata [1,2]. As the goaf area continuously expands, the movement of overburden progresses toward the surface, leading to phenomena such as subsidence, cracking, collapse, and other forms of environmental damage, as well as structural deterioration and economic losses [3,4,5,6]. In recent years, investigating overburden rock strata and surface movement laws has consistently remained a prominent concern in mine environmental management.
To comprehend the laws governing surface subsidence resulting from underground mining activities and assess their impact on the environment and infrastructure above ground level effectively, scholars have employed diverse measurement techniques for studying this phenomenon. The conventional approach involves establishing monitoring points on the ground while utilizing technologies like Electronic Total Station, horizontal measurement methods, Global Navigation Satellite Systems (GNSS), and Terrestrial Laser Scanning (TLS), among others [7,8,9,10,11], to accurately measure relative elevation changes at these points. Although these methods offer high accuracy monitoring levels, they are limited in terms of comprehensively monitoring point quantity and fail to depict subsidence characteristics within mining areas. With the continuous advancement of remote sensing technology, novel approaches such as Unmanned Aerial Vehicle (UAV) photogrammetry, Light Detection And Ranging (LiDAR), and Interferometric Synthetic Aperture Radar (InSAR) technologies have emerged for surface deformation monitoring [12,13,14,15,16,17]. InSAR technology possesses numerous advantages, including all-weather capability, high-precision measurements, cost-effectiveness, and wide monitoring coverage. Consequently, it has gained extensive utilization in the field of surface subsidence monitoring [18,19,20,21,22]. Liya Zhang et al. [23,24,25] employed Differential Interferometric Synthetic Aperture Radar (D-InSAR) technology to monitor surface subsidence in mining areas and investigated the spatiotemporal dynamic characteristics of subsidence. They concluded that underground mining aligns with the directional surface deformation and exerts a persistent and continuous impact on surface deformation. Xu et al. [26,27,28,29,30,31,32,33] utilized D-InSAR, GNSS, and UAV technology to monitor surface subsidence in gypsum mines while they analyzed the stability of mined-out areas and evaluated the subsidence risk within mining regions. The study by Wang HN et al. [15,34,35,36] discovered that Persistent Scatterer Interferometric Synthetic Aperture Radar (PS-InSAR) and Small Baseline Subset Interferometric Synthetic Aperture Radar (SBAS-InSAR) technologies exhibit distinct advantages over D-InSAR technology in terms of long time-series analysis, atmospheric loss correlation, and monitoring accuracy. Kim TTH et al. [37,38] applied PS-InSAR technology to monitor mining areas came to a conclusion that there was significant damage to the surface along with a linear decreasing trend in surface deformation. Anil J., Xia YP., Przylucka M., et al. [20,39,40,41,42,43,44,45,46], employed a combination of PS-InSAR technology and complementary monitoring techniques, including D-InSAR, Global Positioning System (GPS), and Ground-Penetrating Radar (GPR) (ground penetrating radar), including optical remote sensing for urban areas, and the mining region’s surface subsidence monitoring resulted in significant research findings.
Underground mining activities will affect the safety of the surface and goaf. To this end, Cacciuttolo and Qi CC et al. [47,48] used tailings to fill underground goaf to improve the sustainability of mining; Huang, S.J. et al. [49] used grouting materials to reinforce pillars to improve the bearing capacity of pillars and the stability of roadway surrounding rock and monitor the deformation of roadway; and Ning, S. et al. [50] proved through a variety of tests that the combination of tailings backfilling and reinforcing pillars is feasible for the treatment of goaf. The selection of goaf treatment methods in underground metal mines primarily depends on their stable state. Different factors influence the settlement behavior of different treatment methods on the surface area above these goaves. Therefore, taking the Taibao lead-zinc mine’s goaf as a case study object, PS-InSAR technology was employed to monitor surface settlement resulting from closure-, partial-, and full-filling treatments, respectively. The characteristics and patterns of surface movement were analyzed, while time-series analysis was conducted to investigate changes in surface settlement over time. Understanding the settlement behavior before and after treating a goaf enhances treatment effectiveness and provides a basis for stability analysis and further treatments related to these areas. Furthermore, it offers valuable insights into monitoring regional building deformations and suggestions for their protection.

2. Materials and Methods

2.1. Materials

The Taibao lead-zinc mining area is in Shilong Town, Guiping City, Guigang City, Guangxi Zhuang Autonomous Region. The terrain of the mining area is gentle, with ground elevations ranging from 39.8 m to 42.5 m. The stratum distribution is relatively uncomplicated. The surface is covered by a quaternary soil layer measuring approximately 1 to 2 m in thickness. Surrounding the mining area are agricultural lands and scattered residential areas. Figure 1 illustrates the geographical location and geomorphic characteristics of the mining area. Within this mining area, the ore body primarily occurs in dolomite formations that constitute the goaf’s roof and floor. Since 2015, comprehensive mining methods have been employed to extract ore bodies while leaving irregular pillars for goaf support. This study focuses on three goaves: goaf No. 2 is located between depths of 42 m and 57 m below the surface, and the pillar height is 7.2 m~8.5 m; goaf No. 3 is distributed at depths ranging from 11 m to 33 m below the surface, and the pillar height is 5.7 m~13.2 m; and goaf No. 6 is found beneath depths of 22 m~35 m below the surface, and the pillar height is 5.1 m~11.6 m. The pertinent information regarding goaf is depicted in Figure 1, The goaf sectional view can be found in Section 3 Results and Analysis. In rder to ensure subsequent mining safety, in September 2017 the Taibao Company commissioned Changsha Mining Research Institute to analyze the goaf stability using theoretical formulas and numerical simulations [51]. The analysis revealed that the No. 3 and No. 6 goaves exhibited the poorest stability conditions: goaf No. 3 had four unstable pillars and an entirely unstable roof, while goaf No. 6 had a stable roof, but nearly half of its pillars were unstable; on the other hand, goaf No. 2 had a generally stable roof with only a few unstable pillars. Based on these findings, the Taibao Company designed two treatment schemes in January 2018, considering the instability of each goaf, conducted further numerical simulation analyses, and ultimately selected a cost-effective and superior treatment scheme as depicted in Figure 1: complete filling of waste rock mortar for goaf No. 3; partial filling and reinforcement of pillars for goaf No. 6; and closure and isolation measures for goaf No. 2, respectively. The implementation of the goaf treatment project was completed by March 2019.
The PS-InSAR monitoring area is the Taibao mining area, with geographical coordinates of 109°50′30″~109°51′15″ east longitude and 23°16′00″~23°16′45″ north latitude. The data utilized in this study consisted of Sentinel-1A radar data images with descending VV polarization obtained from the European Space Agency (ESA). The image acquisition timeline was as follows:
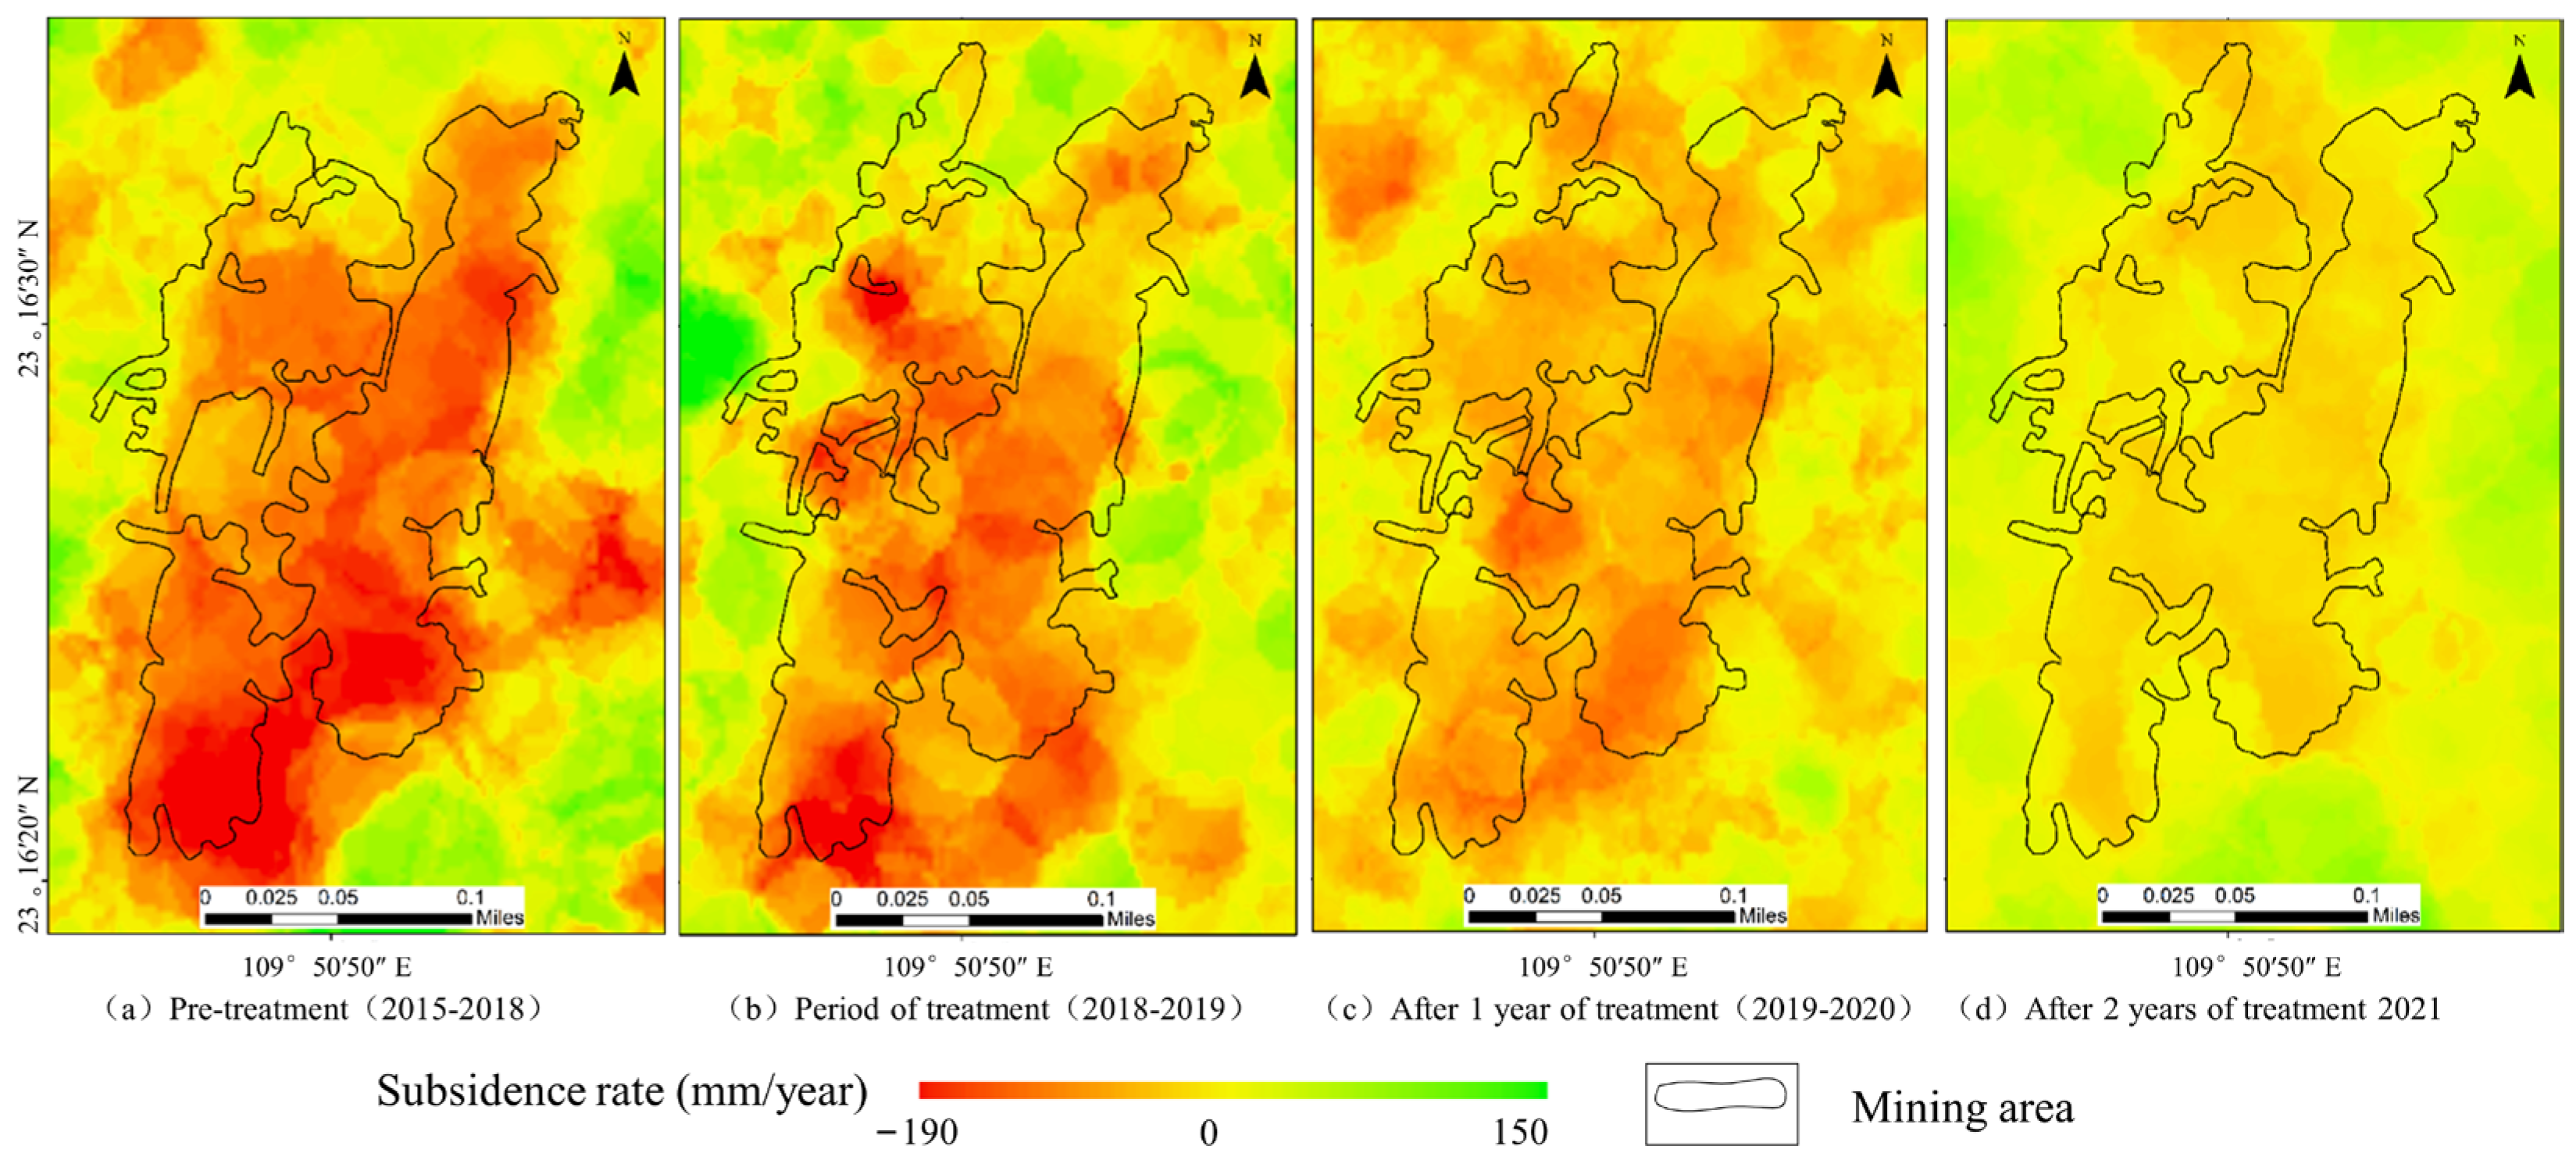
  • 21 images prior to goaf treatment (June 2015–January 2018);
  • 15 images during goaf treatment (January 2018–March 2019);
  • 13 images within the first year after goaf treatment (March 2019–March 2020);
  • 13 images within the second year after goaf treatment (March 2020–March 2021).
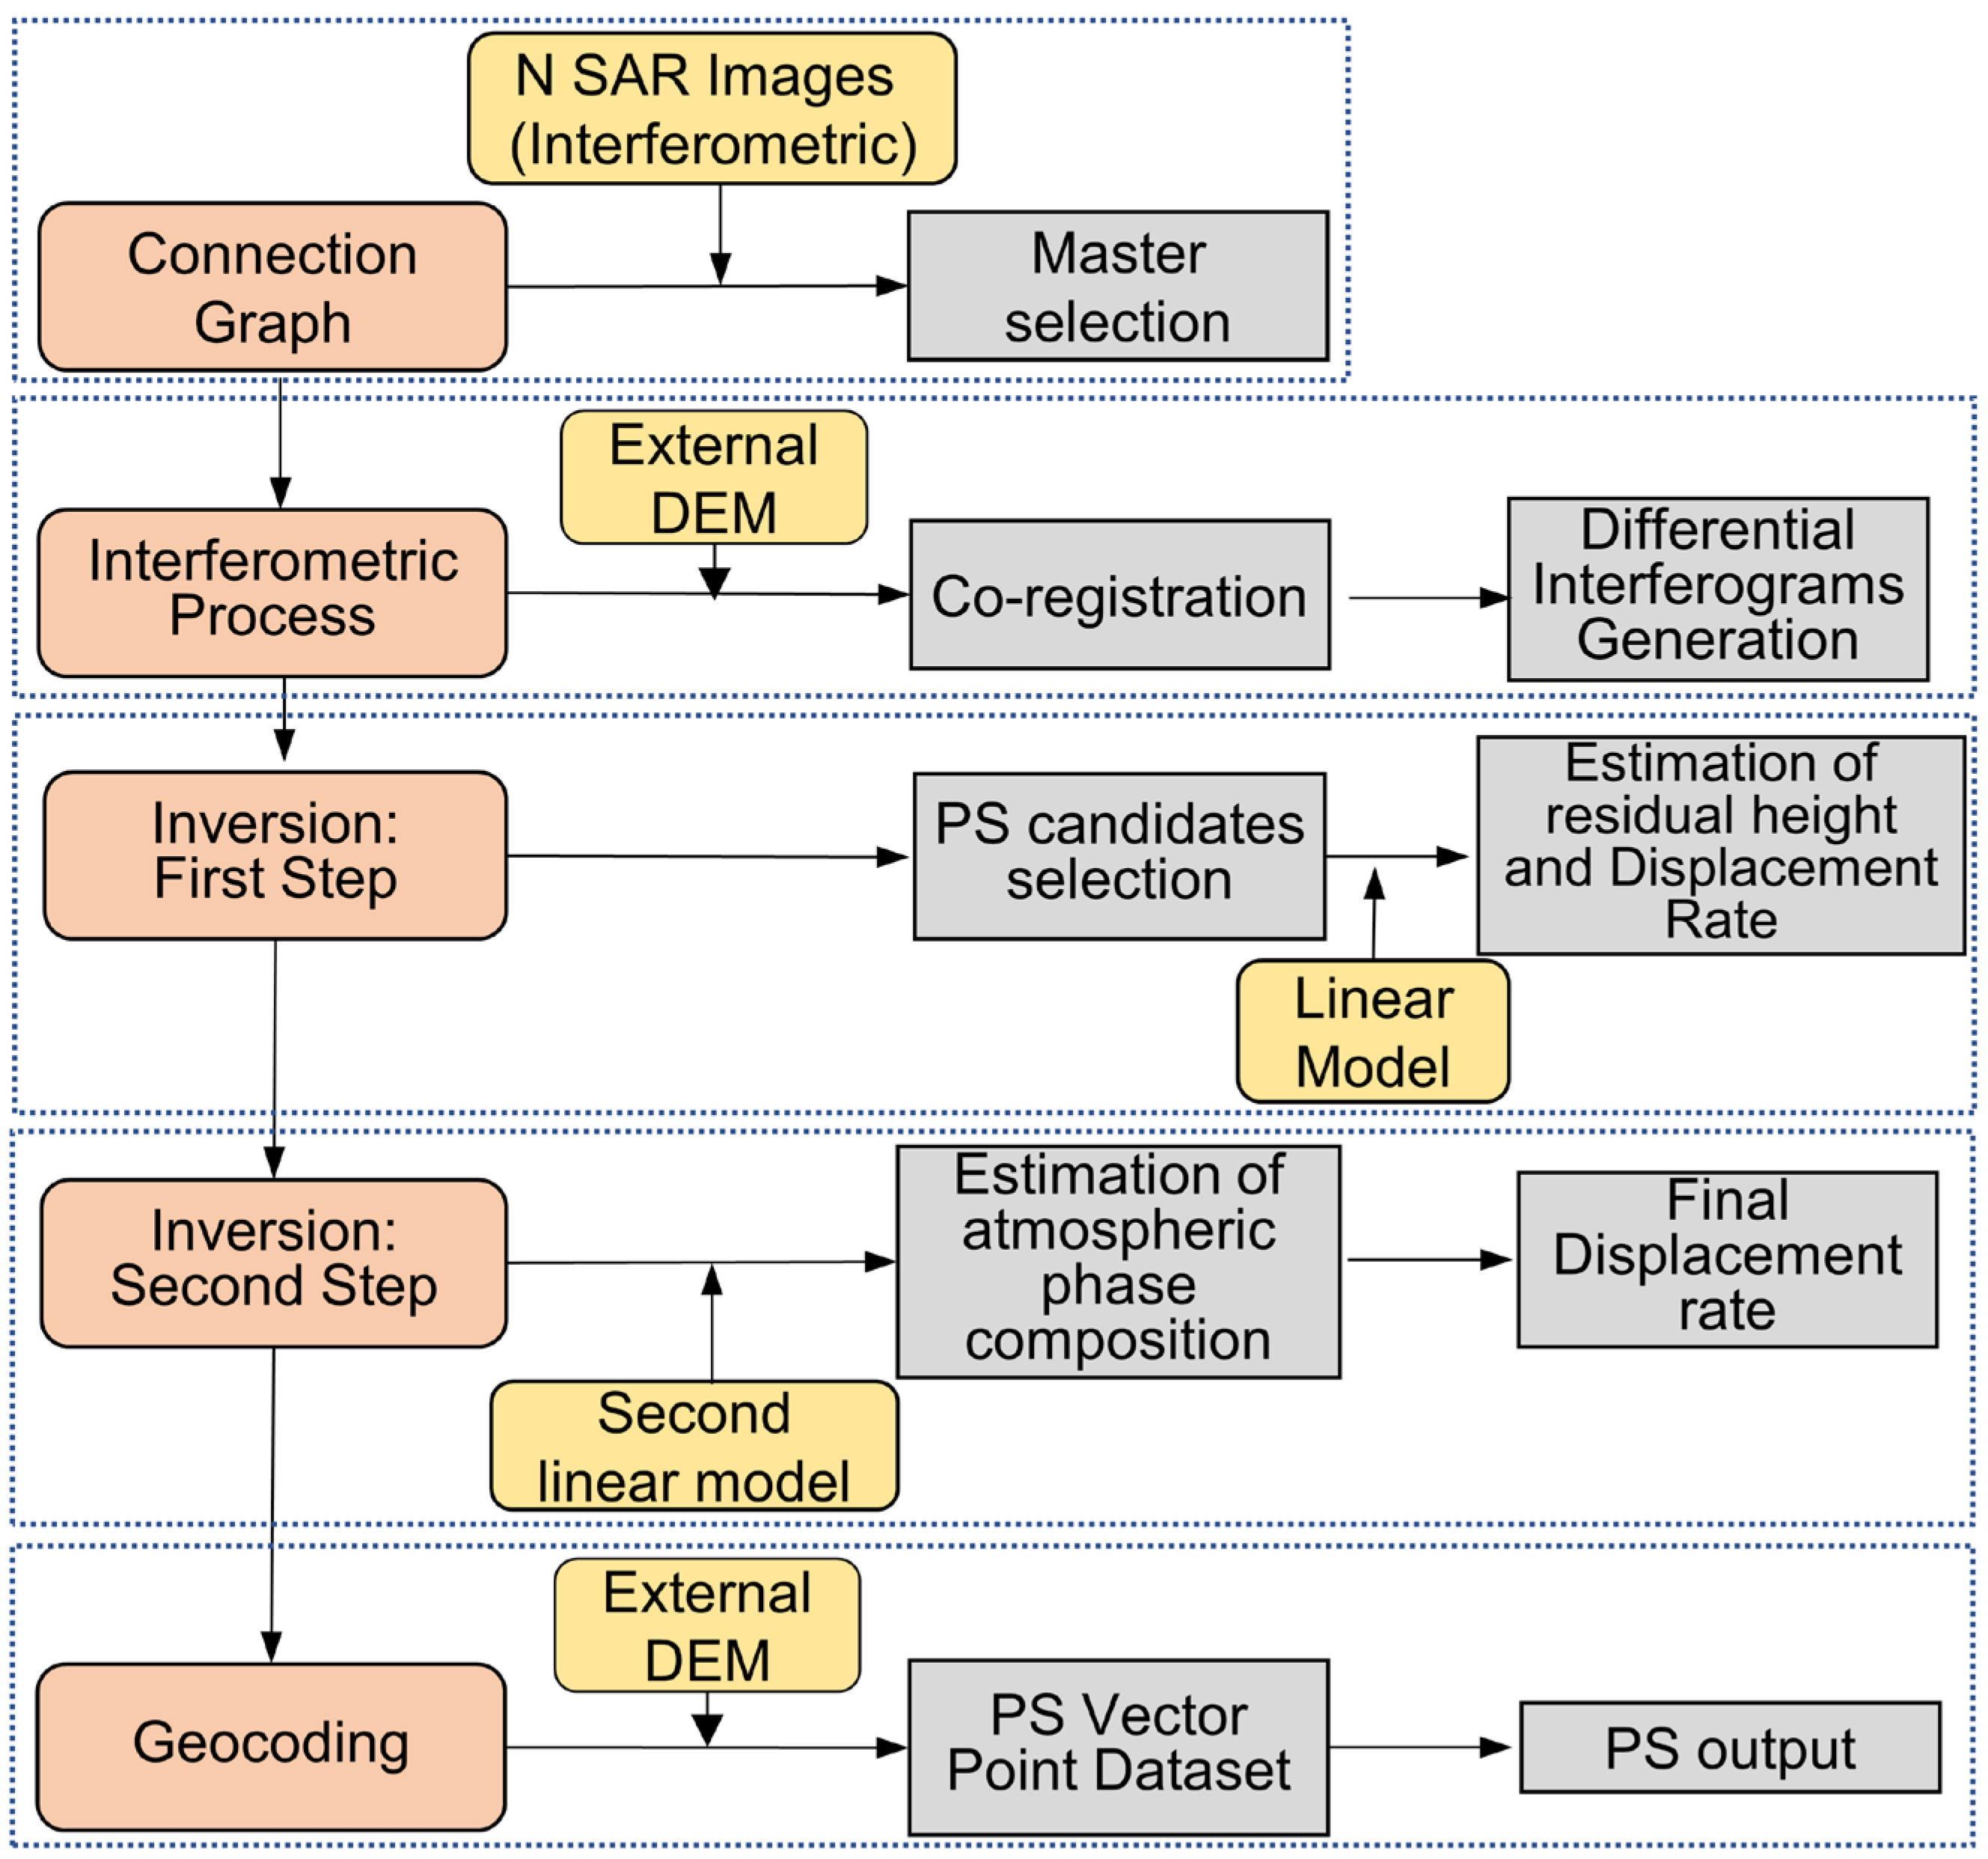
To ensure monitoring accuracy, precision orbit information for the same period and NASA STRM1_V3 DEM data with a resolution of 30 m were simultaneously employed to rectify terrain residuals. Appendix A Table A1 provides details on the image acquisition timeline.

2.2. Methods

Although PS-InSAR technology has the drawbacks of intricate data processing and the requirement for a substantial amount of data, it not only addresses the issues associated with lengthy monitoring cycles, slow speed, susceptibility to natural weather conditions, and limited monitoring range encountered by traditional technology but also offers superior advantages in terms of monitoring accuracy and sensitivity compared to InSAR. Prior to PS-InSAR data processing, the image data had to be imported and trimmed using ENVI5.6+ SARScape5.6 software. This technology leverages the interaction between electromagnetic waves emitted by spaceborne radar and stable scattering targets such as buildings and bare rocks [39,52], ensuring both temporal and spatial stability. By minimizing noise and incoherence effects, PS-InSAR technology effectively addresses challenges associated with lengthy monitoring cycles, slow operational speeds, susceptibility to natural weather conditions, and limited monitoring range inherent in traditional methods.
The fundamental principle of this technique involves acquiring N interference images from N captured images within the research area, followed by obtaining corresponding differential interference images through DEM difference processing. The phase value of the (N–1)th interferogram element is Δ φ = 4 π λ R n , while the post-difference phase can be expressed as:
φ n = 4 π λ R n · sin θ B n δ H + 4 π · cos θ λ h + φ A n + ξ n
In the equation, R n is the sensor-to-ground target slant distance; θ is the radar incidence angle; λ is the radar wavelength; B n is the effective spatial baseline; δ H is the elevation correction value; h is the surface deposition; φ A n is the atmospheric phase; and ξ n is the noise phase.
To mitigate atmospheric phase impact, a spatial differentiation can be applied to the interference phases of adjacent Persistent Scatterer (PS) points resulting in distinct phases for PS points I and j denoted as:
{ φ n i = a i B n δ H i + b i t n v + φ n r e s i φ n j = a i B n δ H j + b j t n v + φ n r e s j
Differencing the two equations again gives the PS point phase differential equation:
Δ φ n = a B n Δ δ H + b 1 t n v + Δ φ n r e s
Accurate estimation of the difference between subsidence velocity Δ ν and elevation correction value Δ δ H for two adjacent PS points, along with φ n r e s < π , enables determination of complete phase difference value Δ φ n between these points. The gradient φ n is represented by Δ φ n . Given knowledge of the complete gradient value, unwinding φ n allows for determination of surface deformation. Figure 2 presents a flow chart illustrating the PS-InSAR technology.

3. Results and Analysis

3.1. Verification of PS-InSAR Monitoring Results Accuracy

The quality and quantity of PS-InSAR PS points depend on the selection of the PS point output threshold. The PS point threshold demonstrates a positive correlation with monitoring coherence and accuracy while exhibiting a negative correlation with the number of PS points. Therefore, to ensure optimal quality and quantity of PS points, the following thresholds have been established: 0.65 for 2015–2018, 0.75 for both 2018–2019 and 2019–2020, and 0.80 for 2020–2021. Figure 3 depicts the distribution of PS output results along with their corresponding PS points.
For the purpose of ensuring the accuracy of monitoring results, numerous scholars [12,27,30,44,45,53,54,55,56,57] have conducted comparisons between monitoring results and leveling measurement values, GPS, GNSS, D-InSAR, and SBAS-InSAR monitoring values, to validate their precision. If the disparities between these two sets of results are minimal and essentially consistent, it can be inferred that the monitoring is feasible. In order to guarantee the accuracy and reliability of monitoring outcomes, a comparison is made between mine-leveling data and PS-point monitoring values to verify their monitoring accuracy. Based on the acquisition time of radar data images, 16 sets of mine-leveling monitoring data from March 2019 to March 2020 are collected as presented in Appendix A.
Table A2 is attached herewith. The average value of adjacent PS points is selected for comparison based on location information pertaining to each leveling point. The resulting error value after comparison is illustrated in Figure 4.

3.2. Determining the Settlement Impact Area According to the PS Point

The PS vector points derived from PS-InSAR offer valuable subsidence information within the study area, effectively delineating the regions affected by mining activities. To assess the extent of surface deformation induced by underground mining, we employ the Kriging method for interpolating the vector point dataset and generating pre- and post-treatment surface subsidence images of goaf areas [46,58], as depicted in Figure 5.

3.3. Results

Based on Sentinel-1 data covering 62 scenes in four periods, along with corresponding accurate orbit and DEM data, the PS-InSAR subsidence monitoring was conducted at the Taibao lead-zinc mine. The obtained time-series subsidence information of the vector points was compared with the mine-level monitoring data to validate the feasibility of PS-InSAR monitoring. The Kriging interpolation method was employed to analyze the vector point data, resulting in surface subsidence images before and after implementing different goaf treatment methods (Figure 5). During the untreated period from 2015 to 2018, goaves No. 3 and No. 6 exhibited rapid and relatively concentrated trends in surface subsidence rates, reaching a maximum value of approximately 160 mm/year (Figure 5a). Only goaf No. 2 demonstrated a comparatively slower rate of subsidence. After implementing various treatment methods on the goaves from 2018 to 2019, significant deceleration in surface subsidence rates along with a gradual reduction in prominent subsidence areas was observed (Figure 5b), with the maximum recorded-subs residence rate reaching around 100 mm/year. Figure 5c,d depicts that surface subsidence gradually ceased following two years of treatment from 2020 to 2021, with a remaining rate below 20 mm/year, effectively controlling it.
To investigate the behavior of overburdened rock and surface movement in goaf with different treatment methods, we selected subsidence curves at various time intervals to analyze pre- and post-treatment characteristics (Figure 6). The subsidence points on these curves were utilized for analyzing surface subsidence patterns before and after implementing diverse treatment methods. Subsequently, multiple PS monitoring points were chosen based on corresponding positions along the surface, and their average values were calculated to obtain time-subsidence curves for surface monitoring points. Finally, temporal trends in surface subsidence were analyzed.

3.4. Analysis of Surface Settlement before Different Treatment Methods in Goaves

The surface subsidence curve depicted in Figure 6a illustrates that prior to the treatment of goaf No. 3 (2015–2018), it exhibited a concave shape, with accelerated subsidence rates observed at both ends in comparison to the middle, resulting in two distinct subsidence basins. Specifically, the recorded surface subsidence rates for A1, A2, A3, and A4 were as follows: 144.58 mm/year for A1; 85.33 mm/year for A2; 136.12 mm/year for A3; and 159.06 mm/year for A4. Upon comparison, it becomes evident that the subsidence rate of A1 is approximately 36% higher than that of A2. Under conditions characterized by an unstable roof but stable pillars, the surface subsidence rate increases proportionally with mining depth while prominent subsidence basins manifest in areas with greater depths of excavation. In addition, A4 exhibits a 17% faster subsidence rate than A3 due to a more significant presence of unstable pillars, leading to more concentrated surface subsidence rates and distinct subsidence basins centered around these unstable pillars. The presence of stable pillars interspersed among the unstable ones will effectively mitigate surface subsidence. However, if the spacing between these pillars is insufficient and their quantity is limited, the mitigation effect may not be significant, resulting in the formation of a substantial subsidence basin.
The surface subsidence curve prior to the treatment of goaf No. 6 (2015–2018) exhibited an obliquely serrated pattern, characterized by four distinct subsidence basins, as depicted in Figure 6c. The corresponding subsidence rates for B1, B2, A3, B4, and B5 on the surface subsidence curve were recorded as 85.92 mm/year, 95.40 mm/year, 119.22 mm/year, 85.76 mm/year, and 144.79 mm/year, respectively. Through comparative analysis, it was observed that the subsidence rate of B2 exceeded that of B1 by approximately 17%, indicating a correlation between surface subsidence and pillar width–height ratio, specifically implying that a smaller width–height ratio resulted in higher surface subsidence rates. The subsidence rate of B3 and B5 demonstrates a 51.6% increase compared to that of B1 and B2, indicating a positive correlation between the surface subsidence rate and the stope span. A larger stope span leads to an accelerated surface subsidence rate, while a smaller stope span results in reduced subsidence. Notably, the subsidence rate exhibits a decrease between B1 and B2, B2 and B3, and B3 and B5 due to the presence of stable pillars amidst unstable ones, effectively exerting control over local surface subsidence. Moreover, an augmented number of stable pillars leads to a more pronounced deceleration in the surface subsidence rate.
The analysis of Figure 6e reveals that the pre-treatment surface subsidence trend in goaf No. 2 exhibits a central region characterized by rapid subsidence rates, gradually decreasing toward both sides, resulting in a concave-shaped curve. Specifically, the measured surface subsidence rates at C1, C2, and C3 are 78.84 mm/year, 85.02 mm/year, and 89.28 mm/year, respectively, on the subsidence curve. A comparison between the positions of C1 and C2 indicates that as one moves farther away from the unstable pillar, there is a corresponding decrease in the rate of surface subsidence observed. Notably, among all analyzed points, C3 demonstrates the highest subsidence rate, thus suggesting that when only a single pillar experiences instability while maintaining stability within the goaf area’s roof structure, overall subsidence remains relatively minor with its center located around unstable pillars.

3.5. Analysis of Surface Subsidence during Different Treatment Methods of Goaf

According to the stable state of the goaf above, targeted treatment was implemented in the three goaves between 2018 and 2019. As depicted in Figure 6, distinct characteristics are exhibited by the surface settlement curves of the goaves with different treatment methods.
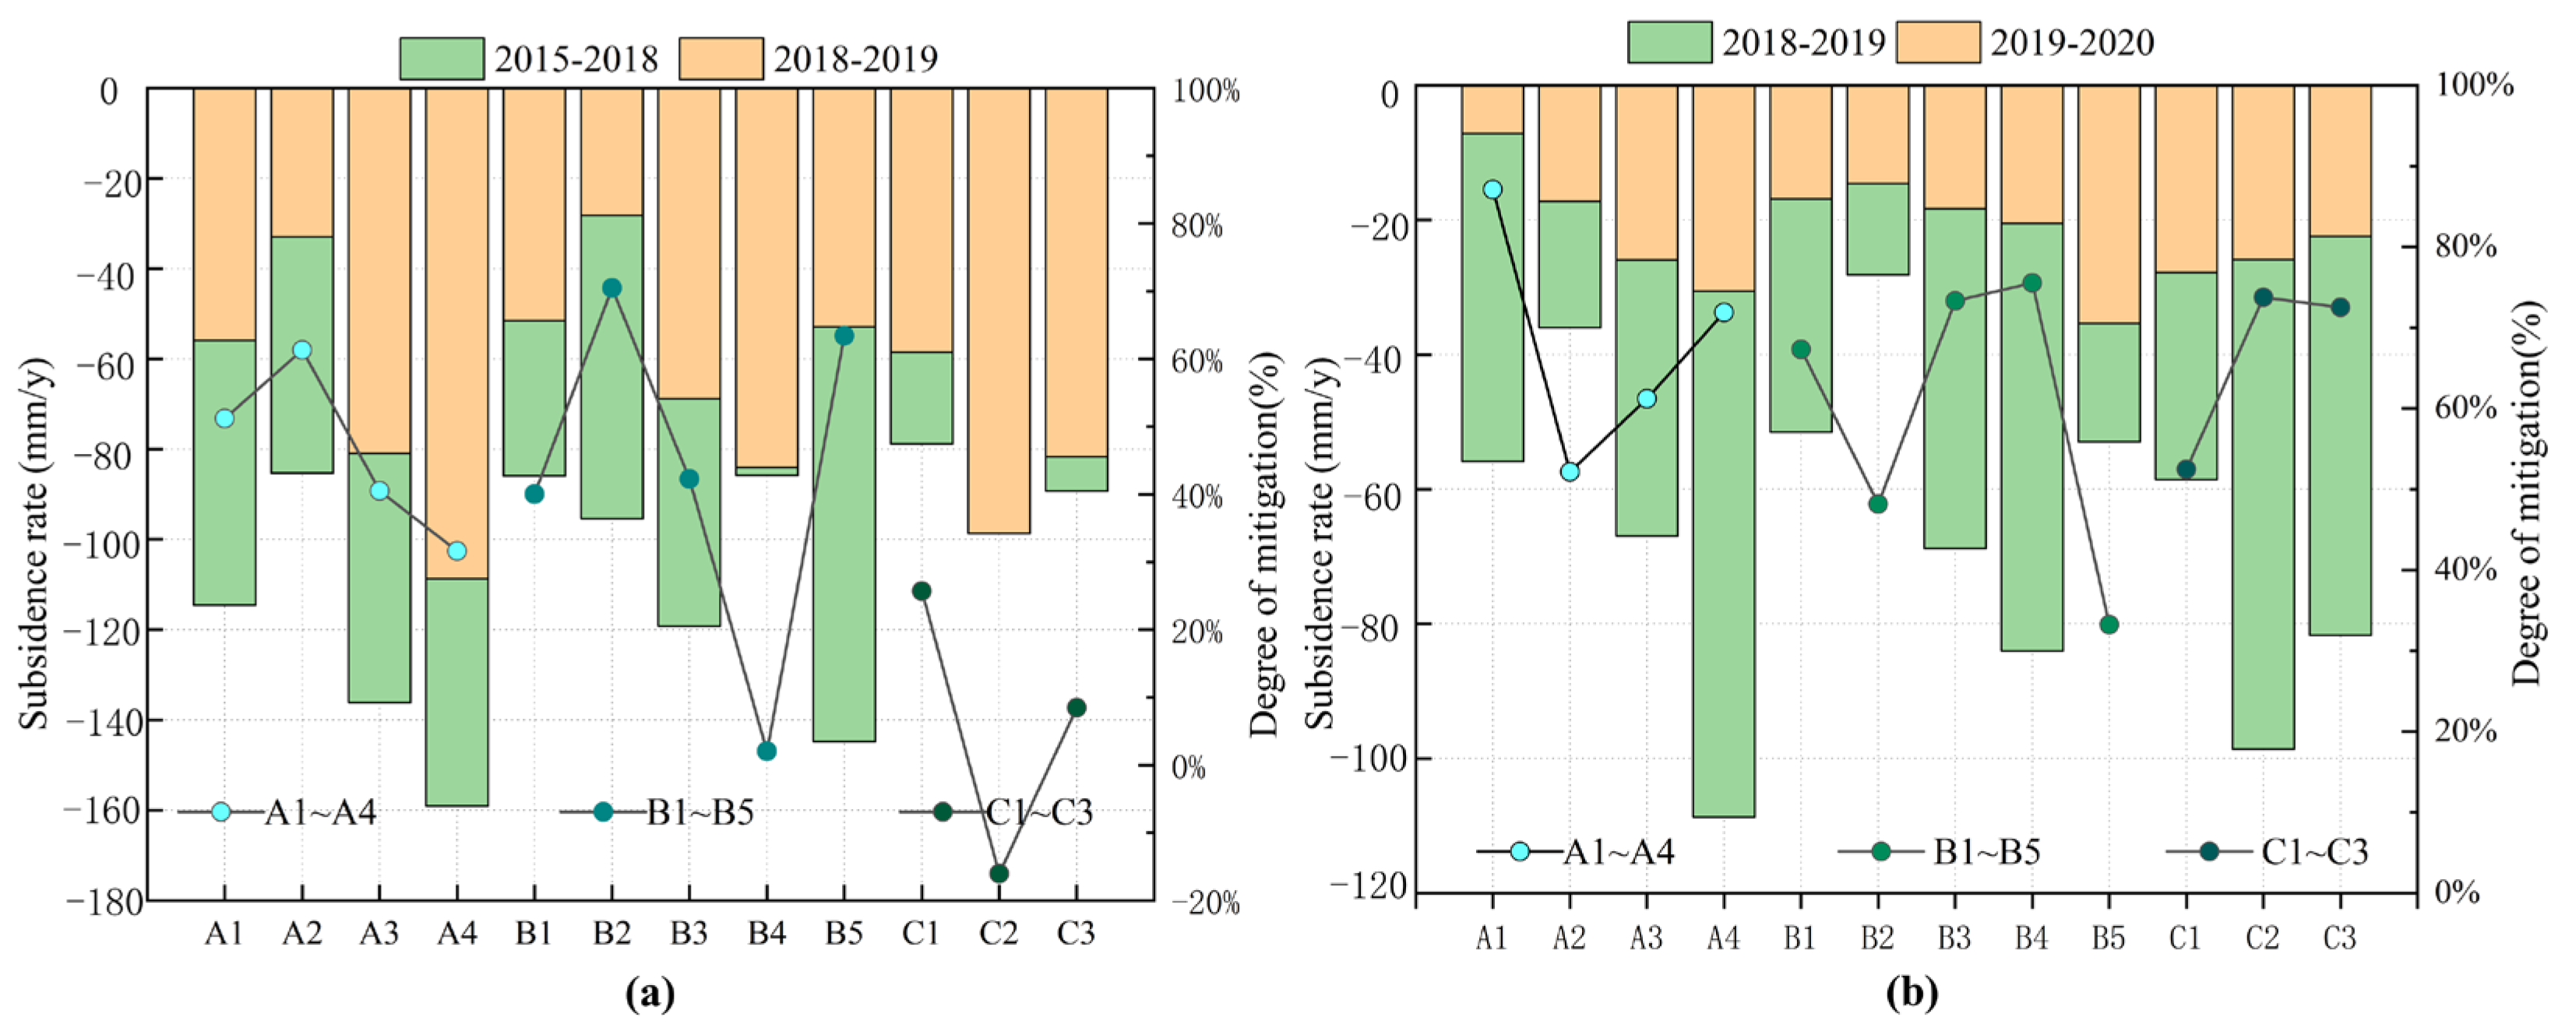
  • As shown in Figure 6a, specifically, the settlement curve trend of the goaf subjected to full-filling treatment is nearly identical to that prior to treatment. The settlement rates for A1, A2, A3, and A4 are recorded as 55 mm/year, 33.00 mm/year, 80.96 mm/year, and 108 mm/year, respectively. It can be observed from Figure 7a that these values represent decreases of approximately 51.2%, 61.3%, 40.52%, and 31.63% compared to their untreated counterparts. By comparing A1 and A2, it can be observed that mining depth plays a significant role, resulting in a limited degree of mitigation. Moreover, when comparing A3 and A4, it becomes evident that the presence of more unstable pillars leads to a decreased level of mitigation. Additionally, as depicted in the figure, the combination of shallow mining depth and challenges in roof filling contributes to a reduced degree of mitigation. This suggests that during complete goaf filling and treatment, the pillars primarily bear the overburden load; consequently, at greater mining depths with unstable pillars present, there is accelerated movement within the overburden rock layer [59].
  • As shown in Figure 6c, the surface subsidence trend of the goaf undergoes significant changes after local filling and reinforced pillar treatment, compared to before the treatment. The subsidence rates of B1, B2, B3, B4, and B5 are 51.53 mm/year, 28.18 mm/year, 68.81 mm/year, 84.02 mm/year, and 52.95 mm/year, respectively. As illustrated in Figure 7a, these values demonstrate reductions of 40.02%, 70.46%, 42.29%, 2.04%, and 63.43%, respectively, when compared to pre-treatment levels. Through comparison analysis, it can be observed that the degree of surface subsidence control is ranked as follows: locally filled areas (B2, B5) exhibit superior performance compared to reinforced pillars (B1, B3), while unfilled and reinforced areas (B4) show less effectiveness; this indicates that the unstable region in the filled part plays a significant role in controlling surface subsidence. In goaf with smaller spans, the movement of the overlying rock layer tends to cease; however, larger subsidence continues in unfilled and reinforced areas. These findings suggest that during treatment involving locally filled and reinforced pillars in goaf, the overlying rock layer behaves similarly to a cantilever beam, resulting in an “inverted trapezoidal” pattern of surface subsidence. Faster movement occurs within unfilled and reinforced areas.
  • As shown in Figure 6e, the surface subsidence of the closed goaf still exhibits significant settlement, forming a concave curve with a subsidence trend similar to before. The subsidence rates of C1, C2, and C3 are 58.56 mm/year, 98.63 mm/year, and 81.76 mm/year, respectively. As illustrated in Figure 7a, compared to pre-treatment values, the subsidence rates of C1 and C3 decreased by 25.73% and 8.46%, respectively; however, the subsidence rate of C2 increased by 16.02%. This indicates that the center of the subsidence basin has shifted toward adjacent stable pillars due to their ability to bear the load of overlying rock layers [59]. In contrast, unstable pillars exhibit weaker support capacity, resulting in an increased load on neighboring pillars and, subsequently, higher subsidence rates.

3.6. Analysis of Surface Subsidence Completed by Different Methods of Goaf Treatment

The surface subsidence exhibited a significant reduction in the first year subsequent to the completion of goaf treatment, leading to substantial modification of the surface subsidence curve compared to its pre-treatment state.
  • As shown in Figure 6a, specifically, the surface subsidence curve of the fully filled goaf exhibits a bowl-shaped profile with wide edges and a slightly curved bottom. The subsidence rates at A1, A2, A3, and A4 are 7.20 mm/year, 17.22 mm/year, 25.97 mm/year, and 30.56 mm/year, respectively. As depicted in Figure 7b, these values are lower than their respective pre-mining levels by 87.12%, 52.16%, 61.21%, and 71.89%. By comparing A1 and A2 with A3 and A4, it can be observed that the surface subsidence in the stable pillar area remains below 20 mm per year. In contrast, in the unstable pillar area, it still exceeds 20 mm per year. This indicates a gradual transfer of load from the pillars to both the backfill body and the pillars themselves. However, in the unstable pillar area, most of the load is borne by the compressed backfill body, resulting in a prolonged duration of movement for the overlying rock layer compared to that in the stable pillar area.
  • As shown in Figure 6b, the surface subsidence curve of the first year of local filling and reinforcement treatment in the goaf exhibits a wave-shaped pattern characterized by two smaller subsidence basins. The subsidence rates for B1, B2, B3, B4, and B5 are 16.85 mm/year, 14.60 mm/year, 18.36 mm/year, 20.54 mm/year, and 35.35 mm/year, respectively. As illustrated in Figure 7b, compared to the treatment period, there was a reduction in the surface subsidence rate by 67.3%, 48.17%, 73.55%, 75.55%, and 33.24%, respectively. Upon comparative analysis, it is evident that the surface subsidence rate for unfilled and reinforced pillar treatment remains below the threshold of 20 mm/year; however, within the filling treatment area, it still exceeds this limit. The local filling treatment area (B2 and B5) demonstrates lower surface subsidence rates when compared to unfilled (B4) and reinforced pillar treatments (B1 and B3).
  • As shown in Figure 6c, the surface subsidence curve of the goaf in the first year of closed treatment exhibited a gradual decline, with subsidence rates of C1, C2, and C3 measuring 27.84 mm/year, 25.88 mm/year, and 22.56 mm/year, respectively. As illustrated in Figure 7b, these values have been reduced by 52.46%, 73.76%, and 72.51%, correspondingly. Upon comparison, it is evident that while experiencing a relatively smaller degree of reduction, the subsidence value of C1 surpasses that of C2 and C3. The subsidence rate at both ends of the goaf is observed to be higher compared to that observed at the position of the unstable pillar, indicating a transfer of movement within the overlying rock layer from the unstable pillar toward both ends of the goaf subsequent to its closure and treatment. As a result, surface subsidence continues to exceed 20 mm/year.
The figure demonstrates that after a two-year goaf treatment, the surface subsidence curves of the three goaves exhibit a relatively gradual trend, with all surface subsidence rates measuring below 20 mm/year. This observation suggests a cessation in the movement of the overlying rock strata and effective control over surface subsidence.

4. Discussion

PS-InSAR technology was employed in this study to monitor the subsidence of the underground goaf in the Taibao lead-zinc mine, enabling acquisition of surface subsidence data for the mining area. Based on the findings, comprehensive analysis and discussion were conducted regarding the mechanism, laws, and influencing factors associated with goaf-induced surface subsidence.
From the perspective of spatio-temporal distribution characteristics, surface subsidence exhibits a gradual accumulation with the continuous expansion of goaf. Initially, the subsidence rate is rapid, and it subsequently stabilizes over time. This observation aligns with geomechanics theory and corroborates existing research findings, further validating the accuracy and reliability of monitoring methods [60,61,62,63]. An in-depth analysis of surface subsidence mechanisms reveals that factors such as goaf span, stability of roof and pillars, and mining depth significantly influence subsidence patterns. Notably, the stable state of the roof and pillars in goaf exerts a particularly prominent impact on subsidence; variations in their stability lead to discernible differences in both distribution and rate of surface subsidence. Additionally, stope span and mining depth play crucial roles in surface subsidence dynamics; larger mining spans exacerbate surface subsidence when unstable pillars are present.
According to the surface subsidence law of different goaf treatment methods, the subsidence of an unstable pillar surface plays a decisive role in a closed goaf. Achieving secondary stress balance in the rock mass solely through pillar support requires more time. In a partially filled goaf, most pillars are stable while the filling body reinforces the unstable ones, resulting in obvious deceleration of surface subsidence. However, the stable pillars remain unreinforced and thus experience slower subsidence. As the filling body gradually compacts, surface subsidence gradually becomes gentler. For the goaf with full-filling treatment, a significant portion of the roof and pillars exhibit instability. Before compacting the filling material, considerable settlement was observed on the surface of these unstable pillars and roof structures. However, once the filling material is compacted, controlled subsidence occurs on the surface and gradually ceases.
Although this study has yielded certain results, there are still some limitations. By conducting a comparative analysis with previous studies, we have substantiated the universality and severity of the surface subsidence phenomenon and comprehensively examined various influencing factors to further elucidate its intricate mechanism. However, based on the monitoring data from the second year after completion of treatment, it is evident that certain areas exhibit slight elevation, which deviates from the anticipated movement pattern of overlying rock layers in surface subsidence. In reality, minor settlement exists, indicating that human activities significantly impact the overlying rock layers and surface movements. Therefore, in future endeavors, we will persistently enhance our monitoring efforts to improve data quality and furnish a scientific foundation for more effective prevention and mitigation strategies against surface subsidence problems.

5. Conclusions

The surface subsidence of the Taibao lead-zinc mine was monitored utilizing Sentinel-1A imagery and PS-InSAR technology while analyzing the movement of overlying rock strata and surface before and after implementing various treatment methods in the goaf. The obtained results indicate that:
Reserved pillars fully support the roof of the closed goaf. The surface subsidence negatively correlates with pillar stability and is highly susceptible to mining disturbances. The secondary equilibrium of rock mass stress requires a longer duration, resulting in extended surface subsidence cessation;
The pillars play a crucial role in providing initial support to the roof during local goaf filling treatment, and there exists a negative correlation between surface subsidence and stope span. The control of surface subsidence becomes more pronounced when the pillars are less stable and cover larger areas. As the filling materials near the pillars compact, surface subsidence gradually diminishes. In unfilled areas, the rate of surface subsidence remains relatively constant during the initial stage of treatment but gradually slows down until it ceases completely in later stages;
The initial roof and pillar of the goaf are the key factors in controlling surface settlement, and surface settlement is positively correlated with an unstable roof, unstable pillars, and mining depth; after the filler is compacted, the backfill controls the surface settlement, and surface settlement in an area with shallow mining depth and stable pillars tends to be stable at first, and the time needed for the surface settlement to stabilize gradually extends with increases in mining depth, unstable pillars, and the number of roofs.

Author Contributions

Conceptualization, H.L.; Investigation data analysis, X.H. and X.L.; Writing—original draft preparation, S.D. and Y.Y.; Writing—review and editing, H.D.; Visualization, W.X.; Supervision, X.H. and X.L. All authors have read and agreed to the published version of the manuscript.

Funding

This research received no external funding.

Institutional Review Board Statement

Not applicable.

Informed Consent Statement

Not applicable.

Data Availability Statement

The Sentinel-1 datasets can be acquired freely from Copernicus and ESA, https://search.asf.alaska.edu/#/ (accessed on 21 December 2022); optical imagery data can be obtained from Google Maps, http://www.gditu.net/ (accessed on 19 June 2020 and 11 December 2022); level monitoring data is obtained from Taibao.

Acknowledgments

The authors would like to thank Taibao for providing free monitoring data on the level of the mine; the authors would like to thank the Copernicus program for free access to the Sentinel-1 images processed in this analysis; the authors would also like to thank Google for providing free optical imagery data of the mine.

Conflicts of Interest

The authors declare no conflicts of interest.

Appendix A

Table A1. Characteristics of the satellite data used in the study.
Study Period IDDate of Acquisition (DD-MM-YYYY)Time Baseline (d)Normal Baseline (m)
2015–201825-06-2015−444−84.883
12-08-2015−39613.1727
29-09-2015−34833.8539
23-10-2015−32432.6516
03-01-2016−252−19.4715
26-05-2016−12015.6077
06-08-2016−108−34.0751
23-09-2016−60−66.3668
10-11-2016−48−20.1385
28-12-201600
09-01-20171249.7188
14-02-20174821.0417
15-04-2017108−66.7169
2015–201809-05-2017132−67.5277
14-06-201716810.0376
08-07-201719262.4211
13-08-2017228−54.623
18-09-2017252−12.1731
12-10-2017276−73.6862
17-11-201731244.9114
11-12-201733642.8753
04-01-2018360829572
2018–201904-01-2018−216−39.9495
09-02-2018−180−48.6742
05-03-2018−156108.632
10-04-2018−120−15.5787
04-05-2018−96−14.5066
09-06-2018−60−26.4119
03-07-2018−3633.5122
08-08-201800
13-09-2018369.61013
07-10-20186051.9931
12-11-201896−37.9488
06-12-201812019.531
11-01-2019156−11.1439
04-02-2019180−15.9356
12-03-2019216−32.5269
2019–202012-03-2019−264−18.1204
05-04-2019−240−30.4496
2019–202011-05-2019−20412.9326
16-06-2019−16879.8935
10-07-2019−14438.3496
03-08-2019−12056.122
08-09-2019−84−47.3905
02-10-2019−60−91.0679
07-11-2019−24−28.1256
01-12-201900
06-01-20203660.6799
23-02-20208434.1044
06-03-2020968.25188
2020–202106-03-2020−180−30.3446
11-04-2020−144−4634055
05-05-2020−1209.97058
10-06-2020−842.89.32
04-07-2020−6066.266
09-08-2020−24−66.2685
02-09-202000
08-10-202036−133.119
25-11-20208476.453
19-12-2020118−68.5192
12-01-202113246.562
17-02-202116822.8765
13-03-20211922.02861
Table A2. Rate of deformation and error values at each point.
Point IDLevel Point Deformation Rate (mm/year)PS Point Deformation Rate (mm/year)The Absolute Value of the Error (mm)
1J1−5.3−7.7532.453
1J23.73.7460.046
1J3−2.7−4.7292.029
2J1−5.7−5.8660.166
2J2−13.6−11.9471.653
2J3−3.9−5.8541.954
2J412.418.025.62
3J1−1.616.1117.71
3J2−2.46.1068.506
3J32.1−1.1273.227
3J4−3.3−2.0211.279
SJ1−49.2−43.0056.195
SJ2−28.6−26.5852.015
SJ3−7.5−5.8061.694
SJ4−9.6−9.6670.067
SJ5−28−25.3742.626

References

  1. Xia, K.; Chen, C.; Wang, T.; Yang, K.; Zhang, C. Investigation of Mining-Induced Fault Reactivation Associated with Sublevel Caving in Metal Mines. Rock Mech. Rock Eng. 2022, 55, 5953–5982. [Google Scholar] [CrossRef]
  2. Zhang, G.; Wang, Z.; Guo, G.; Wei, W.; Wang, F.; Zhong, L.; Gong, Y. Study on Regional Strata Movement during Deep Mining of Erdos Coal Field and Its Control. Int. J. Environ. Res. Public Health 2022, 19, 14902. [Google Scholar] [CrossRef]
  3. Liu, X.J.; Cheng, Z.B. Changes in subsidence-field surface movement in shallow-seam coal mining. J. S. Afr. Inst. Min. Metall. 2019, 119, 201–206. [Google Scholar] [CrossRef]
  4. Khanal, M.; Qu, Q.; Zhu, Y.; Xie, J.; Zhu, W.; Hou, T.; Song, S. Characterization of Overburden Deformation and Subsidence Behavior in a Kilometer Deep Longwall Mine. Minerals 2022, 12, 543. [Google Scholar] [CrossRef]
  5. Gang, C.; Qiong, W.; Ming, L.X. Prediction of Surface Subsidence Due to Mining. Integr. Ferroelectr. 2020, 209, 76–85. [Google Scholar] [CrossRef]
  6. Wang, Z.; Song, G.; Ding, K. Study on the Ground Movement in an Open-Pit Mine in the Case of Combined Surface and Underground Mining. Adv. Mater. Sci. Eng. 2020, 2020, 8728653. [Google Scholar] [CrossRef]
  7. Liu, X.-T.; Chen, C.-X.; Xia, K.-Z.; Zheng, X.-W.; Wang, T.-L.; Yuan, J.-H. Investigation of the time-dependent strata movement behaviour caused by caving method. Rock Soil Mech. 2023, 44, 563–576. [Google Scholar] [CrossRef]
  8. Sun, Y.; Zuo, J.; Karakus, M.; Liu, L.; Zhou, H.; Yu, M. A New Theoretical Method to Predict Strata Movement and Surface Subsidence due to Inclined Coal Seam Mining. Rock Mech. Rock Eng. 2021, 54, 2723–2740. [Google Scholar] [CrossRef]
  9. Zhang, C.; Fu, J.; Song, W.; Tan, Y.; Kang, M. Study on monitoring and variation law of strata movement induced by caving mining of slowly inclined large and thick orebody. Environ. Earth Sci. 2021, 80, 606. [Google Scholar] [CrossRef]
  10. Luan, Y.; Dong, Y.; Ma, Y.; Weng, L. Surface and New Building Deformation Analysis of Deep Well Strip Mining. Adv. Mater. Sci. Eng. 2020, 2020, 8727956. [Google Scholar] [CrossRef]
  11. Zhao, X.; Zhu, Q. Analysis of the surface subsidence induced by sublevel caving based on GPS monitoring and numerical simulation. Nat. Hazards 2020, 103, 3063–3083. [Google Scholar] [CrossRef]
  12. He, L.; Cai, J.; Cao, W.; Mao, Y.; Liu, H.; Guan, K.; Zhou, Y.; Wang, Y.; Kang, J.; Wang, X.; et al. Comparative Analysis of Theoretical, Observational, and Modeled Deformation of Ground Subsidence: The Case of the Alhada Pb-Zn Mine. Minerals 2022, 12, 977. [Google Scholar] [CrossRef]
  13. Popiolek, E.; Hejmanowski, R. Forecasting and monitoring of underground mineral seam exploitation influence. Gospod. Surowcami Miner. 2008, 24, 135–149. [Google Scholar]
  14. Shu, C.; Liu, M. Methods to monitoring land subsidence due to underground mining. In Proceedings of the International Conference on Mine Hazards Prevention and Control, Qingdao, China, 17 October 2007; pp. 693–698. [Google Scholar]
  15. Cai, Y.; Jin, Y.; Wang, Z.; Chen, T.; Wang, Y.; Kong, W.; Xiao, W.; Li, X.; Lian, X.; Hu, H. A review of monitoring, calculation, and simulation methods for ground subsidence induced by coal mining. Int. J. Coal Sci. Technol. 2023, 10, 32. [Google Scholar] [CrossRef]
  16. Li, Q.; Li, X.; Zhang, K.; Cao, Z.; Guo, J.; Yan, Y.; Zhang, C.; Xu, Z.; Zhao, Y. Rock strata mining damage monitoring and application based on space-sky-surface integrated technology. J. China Coal Soc. 2023, 48, 402–413. [Google Scholar]
  17. Zhang, C.; Zhao, Y.; He, X.; Guo, J.; Yan, Y. Space-sky-surface integrated monitoring system for overburden migration regularity in shallow-buried high-intensity mining. Bull. Eng. Geol. Environ. 2021, 80, 1403–1417. [Google Scholar] [CrossRef]
  18. Hou, J.; Yang, C.; Wang, Y.; Wang, H. Monitoring of subsidence induced by coal mining: A research based on differential SAR interferometry. J. Nat. Disasters 2009, 18, 71–75. [Google Scholar]
  19. Yang, Z.; Yi, H.; Zhu, J.; Li, Z.; Su, J.; Liu, Q. Spatio-temporal evolution law analysis of whole mining subsidence basin based on InSAR-derived time-series deformation. Chin. J. Nonferrous Met. 2016, 26, 1515–1522. [Google Scholar]
  20. Colombo, D. Surface Displacement Monitoring—Using Satellite Insar for Mining Operations. In Proceedings of the 24th International Mining Congress of Turkey, Antalya, Turkey, 14–17 April 2015; pp. 829–838. [Google Scholar]
  21. Yan, J.; Ding, J.; Feng, Y.; Xu, Y. Using InSAR to monitor mining surface subsidence. In Proceedings of the 3rd International Symposium on Modern Mining and Safety Technology, Liaoning Tech Univ, Fuxin, China, 4–6 August 2008; pp. 686–688. [Google Scholar]
  22. Hearn, G.J.; Duncumb, R.W. Using stereo aerial photography and satellite InSAR to help assess slope hazards for a hydropower project in mountainous southern Albania. Q. J. Eng. Geol. Hydrogeol. 2018, 51, 265–275. [Google Scholar] [CrossRef]
  23. Liu, H.; Chen, S.; Zhu, X.; Zhang, P.; Wang, J.; Wang, Q.; Si, G. Research on dynamic subsidence characteristics of coal mine industrial square based on D-In-SAR technology. Coal Geol. Explor. 2023, 51, 99–112. [Google Scholar]
  24. Ma, S.; Qiu, H.; Yang, D.; Wang, J.; Zhu, Y.; Tang, B.; Sun, K.; Cao, M. Surface multi-hazard effect of underground coal mining. Landslides 2023, 20, 39–52. [Google Scholar] [CrossRef]
  25. Zhang, L.; Gao, P.; Gan, Z.; Wu, W.; Sun, Y.; Zhu, C.; Long, S.; Liu, M.; Peng, H. Surface Subsidence Monitoring of Mining Areas in Hunan Province Based on Sentinel-1A and DS-InSAR. Sensors 2023, 23, 8146. [Google Scholar] [CrossRef]
  26. Tan, H.; Yu, X.; Zhu, M.; Guo, Z.; Chen, H. Deformation Monitoring and Spatiotemporal Evolution of Mining Area with Unmanned Aerial Vehicle and D-InSAR Technology. Mob. Inf. Syst. 2022, 2022, 8075611. [Google Scholar] [CrossRef]
  27. Glabicki, D. Ground Surface Deformation Monitoring of an Active Volcano Using the DInSAR Technique in Comparison with GPS Data: Case Study of Okmok Volcano, Alaska. In Proceedings of the 29th Conference of PhD Students and Young Scientists—Interdisciplinary Topics in Mining and Geology, Wroclaw Univ Sci & Technol, Sosnowka, Poland, 29–31 May 2019. [Google Scholar]
  28. Liu, M.; Long, S.; Wu, W.; Liu, P.; Zhang, L.; Zhu, C. Instability Monitoring and Numerical Analysis of Typical Coal Mines in Southwest China Based on DS-InSAR. Sensors 2022, 22, 7811. [Google Scholar] [CrossRef] [PubMed]
  29. Xia, Y.; Wang, Y.; Du, S.; Liu, X.; Zhou, H. Integration of D-InSAR and GIS technology for identifying illegal underground mining in Yangquan District, Shanxi Province, China. Environ. Earth Sci. 2018, 77, 319. [Google Scholar] [CrossRef]
  30. Jia, C.; Yang, X.; Wu, J.; Ding, P.; Bian, C. Monitoring Analysis and Numerical Simulation of the Land Subsidence in Linear Engineering Areas. KSCE J. Civ. Eng. 2021, 25, 2674–2689. [Google Scholar] [CrossRef]
  31. Li, F.; Liu, R.; Lu, M.; Shi, X.; Coal Industry Publ, H. Research of D-InSAR technique in monitoring coal-mining subsidence. In Proceedings of the 3rd International Symposium on Modern Mining and Safety Technology, Liaoning Tech Univ, Fuxin, China, 4–6 August 2008; pp. 523–526. [Google Scholar]
  32. Xu, Z.; Xu, W.; Zhu, Z.; Zhao, J. Research on monitoring and stability evaluation of ground subsidence in gypsum mine goaf. Front. Environ. Sci. 2023, 10, 1097874. [Google Scholar] [CrossRef]
  33. Zhang, Y.; Lian, X.; Ge, L.; Liu, X.; Du, Z.; Yang, W.; Wu, Y.; Hu, H.; Cai, Y. Surface Subsidence Monitoring Induced by Underground Coal Mining by Combining DInSAR and UAV Photogrammetry. Remote Sens. 2022, 14, 4711. [Google Scholar] [CrossRef]
  34. Chen, Y.; Dong, X.; Qi, Y.; Huang, P.; Sun, W.; Xu, W.; Tan, W.; Li, X.; Liu, X. Integration of DInSAR-PS-Stacking and SBAS-PS-InSAR Methods to Monitor Mining-Related Surface Subsidence. Remote Sens. 2023, 15, 2691. [Google Scholar] [CrossRef]
  35. Zhu, J.; Xing, X.; Hu, J.; Li, Z. Monitoring of ground surface deformation in mining area with InSAR technique. Chin. J. Nonferrous Met. 2011, 21, 2564–2576. [Google Scholar]
  36. Lei, G.; Zhou, H. On the law of metal mining subsidence based on SBAS. Eng. Surv. Mapp. 2015, 24, 40–46. [Google Scholar]
  37. Ishwar, S.G.; Kumar, D.; Malik, K.K. Mine surface subsidence monitoring due to impacts of underground mining using persistent scatterer interferometry. Imaging Sci. J. 2017, 65, 151–161. [Google Scholar] [CrossRef]
  38. Kim, T.T.H.; Tran, H.H.; Phan, T.A.; Lipecki, T. Mining-Induced Land Subsidence Detected by Persistent Scatterer InSAR: Case Study in Pniowek Coal Mine, Silesian Voivodeship, Poland. In Proceedings of the 2nd International Conference on Geospatial Technologies and Earth Resources (GTER), Hanoi Univ Min & Geol, Hanoi, Vietnam, 13–15 October 2022; pp. 23–42. [Google Scholar]
  39. Xia, Y.; Xia, F.; Hui, Z.; Li, H.; Wan, R.; Ai, J. Combined PS-InSAR Technology and High-Resolution Optical Remote Sensing for Identifying Illegal Underground Mining in the Suburb of Yangquan City, Shanxi Province, China. Remote Sens. 2023, 15, 3565. [Google Scholar] [CrossRef]
  40. Komac, M.; Holley, R.; Mahapatra, P.; van der Marel, H.; Bavec, M. Coupling of GPS/GNSS and radar interferometric data for a 3D surface displacement monitoring of landslides. Landslides 2015, 12, 241–257. [Google Scholar] [CrossRef]
  41. Liu, J.; Ma, F.; Li, G.; Guo, J.; Wan, Y.; Song, Y. Evolution Assessment of Mining Subsidence Characteristics Using SBAS and PS Interferometry in Sanshandao Gold Mine, China. Remote Sens. 2022, 14, 290. [Google Scholar] [CrossRef]
  42. Alam, M.S.; Kumar, D.; Chatterjee, R.S. Improving the capability of integrated DInSAR and PSI approach for better detection, monitoring, and analysis of land surface deformation in underground mining environment. Geocarto Int. 2022, 37, 3607–3641. [Google Scholar] [CrossRef]
  43. Hastaoglu, K.O.; Poyraz, F.; Turk, T.; Yilmaz, I.; Kocbulut, F.; Demirel, M.; Sanli, U.; Duman, H.; Sanli, F.B. Investigation of the success of monitoring slow motion landslides using Persistent Scatterer Interferometry and GNSS methods. Surv. Rev. 2018, 50, 475–486. [Google Scholar] [CrossRef]
  44. Rauff, K.O.; Abir, I.A. Monitoring of the ground deformation in penang island, malaysia using permanent scatterer interferometry synthetic aperture radar (ps-insar) and ground-penetrating radar (gpr) techniques. Acta Geodyn. Geomater. 2021, 18, 461–471. [Google Scholar] [CrossRef]
  45. Liu, B.; Luo, Y.; Zhang, J.F.; Gong, L.X.; Jiang, W.L. PS InSAR time-series analysis for monitoring ground subsidence. In Proceedings of the 5th International Symposium on In-Situ Rock Stress, Beijing, China, 25–27 August 2010; pp. 819–822. [Google Scholar]
  46. Przylucka, M.; Kowalski, Z.; Perski, Z. Twenty years of coal mining-induced subsidence in the Upper Silesia in Poland identified using InSAR. Int. J. Coal Sci. Technol. 2022, 9, 86. [Google Scholar] [CrossRef]
  47. Cacciuttolo, C.; Marinovic, A. Experiences of Underground Mine Backfilling Using Mine Tailings Developed in the Andean Region of Peru: A Green Mining Solution to Reduce Socio-Environmental Impacts. Sustainability 2023, 15, 12912. [Google Scholar] [CrossRef]
  48. Qi, C.; Fourie, A. Cemented paste backfill for mineral tailings management: Review and future perspectives. Miner. Eng. 2019, 144, 106025. [Google Scholar] [CrossRef]
  49. Huang, S.; Zhao, G.; Meng, X.; Cheng, X.; Gu, Q.; Liu, G.; Zhu, S. Development of Cement-Based Grouting Material for Reinforcing Narrow Coal Pillars and Engineering Applications. Processes 2022, 10, 2292. [Google Scholar] [CrossRef]
  50. Ning, S.; Lou, J.; Wang, L.; Yu, D.; Zhu, W. Stability Influencing Factors and Control Methods of Residual Coal Pillars with Solid Waste Materials Backfilling Method. Minerals 2022, 12, 1285. [Google Scholar] [CrossRef]
  51. Xinqi, L.; Xuefeng, L.; Haibin, H.; Qinbin, Z. Stability Analysis of Near-surface Goaf and the Optimization of Its Treatment Scheme in a Lead-zinc Mine. Met. Mine 2019, 511, 150–157. [Google Scholar] [CrossRef]
  52. Lee, H.; Moon, J.; Lee, H. Activity of Okgye Limestone Mine in South Korea Observed by InSAR Coherence and PSInSAR Techniques. Remote Sens. 2022, 14, 6261. [Google Scholar] [CrossRef]
  53. Han, Y.; Tao, Q.; Liu, G.; Hou, A.; Guo, Z.; Wang, F. Accuracy verification and correction of ascending and descending SBAS- and MSBAS-InSAR in monitoring mining surface subsidence. Geocarto Int. 2022, 37, 16370–16397. [Google Scholar] [CrossRef]
  54. Yin, Y.; Zheng, W.; Liu, Y.; Zhang, J.; Li, X. Integration of GPS with InSAR to monitoring of the Jiaju landslide in Sichuan, China. Landslides 2010, 7, 359–365. [Google Scholar] [CrossRef]
  55. Wang, H.; Li, K.; Zhang, J.; Hong, L.; Chi, H. Monitoring and Analysis of Ground Surface Settlement in Mining Clusters by SBAS-InSAR Technology. Sensors 2022, 22, 3711. [Google Scholar] [CrossRef] [PubMed]
  56. Zheng, M.; Deng, K.; Fan, H.; Du, S. Monitoring and Analysis of Surface Deformation in Mining Area Based on InSAR and GRACE. Remote Sens. 2018, 10, 1392. [Google Scholar] [CrossRef]
  57. Escayo, J.; Marzan, I.; Marti, D.; Tornos, F.; Farci, A.; Schimmel, M.; Carbonell, R.; Fernandez, J. Radar Interferometry as a Monitoring Tool for an Active Mining Area Using Sentinel-1 C-Band Data, Case Study of Riotinto Mine. Remote Sens. 2022, 14, 3061. [Google Scholar] [CrossRef]
  58. Crosetto, M.; Monserrat, O.; Cuevas-Gonzalez, M.; Devanthery, N.; Crippa, B. Persistent Scatterer Interferometry: A review. ISPRS J. Photogramm. Remote Sens. 2016, 115, 78–89. [Google Scholar] [CrossRef]
  59. Zhou, Z.; Chen, L.; Cai, X.; Shen, B.; Zhou, J.; Du, K. Experimental Investigation of the Progressive Failure of Multiple Pillar–Roof System. Rock Mech. Rock Eng. 2018, 51, 1629–1636. [Google Scholar] [CrossRef]
  60. Li, C.; Ding, L.; Cui, X.; Zhao, Y.; He, Y.; Zhang, W.; Bai, Z. Calculation Model for Progressive Residual Surface Subsidence above Mined-Out Areas Based on Logistic Time Function. Energies 2022, 15, 5024. [Google Scholar] [CrossRef]
  61. Jiang, K.; Wang, L.; Teng, C. A Dynamic Monitoring Method of Surface 3D Deformation of Coal Mine Based on Fusion of Single Sight D-InSAR and BK Model. Geomat. Inf. Sci. Wuhan Univ. 2023, 48, 620–630. [Google Scholar]
  62. Ma, X.; Fu, Z.; Li, Y.; Zhang, P.; Zhao, Y.; Ma, G. Study on Surface Subsidence Characteristics Based on Three-Dimensional Test Device for Simulating Rock Strata and Surface Movement. Energies 2022, 15, 1927. [Google Scholar] [CrossRef]
  63. Pal, A.; Roser, J.; Vulic, M. Surface Subsidence Prognosis above an Underground Longwall Excavation and Based on 3D Point Cloud Analysis. Minerals 2020, 10, 82. [Google Scholar] [CrossRef]
Figure 1. The geographical location of the study area and the characteristics of the goaf.
Applsci 14 02651 g001
Figure 2. PS-InSAR technical flow chart.
Applsci 14 02651 g002
Figure 3. PS point distribution map for each time period.
Applsci 14 02651 g003
Figure 4. Monitoring accuracy verification.
Applsci 14 02651 g004
Figure 5. Mine surface subsidence map.
Applsci 14 02651 g005
Figure 6. Surface Settlement Curves before and after goaf treatment and time-settlement curves of monitoring points.
Applsci 14 02651 g006
Figure 7. (a) Comparison of the settlement of the monitoring points during the treatment period of the goaf and before the treatment, (b) Comparison of the settlement of the monitoring point after the completion of the treatment of the goaf and the treatment period.
Applsci 14 02651 g007
Disclaimer/Publisher’s Note: The statements, opinions and data contained in all publications are solely those of the individual author(s) and contributor(s) and not of MDPI and/or the editor(s). MDPI and/or the editor(s) disclaim responsibility for any injury to people or property resulting from any ideas, methods, instructions or products referred to in the content.

