Article

Mechanics and Stability of Force Chain Arch in Excavated Granular Material

Deep Mining and Rock Burst Research Institute, Chinese Institute of Coal Science, Beijing 100013, China
*
Author to whom correspondence should be addressed.
Appl. Sci. 2024, 14(6), 2485; https://doi.org/10.3390/app14062485
Submission received: 18 February 2024 / Revised: 13 March 2024 / Accepted: 13 March 2024 / Published: 15 March 2024
(This article belongs to the Topic Geotechnics for Hazard Mitigation)

Abstract

:
Rock and soil masses in geotechnical engineering projects, such as tunnels, mines and slopes, undergo relative motion, exhibiting mechanical characteristics of solid–fluid transition under critical conditions. This work analyzes the characteristics of the solid–fluid transition interface and the mode of load transfer through biaxial compression particle flow photoelastic experiments on granular materials. The study documents that this interface forms an arch shape, marked by a force chain arch. The granular material exhibits two distinct states depending on its position: below the arch, the granular material is in a solid–fluid transitional state, with bearing capacity reduced, while above the arch, it is in a stable solid state, capable of bearing the overlying rock layer’s load. The presence of the force chain arch alters the direction of the originally downward-transferring load, redirecting it along the trajectory of the arch. Analysis of the force and stability of the force chain arch revealed that the arch shape parameters and boundary loads control the instability of the arch. Changes in the overlying and lateral loads lead to different types of instability of the force chain arch. The findings of the study are crucial for underground engineering construction and for the prevention of geological disasters related to granular material.

1. Introduction

The excavation of geotechnical engineering projects—such as tunnel excavation, underground mining, foundation pit excavation and slopes—causes disturbances, which create free surfaces disrupting the original mechanical equilibrium of the rock and soil masses. The modified masses attain a state of self-stabilization through internal particle reorganization and stress redistribution [1,2,3,4,5,6]. The rock and soil masses below the free surface remain in a fluid state during this self-stabilization process. According to the natural equilibrium arch theory of Protodyakonov [7,8,9], unbraced excavated rock tunnels with joints experience collapse, eventually forming a temporarily stable equilibrium arch, known as the natural equilibrium arch. Terzaghi [10] proposed that under the assumption of equilibrium arch conditions, the rock and soil masses form a resistance to shearing along the vertical planes extending upwards from both sides of the arch foot, which can be used to estimate the pressure reduction above the trapdoor due to the arching of the rock and soil masses. The deformations generated by the Terzaghi principle in a porous medium, in the context of tunnel works in soft rock and granular terrain, have been resolved with the use of FEM [11]. Chen et al. [12] carried out a continuous loading experiment with a two-dimensional granular system and obtained the experimental data through digital image correlation (DIC). The experimental results indicated that the evolution of force chains was directly related to the number, geometric properties and permutation distribution of granules in direct contact with the external load. Li et al. [13] analyzed the stability of the arch structure via theoretical analysis and particle flow numerical simulation, and they found out that during the mining stage of the working face, the rock strata arch structure experiences a process of arch breaking, and the instability of the arch structure is the root cause of increasing surface subsidence damage. Handy [14] analyzed the soil arching effect behind retaining walls and provided predictions for the shape of the soil arch. Wang and Yen [15] conducted a comparable analysis for slopes. Kim et al. [16] detected a reduction in earth pressure due to the horizontal/vertical three-dimensional arching effect. They combined experimental and theoretical analyses to study lateral earth pressure on vertical circular shafts, quantifying the magnitude and distribution of lateral earth pressure measured by the three-dimensional arching effect. The obtained lateral earth pressure on vertical circular shafts considering the arching effect was 80% lower than that calculated by Rankine’s theory. Shabanimashcool et al. [17] used a three-dimensional discontinuous numerical modeling method to investigate the interaction between rock bolts and rock masses and concluded that interlocking rock blocks constitute a stress concentration zone in the shape of an arch (i.e., a pressure arch) inside the rock mass. This pressure arch can resist the pull-out force of rock bolts and thus plays an important role in the rock mass’s ability to withstand the forces from the rock anchors. Li et al. [18,19] employed numerical simulation methods to study the velocity distribution characteristics above the tunnel working face and arch apex, proposing a new permissible movement velocity field. They established an improved failure mechanism considering soil arching effects and internal plastic deformation of the soil through the application of spatial discretization technology. Trapdoor experimental studies have documented stress redistribution caused by soil arching. The results of numerous trapdoor experiments in geotechnical centrifuges have been reported in several studies, focusing on stress changes and redirection during the entire movement of the trapdoor [20,21,22,23,24,25,26,27]. The experiments confirmed that soil arches form during the movement of the trapdoor, with stress transferring from the yield zone to the non-yield zone.
In the present study, the photoelastic experimental method [28,29,30] is utilized, employing a biaxial compression bidirectional flow experimental apparatus for granular materials (model RLJW–2000) [31]. The method involves loading granular materials and progressively releasing particles to simulate the solid–fluid transition during deep mining processes, achieving visualization of the force chain arch. It is detected that the force chain arch acts as an interface during the transition from a solid to a fluid state in the granular system, delineating the quasi-solid stable zone from the quasi-liquid transitional zone. During this process, the force chain arch bears load transmitted from the upper and lateral directions, altering the original load transmission direction. In this study, the force acting on the force chain arch is analyzed, and its stability is discussed. The refined understanding of the force chain arch provides better insights into the formation, evolution and mechanisms of geological disasters and thus also contributes to the improvement of early warning models and monitoring systems [32,33].

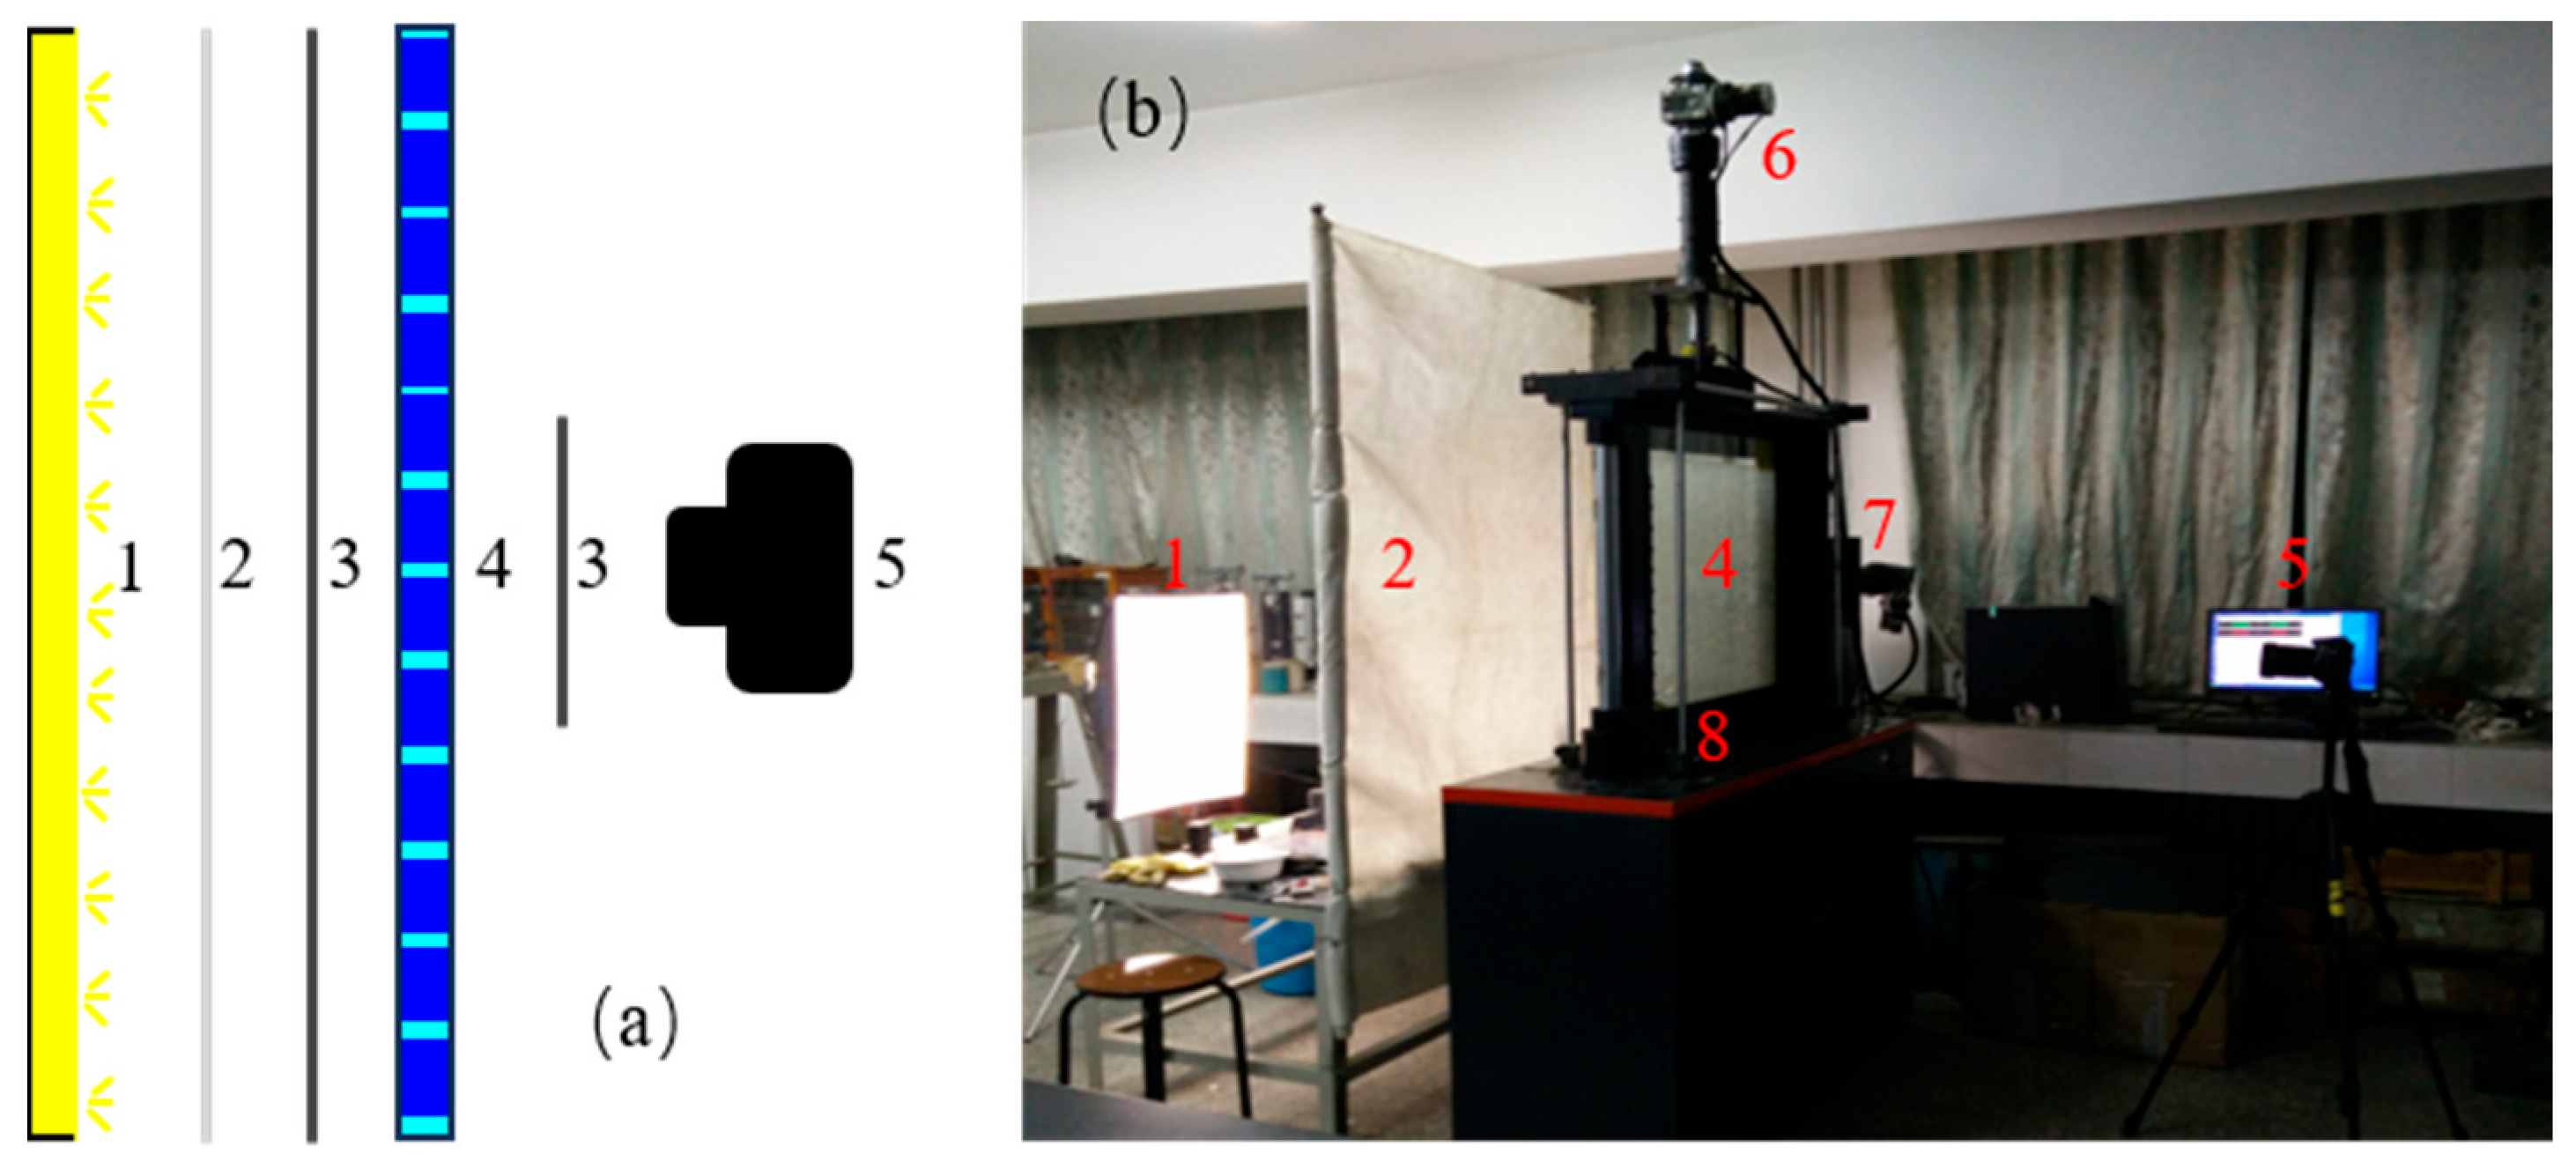
2. Particle Flow Photoelastic Experiment Apparatus and Experimental Materials

The granular material samples were placed in a container, with circular polarizers arranged at the front and back. When illuminated with an LED light source on one side, high-resolution photographs (taken with a Canon 5D Mark III, 5760 × 3840 pixels, bought from Canon, Beijing, China) were captured from the other side, showcasing the samples at various experimental stages under both normal and polarized light conditions. The optical path during the experiment is illustrated in Figure 1a, and the set-up of the biaxial compression bidirectional flow experiment for the granular material along with its loading system is shown in Figure 1b.
The components include the following: 1—Light source, 2—Light diffusion sheet, 3—Circular polarizers, 4—Photoelastic granular material (placed in a container made of a pair of transparent glass plates), 5—High-resolution camera, 6—Vertical servo loading cylinder, 7—Horizontal servo loading cylinder, 8—Eleven independent particle release ports (at the bottom).
The experimental apparatus achieves biaxial loading through two blades—one for normal and the other for tangential force—along with their corresponding servo loading cylinders. The entire frame of the apparatus is situated in a vertical structure, with the container holding the granular model located on the cabinet. The frame of the model can rotate around the vertical column, facilitating the insertion and removal of the particles, as illustrated in Figure 1b. The bottom and right sides of the particle container comprise grooves and are equipped with 11 steel plate baffles acting as trapdoors, respectively. When the load is constant, the opening of a trapdoor at the bottom allows particles within the container to flow out from the base. Similarly, opening of a lateral trapdoor induces the flow of particles from the side.
The materials used for the photoelastic experiments primarily include substances capable of producing birefringence, such as epoxy resin and polycarbonate. The photoelastic experimental material makes it possible to observe the path of force transformation under polarized light, which is called force chains. In the experiment, the granular materials were obtained by cutting Lexan 9030 polycarbonate sheets. This material provides excellent light transmission properties and is easy to process. The density of the polycarbonate is 1.2 g/cm3, with an elastic modulus of 2.3 GPa and a Poisson’s ratio of 0.36. The inherent bonding strength of polycarbonate is low, which results in minimal impact on its overall strength and stability. To prevent interfering effects related to crystallization due to a single particle size during the experiment, the polycarbonate sheets were processed into flat cylindrical particles of three sizes: Φ8 mm × 3 mm, Φ10 mm × 3 mm and Φ12 mm × 3 mm. The static and dynamic friction coefficients of the particles are 0.5 and 0.02, respectively. Pressure is the critical function in the study, whereas self-weight of the particles is negligible. Therefore, the Euler similarity criterion, which is based on pressure, was selected, resulting in the similarity ratios for the model, as summarized in Table 1.

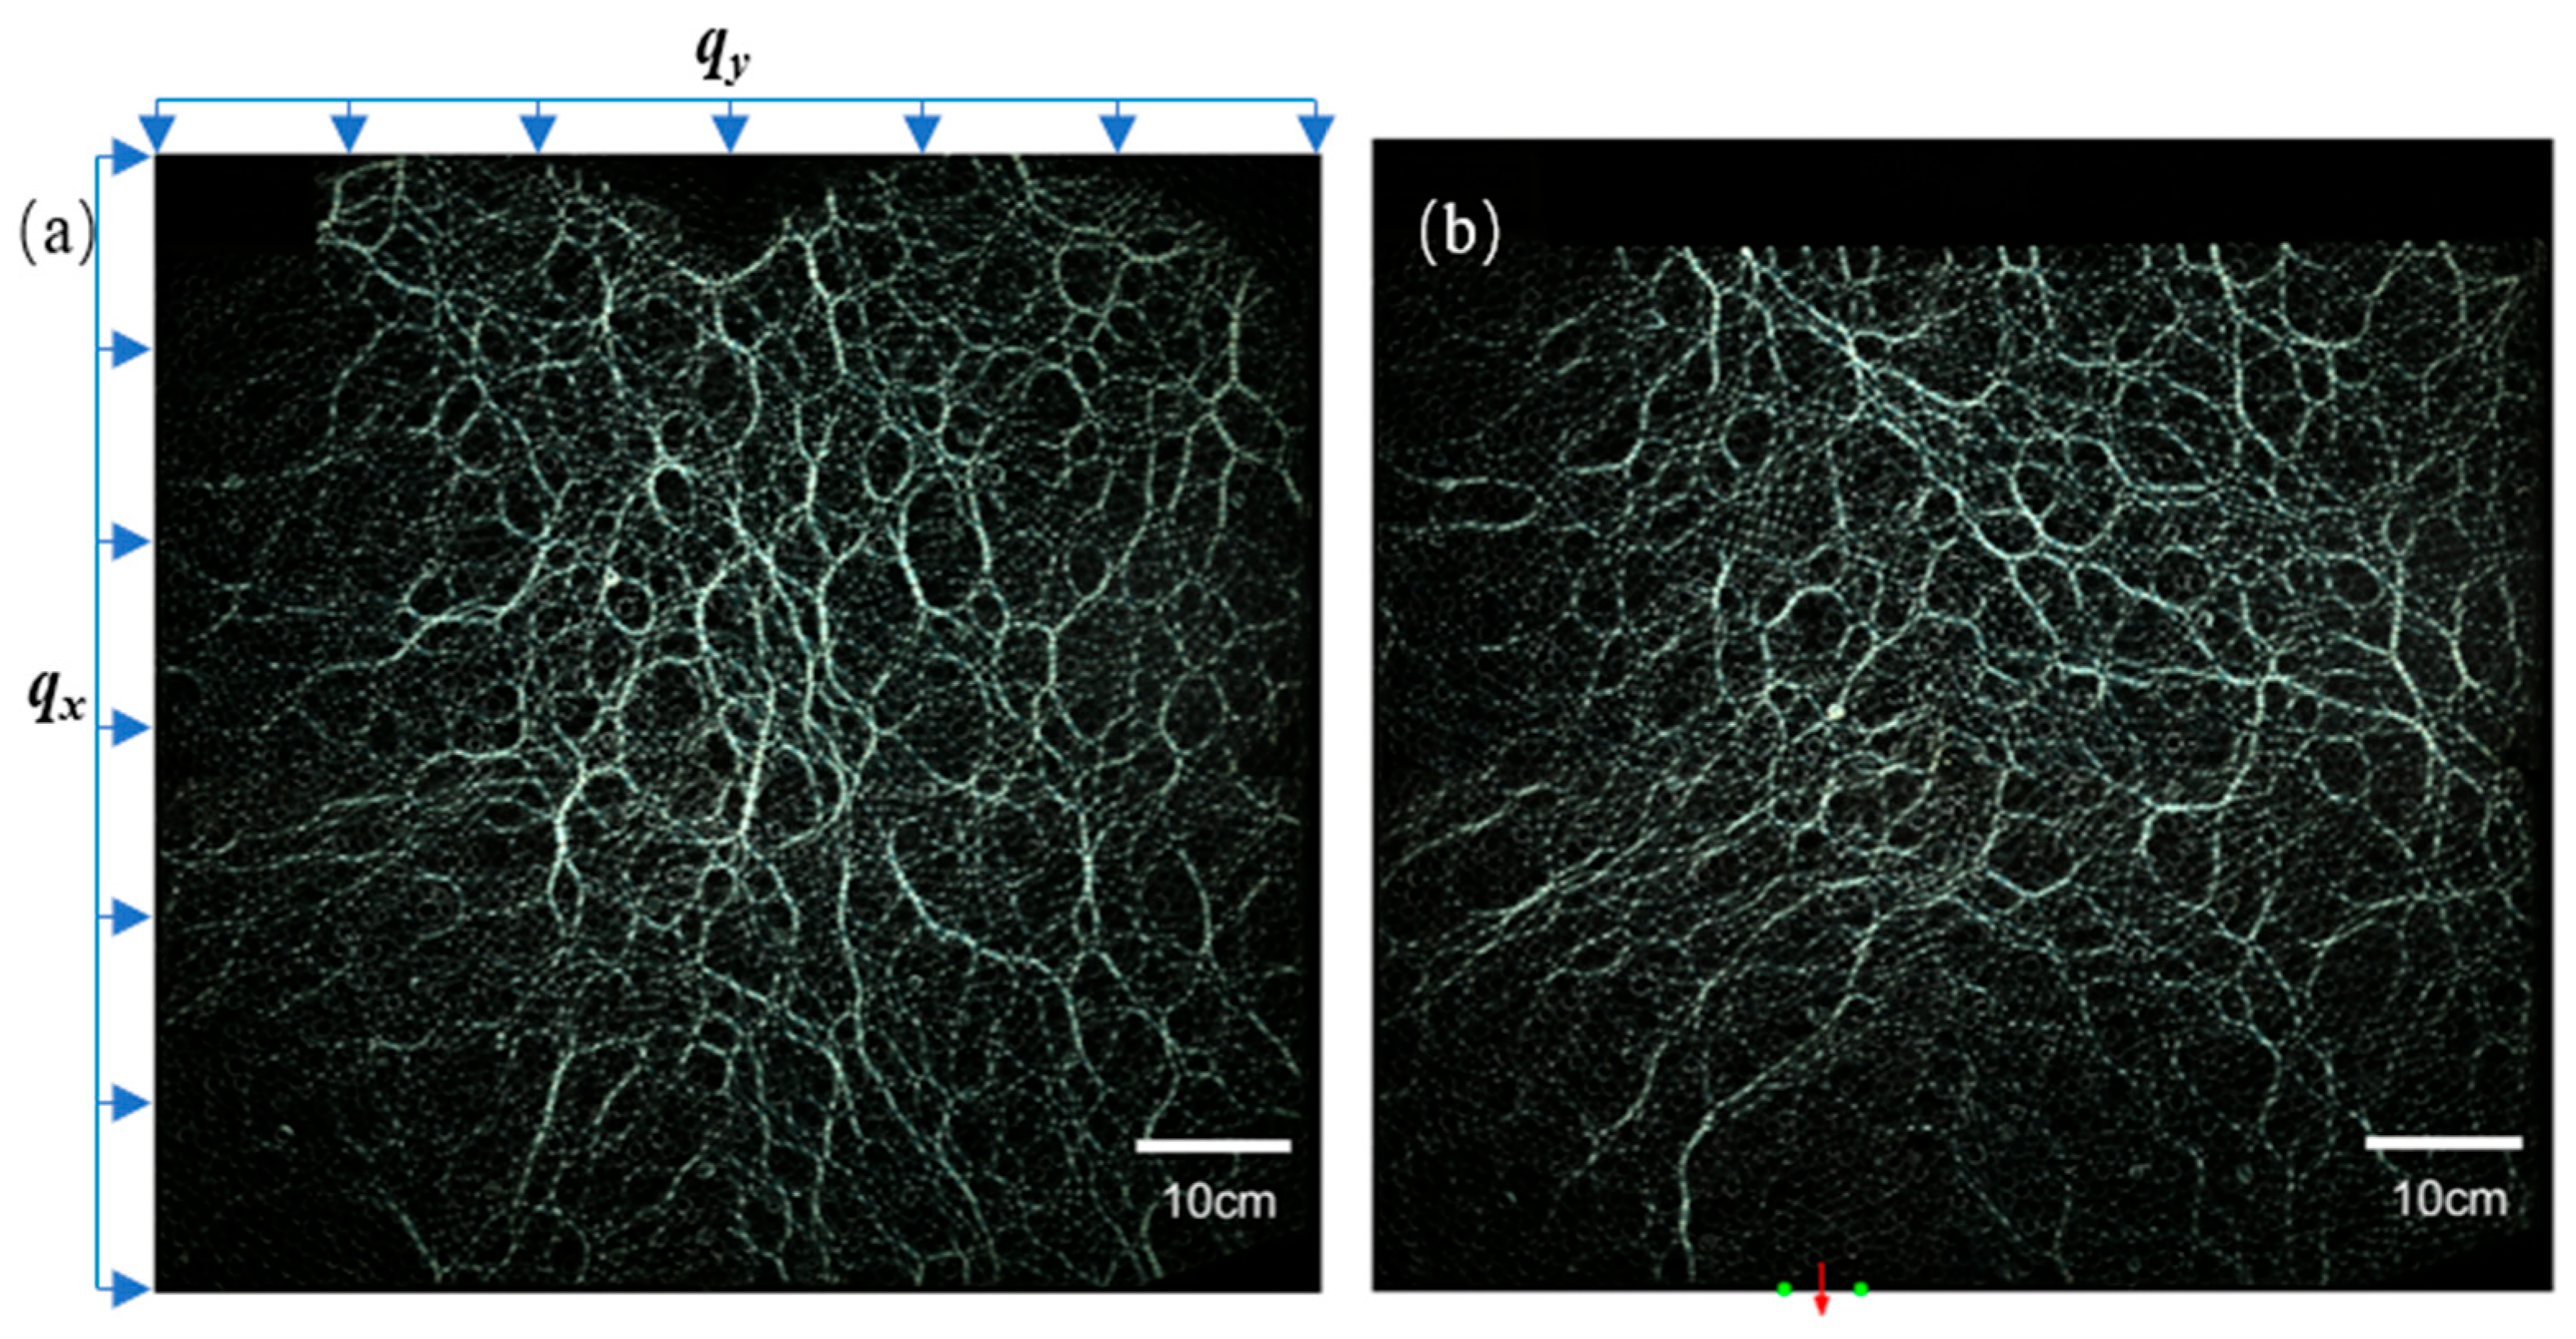
3. Evolution of Force Chain Networks during the Solid–Fluid Transition Process

The granular material within the biaxial compression bidirectional flow experimental apparatus was subjected to loading, as shown in Figure 2a. The load includes a uniformly distributed load qy at the top and qx on the left side, with the bottom and right sides being fixed. During the experiment, the top and lateral loads are maintained at 200 N through servo control, equivalent to an actual rock layer geo-stress of 12.5 MPa. The geometric dimensions and loads of the released granular material are converted according to the similarity ratios (Table 1). Releasing particles from the bottom reliably simulates deep mining, and a force chain arch structure appears above the trapdoor, as depicted in Figure 2b. The green dots at the bottom indicates the trapdoor, and the red arrow represents the flowing direction.
Starting from the spatial distribution of photoelastic force chains, the spatial autocorrelation method commonly used in the field of geographical statistics was employed to determine the principal direction of the force chain arch structure [34]. Spatial autocorrelation [35] refers to the potential interdependencies among the observational data of a variable within the same distribution area. Its results are related to the relative size of the variable and are independent of its absolute value. In the photoelastic experiments, the intensity of light represents the relative magnitude of force. By calculating the local spatial autocorrelation coefficients of light intensity within a small window, the spatial distribution of local force chains is obtained. The characteristic direction of the distribution represents the development direction of local force chains, and the next window is determined. By repeating the calculation process above, starting from the bottom-left corner of the model, the arch trajectory is established via local iterative statistical method. The force arch identified using the autocorrelation algorithm after the release of particles from the bottom is shown in Figure 3a, where red points represent the centroid of the calculation window. Fitting these points, the trajectory of the force chain arch is shown in Figure 3b, following a quadratic function equation, y = −0.0031x2 + 2.51x − 235.66, with R-square of 0.9925.

4. Analysis of the Forces and Stability of the Solid–Fluid Transition Interface in Bottom Particle Flow

4.1. Force Analysis of the Force Chain Arch Formed by Bottom Particle Flow

The force chain arch formed by releasing particles from the bottom under biaxial compression load is analyzed in the following section. The basic assumptions are as follows: the force chain arch ACB is an arch under plane strain, and its thickness has no impact on the arch; the overlying load qy is a vertical uniformly distributed load, and the left lateral load qx represents a horizontal uniformly distributed load, with the bottom and right sides being fixed, also with uniformly distributed loads qy, qx, respectively. As shown in Figure 4a, points A and B are the left and right arch foot, respectively; point C is the arch apex; and D is any point on the arch. The arch span is 2l, and the arch height is h. First, the left half arch ADC is analyzed. The horizontal reaction force at the arch foot is FH; the vertical reaction force is FV; and the reaction force at the arch apex is Fm.
Based on the static equilibrium conditions at the arch apex (point C)
F x = 0 F y = 0 M C = 0
which leads to
F H + q x h F m = 0 F V q y l = 0 F H h + q y l l 2 F V l + q x h h 2 = 0
Solving the equations, the boundary conditions are obtained:
F H = 1 2 q x h + 1 2 h q y l 2 F V = q y l F m = 1 2 q x h + 1 2 h q y l 2
Any point D on the arch, with coordinates (x, y), satisfies the interface trace equation. As shown in Figure 4b, the horizontal distance from point D to the left arch foot is l(x); its height is h(x) = y(x); and the angle between the central axis of the force chain arch and the x-axis, ∠OO1D = θ(x). The normal and tangential forces are FN and FT, respectively, where l(x), h(x), θ(x) are functions uniquely determined by the abscissa x, with qx = qy = 66.7 kN/m being the known uniformly distributed load.
The equilibrium conditions for any point D(x,y) on the arch are calculated in the following equations:
F x = 0 : F H F T sin θ x F N cos θ x + q x h x = 0 F y = 0 : F V + F N sin θ x F T cos θ x q y l x = 0
which leads to
cos θ x sin θ x sin θ x cos θ x F N F T = q x h x + F H q y l x F V
Therefore
F N F T = cos θ x sin θ x sin θ x cos θ x 1 q x h x + F H q y l x F V = q y l x F V sin θ x + ( q x h x + F H ) cos θ x q y l x F V cos θ x + ( q x h x + F H ) sin θ x
Substituting Equation (3) to determine the force at any point D(x, y) on the arch yields
F N = q y l x l sin θ x + 1 2 q x h + 1 2 h q y l 2 + q x h x cos θ x F T = q y l l x cos θ x + 1 2 q x h + 1 2 h q y l 2 + q x h x sin θ x
Since x and θ have a one-to-one correspondence, the terms related to l and h in Equation (7) are represented as functions of θ to derive a more general conclusion. Thus, the force at any point D(x(θ), y(θ)) on the arch is dependent on θ, expressed as Equation (8). The normal and tangential forces at various points on the arch are shown in Figure 5a,b, respectively.
F N = q y l θ l sin θ + 1 2 q x h + 1 2 h q y l 2 + q x h θ cos θ F T = q y l l θ cos θ + 1 2 q x h + 1 2 h q y l 2 + q x h θ sin θ
The normal force FN on the arch is zero at θ = π/2, increases in absolute value toward the arch feet on both sides and attains a maximum value of approximately 1.5 kN at the arch feet. The tangential force FT reaches the maximum of 20.75 kN at the arch feet and the arch apex, and the local minimum of 18.34 kN between the arch apex and the arch feet. Considering the stability of the arch shoulders, the relationship between the normal force and tangential force in equilibrium state is as follows:
F N = F T tan α
where α is the natural rest angle of the rock and soil masses. Defining the maximum values of normal and tangential forces in the equilibrium state as their corresponding allowable stresses, the instability condition of the force chain arch is defined as
F N > F N o r   F T > F T o r   F N F T tan α
The values of {FN} and {FT} are related to the microscopic scale particle contact forces. Ideally, if the arch trace is composed of a series of particles, the normal force {FN} of the force chain arch is defined by the tangential contact force ft between individual particles, while the tangential force {FT} of the force chain arch is provided by the normal contact force fn between particles. According to the Hertz contact theory for static, elastic spherical particles, the normal force of particle contact is determined by the elastic modulus of the particles, the radius of the spheres and the amount of particle overlap. The criterion for particle sliding is generally expressed as
f t μ f n
where μ is the coefficient of translational friction of the granular material.
In actual complex rock and soil masses, the shear failure and cohesion c of the soil affect the equilibrium of the force chain arch. At the microscopic level, different models were proposed to describe particle contact collisions, including the linear viscoelastic model, the non-linear viscoelastic model and the hysteresis model considering plasticity, which include damping coefficients and elastic recovery coefficients. Due to the weak cementation properties of the particles in the experiment, some specific factors, such as cohesion, are negligible. However, the mechanical calculations of the force chain arch’s equilibrium, which is based on visualization of the force chain in the photoelastic experiment, are still of referential significance.

4.2. Stability Analysis of the Force Chain Arch Formed by Bottom Particle Flow

The instability of the force chain arch can be categorized into two types:
1.
Define arch span L = 2l. Based on Equation (8), the force expressions at the arch feet are as follows: when the boundary loads qy and qx are constant, FH is a linear function of the arch height h and quadratic function of the arch span L, while FV is a linear function of the arch span L. If the particle system is disturbed, e.g., by further excavation, causing movement of the particles at the arch feet, the horizontal force F H and vertical force F V at the arch feet change, thereby breaking the force chain arch. Continuing downward transfer of the overlying load causes the originally unforced particles under the arch to possibly participate in the formation of a new force chain network, or the particle stress may change. Thus, when the system attains a new equilibrium, the force chain network becomes updated.
2.
When the particle system is subjected to a new stress disturbance, i.e., at least one of the boundary loads qy or qx increases, this causes a change in the forces at various points on the arch, and thus, the breaking of the stress arch and redistribution of the force chain network.
The following scenario considers the critical conditions for the instability of the force chain arch under changes in boundary loads qy or qx and arch span L:
  • Keeping the lateral load qx constant and increasing or decreasing the overlying load qy, the resulting normal and tangential forces are shown in Figure 6a,b, respectively, and the ratio of normal to tangential force is shown in Figure 6c.
When qy decreases, the absolute value of normal force at each point increases and exceeds the value in the original equilibrium state (curve defined by green symbols). The normal force at the foot becomes the maximum value, and the critical point occurs at the arch foot. The tangential force decreases as a whole, and the value at the arch apex reaches the maximum. When qy increases, the normal force at each point also rises and exceeds the maximum value in the original equilibrium state, with the arch feet being the critical points. The tangential force at each point increases along with qy increases. For one particular curve, for example, qy = 33.33 kN/m, the tangential force decreases from the arch foot to the arch apex, defining the arch foot as the critical section.
In summary, when the lateral load remains constant and the overlying load varies, the potential failure modes include normal buckling failure at the arch feet and tensile failure at the arch apex. When the overlying load increases, the potential failure modes include normal buckling failure and tensile failure at the arch feet.
2.
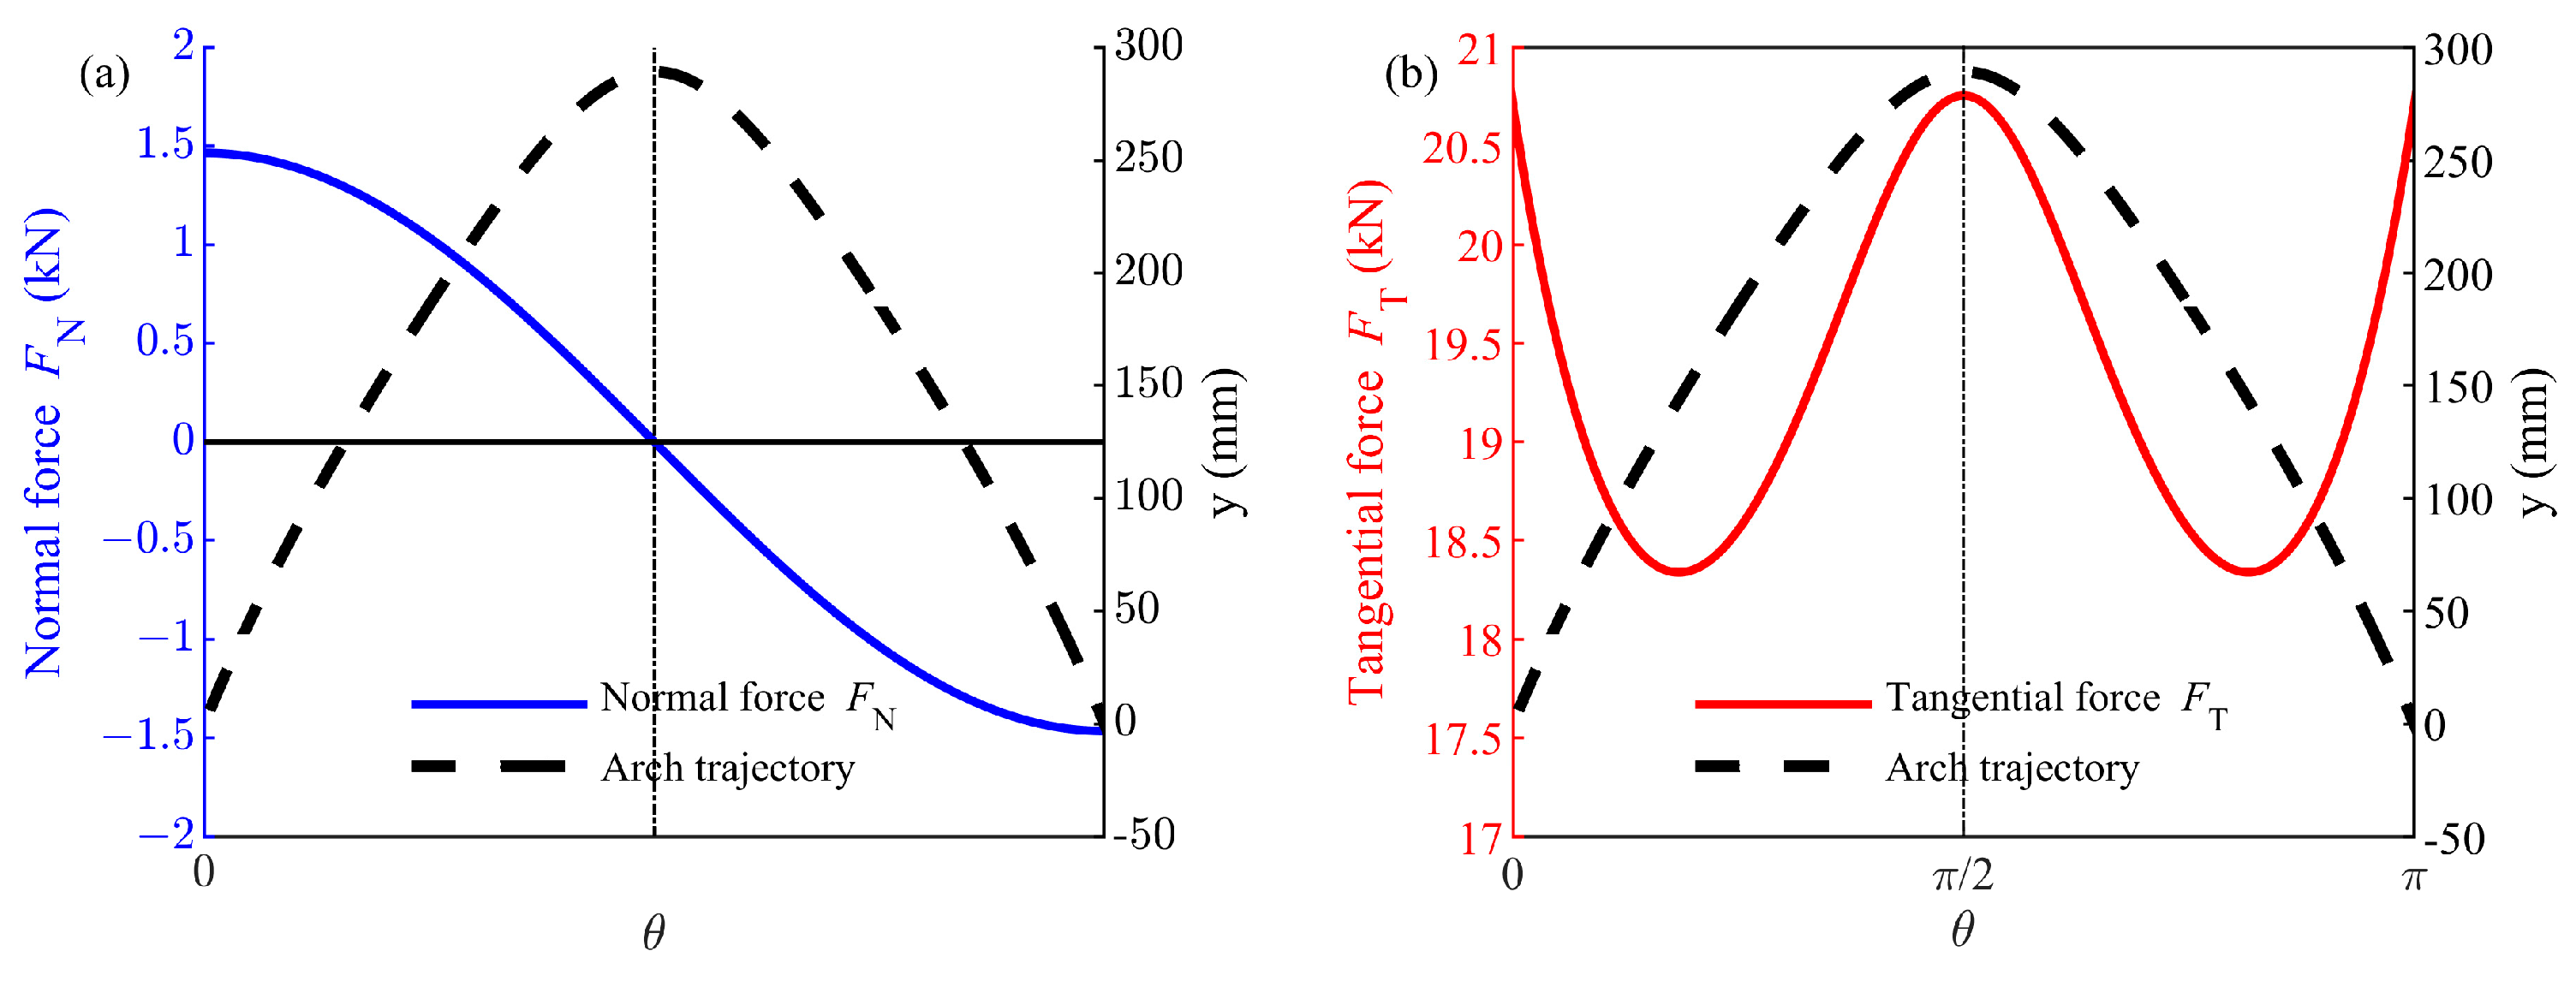
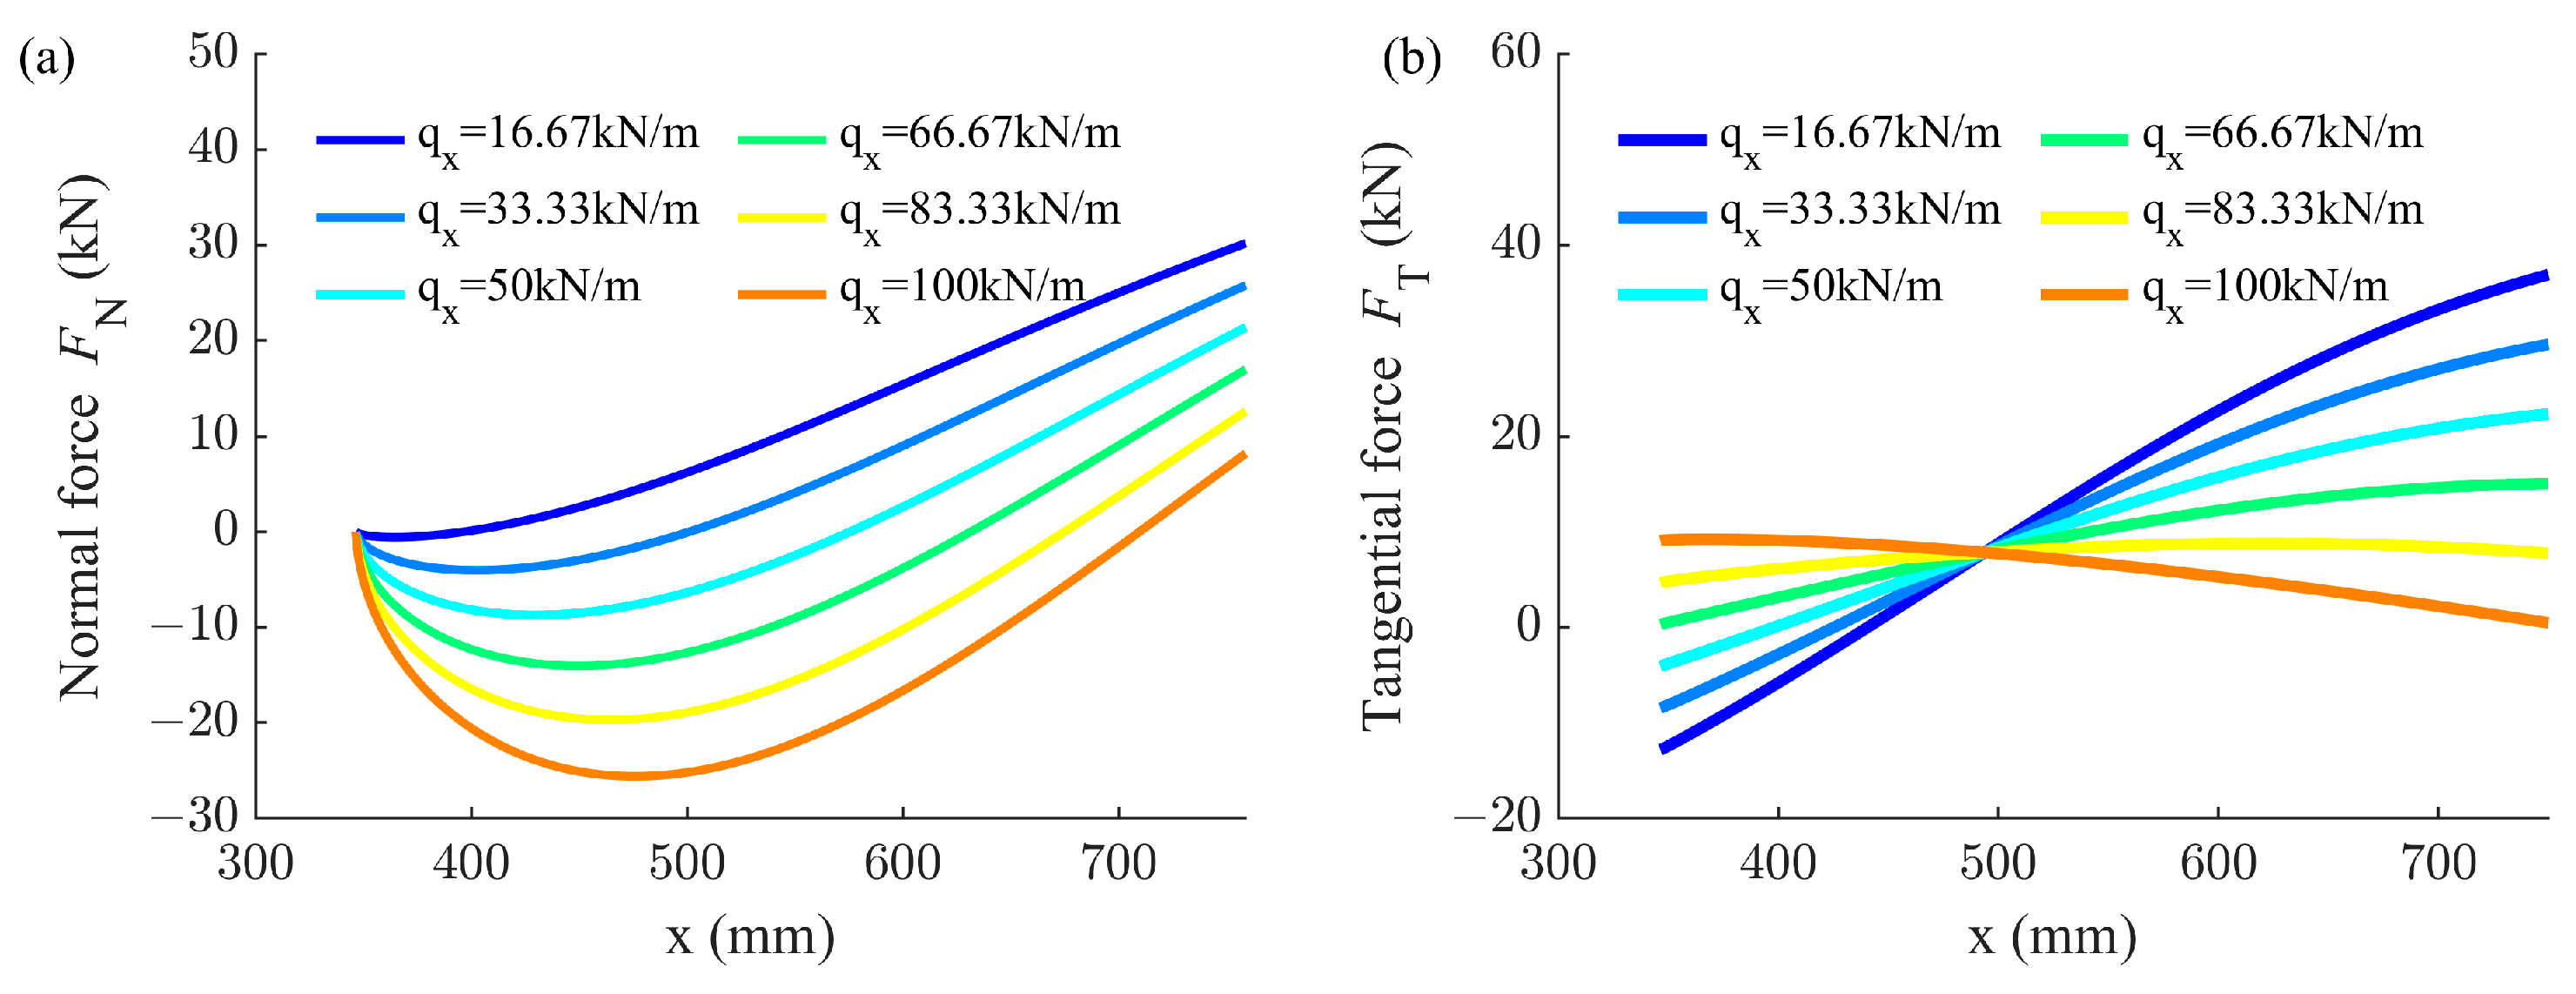
Keeping the overlying load qy constant and changing the lateral load qx, the normal force, tangential force and their ratio are shown in Figure 7a–c.
When qx decreases, the normal force at each point increases and exceeds the maximum value in the original equilibrium state (curve defined by green symbols), with the critical section located at the arch feet. The tangential force at each point decreases, remaining in a safe state, and the ratio of normal force to tangential force rises, with the critical section located at the arch feet. When qx increases, the normal force and the ratio of normal force to tangential force also rise, exceeding the maximum value in the original equilibrium state, defining the arch feet as the critical section. The tangential force at each point increases and reaches the critical state at the arch apex.
In summary, when the overlying load remains unchanged and the lateral load decreases or increases moderately, the potential failure modes include normal buckling failure at the arch feet and tensile failure at the arch apex.
By considering both the load and the configuration of the arch, critical loads are identified under various combinations:
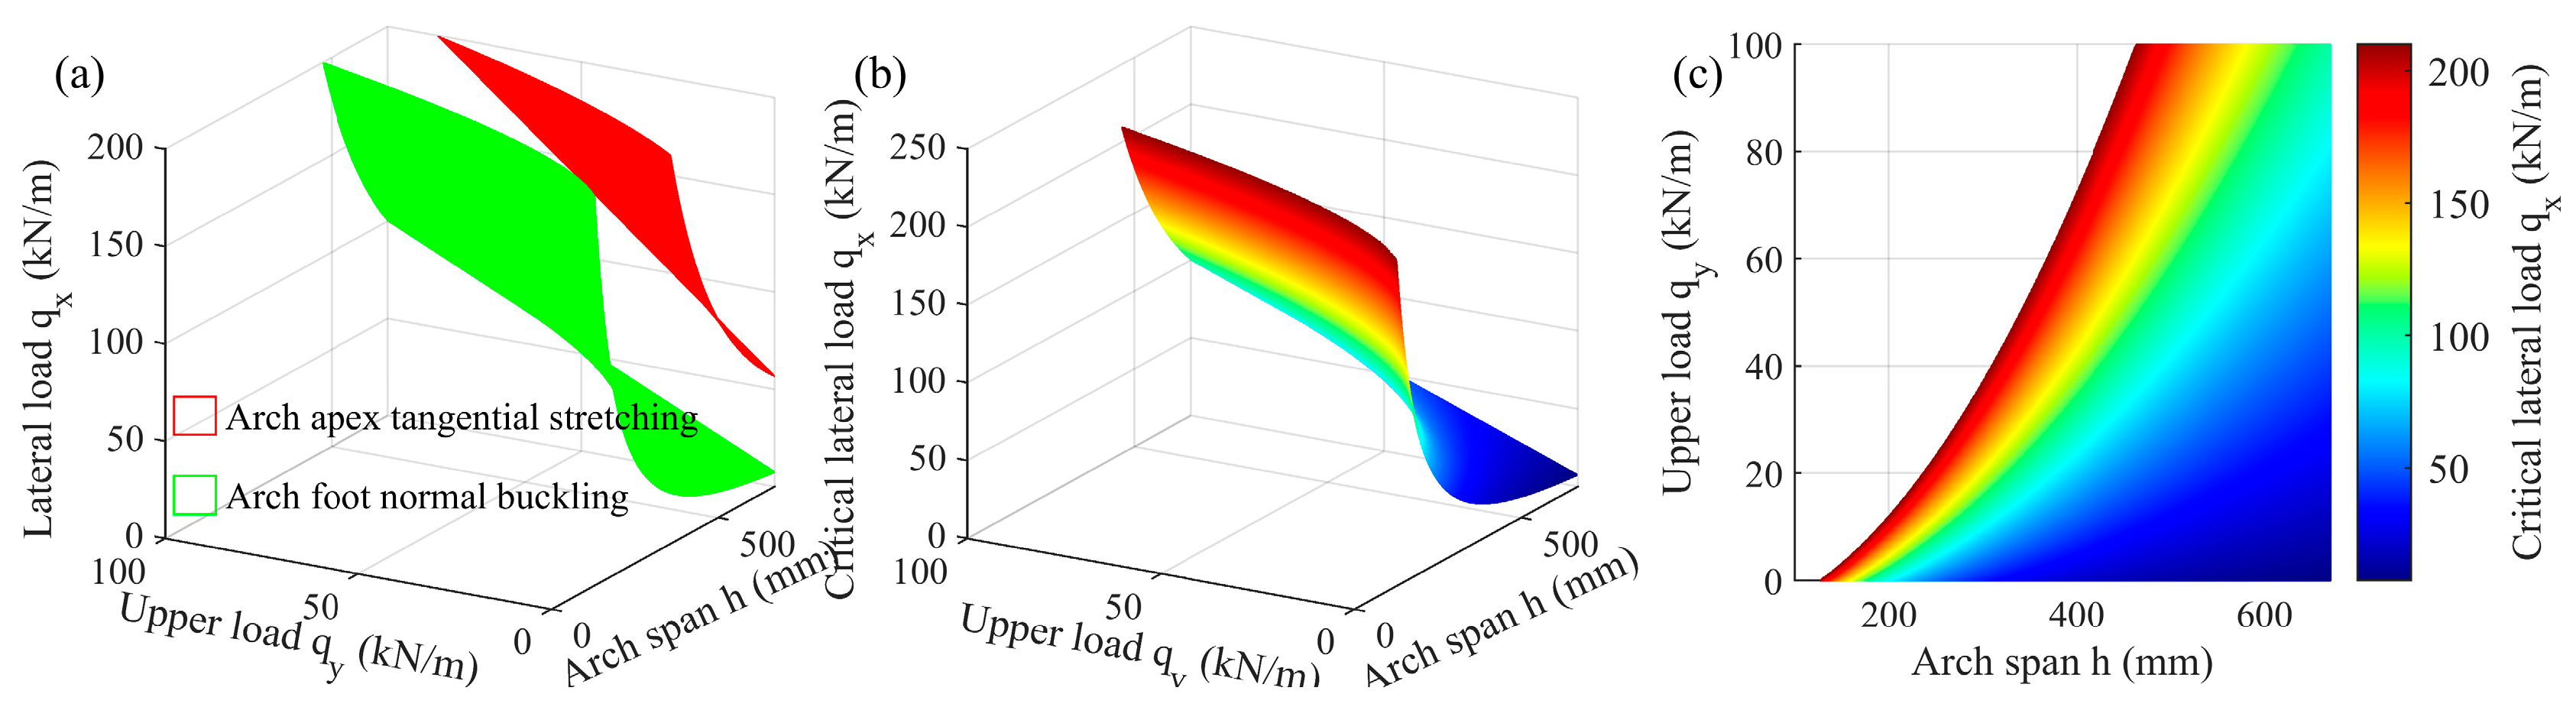
  • The tangential force at the arch apex and the normal force at the arch foot are calculated for different overlying loads qy and arch spans L. The lateral loads qx required to reach the allowable stress for each position are shown in Figure 8a. The red surface represents the boundary at which tangential tension leads to collapse of the arch apex; the green surface represents normal buckling at the arch foot; and the blue surface represents the boundary for tangential tension at the arch foot. Equation (6) demonstrates that both FN and FT are negatively correlated with qx, indicating that the lateral load is an absolute adverse factor for the equilibrium of the arch. Therefore, the minimum qx values from each surface (Equation (12)) constitute the equilibrium boundary of the arch, as shown in Figure 8b.
q x min q x ( F T < F T ) ,         a r c h   a p e x m a x q x ( F T < F T ) q x F N < F N q x F N < q x F T ,       a r c h   f o o t
A projection of Figure 8b onto the qx-L plane is shown in Figure 8c, indicating that the larger the arch span and the overlying load, the smaller the lateral load required to cause failure in the force chain arch. In other words, the value of the arch span and the overlying load need to be controlled to keep the system stable.
2.
For different lateral loads qx and arch spans L, calculations were conducted for the tangential force at the arch apex and the normal force at the arch feet to determine the overlying load qy required for them to attain the allowable stress (Figure 9a). The red surface represents the boundary where tangential tension leads to collapse at the arch apex; the green surface represents normal buckling at the arch foot; and the blue surface illustrates the boundary for tangential tension at the arch feet.
The relevant equation for the arch apex is
F T = 1 2 q x h + 1 2 h q y l 2 + q x h F T q y h l 2 2 F T q x h
and for the arch feet
F N = 1 2 q x h + 1 2 h q y l 2 F N F T = q y l l θ F T q y h l 2 2 F N + q x h q y F T l l θ
Therefore, the area below the three surfaces constitutes the safety zone. The intersection of these zones provides the critical overlying load at which arch failure occurs, as shown in Figure 9b. The projection of Figure 9b onto the qx-L plane is shown in Figure 9c.
The smaller the arch span L and the larger the lateral load qx, the greater the critical overlying load qy. With a larger qx, for smaller arch spans, the greater the qy required to maintain stability of the force chain arch. When the arch span L is very small, meaning the arch is relatively “flat”, it is difficult to maintain balance due to the close proximity of the load application point to the arch trajectory. Considering the actual range of loads, it is proposed that for very narrow force chain arches under very large lateral loads, stability can no longer be maintained by applying an overlying load (as shown in the left part of Figure 9c, when L < 200 mm).

5. Analysis of the Forces and Stability of the Solid–Fluid Transition Interface in Lateral Particle Flow

5.1. Force Analysis of the Force Chain Arch Formed by Lateral Particle Flow

The force chain arch effect, resulting from the solid–fluid transition, can extend horizontally. Particles were released laterally [36] from the right edge of the model (indicated by the red arrow in Figure 10a, with green dots representing the release points) using the biaxial compression bidirectional flow experimental apparatus for granular materials. This visually demonstrated the evolution from localized slippage to landslides and other geological disasters in slope bodies. The trajectory of the force chain arch is determined using the spatial autocorrelation coefficient method, and then, it is fitted, as shown in Figure 10b,c.
Similarly, force analysis is conducted on the force chain arch formed by the lateral release of particles. The force chain arch ACB represents the form of a semi-arch and can be fitted with the equation of a parabola opening to the right, with the arch span denoted as h and the arch height as l. The maximum value for l is L0 = 760 mm, which is the width of the model. The mechanical analysis is depicted in Figure 11a, where the horizontal reaction force at the arch foot near the release point is FH; the vertical reaction force is FV; and, due to the vertical load at the top, the stress is transmitted vertically downward as FR. Based on the static equilibrium condition at the arch foot near the right-side release point, it follows that
F x = q x h F H = 0 F y = F V q y L 0 l F R = 0 M = F H h q y L 0   2 l 2 2 F V l q x h h 2 = 0
The solution of Equation (15) yields
F H = q x h F V = h 2 2 l q x L 0   2 l 2 2 l q y F R = h 2 2 l q x L 0 l 2 2 l q y
As shown in Figure 11b, at any point C (x,y) on the arch, the normal force is FN; the tangential force is FT; and the angle between the line connecting C to the upper right corner and the horizontal direction is θ.
The forces at any point C (x,y) on the arch fulfill the equilibrium condition:
F x = F T sin θ y F N cos θ y F H + q x h y = 0 F y = F V F N sin θ y F T cos θ y q y l y = 0
which leads to the following equation
cos θ y sin θ y sin θ y cos θ y F N F T = q x h y F H q y l y + F V
and finally to Equation (19)
F N F T = cos θ y sin θ y sin θ y cos θ y 1 q x h y F H q y l y + F V = q y l y + F V sin θ y + ( q x h y F H ) cos θ y q y l y + F V cos θ y ( q x h y F H ) sin θ y
Substituting Equation (16) provides the expressions for the normal and tangential forces at any point on the arch:
F N = h 2 2 l q x L 0   2 l 2 2 l q y + q y l y sin θ y + q x ( h y h cos θ y F T = h 2 2 l q x L 0   2 l 2 2 l q y q y l y cos θ y q x ( h y + h sin θ y
As illustrated in Figure 12a,b, the normal force FN and tangential force FT on the arch both attain their maximum values on the far-right side (hereinafter referred to as the arch foot), with maximum absolute values of 16.91 kN and 15.05 kN, respectively. The normal force at the vertex located at the top of the model (hereinafter referred to as the arch apex) is zero.
Keeping the lateral load constant, the changes in normal forces at each point on the arch under different overlying loads are shown in Figure 13a, and the changes in tangential forces are shown in Figure 13b.
The data document that changes in the overlying load adversely affect both the normal force at the arch foot and tangential force at the arch apex, as shown in Figure 13a,b. The failure mode of the force chain arch may be due to yielding of the tangential force at the arch apex, causing a rightward collapse, or due to yielding of the normal force at the arch foot, inducing vertical movement of the arch foot.
The variation in normal forces at each point on the arch and the variation in tangential forces for a constant overlying load and under the influence of different lateral loads are illustrated in Figure 14a,b, respectively. Changes in the lateral load are detrimental to the tangential force at the arch apex and both the normal and tangential forces at the arch foot. Under such conditions, in addition to yielding of the tangential force at the arch apex and the normal force at the arch foot, the arch may also fail due to yielding of the tangential force at the arch foot. Rightward sliding of the particles within the model is a consequence of this type of failure, indicative of a landslide tendency.

5.2. Stability Analysis of the Force Chain Arch Formed by Lateral Particle Flow

Subsequently, the tangential force is calculated at the arch apex, as well as the normal and tangential forces at the arch foot, under varying overlying loads qy and arch spans h. Here, h is called an arch span because the arch trajectory is half a parabola opening to the right. These calculations determined the lateral loads qx required for these forces to attain their allowable stress. The red surface in Figure 15a represents the critical lateral load surface for tangential stretching, leading to the collapse at the arch apex, and the green surface marks the critical lateral load surface for normal buckling at the arch foot. The minimum value of qx derived from these surfaces, according to Equation (15), constitutes the critical lateral load required for arch equilibrium, which must fulfill the following requirements:
q x min q x ( F T < F T ) ,                             a r c h   a p e x q x ( F N < F N ) ,                           a r c h   f o o t
The critical lateral load surface for maintaining the balance of the force chain arch is presented in Figure 15b, with its projection onto the qx-h plane shown in Figure 15c. The diagrams document that the smaller the arch span h and the larger the overlying load qy, the greater the critical lateral load qx. When the arch span h and the overlying load qy are very small, as exhibited in the top-left corner in Figure 15c, maintaining balance is challenging due to the proximity of the load application point to the arch trajectory.
For different lateral loads qx and arch spans h, considering the tangential force at the arch apex and the normal force at the arch foot when calculating the critical overlying load, the critical overlying load qy required for these forces to attain their allowable stress is illustrated in Figure 16a, where the red surface represents the critical overlying load for tangential stretching, leading to the collapse at the arch apex; the green surface represents normal buckling at the arch foot; and the blue surface represents tangential stretching at the arch foot. The overlying load qy, which fulfills the arch equilibrium, is located above the red surface and below the blue surface, thus constituting the critical overlying load surface for the arch equilibrium, as shown in Figure 16b, with its projection onto the qx-h plane displayed in Figure 16c.
The results document that the larger the arch span h, or the larger the lateral load qx, the greater the critical overlying load qy. When the arch span and lateral load are both large, the balance conditions could not be satisfied, indicating that the force chain arch is in a state of instability under such conditions. In other words, a combination of horizontal geo-stress and overburden is needed to keep the slope stable. For high and steep slopes, this is difficult to achieve, and there is a potential danger of slope instability.

6. Conclusions

This work presents visualized force chain arches via photoelastic experiments and their mechanical research, as well as stability. The main results are as follows.
1.
Under biaxial compression conditions, the force chain arch formed within the granular medium via particle flow becomes the dividing line for solid–fluid transition. The particle assemblies above the force chain arch are in a stable solid state, still capable of bearing the overlying load, while those below the force chain arch are in a solid–fluid transitional state, experiencing less force. The force chain arch acts as an interface during the transition from solid to fluid in the granular system, separating the quasi-solid stable region from the solid–liquid transitional area. During this process, the force chain arch alters the original direction of load transfer, bearing most of the load transmitted from above and laterally.
2.
The experimental model area is subdivided into grids by combining the results from indoor photoelastic experiments and employing autocorrelation algorithms to identify the main direction of local force chains. The trace line of the solid–fluid transition interface is obtained and fitted, resulting in an equation, which describes the parabolic shape of this interface.
3.
A force and stability analysis is conducted on the fitted solid–fluid transition interface, i.e., the arch-shaped parabola. Under constant boundary load conditions on the solid–fluid transition interface caused by vertical particle flow, if the particle system is disturbed and the particles at the arch foot move, the horizontal force F H and vertical force F V at the arch foot change, leading to the disruption and rearrangement of the force chain arch. Under varying boundary load conditions, the arch apex and the arch foot are identified as critical sections.
4.
When the trapdoor is located at the bottom of the model, changes in the overlying load or lateral load can lead to normal buckling and tensile stretching failure at the arch feet, as well as tensile stretching failure at the arch apex.
5.
When the trapdoor is located on the right side of the model, changes in the overlying load adversely affect the normal force at the arch foot and the tangential force at the arch apex. Under different lateral loads, adverse effects on the tangential force at the arch apex and both the normal and tangential forces at the arch foot are observed.

7. Discussion

When the particles flow from the bottom of the model, the arch is broken due to apex collapse or foot shift toward the arch axis. When the grains flow from the right side of the model, the failure mode of the force chain arch may be rightward collapse due to yielding of the tangential force at the arch apex or vertical movement of the arch foot due to yielding of the normal force. In addition to yielding of the tangential force at the arch apex and normal force at the arch foot, the arch may fail due to yielding of the tangential force at the arch foot, leading to rightward particle movement within the model, indicative of a landslide tendency.
By analyzing the mechanical characteristics and stability of the force chain arch, we can evaluate the stress state of the loose rock and soil after excavation, predict the rock and soil mass stability in mining, slope or other engineering practices and finally prevent the potential geological disasters.

Author Contributions

Conceptualization, M.W.; Data curation, J.Z. and S.X.; Formal analysis, M.W.; Methodology, M.W.; Project administration, M.W.; Software, M.W.; Visualization, M.W.; Writing—original draft, M.W.; Writing—review and editing, J.Z. and S.X. All authors have read and agreed to the published version of the manuscript.

Funding

This work was funded by the Foundation of China Coal Technology and Engineering Group (CCTEG, Grant Number 2022-2-MS002, 2022-MS001).

Institutional Review Board Statement

Not applicable.

Informed Consent Statement

Not applicable.

Data Availability Statement

The original contributions presented in the study are included in the article, further inquiries can be directed to the corresponding author.

Conflicts of Interest

The authors declare that this study received funding from the Foundation of China Coal Technology and Engineering Group. The funder was not involved in the study design, collection, analysis, interpretation of data, the writing of this article or the decision to submit it for publication.

References

  1. Al-Naddaf, M.; Han, J.; Xu, C.; Jawad, S. Experimental investigation of soil arching mobilization and degradation under localized surface loading. J. Geotech. Geoenviron. Eng. 2019, 145, 04019114. [Google Scholar] [CrossRef]
  2. Bi, Z.; Gong, Q.; Guo, P.; Cheng, Q. Experimental study of the evolution of soil arching effect under cyclic loading based on trapdoor test and particle image velocimetry. Can. Geotech. J. 2019, 57, 903–920. [Google Scholar] [CrossRef]
  3. Qiao, L.; Chen, L.; Dasgupta, G.; Li, Q.; Li, Y. Surface characterization and frictional energy dissipation characteristics of deep granite under high stress conditions. Rock Mech. Rock Eng. 2019, 52, 1577–1589. [Google Scholar] [CrossRef]
  4. Chen, L.; Qiao, L.; Li, Q. Study on dynamic compaction characteristics of gravelly soils with crushing effect. Soil Dyn. Earthq. Eng. 2019, 120, 158–169. [Google Scholar] [CrossRef]
  5. Xi, X.; Yin, Z.; Yang, S.; Li, C.Q. Using artificial neural network to predict the fracture properties of the interfacial transition zone of concrete at the meso-scale. Eng. Fract. Mech. 2021, 242, 107488. [Google Scholar] [CrossRef]
  6. Cui, C. Seismic behavior and reinforcement mechanisms of earth dam and liquefiable foundation system by shaking table tests and numerical simulation. Soil Dyn. Earthq. Eng. 2023, 173, 108083. [Google Scholar] [CrossRef]
  7. Huang, J.; Zhang, Y.; Ouyang, X.; Xu, G. Lagged settlement in sandy cobble strata and earth pressure on shield tunnel. Math. Biosci. Eng. 2019, 16, 6209–6230. [Google Scholar] [CrossRef]
  8. Li, P.; Wang, F.; Fan, L.; Wang, H.; Ma, G. Analytical scrutiny of loosening pressure on deep twin-tunnels in rock formations. Tunn. Undergr. Space Technol. Inc. Trenchless Technol. Res. 2019, 83, 373–380. [Google Scholar] [CrossRef]
  9. Li, P.; Zou, H.; Wang, F.; Xiong, H. An analytical mechanism of limit support pressure on cutting face for deep tunnels in the sand. Comput. Geotech. 2020, 119, 103372. [Google Scholar] [CrossRef]
  10. Terzaghi, K. Theoretical Soil Mechanics; Wiley: New York, NY, USA, 1943. [Google Scholar] [CrossRef]
  11. Rodríguez, C.A.; Rodríguez-Pérez, Á.M.; López, R.; Hernández-Torres, J.A.; Caparrós-Mancera, J.J. A Finite Element Method Integrated with Terzaghi’s Principle to Estimate Settlement of a Building Due to Tunnel Construction. Buildings 2023, 13, 1343. [Google Scholar] [CrossRef]
  12. Chen, F.; Liu, Y.; Wang, Y.; Gu, Y.; Yu, Y.; Sun, J. Deformation and Force chain of Two-Dimensional Granular Systems under Continuous Loading. Materials 2023, 16, 5441. [Google Scholar] [CrossRef]
  13. Li, Q.; Zhang, Y.; Zhao, Y.; Zhu, Y.; Yan, Y. Study on Stability Discrimination Technology of Stope Arch Structure. Sustainability 2022, 14, 11082. [Google Scholar] [CrossRef]
  14. Handy, R. The Arch in Soil Arching. J. Geotech. Eng. ASCE 1985, 111, 302–318. [Google Scholar] [CrossRef]
  15. Wang, W.; Yen, B. Soil arching in slopes. J. Geotech. Eng. Div. 1974, 100, 61–78. [Google Scholar] [CrossRef]
  16. Kim, K.; Lee, D.; Cho, J.; Jeong, S.; Lee, S. The effect of arching pressure on a vertical circular shaft. Tunn. Undergr. Space Technol. Inc. Trenchless Technol. Res. 2013, 37, 10–21. [Google Scholar] [CrossRef]
  17. Shabanimashcool, M.; Bērziņš, A. A simplified approach to estimate anchoring capacity of blocky rock mass with pressure arch theory. Rock Mech. Rock Eng. 2023, 56, 7147–7175. [Google Scholar] [CrossRef]
  18. Li, W.; Zhang, C. Face stability analysis for a shield tunnel in anisotropic sands. Int. J. Geomech. 2020, 20, 04020043. [Google Scholar] [CrossRef]
  19. Li, W.; Zhang, C.; Zhang, D.; Ye, Z.; Tan, Z. Face stability of shield tunnels considering a kinematically admissible velocity field of soil arching. J. Rock Mech. Geotech. Eng. 2022, 14, 505–526. [Google Scholar] [CrossRef]
  20. Chevalier, B.; Combe, G.; Villard, P. Experimental and numerical study of the response of granular layer in the trap-door problem. AIP Conf. Proc. 2009, 1145, 649–652. [Google Scholar] [CrossRef]
  21. Chevalier, B.; Combe, G.; Villard, P. Experimental and discrete element modeling studies of the trapdoor problem: Influence of the macro-mechanical frictional parameters. Acta Geotech. Int. J. Geoengin. 2012, 7, 15–39. [Google Scholar] [CrossRef]
  22. Costa, Y.; Zornberg, J.; Bueno, B.; Costa, C. Failure mechanisms in sand over a deep active trapdoor. J. Geotech. Geoenviron. Eng. 2009, 135, 1741–1753. [Google Scholar] [CrossRef]
  23. Cui, C.; Wang, W.; Jin, F.; Huang, D. Discrete-element modeling of cemented granular material using mixed-mode cohesive zone model. J. Mater. Civ. Eng. 2020, 32, 04020031. [Google Scholar] [CrossRef]
  24. Iglesia, G.; Einstein, H.; Whitman, R. Investigation of soil arching with centrifuge tests. J. Geotech. Geoenviron. Eng. 2014, 140, 04013005. [Google Scholar] [CrossRef]
  25. Rui, R.; Van Tol, A.F.; Xia, Y.; Van Eekelen, S.; Hu, G. Investigation of soil-arching development in dense sand by 2D model tests. Geotech. Test. J. 2016, 39, 415–430. [Google Scholar] [CrossRef]
  26. Van Eekelen, S.; Bezuijen, A.; Lodder, H.; Van Tol, A. Model experiments on piled embankments. Part II. Geotext. Geomembr. 2012, 32, 82–94. [Google Scholar] [CrossRef]
  27. Van Eekelen, S.; Bezuijen, A.; Lodder, H.; Van Tol, A. An analytical model of arching in piled embankments. Geotext. Geomembr. 2013, 39, 78–102. [Google Scholar] [CrossRef]
  28. Bi, D.; Zhang, J.; Chakraborty, B.; Behringer, R. Jamming by shear. Nature 2011, 480, 355. [Google Scholar] [CrossRef]
  29. Behringer, R.; Chakraborty, B. The physics of jamming for granular materials: A review. Rep. Prog. Phys. 2019, 82, 12601. [Google Scholar] [CrossRef]
  30. Wang, M.; Wang, D.; Socolar, J.; Zheng, H.; Behringer, R. Jamming by shear in a dilating granular system. Granul. Matter 2019, 21, 102. [Google Scholar] [CrossRef]
  31. Wang, J.A.; Pang, W.D.; Liang, C.; Han, X. Photoelastic Experiment Apparatus of Aggregates with Bilateral Flowing. Chinese Patent CN204556449U, 12 August 2015. [Google Scholar]
  32. He, M.; Zhao, J.; Deng, B.; Zhang, Z. Effect of layered joints on rockburst in deep tunnels. Int. J. Coal Sci. Technol. 2022, 9, 21. [Google Scholar] [CrossRef]
  33. Wu, S.; Han, L.; Cheng, Z.; Zhang, X.; Cheng, H. Study on the limit equilibrium slice method considering characteristics of inter-slice normal forces distribution: The improved Spencer method. Environ. Earth Sci. 2019, 78, 1–18. [Google Scholar] [CrossRef]
  34. Wang, M.; Wang, J.-A.; Li, F.; Liang, C.; Yang, L. Arching of force chains in excavated granular material. Front. Earth Sci. 2024, 11, 1322038. [Google Scholar] [CrossRef]
  35. Zhang, J.; Zheng, Y.; Sun, J.; Qi, D. Flow prediction in spatiotemporal networks based on multitask deep learning. IEEE Trans. Knowl. Data Eng. 2020, 32, 468–478. [Google Scholar] [CrossRef]
  36. Wang, J.; Yang, L.; Li, F.; Wang, C. Force chains in top coal caving mining. Int. J. Rock Mech. Min. Sci. 2020, 127, 104218. [Google Scholar] [CrossRef]
Figure 1. (a) Schematic of the photoelastic system; (b) Set-up of the experimental apparatus.
Applsci 14 02485 g001
Figure 2. (a) Schematic of bidirectional loading on granular material; (b) Force chain network after particle release from the bottom.
Applsci 14 02485 g002
Figure 3. Force chain arch after particle release from the bottom: (a) Identified via autocorrelation algorithm; (b) Quadratic function fitting.
Applsci 14 02485 g003
Figure 4. Bottom particle flow: (a) Schematic of the force chain arch equilibrium; (b) Schematic of the forces at any point on the force chain arch.
Applsci 14 02485 g004
Figure 5. Under bottom particle flow, the forces at each point on the arch in equilibrium state: (a) Normal force FN; (b) Tangential force FT.
Applsci 14 02485 g005
Figure 6. Bottom particle flow with the changes in forces at various points on the arch under variation in the overlying load qy: (a) Normal force FN; (b) Tangential force FT; (c) The ratio of normal force to tangential force FN/FT.
Applsci 14 02485 g006
Figure 7. Bottom particle flow with the changes in forces at various points on the arch under variation in the lateral load qx: (a) Normal force FN; (b) Tangential force FT; (c) The ratio of normal force to tangential force FN/FT.
Applsci 14 02485 g007
Figure 8. Bottom particle flow: (a) The critical lateral loads for failure at unfavorable sections of the arch; (b) The critical lateral loads for arch failure; (c) A color projection of the critical lateral loads for arch failure.
Applsci 14 02485 g008
Figure 9. Bottom particle flow: (a) The critical overlying loads for failure at unfavorable sections on the arch; (b) The critical overlying loads for arch failure; (c) A color projection of the critical overlying loads for arch failure.
Applsci 14 02485 g009
Figure 10. (a) Network of force chains during lateral flow of granular material; (b) Fitting of the force chain arch (lateral release of particles); (c) The fitting function.
Applsci 14 02485 g010
Figure 11. Lateral particle release: (a) Force chain arch equilibrium analysis diagram; (b) Force diagram at any point on the force chain arch.
Applsci 14 02485 g011
Figure 12. Lateral particle release: (a) Normal force FN at each point on the arch in equilibrium; (b) Tangential force FT at each point on the arch in equilibrium.
Applsci 14 02485 g012
Figure 13. Lateral particle release under different overlying loads qy. (a) Changes in normal force FN at each point on the arch; (b) Changes in tangential force FT at each point on the arch.
Applsci 14 02485 g013
Figure 14. Lateral particle release under different lateral loads qx. (a) Changes in normal force FN at each point on the arch; (b) Changes in tangential force FT at each point on the arch.
Applsci 14 02485 g014
Figure 15. Lateral particle release: (a) The critical lateral loads for arch failure; (b) A color projection of the critical lateral loads for arch failure; (c) A color projection of the critical overlying loads for arch failure.
Applsci 14 02485 g015
Figure 16. Lateral particle release: (a) The critical overlying loads for failure at unfavorable sections on the arch; (b) The critical overlying loads for arch failure; (c) A color projection of the critical overlying loads for arch failure.
Applsci 14 02485 g016
Table 1. Comparison of model similarity ratio.
Actual
Length
Model
Length
Actual
Pressure
Model
Pressure
Length
Ratio
Pressure
Ratio
Density
Ratio
100 m760 mm12.5 MPa0.20 kN1301401.1
Disclaimer/Publisher’s Note: The statements, opinions and data contained in all publications are solely those of the individual author(s) and contributor(s) and not of MDPI and/or the editor(s). MDPI and/or the editor(s) disclaim responsibility for any injury to people or property resulting from any ideas, methods, instructions or products referred to in the content.

