1. Introduction
Although the etiology of dental crowding is diverse [
1,
2,
3], it has generally been thought that the presence of crowded teeth is attributed to maxillaries that do not have enough space to accommodate teeth. The belief that crowding is associated with the size of the dental arch is intuitive and is supported by research showing greater crowding in people with smaller dental arches [
4,
5]. In the pursuit of enhancing diagnostic precision and treatment planning in orthodontics, the accurate assessment of dental arch measurements stands as a critical element. Measurements such as dental arch perimetry, which is defined as the spatial capacity existing within the dental arch, designated for the alignment of teeth, have underscored the critical role that precise measurements on study casts play in the orthodontic diagnostic process [
6]. Arch perimetry can be determined by a careful examination of the space available (arch perimeter) and the space required (tooth width) [
7]. It is typically determined by measuring the distance from the mesial surface of the first permanent molar around the dental arch to the corresponding molar on the opposite side [
8].
Considering that dental arch dimension is a factor that can contribute to dental malocclusion [
9], determining the characteristics of dental arches is of paramount importance in orthodontic diagnosis and treatment planning, playing a key role in achieving optimal results. In addition to arch perimetry, among the crucial parameters, the assessment of the distance length between the second primary molars and the first permanent molars appears as a key factor, providing valuable information about the spatial relationships within the dental arch [
10].
The accurate determination of these arch characteristics facilitates precise diagnosis and treatment planning, enabling orthodontic practitioners to tailor interventions that address individual patient needs effectively. In the management of dental crowding, it is essential to measure the amount of space in the dental arch to determine the appropriate orthodontic treatment approach. In cases where space deficiency is borderline, expansion may offer a viable solution, allowing for the treatment of malocclusion without the need for extractions, provided the patient’s conditions allow this treatment alternative [
11,
12,
13]. During mixed dentition, due to the eruption of the permanent incisors as well as the larger mesiodistal width of the temporary molars compared to that of the premolars, there is an increase in the perimeter of the upper arch [
3]. Other authors have reported an increase in the perimeter of the dental arch by the end of permanent dentition, which is followed by a decrease in this size with age, especially in the mandibular arch [
14,
15].
Several authors have extensively explored and elucidated diverse techniques for dental arch measurements in orthodontics. These techniques encompass a spectrum of quantitative analyses, including but not limited to arch perimetry, arch width and arch length as well as inter-arch relationships. Traditionally, these measurements have been conducted using the conventional method involving holding metal wires along the intended distances to be assessed and then measuring the length of the wire, a technique which, while widely practiced, may exhibit inherent limitations in terms of precision and efficiency [
16]. Others have established it by applying a segmental arch technique based on a study cast with the help of digital calipers or by calculating the arch perimeter through mathematical means employing various equations and functions [
17,
18].
Despite the pivotal role this metric plays, the methods employed to measure dental arch perimetry have, until now, faced inherent challenges in terms of precision and reliability. This research, therefore, sets out on a groundbreaking endeavor to address these challenges through the development, calibration, and verification of a novel tool expressly designed for determining dental arch perimetry.
The aim of this study is therefore to develop, calibrate and verify a new tool for determining dental arch measurements in 40 study models. The comparative methods used were the conventional method using metal wire and a digital method using an electronic caliper.
2. Materials and Methods
2.1. Sample Selection and Instruments Used
The study used 40 study casts made in conformers meeting American Board of Orthodontics specifications with a top and bottom edge height of 13 mm (Leone SpA, Sesto Fiorentino, Florence, Italy). The plaster used for the models was a white, synthetic class III plaster (
Figure 1).
For conventional measurements, 0.6 mm cobalt-chromium wire was used, and heat-treated on the surface, with increased flexibility as well as a graduated ruler (
Figure 1).
A digital caliper (
Figure 1) with the following technical specifications was used for digital measurements: power supply: battery type CR2032-3V, measurement unit: mm/inch, measurement limits: 0–150 mm/0–6″, resolution: 0.01 mm/0.0005″, accuracy: 0–100 mm ± 0.02 mm/0.0001″, 100–150 mm ± 0.03 mm/0.0001″, measuring speed: 1.5 m/s, display: LCD.
For the development of the new dental arch measuring instrument, sketches were made (
Figure 2), which resulted in the final model
Figure 3.
2.2. Study Design
To achieve the purpose of this study, the dental arch perimeter, intermolar distance and anterior arch length of the upper arch were measured on 40 dental casts with the three methods. The inclusion criteria for the study material were the presence of mixed dentition and the exclusion criteria were the presence of fractures in the study models, the presence of teeth with deep carious processes that could lead to measurement errors and the presence of defects in the design of the study models.
The measurements of the dental arch perimeter were made between the mesial faces of the upper first permanent molars, as described below:
- -
The conventional measurement was made using the metal wire which was positioned in the middle of the dental arch;
- -
Digital measurement with the electronic caliper was carried out in six sectors;
- -
The measurement with the instrument was carried out using the tripod system of the instrument and by positioning the metal strip as perfectly stretched for the most accurate result (
Figure 4a).
The intermolar distance of the permanent and temporary teeth was measured at the occlusal faces in the central fossae of the upper first permanent molars and the upper second primary temporar molars, as follows:
- -
The conventional measurement was made with a ruler graded from millimeter to millimeter;
- -
The digital measurement was carried out with the help of the electronic screwdriver by placing the heads at the level of the landmarks;
- -
Measurement with the instrument was carried out by using the two rear cursors and the horizontal graduated ruler (
Figure 4b).
The anterior length of the arch is determined by the perpendicular from the interincisal point to the horizontal described by the line joining the central fossae of the upper first permanent molars measured, as described below:
- -
The conventional measurement was made with a ruler graduated from millimeter to millimeter;
- -
Digital measurement was performed using the electronic caliper by placing one end at the interincisal landmark and the other up to the posterior limit given by the line joining the central fossae of the upper first permanent molars;
- -
The measurement with the instrument was made by using the anterior cursor and the vertical graduated ruler (
Figure 4c).
2.3. Statistical Analysis
For the complex statistical analysis of the data, the following variables were constructed: arch perimeter, arch length, inter-molar temporary distance and inter-molar permanent distance. The type of measuring device was also considered as a factor: conventional measurement, instrument measurement or digital measurement.
For the measurements made with the electronic caliper, the recorded values were used using two decimals.
All replicates’ descriptive statistics (mean, min, max, standard deviation) were calculated.
The Kolmogorov–Smirnov and Shapiro–Wilk tests were used to study the normality of the data. Differences between means were analyzed with the Friedman test and the Wilcoxon signed-rank test. Differences were considered statistically significant for p-values < 0.05. All statistical analyses were performed with GraphPad Prism (v.5.0 software, Manufacture, San Diego, CA, USA).
2.4. Ethical Approval
Ethical approval was guaranteed by the Ethics Committee at Victor Babes University of Medicine and Pharmacy Timisoara: “Aviz CECS Nr.13/26.03.2021”. All methods were performed in accordance with the relevant guidelines and regulations.
3. Results
3.1. Results Regarding Dental Arch Perimeter
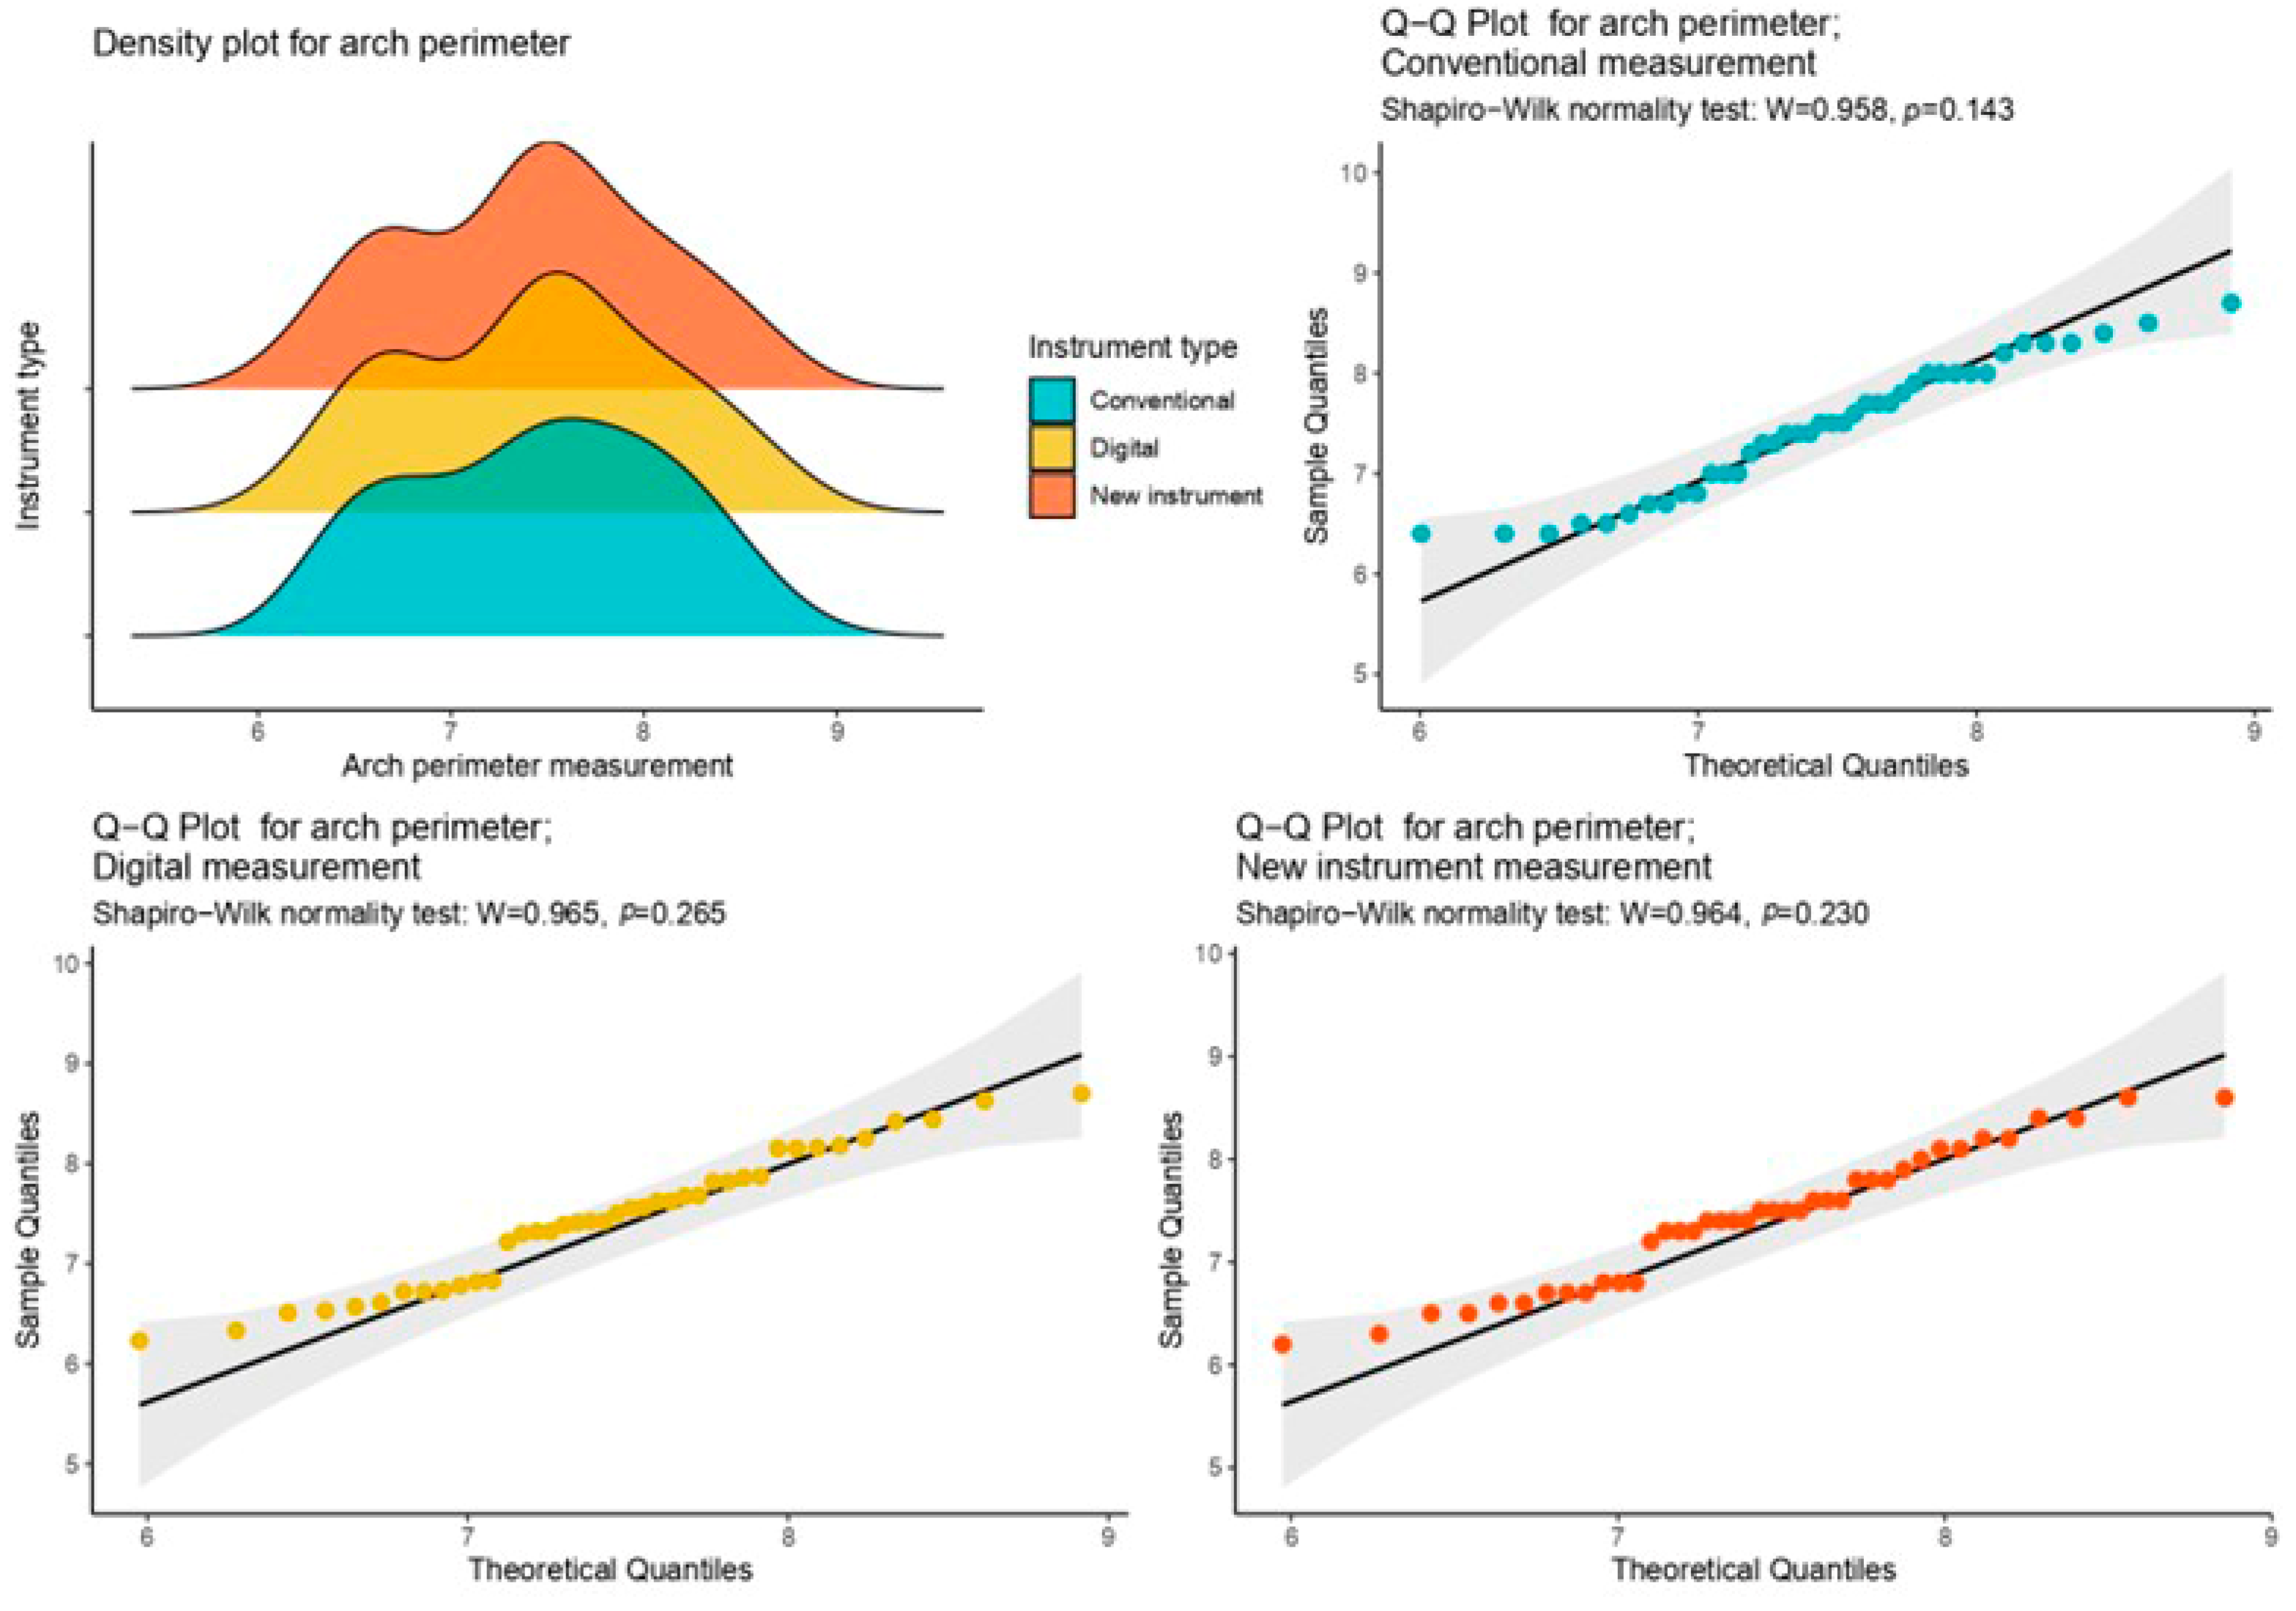
In the case of the arch perimeter variable, a minimum of 6.20 was observed in the case of measurements made with the new instrument. The minimum value of the mean of the measurements, i.e., 7.415, was obtained using the new instrument measurement method and the maximum of 7.46 with conventional measurement. The minimum standard deviation of 0.651 was obtained with the new measurement and the maximum of 0.664 with the digital measurement.
For an initial statistical analysis, the difference between the values obtained by measuring with the new instrument and the other two methods was carried out in order to calculate the margin of error. The twenty values obtained by the difference were summed and then their arithmetic mean was calculated. The value obtained is presented as a number with which 20% of the total value is associated in order to achieve the range.
Therefore, in the case of the arch perimeter, it was found that the data in the sample were normally distributed, producing the following results: Arch perimeter_classical measurement:
p = 0.143 > 0.05, Arch perimeter_instrument measurement:
p = 0.230 > 0.05, and Arch perimeter_digital measurement:
p = 0.265 > 0.05 (
Figure 5).
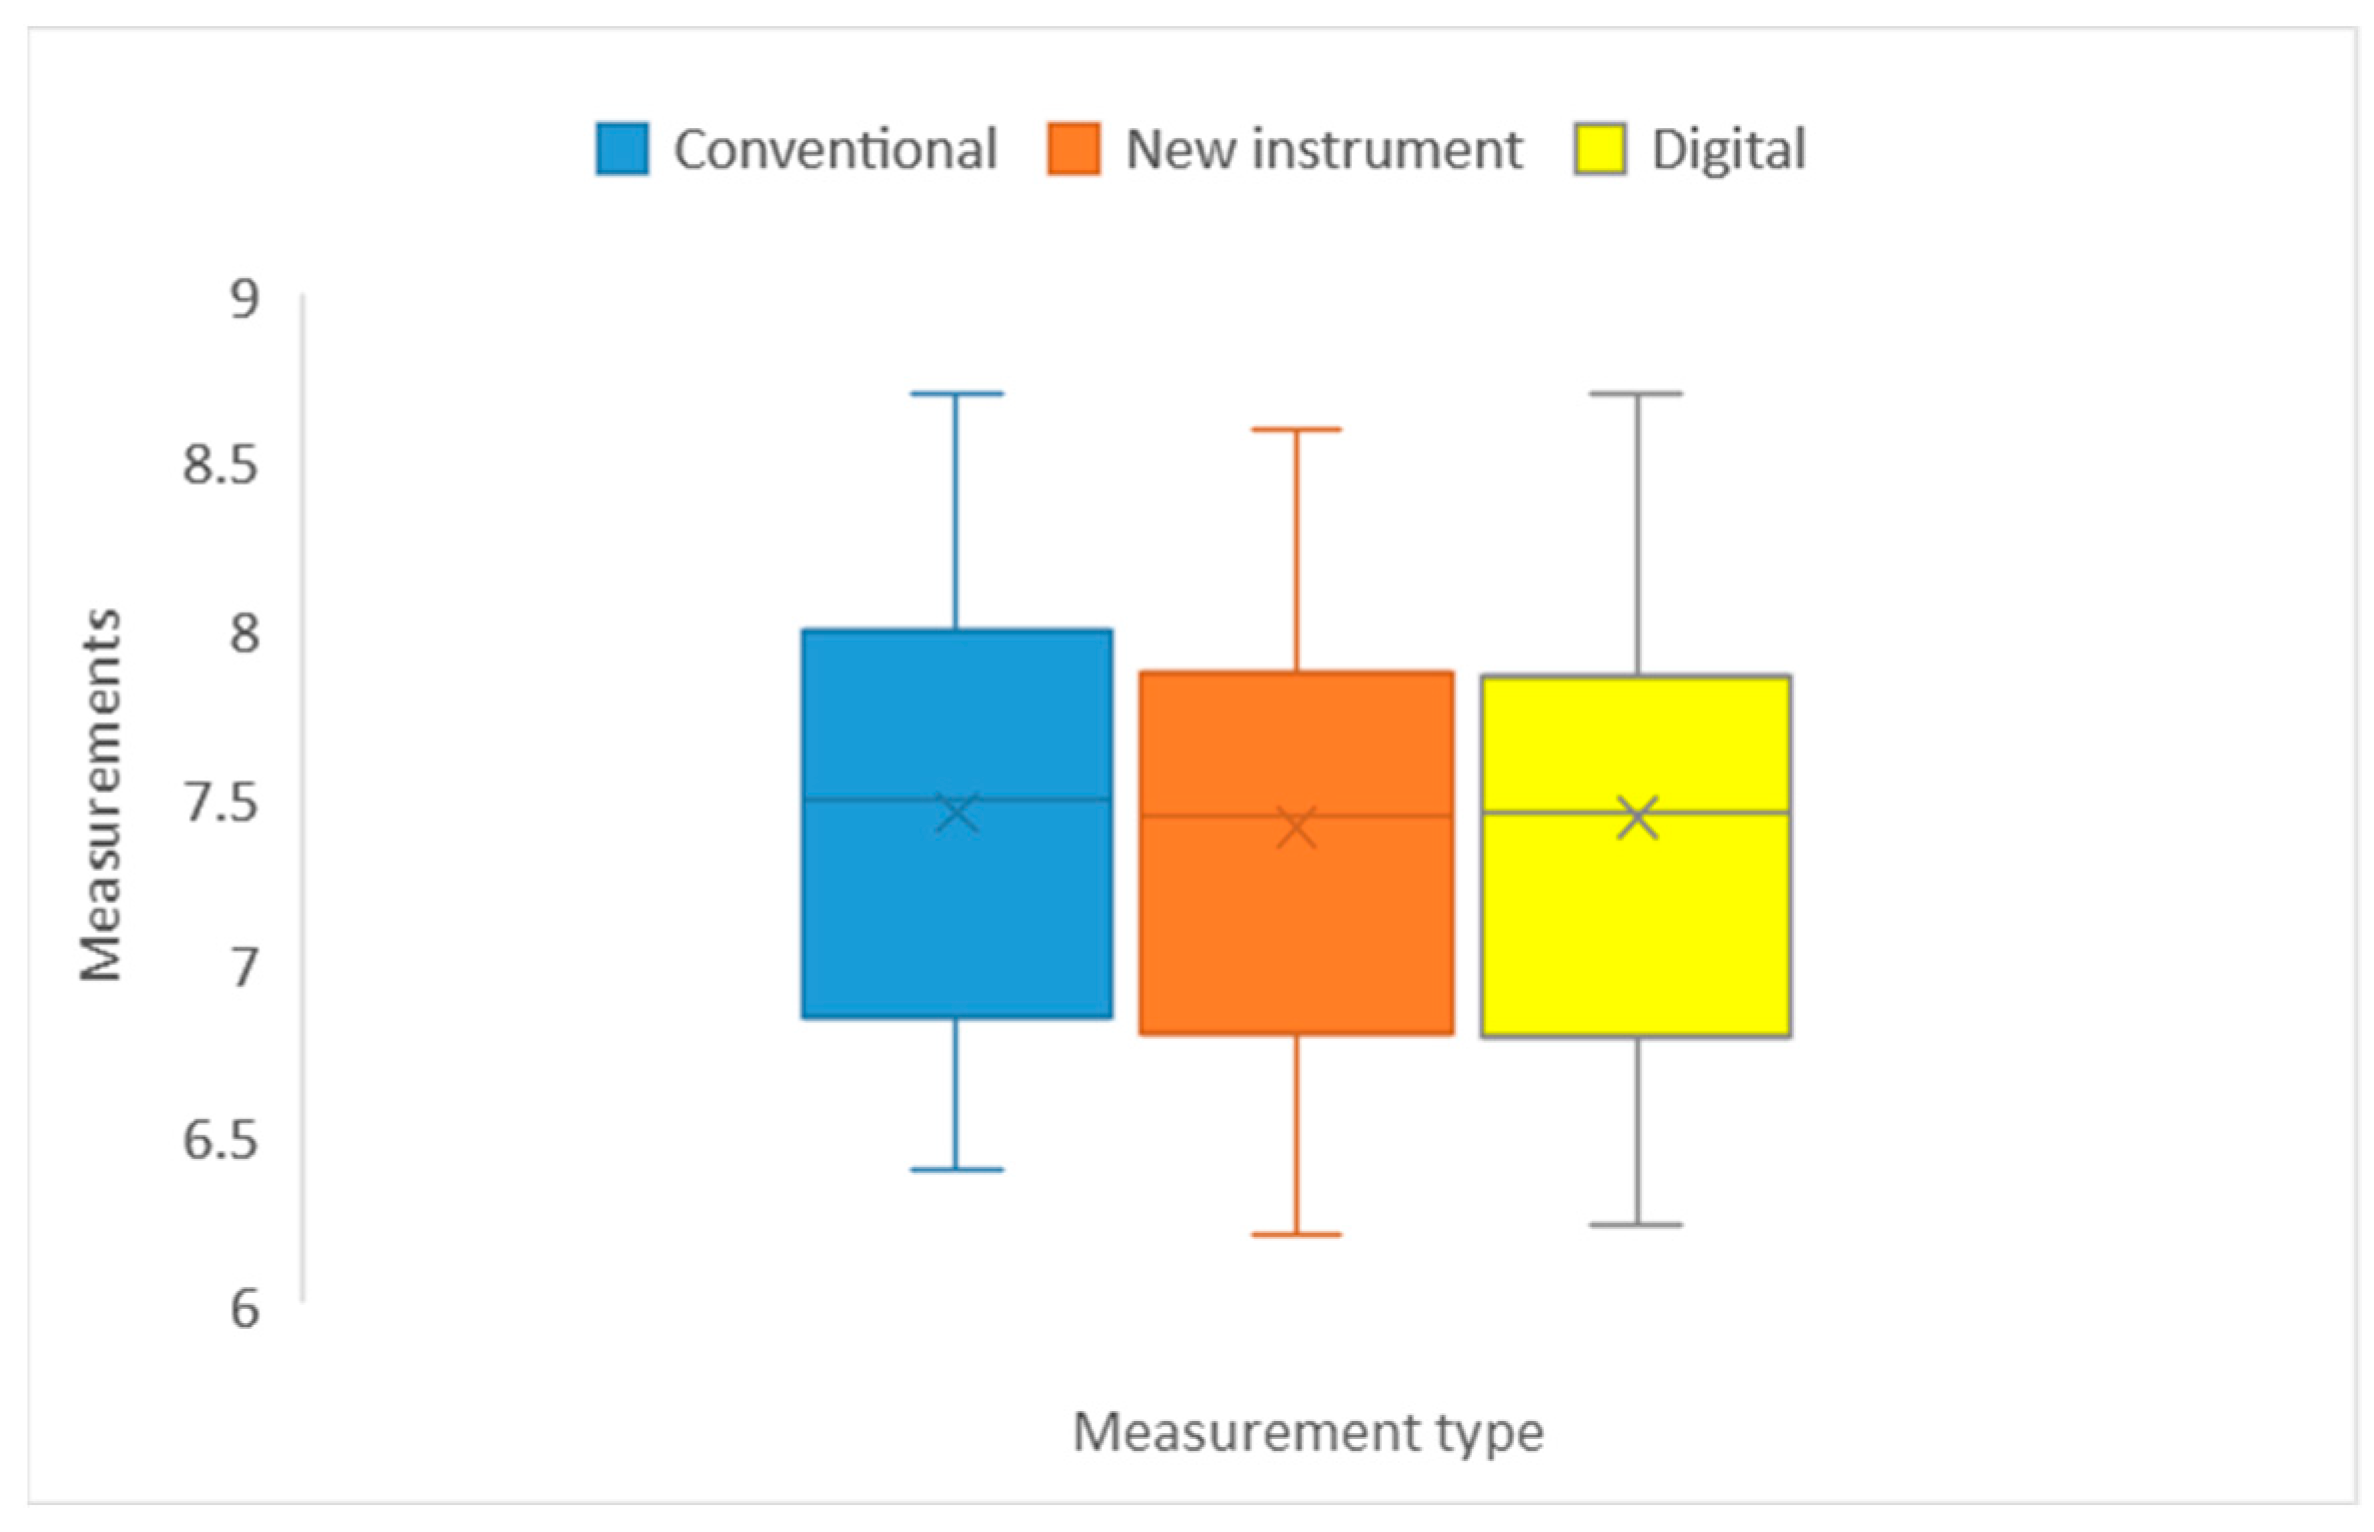
In the arch perimeter measurement, the difference from the conventional measurement was −0.045 mm ± 0.006 and that from the digital measurement was −0.025 ± 0.013 (
Figure 6).
Given the small sample size (40 measurements with each device), in order to apply statistical tests showing differences between the three types of measurements, it was necessary to check the normality of the data. This was undertaken by applying the Shapiro–Wilk test for each of the variables previously considered, taking as a factor the type of measurement.
Differences between the three types of measurement were determined by applying Friedman and Wilcoxon tests, respectively. The first test shows that there were significant differences in the variable Arch perimeter according to the measurement factor (χ2 = 12.4, p = 0.002 < 0.05).
Significant differences between the three types of measurements were obtained by applying the Wilcoxon test between the following parameters: arch perimeter_digital measurement and arch perimeter_instrument measurement (
p = 0.0000076 < 0. 05), and arch perimeter_instrument measurement and arch perimeter_conventional measurement (
p = 0.025 < 0.05): there were significant differences. Between arch perimeter_digital measurement and arch perimeter_conventional measurement, there were no significant differences (
p = 0.472 > 0.05) (
Figure 6).
3.2. Results Regarding Anterior Arch Length
In the case of the anterior arch length variable, a minimum of 3.20 was observed in the case of measurements made with the new and conventional instruments. The minimum value of the mean of the measurements, i.e., 4.02, was obtained by the new instrument measurement and the maximum of 4.04 with the digital measurement. It can be seen that the minimum standard deviation of 0.422 was obtained with the conventional measurement and the maximum of 0.423 with the digital measurement.
Concerning the anterior arch length, it was observed that the data within the sample did not deviate from a normal distribution. The resultant findings are as follows: the classical measurement of the arch perimeter yields a
p-value of 0.081, surpassing the significance threshold of 0.05. Similarly, the instrument measurement produces a
p-value of 0.095 (>0.05), and the digital measurement results in a
p-value of 0.058 (>0.05) (
Figure 7).
For the measurement of the anterior arch length, the difference from the conventional measurement was −0.00025 ± 0.001 and from the digital measurement −0.02 ± 0.0006 (
Figure 8).
Significant differences among the three measurement types were identified through the Wilcoxon test applied in the case of anterior arch length to the following parameters: digital measurement–new instrument
p = 0.000000424 < 0.05. Between conventional measurement and new instrument measurement (
p = 0.932 > 0.05), there are no significant statistical differences. The same is observed in the case of conventional measurement and digital measurement
p = 0.06 > 0.05) (
Figure 8).
3.3. Results Regarding Intermolar Distance of Upper Primary Second Molars
In the case of the 40 measurements regarding the intermolar distance at the level of the upper second primary molars, a minimum of 3.1 is observed in the case of measurements made with the new and conventional instruments. The minimum value of the mean of the measurements, i.e., 3.74, was obtained by the new instrument measurement and the maximum of 3.767 with the digital measurement. It can be seen that the minimum standard deviation of 0.301 was obtained with the new instrument and the maximum of 0.320 with the conventional measurement.
In the context of the intermolar distance of the upper primary second molars, the analysis reveals a normal distribution of data in the sample. The outcomes are as follows: for classical measurement, the
p-value is 0.204 (>0.05); for instrument measurement, it is 0.455 (>0.05); and for digital measurement, it is 0.607 (>0.05) (
Figure 9).
For the measurement of the intermolar distance of the upper second temporary molars, the difference from the conventional measurement was −0.015 ± 0.019 and from the digital measurement 0.38 ± 0.006 (
Figure 10).
When performing a Friedman test in the case of the intermolar distance of upper primary second molars, significant differences were found: (χ2 = 14.1, p ≤ 0.000860005).
The Wilcoxon test revealed notable disparities among the three measurement types when applied to the following parameters: digital measurement–new instrument measurement (
p = 0.000277 < 0.05). Between conventional measurement and digital measurement there were no significant differences in the case of intermolar distance of upper primary second molars when applying the Wilcoxon test (
p = 0.304 > 0.05). The same was observed between conventional measurement and new instrument (
p = 0.206 > 0.05) (
Figure 10).
3.4. Results Regarding the Intermolar Distance of Upper First Permanent Molars
Regarding the intermolar distance at the level of the upper first permanent molars, it was observed that the minimum value was 3.1 for conventional and new instrument measurements and the maximum value was recorded in the case of digital measurement: 5.42. The minimum value of the mean of the measurements, i.e., 3.747, was obtained by the new instrument measurement and the maximum of 3.767 with the digital measurement. It can be seen that the minimum standard deviation of 0.301 was obtained with the new instrument and the maximum of 0.320 with the conventional measurement.
In the examination of the intermolar distance of upper first permanent molars, it is evident that the data within the sample did not deviate from a normal distribution. The obtained results are as follows: classical measurement yields a
p-value of 0.354, surpassing the significance threshold of 0.05; instrument measurement produces a
p-value of 0.206 (>0.05); and digital measurement results in a
p-value of 0.346 (>0.05) (
Figure 11).
For the measurement of the intermolar distance of the upper permanent molars, the difference from the conventional measurement was −0.02 ± 0.01 and from the digital measurement −0.02 ± 0.001 (
Figure 12).
The Wilcoxon test exposed significant differences among the three measurement types when applied to the specified parameters: digital measurement versus new instrument measurement (
p = 0.007 < 0.05). In the case of conventional measurement–digital measurement (
p = 0.712 > 0.05) and conventional measurement–new instrument measurement (
p = 0.712 > 0.05), no significant differences have been observed (
Figure 12).
4. Discussion
In this study, the following parameters were measured on 40 dental study casts: dental arch perimeter, intermolar distance at the level of the maxillary first permanent molars and at the level of the second deciduous molars, and the anterior arch length. Measurements were performed in three different ways to explore whether the use of the new measuring instrument could be a worthwhile choice for measurements during orthodontic diagnosis and treatment planning. Other studies have also attempted to investigate alternative/complementary methods to help measure dental arch parameters for better case planning in orthodontics [
19,
20,
21].
Following the statistical analysis of the 480 values obtained, in terms of the differences between measurement with the proposed instrument and the conventional and digital methods, the greatest differences were observed in the measurement of the parameter “Arch perimeter”, obtaining an average value of 0.045 ± 0.006 mm between the measurement with the new instrument and that with the conventional method using graduated rulers, as opposed to a value of 0.025 ± 0.01 for the difference from the digital measurement. This shows the limitations that the conventional method has compared to digital measurement methods and is in accordance with the literature [
21,
22,
23,
24].
The Wilcoxon test, a non-parametric bivariate test, was used to identify the statistical significance of the differences identified for the variables derived from the samples obtained, and it was observed that in the case of the digital caliper and our instrument measurements, there were significant differences in the case of dental arch perimetry. Our findings are in agreement with other studies that have compared various digital methods of measuring the dental arch with conventional methods such as using a metal wire or by the help of digital calipers [
25,
26].
For the parameter “intermolar distance of permanent first molars”, the standard deviation showed values without significant differences. These data are in contrast to the data obtained in the studies by Schieffer et al. [
27] and Mathur et al. [
19] and Jiménez-Gayosso et al. [
28], who obtained significant differences when they measured the intermolar distance by using digital methods. These results show that our measuring device is not affected by the longer distances that are measured when evaluating this parameter and could be a reliable option when evaluating this parameter rather than the digital or conventional methods with the help of graduated rulers.
For arch length, our data correspond to those in the literature. The standard deviation showed no significant differences when comparing the three methods. These data correspond with those obtained by Mathur et al. [
19] and Leifert et al. [
29].
For the intermolar distance of primary molars, intermolar distance of permanent molars and anterior arch length, the standard deviation showed values without significant differences. This can also be attributed to the fact that the sagittal and transverse plane measurement methods do not involve errors as large as the perimetry measurement.
This analysis shows the advantages of using the proposed instrument over the conventional measurement method to determine the perimeter of the dental arch, because errors may occur during the determination due to the difficulty of using the conventional method and its lack of accuracy.
The creation of this dental arch measuring instrument, constituted as a system of bodies with individual mobility that can be used for value measurements, both in sagittal and transversal planes, for the determination of the intermolar distance and arch length, as well as of a non-linear surface such as the arch perimeter, constituted a reduction in the time allocated to the measurements as well as an increase in the accuracy of the values given by the well-defined markings on the sliders of the instrument. Another advantage of its use is the reduced time required to carry out all the measurements on a model with a single instrument, without having to use at least two methods, as for classical determinations.
This study was conducted as a pilot investigation to introduce and evaluate a new orthodontic measurement device. The limitations of this study are represented by the small sample of study casts analyzed. Due to the small sample size (40 measurements for each parameter), the data became non-parametric and it was necessary to check their normality using the Shapiro–Wilk and Kolmogorov–Smirnov tests, which showed a symmetrical distribution of values. Future investigations will aim to provide a more comprehensive analysis, robust validation and broader applicability of the new orthodontic measurement device on larger sample sizes.
In our pilot study on enhancing diagnostic accuracy in orthodontics, we introduced a new tool for dental arch measurements. While our tool shows promise, it is crucial to consider emerging alternatives like scanning models or intraoral scanning. These methods offer non-invasive options with advantages in precision and patient comfort. Notably, our tool may also provide a more cost-effective solution compared to intraoral scanners. As we look to the future of orthodontic diagnostics, it is important to assess and adapt our methods to stay at the forefront of evolving technology while keeping affordability in mind.
5. Conclusions
After reviewing the literature, it was not possible to identify another type of device that could meet several conditions simultaneously when performing dental arch measurements. The unique design of this tool aimed to fulfill multiple conditions simultaneously, effectively overcoming challenges frequently encountered in daily orthodontic practice. Our investigation involved comparing the proposed instrument with established auxiliary devices such as digital calipers and graduated rulers, both recognized for their efficiency over time but often proving time-consuming in practice.
The major advantage of using the instrument is in taking several measurements at the same time by correctly placing the sliders and the graduated rubber band. The instrument is easy to use and its implementation in dentistry during treatment planning could be useful.
As far as the values obtained with the suggested instrument are concerned, they were similar to those obtained with conventional measuring methods such as the graduated ruler or the metal wire and very close to digital measurement with electronic calipers, a method with increased accuracy.
The demonstrated consistency with established techniques attests to the validity and reliability of our tool, instilling confidence in its implementation. Beyond immediate clinical applications, the potential cost-effectiveness of our device compared to measurements performed with the aid of intraoral scanners could be a decisive factor in addressing economic considerations within orthodontic practices. As intraoral scanners become more prevalent and the cost of technology remains a pertinent consideration, our instrument offers a compelling alternative that balances accuracy and efficiency. The integration of our instrument into routine practice holds the promise of optimizing patient outcomes, contributing to efficiency, and shaping the evolving landscape of orthodontics.
Author Contributions
Conceptualization: A.-N.N.-S., V.T.A., D.J., A.G., R.O., C.S. and D.L.; methodology: A.-N.N.-S., V.T.A., A.G. and R.O.; software: D.L., A.-N.N.-S. and D.J.; validation: D.L., C.S. and A.G.; formal analysis: A.-N.N.-S., V.T.A., A.G. and D.L.; investigation: A.-N.N.-S., V.T.A. and D.J.; resources: A.-N.N.-S., V.T.A., D.J., A.G., R.O., C.S. and D.L.; data curation: D.L., C.S., R.O. and D.J.; writing—original draft preparation: A.-N.N.-S., V.T.A., D.J. and A.G.; writing—review and editing: A.-N.N.-S., V.T.A. and C.S.; visualization: A.G., V.T.A., D.L. and R.O.; supervision: A.G., D.J. and C.S. All authors have read and agreed to the published version of the manuscript.
Funding
This research has received funding for publication expenses from University of Medicine and Pharmacy “Victor Babeş” Timisoara, 9 No., Revolutiei Bv., 300041 Timisoara, Romania.
Institutional Review Board Statement
This study was conducted in accordance with the Declaration of Helsinki and approved by the Institutional Ethics Committee of the Victor Babes University of Medicine and Pharmacy Timisoara (Nr.13/26.03.2021).
Informed Consent Statement
Informed consent was obtained from all subjects involved in the study.
Data Availability Statement
Data is contained within the article.
Conflicts of Interest
The authors declare no conflicts of interest.
References
- Buschang, P.H. Class I Malocclusions—The Development and Etiology of Mandibular Malalignments. Semin. Orthod. 2014, 20, 3–15. [Google Scholar] [CrossRef]
- Crossley, A.M.; Campbell, P.M.; Tadlock, L.P.; Schneiderman, E.; Buschang, P.H. Is There a Relationship between Dental Crowding and the Size of the Maxillary or Mandibular Apical Base? Angle Orthod. 2020, 90, 216–223. [Google Scholar] [CrossRef] [PubMed]
- Normando, D.; Almeida, M.A.O.; Quintão, C.C.A. Dental Crowding. Angle Orthod. 2013, 83, 10–15. [Google Scholar] [CrossRef]
- Bernabé, E.; Castillo, C.E.D.; Flores-Mir, C. Intra-Arch Occlusal Indicators of Crowding in the Permanent Dentition. Am. J. Orthod. Dentofac. Orthop. 2005, 128, 220–225. [Google Scholar] [CrossRef] [PubMed]
- Poosti, M.; Jalali, T. Tooth Size and Arch Dimension in Uncrowded versus Crowded Class I Malocclusions. J. Contemp. Dent. Pract. 2007, 8, 45–52. [Google Scholar] [CrossRef]
- Al-Ansari, N.B.; Abdul Ameer, S.A.; Nahidh, M. A New Method for Prediction of Dental Arch Perimeter. Clin. Cosmet. Investig. Dent. 2019, 11, 393–397. [Google Scholar] [CrossRef]
- Lucchese, A.; Porcù, F.; Dolci, F. Effects of Various Stripping Techniques on Surface Enamel. J. Clin. Orthod. JCO 2001, 35, 691–695. [Google Scholar]
- Kareem, F.A.; Rauf, A.M.; Noori, A.J.; Ali Mahmood, T.M. Prediction of the Dental Arch Perimeter in a Kurdish Sample in Sulaimani City Based on Other Linear Dental Arch Measurements as a Malocclusion Preventive Measure. Comput. Math. Methods Med. 2020, 2020, 8869996. [Google Scholar] [CrossRef]
- Devakrishnan, D.; Gnansambandam, V.; Kandasamy, S.; Sengottuvel, N.; Kumaragurubaran, P.; Rajasekaran, M. Comparative Study of Tooth Size and Arch Dimensions in Class I Crowded, Proclined Malocclusion and Class I Normal Occlusion. J. Pharm. Bioallied Sci. 2021, 13, S783–S787. [Google Scholar] [CrossRef]
- Babu Kl, G.; Gururaj Hebbar, K. Gender Determination Using Dental Arch Characteristics among a South Indian Pediatric Population: A Morphometric Study. Contemp. Pediatr. Dent. 2023, 4, 46–56. [Google Scholar] [CrossRef]
- Noroozi, H.; Djavid, G.E.; Moeinzad, H.; Teimouri, A.P. Prediction of Arch Perimeter Changes Due to Orthodontic Treatment. Am. J. Orthod. Dentofac. Orthop. 2002, 122, 601–607. [Google Scholar] [CrossRef] [PubMed]
- Paulino, V.; Paredes, V.; Gandia, J.L.; Cibrian, R. Prediction of Arch Length Based on Intercanine Width. Eur. J. Orthod. 2008, 30, 295–298. [Google Scholar] [CrossRef] [PubMed]
- Patano, A.; Malcangi, G.; Inchingolo, A.D.; Garofoli, G.; De Leonardis, N.; Azzollini, D.; Latini, G.; Mancini, A.; Carpentiere, V.; Laudadio, C.; et al. Mandibular Crowding: Diagnosis and Management—A Scoping Review. J. Pers. Med. 2023, 13, 774. [Google Scholar] [CrossRef] [PubMed]
- Eslambolchi, S.; Woodside, D.G.; Rossouw, P.E. A Descriptive Study of Mandibular Incisor Alignment in Untreated Subjects. Am. J. Orthod. Dentofac. Orthop. 2008, 133, 343–353. [Google Scholar] [CrossRef] [PubMed]
- Maspero, C.; Abate, A.; Inchingolo, F.; Dolci, C.; Cagetti, M.G.; Tartaglia, G.M. Incidental Finding in Pre-Orthodontic Treatment Radiographs of an Aural Foreign Body: A Case Report. Children 2022, 9, 421. [Google Scholar] [CrossRef] [PubMed]
- Bishara, S.E.; Bayati, P.; Jakobsen, J.R. Longitudinal Comparisons of Dental Arch Changes in Normal and Untreated Class II, Division 1 Subjects and Their Clinical Implications. Am. J. Orthod. Dentofac. Orthop. 1996, 110, 483–489. [Google Scholar] [CrossRef]
- Bishara, S.E.; Jakobsen, J.R.; Treder, J.E.; Stasl, M.J. Changes in the Maxillary and Mandibular Tooth Size-Arch Length Relationship from Early Adolescence to Early Adulthood. Am. J. Orthod. Dentofac. Orthop. 1989, 95, 46–59. [Google Scholar] [CrossRef]
- Al-Khatieeb, M.M.; Layth, M.K.N.; Mushriq, F. Al-Janabi A New Calibration Procedure for Expectation of Arch Length. J. Bagh. Coll. Dent. 2012, 24, 120–126. [Google Scholar]
- Mathur, S.; Pahuja, N.; Doneria, D. Comparative Evaluation of Accuracy of Intraoral Scanners vs. Conventional Method in Establishing Dental Measurements in Mixed Dentition. World J. Dent. 2023, 14, 419–424. [Google Scholar] [CrossRef]
- Lu, X.-X.; Yang, K.; Zhang, B.-Z.; Wang, J.-H.; Du, Y.; Chen, Y.-J.; Wang, X.-J. Measurement of the Morphological Data of Primary Teeth in Northwest China. Front. Pediatr. 2022, 10, 1010423. [Google Scholar] [CrossRef]
- Al-Dulaimy, D.A.; Al-Khannaq, M.R.A.; Nahidh, M. Conventional Versus Digital Assessment of Dental Arches’ Perimeters in Mixed Dentition. J. Hunan Univ. Nat. Sci. 2022, 49, 101–111. [Google Scholar] [CrossRef]
- Battagel, J.M. Individualized Catenary Curves: Their Relationship to Arch Form and Perimeter. Br. J. Orthod. 1996, 23, 21–28. [Google Scholar] [CrossRef]
- Santoro, M.; Galkin, S.; Teredesai, M.; Nicolay, O.F.; Cangialosi, T.J. Comparison of Measurements Made on Digital and Plaster Models. Am. J. Orthod. Dentofac. Orthop. 2003, 124, 101–105. [Google Scholar] [CrossRef]
- Quimby, M.L.; Vig, K.W.L.; Rashid, R.G.; Firestone, A.R. The Accuracy and Reliability of Measurements Made on Computer-Based Digital Models. Angle Orthod. 2004, 74, 298–303. [Google Scholar] [CrossRef]
- Chen, Y.-C.; Chen, C.Y.-H.; Ko, E.W.-C. Compare Two Methods of Dental Arch Length Measurements on Digital Dental Models. Taiwan. J. Orthod. 2021, 33, 3. [Google Scholar] [CrossRef]
- Schirmer, U.R.; Wiltshire, W.A. Manual and Computer-Aided Space Analysis: A Comparative Study. Am. J. Orthod. Dentofac. Orthop. 1997, 112, 676–680. [Google Scholar] [CrossRef]
- Schieffer, L.; Latzko, L.; Ulmer, H.; Schenz-Spisic, N.; Lepperdinger, U.; Paulus, M.; Crismani, A.G. Comparison between Stone and Digital Cast Measurements in Mixed Dentition: Validity, Reliability, Reproducibility, and Objectivity. J. Orofac. Orthop. Fortschritte Kieferorthopädie 2022, 83, 75–84. [Google Scholar] [CrossRef] [PubMed]
- Jiménez-Gayosso, S.I.; Lara-Carrillo, E.; López-González, S.; Medina-Solís, C.E.; Scougall-Vilchis, R.J.; Hernández-Martínez, C.T.; Colomé-Ruiz, G.E.; Escoffié-Ramirez, M. Difference between Manual and Digital Measurements of Dental Arches of Orthodontic Patients. Medicine 2018, 97, e10887. [Google Scholar] [CrossRef] [PubMed]
- Leifert, M.F.; Leifert, M.M.; Efstratiadis, S.S.; Cangialosi, T.J. Comparison of Space Analysis Evaluations with Digital Models and Plaster Dental Casts. Am. J. Orthod. Dentofac. Orthop. 2009, 136, 16.e1–16.e4. [Google Scholar] [CrossRef]
Figure 1.
The procedures used for measuring: (a) study cast; (b) conventional measurement using metal wire. Digital measurements using an electronic caliper (c).
Figure 1.
The procedures used for measuring: (a) study cast; (b) conventional measurement using metal wire. Digital measurements using an electronic caliper (c).
Figure 2.
Instrument for determining dental arch perimetry main sketch: 1. screw for fixing the sleeve, 2. cursor with marker, 3. graduated ruler, 4. slotted element, 5. graduated elastic band, 6. screw for fixing the sleeve, 7. cursor with marker, 8. graduated ruler, 9. slotted element, 10. hinge for end of strip “5”, 11. hinge for end of strip “5”, 12. rivets, 13. slider with marker and sleeve for fixing ruler, 14. screw for fixing the cursor.
Figure 3.
Final version of the dental arch perimetry measuring tool.
Figure 3.
Final version of the dental arch perimetry measuring tool.
Figure 4.
Measuring the dental perimeter with the instrument: (a) dental arch perimeter, (b) intermolar distance, (c) arch length.
Figure 4.
Measuring the dental perimeter with the instrument: (a) dental arch perimeter, (b) intermolar distance, (c) arch length.
Figure 5.
Density and quantile–quantile plots for the measurement distributions of arch perimeter corresponding to the type of measurement.
Figure 5.
Density and quantile–quantile plots for the measurement distributions of arch perimeter corresponding to the type of measurement.
Figure 6.
Box and whisker plots for arch perimeter.
Figure 6.
Box and whisker plots for arch perimeter.
Figure 7.
Density and quantile–quantile plots for the measurement distributions of anterior arch length corresponding to the type of measurement.
Figure 7.
Density and quantile–quantile plots for the measurement distributions of anterior arch length corresponding to the type of measurement.
Figure 8.
Box and whisker plots for arch length. The distinctions among the three measurement types were assessed using Friedman and Wilcoxon tests, and also in the case of anterior arch length. The initial test indicates that there are noteworthy variations in the anterior arch length variable concerning the measurement factor (χ2 = 37.2, p = 0.00000000832 < 0.05).
Figure 9.
Density and quantile–quantile plots for the measurement distributions regarding the intermolar distance of upper primary second molars corresponding to the type of measurement.
Figure 9.
Density and quantile–quantile plots for the measurement distributions regarding the intermolar distance of upper primary second molars corresponding to the type of measurement.
Figure 10.
Box and whisker plots for intermolar distance–primary second molars.
Figure 10.
Box and whisker plots for intermolar distance–primary second molars.
Figure 11.
Density and quantile–quantile plots for the measurement distributions regarding the intermolar distance of the upper first permanent molars corresponding to the type of measurement.
Figure 11.
Density and quantile–quantile plots for the measurement distributions regarding the intermolar distance of the upper first permanent molars corresponding to the type of measurement.
Figure 12.
Box and whisker plots for intermolar distance–permanent molars for the measurements regarding the intermolar distance of the upper first permanent molars; when applying the Friedman test, it can be revealed that there are significant differences according to the measurement factor (χ2 = 14.1, p = 0.000860 < 0.05).
| Disclaimer/Publisher’s Note: The statements, opinions and data contained in all publications are solely those of the individual author(s) and contributor(s) and not of MDPI and/or the editor(s). MDPI and/or the editor(s) disclaim responsibility for any injury to people or property resulting from any ideas, methods, instructions or products referred to in the content. |
© 2024 by the authors. Licensee MDPI, Basel, Switzerland. This article is an open access article distributed under the terms and conditions of the Creative Commons Attribution (CC BY) license (https://creativecommons.org/licenses/by/4.0/).

 ,
, 


