Article

Application of Enhanced YOLOX for Debris Flow Detection in Remote Sensing Images

1
College of Science, Hubei University of Technology, Wuhan 430068, China
2
State Key Laboratory of Information Engineering in Surveying, Mapping and Remote Sensing, Wuhan University, Wuhan 430072, China
3
Key Laboratory of Geological Survey and Evaluation of Ministry of Education, China University of Geosciences, Wuhan 430074, China
*
Author to whom correspondence should be addressed.
Appl. Sci. 2024, 14(5), 2158; https://doi.org/10.3390/app14052158
Submission received: 15 January 2024 / Revised: 23 February 2024 / Accepted: 27 February 2024 / Published: 5 March 2024
(This article belongs to the Special Issue Deep Learning in Satellite Remote Sensing Applications)

Abstract

:
Addressing the limitations, including low automation, slow recognition speed, and limited universality, of current mudslide disaster detection techniques in remote sensing imagery, this study employs deep learning methods for enhanced mudslide disaster detection. This study evaluated six object detection models: YOLOv3, YOLOv4, YOLOv5, YOLOv7, YOLOv8, and YOLOX, conducting experiments on remote sensing image data in the study area. Utilizing transfer learning, mudslide remote sensing images were fed into these six models under identical experimental conditions for training. The experimental results demonstrate that YOLOX-Nano’s comprehensive performance surpasses that of the other models. Consequently, this study introduces an enhanced model based on YOLOX-Nano (RS-YOLOX-Nano), aimed at further improving the model’s generalization capabilities and detection performance in remote sensing imagery. The enhanced model achieves a mean average precision ( m A P ) value of 86.04%, a 3.53% increase over the original model, and boasts a precision rate of 89.61%. Compared to the conventional YOLOX-Nano algorithm, the enhanced model demonstrates superior efficacy in detecting mudflow targets within remote sensing imagery.

1. Introduction

China’s vast territory, with its complex and variable terrain in the east and west, experiences frequent geological disasters. Among these, mudslides, occurring in steep terrain areas due to heavy rain, heavy snow, or other natural disasters, trigger landslides carrying a large amount of mud and rocks. These disasters pose a serious threat to local economic development and the safety of people’s lives and property [1].
Traditional geological disaster interpretation primarily depends on manual visual interpretation, involving the observation of image color, texture, shape, and other aspects for comprehensive modeling. This process, including visual interpretation and result map creation, typically consumes significant amounts of time, manpower, material, and financial resources. Furthermore, this method greatly relies on image preprocessing and feature selection. Particularly, geological disaster information not identifiable by the naked eye tends to be overlooked, leading to a significant underutilization of remote sensing data [2]. Consequently, this method exhibits limited universality and practicality in field investigations, is challenging to implement in field geological exploration, and struggles to satisfy the urgent demands of post-disaster emergency response and rapid disaster assessment, particularly in emergency relief scenarios.
In recent years, owing to the rapid advancement of machine learning and artificial intelligence, scholars have increasingly favored teaching computers to recognize high spatial resolution characteristics of mudslides in remote sensing images. This approach employs image texture and spectral characteristics to facilitate the automatic extraction of mudslide inundation area information, thereby enabling quick, accurate, and efficient target detection [3]. Deep learning, a branch of machine learning, attains meaningful data representation by mining information on multiple levels and automatically extracting all features. Particularly in image object detection, deep learning outperforms manual feature extraction by automatically extracting various features and performing progressive information distillation and purification, resulting in significantly improved outcomes compared to traditional algorithms [4]. Among these, the region-free algorithm, a leading deep learning object detection algorithm, inputs the entire image into the neural network and produces immediate detection results [5,6]. Notable examples are the YOLO series and the SSD algorithm. The YOLO series, in particular, maintains high detection accuracy and the ability to detect small objects, rapidly completing detections and making it suitable for remote sensing image object detection [7]. Currently, leveraging the YOLO algorithm, numerous research endeavors have successfully achieved high-precision detection of various targets in remote sensing images, including fire smoke [8] and maritime vessels [9]. Considering the aforementioned issues and research, to detect debris flow geological hazard targets in remote sensing imagery rapidly, precisely, efficiently, and intelligently, this study initially conducts comparative experiments on geological hazard target detection models utilizing six algorithms: YOLOv3, YOLOv4, YOLOv5, YOLOv7, YOLOv8, and YOLOX. It then selects the model demonstrating higher accuracy and efficiency as the foundational model for debris flow target detection in large-scale, high-resolution remote sensing imagery. The comprehensive analysis of experimental results reveals that YOLOX discards the traditional anchor frame mechanism in favor of anchor-free technology for target parsing and recognition [10]. This approach offers smaller parameter size, faster floating-point operations, lower latency, and maintains high detection accuracy, rendering it ideal for the precise identification of mudslide geological disasters over extensive areas.
Consequently, this paper introduces an enhanced target detection algorithm based on YOLOX-Nano, which boosts detection performance by incorporating an attention mechanism (AM) to heighten the model’s focus on geological disaster locations. Simultaneously, the algorithm modifies the network structure of the Focus, SPP, and PAFPN modules, aiming to augment the model’s feature retention capacity, secure more precise feature information, and employ an improved loss function ( e I o U ) to supplant the traditional target box regression loss function I o U during training, thereby enhancing the regression accuracy of the target box.

2. Related Work

This section delves deeper into pivotal advancements in natural disaster detection technology, with an emphasis on mudslide identification. A myriad of recent publications underscore the integration of machine and deep learning techniques to refine mudslide and geological hazard detection. Specifically, Cheng et al. (2016) underscore the transformative role of convolutional neural networks (CNNs) in interpreting remote sensing data for landslide identification, setting a foundational framework for subsequent research [11]. Building on this, Wang et al. (2022) demonstrate the strategic application of deep learning and transfer learning to swiftly evaluate mudslide-impacted zones, showcasing the pre-trained models’ role in boosting detection precision [12]. This paper’s novelty lies in harnessing the YOLOX-Nano algorithm, enriched with an attention mechanism and optimized network modules, to eclipse prior methods in detecting mudslide hazards swiftly and accurately. Additionally, we draw upon a broader spectrum of literature to anchor our innovations firmly within the evolution of disaster detection technologies, thereby ensuring a comprehensive understanding of our contribution against the backdrop of existing research.

3. Data and Methodology

3.1. Data

3.1.1. Source of Data Sets

The study area addressed in this paper is situated in the Xinjiang Uyghur Autonomous Region of China, including some territories beyond its borders, and extends to countries such as Kyrgyzstan, Pakistan, and India. Initially, the debris flow sample data’s range within the study area was defined as (72°, 38°), (73.5°, 38°), (72°, 37°), and (73.5°, 37°). The data utilized in this study primarily originate from two sources: high-resolution, non-offset Google remote sensing imagery data with a resolution of 0.80 m provided by the Xi’ning Center for Comprehensive Survey of Natural Resources under the China Geological Survey, and geological disaster vector data acquired through field investigations conducted by professionals.

3.1.2. Production of Data Sets

Firstly, employing 0.80 m high-resolution, non-offset Google remote sensing imagery supplied by the project team, the data were uniformly projected onto the WGS_1984 coordinate system. The debris flow vector data were then overlaid onto the high-resolution remote sensing imagery to compile the sample set, as illustrated in Figure 1. The sample set was subsequently processed by executing a cutting script, uniformly cropping and normalizing the images into 512 × 512 pixel blocks, yielding a total of 1268 geological disaster (debris flow) samples in JPG format. Following a preliminary screening, 898 valid geological disaster (debris flow) samples were acquired, as illustrated in Figure 2.
To prevent overfitting and effectively enhance the sample diversity during the training process, thereby ensuring the model’s robustness across various environments, data augmentation techniques were employed. Following data augmentation processes including image cropping, contrast, brightness, and noise adjustments, the count of geological disaster (debris flow) samples increased to 4585. The augmented geological disaster (debris flow) samples, in J P G format, were imported into the Labelimg 1.8.6. Utilizing vector debris flow location information, all samples were annotated in accordance with the P a s c a l   V O C dataset format, resulting in the generation of .xml type annotation files, as illustrated in Figure 2. Lastly, to maintain the dataset’s independence, it was partitioned into training, validation, and test sets in an 8:1:1 ratio.

3.2. Methodology

A prominent representative in object detection algorithms is YOLO, proposed by Redmon et al. [13] Operating on an end-to-end basis, it delineates and classifies objects in the original image, demonstrating effective recognition capabilities, albeit with some limitations in accuracy. To enhance accuracy, Redmon et al. [14] introduced YOLOv3, employing Feature Pyramid Networks (FPN) to augment detection performance, notably in small object scenarios. However, YOLOv3’s efficacy in detecting objects with complex features was suboptimal. Bochkovskiy et al. [15] conducted multiple optimizations on the YOLO series, leading to the proposal of YOLOv4, which achieved enhanced performance metrics in applications. Jocher et al. [16] built upon this with YOLOv5, introducing modifications such as a Focus structure and adaptive anchor box calculations, resulting in a more streamlined architecture and enhanced accuracy. The YOLOv7, proposed by Bochkovskiy et al. [17], further enhances and refines this approach, introducing the E-ELAN module to bolster network learning capabilities. The YOLOv8, specifically the YOLOv8-Nano variant, proposed by Ultralytics et al. [18], adopting anchor-free technology, addressed the limitations of anchor box-based models, simplifying computational demands for lightweight applications. Finally, the YOLOX, with a focus on the YOLOX-Nano model proposed by Ge et al. [19], combines various strengths of the YOLO series. It innovatively incorporates a decoupled head for faster convergence and higher precision, alongside anchor-free methods and SimOTA dynamic positive sample matching, achieving high-precision, rapid object detection and recognition in compact, resource-constrained environments.
In conclusion, to effectively detect mudslide geological disasters in remote sensing imagery and enhance target detection capabilities, the study adopted the following research methodologies:
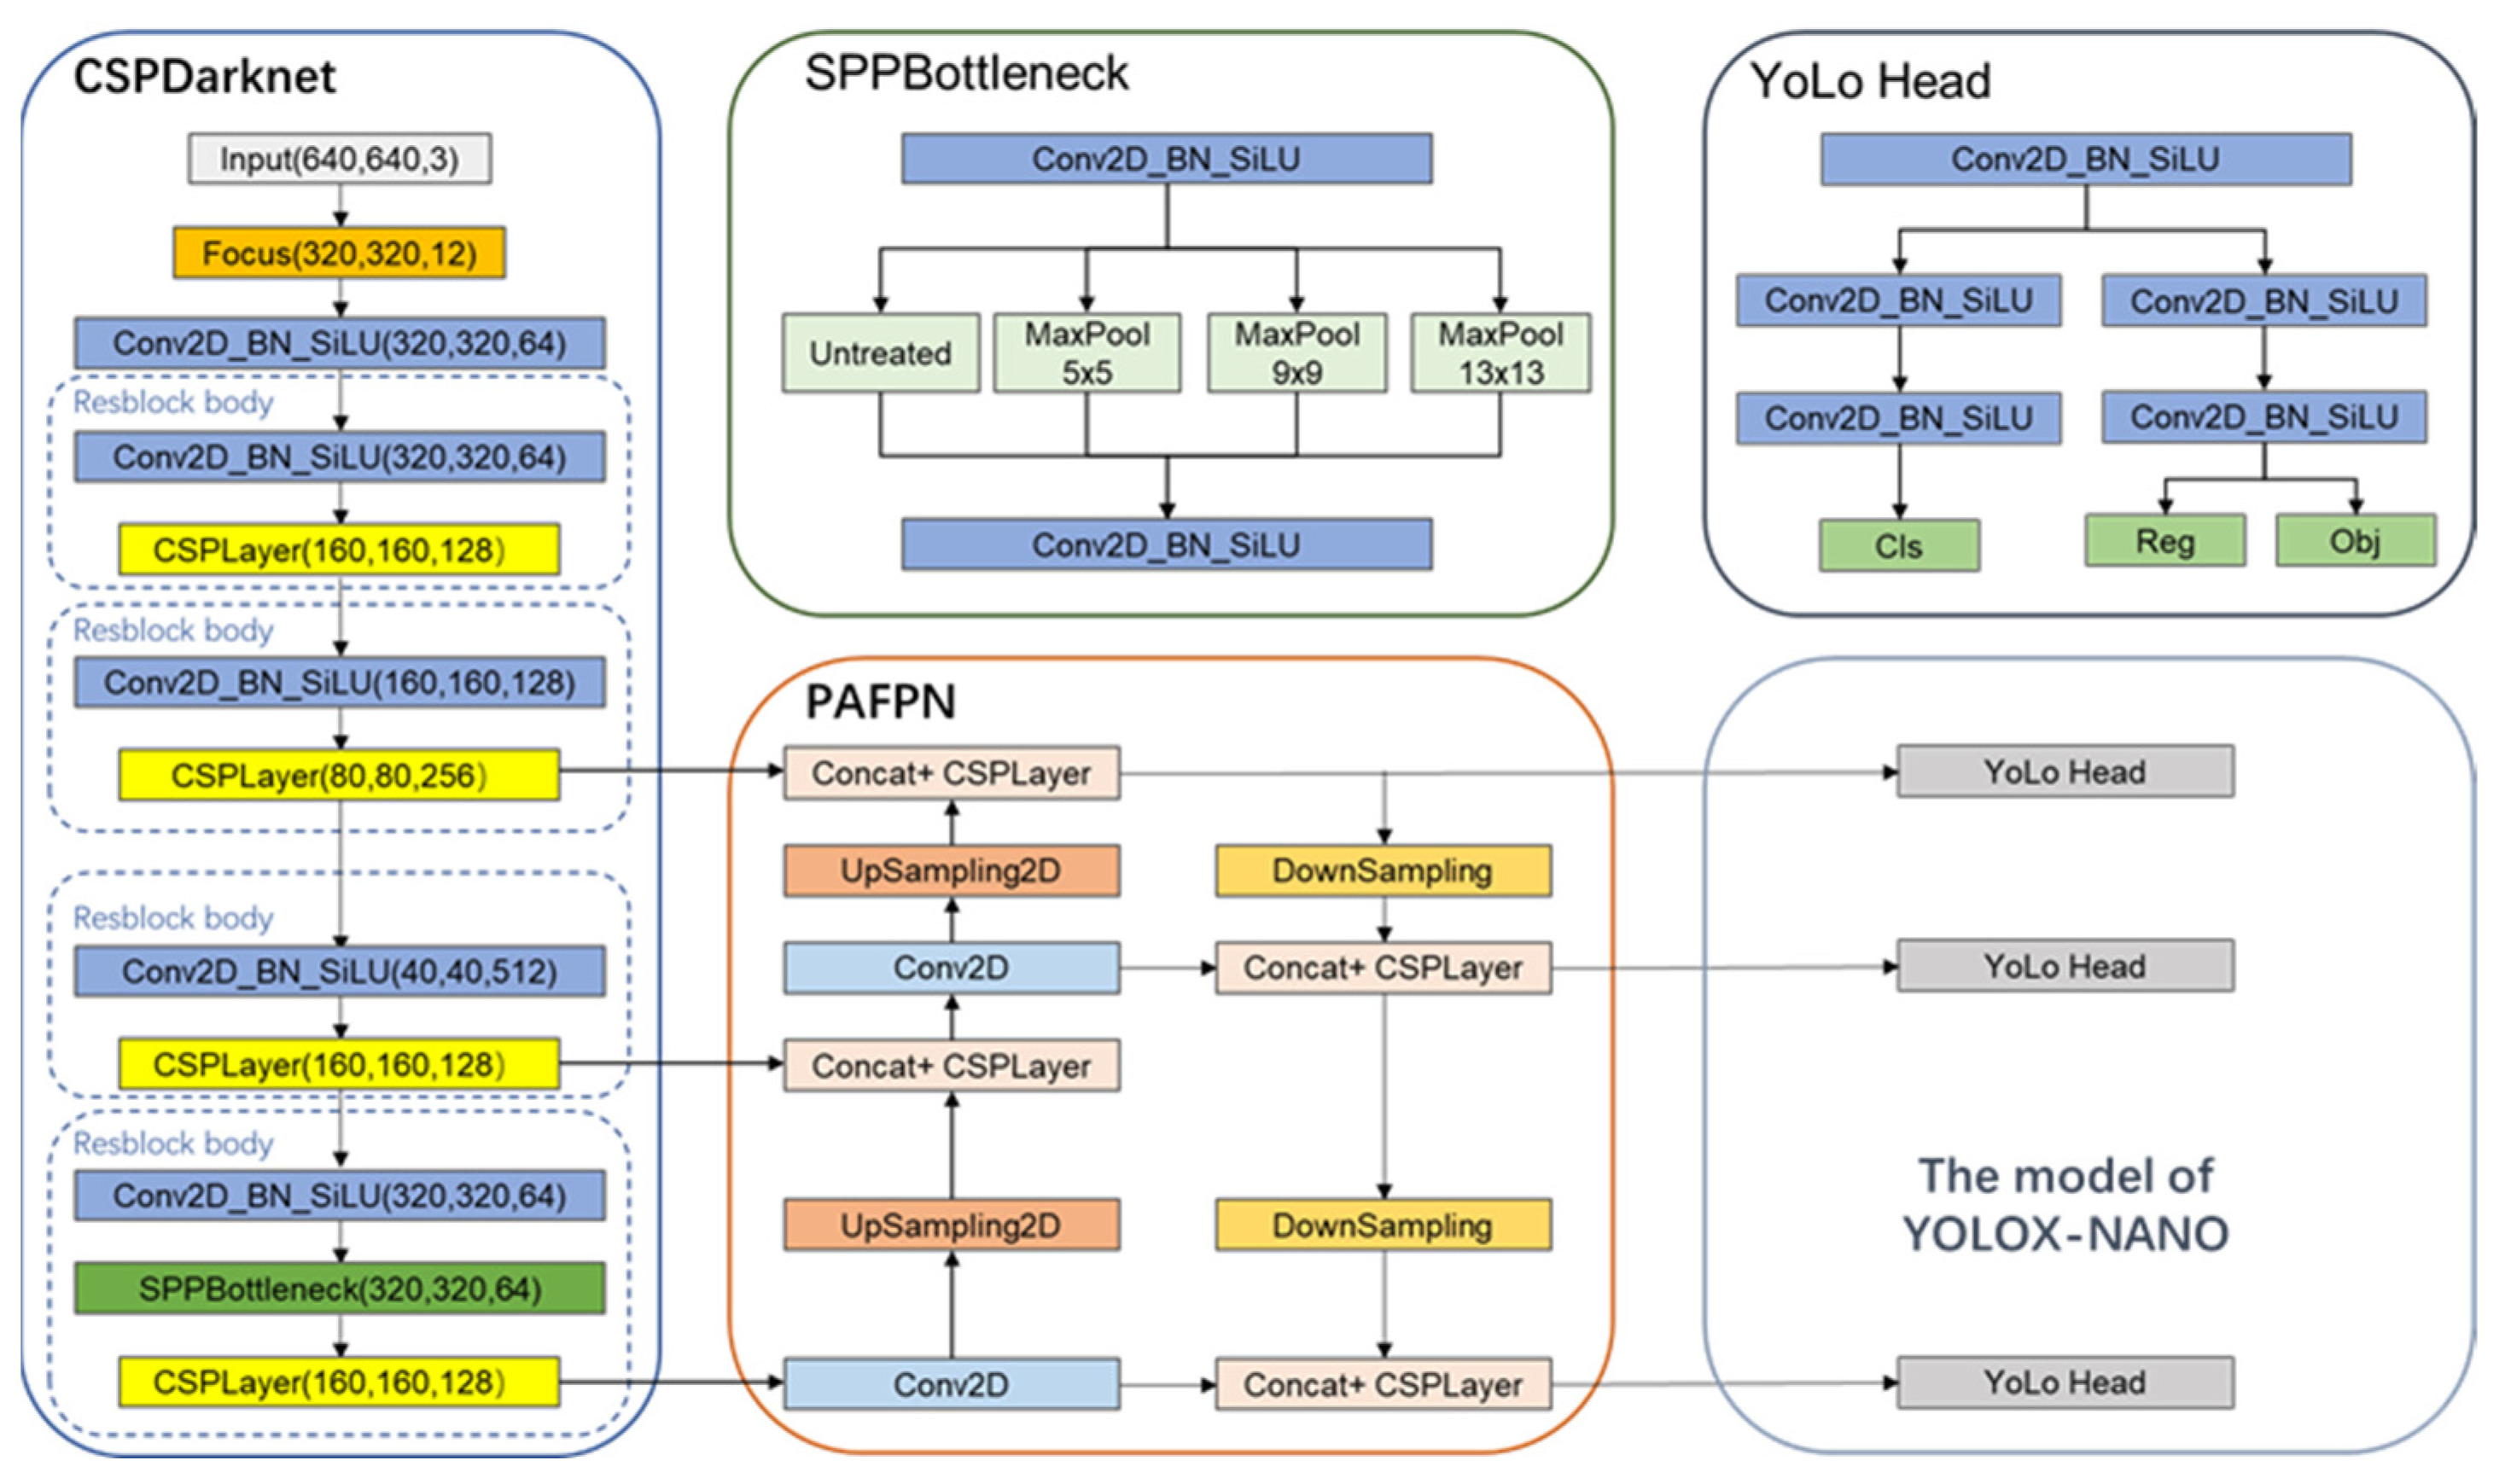
  • Utilizing the meticulously prepared dataset, comparative analyses of the YOLO models in their varying sizes—nano, small, medium, large, and X-large—were conducted under identical environmental conditions. This comprehensive comparison led to the conclusion that the YOLOX-Nano model, among the variants assessed, demonstrated the most superior performance for our specific application in detecting mudslide geological disasters. Consequently, YOLOX-Nano, being a lightweight derivative of YOLOX, was chosen as the fundamental model for the accurate detection of mudslide geological disasters in expansive regions.
  • Attention mechanisms were integrated into the Focus, SPP, and PAFPN modules of the YOLOX-Nano network, thereby augmenting the accuracy of mudslide target detection and increasing the network’s sensitivity to smaller targets.
  • The research incorporated an advanced regression loss function, known as e I o U , in lieu of the traditional I o U function within the base model. This modification was aimed at intensifying the regression accuracy of predictive bounding boxes for smaller targets, consequently leading to an improvement in the model’s overall detection capabilities.
  • Data augmentation was accomplished using M o s a i c and M i x u p techniques, thereby enhancing the model’s capacity for generalization.

3.2.1. Network Structure

YOLOX-Nano is architecturally segmented into three primary components: the backbone, dedicated to feature extraction; the Neck, responsible for augmenting the feature extraction process; and the Prediction, serving as the detection head. The model employs C S P D a r k N e t 53 [20] as its core feature extraction network, which produces feature layers of three distinct scales. These layers undergo further processing in the Neck’s advanced feature extraction layer ( F P N ) [21], facilitating multi-scale feature fusion and in-depth feature extraction. Subsequently, the extracted feature maps, comprising three layers, are fed into the Prediction segment to perform regression prediction, as illustrated in Figure 3.

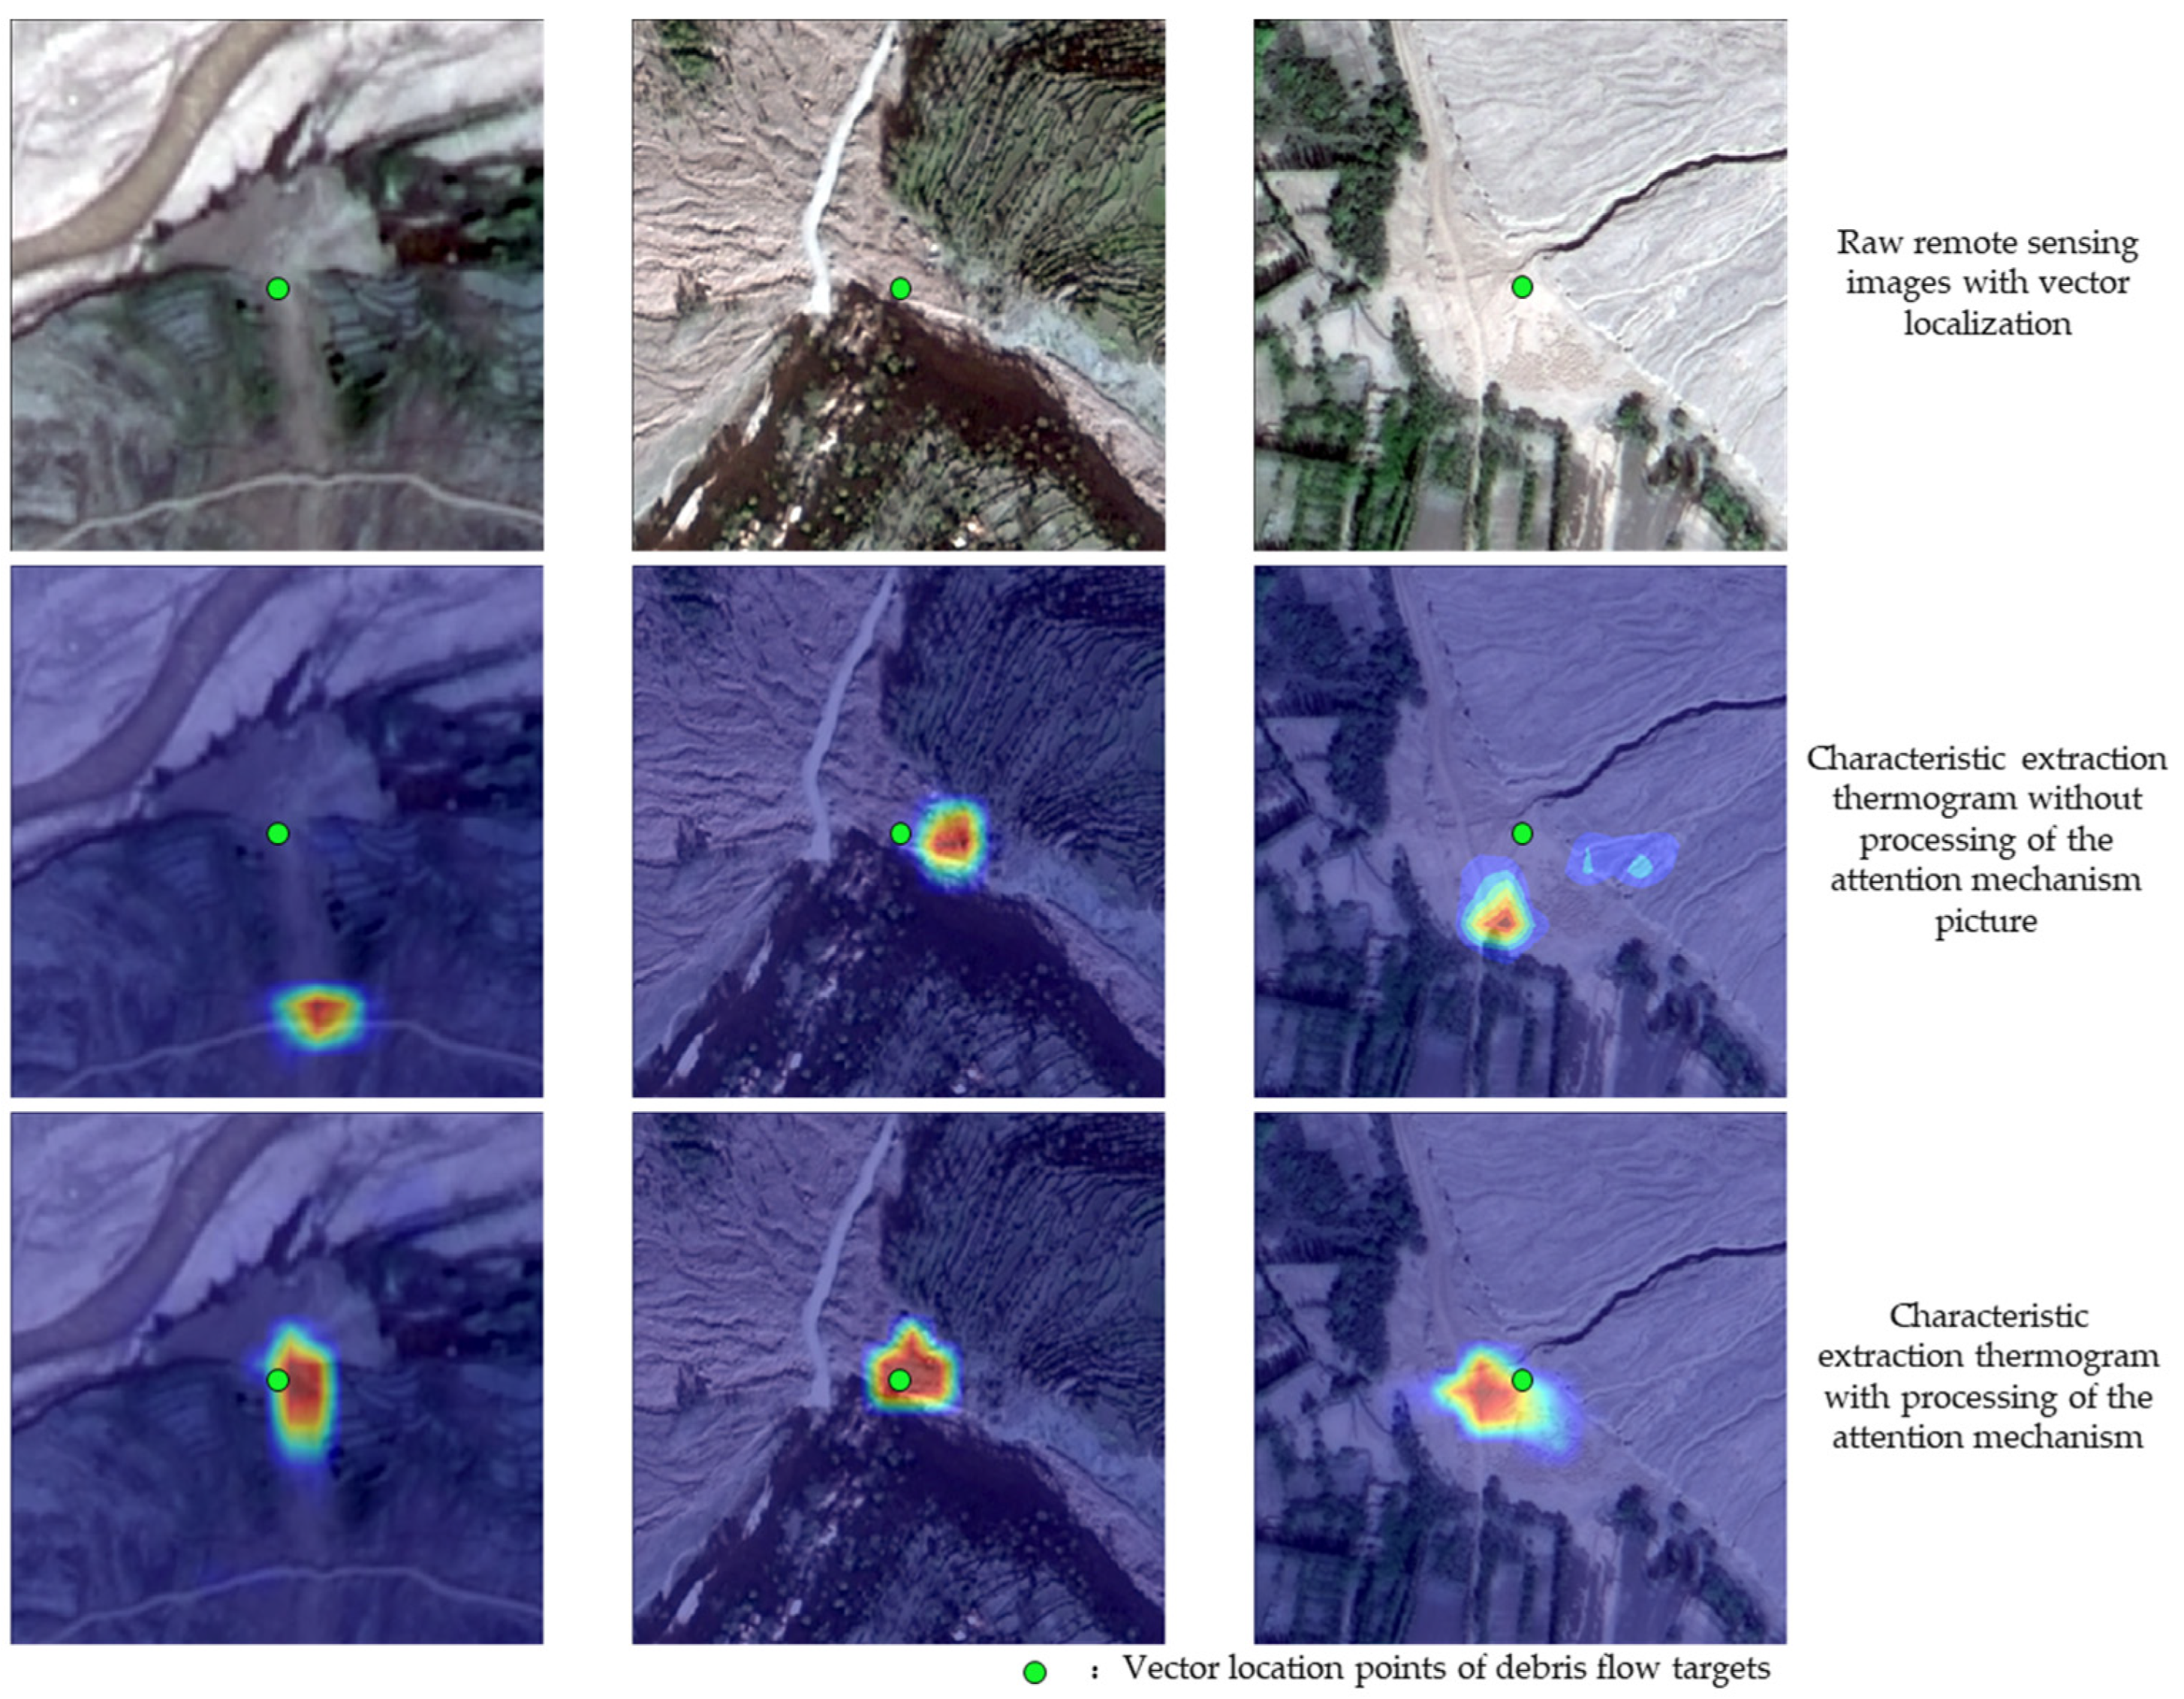
3.2.2. Enhancing Architectures with Integrated Attention Mechanisms

Attention mechanisms allow models to selectively concentrate on pertinent information, acting as a resource allocation strategy that effectively addresses information overload. Standard convolutional layers are unable to model inter-channel correlations, resulting in a uniform treatment of channels and thus a subdued representation of crucial information. In remote sensing imagery applications, challenges such as small targets, partial occlusions, and complex backgrounds are common; the incorporation of attention mechanisms can, to some extent, enhance model performance [22,23,24].
This research has undertaken an optimization of the YOLOX-Nano network. Following the model’s lightweight transformation, the reallocation of channel weights has rendered important channels more prominent, ensuring the retention of critical target space and feature information. Within the YOLOX-Nano network, distinct attention mechanisms were implemented in the F o c u s , S P P , and P A F P N modules, tailored to the specific functions of each module. The squeeze-and-excitation attention ( S E ), for example, employs global pooling to derive a 1 × 1 × C dimension ( C being the number of channels), using two fully connected layers and an activation function for non-linear processing. This approach is effective for managing intricate inter-channel correlations, yielding a 1 × 1 × C channel weight that aligns with feature map layers. Utilizing global pooling, S E compresses overall information into channel weights, thereby effectively discerning the relative importance of various channels, as illustrated in Figure 4.
The channel attention ( C A ) [25] conducts pooling and convolution operations along the width and height dimensions of feature map layers, resulting in the generation of feature encodings and their aggregation across two channel dimensions. In contrast to squeeze-and-excitation ( S E ), which primarily redistributes channel weights, C A   is capable of capturing long-range dependencies in one spatial direction while preserving precise location information in another. This enables the model to locate and recognize target areas with greater accuracy, thereby significantly enhancing the network’s ability to retain information. The computational workflow of C A is illustrated in Figure 4.
The convolutional block attention module ( C B A M ) [26] initiates with channel attention, conducting global average pooling and max pooling on each feature layer, subsequently processed through shared fully connected layers and applying the sigmoid activation function to derive channel-specific weighted values. The acquired weights are then multiplied with the original feature layers, resulting in an augmented feature map. Spatial attention ensues, applying max and average operations on the channel-attention-processed feature layers, modulating the number of channels via a convolutional kernel, and determining the weight of each feature point through the sigmoid activation function, as illustrated in Figure 5. Ultimately, these weights are applied to the original feature layers, yielding an optimized feature representation, thus enhancing the model’s comprehension of image content and its performance in tasks like image classification and object detection.
Pertaining to the Focus module, located at the network’s forefront and directly processing the original image, the accurate preservation of location information and capturing of long-range dependencies are essential for effective feature extraction. In this study, the CA (channel attention) mechanism is utilized to enhance the Focus module. After interval sampling of the image, channel attention is integrated to preserve the original image’s positional information within the expanded channels, thereby further augmenting the Focus network’s capability to retain features, as depicted in Figure 6.
In neural network models, the deeper feature layers encapsulate richer semantic information, transforming positional information into highly abstracted semantic content. To expand the receptive field, YOLOX-Nano incorporates the S P P (spatial pyramid pooling) module within its deeper network layers. Given that the deeper network channels predominantly store abstract semantic information, each channel functions as an independent repository for this data. Building on this insight, this research integrates the S E (squeeze-and-excitation) attention mechanism into the S P P module, realigning the weight distribution of concatenated channels to ascertain their relative importance. The integration of an S E mechanism within the S P P module is depicted in Figure 7. This adjustment aims to enhance the deep network’s extraction and utilization of semantic information, optimizing the network structure for a better understanding of image content.
In the enhanced feature extraction PAFPN module, this study integrates the CBAM (convolutional block attention module), which amalgamates channel and spatial attention mechanisms. The input feature layers undergo processing through both channel and spatial attention mechanisms. The convolutional attention mechanism reallocates feature map weights across various channels, thereby enhancing the network’s deep-layer information extraction. This approach enables the network to concentrate on critical features and disregard less significant ones, as depicted in Figure 8. This optimization allows the network to focus on salient features while minimizing attention to irrelevant details, optimizing overall feature recognition and analysis.

3.2.3. Loss Function

YOLOX employs bounding box regression technology for precise target localization. Bounding box regression is extensively utilized across object detection networks, with numerous mainstream models adopting this strategy for localization tasks. The principle behind bounding box regression involves using the overlap area between the predicted and actual boxes as the loss function, continuously iterating to refine the predicted box. This approach is commonly referred to as the intersection over union ( I o U ) loss function. The IoU metric serves as a crucial component in optimizing the accuracy of target localization, reinforcing the model’s effectiveness in detecting and delineating objects within an image.
The formula for calculating I o U is as follows:
I o U = B p r B g t B p r B g t            
In this context, B p r denotes the predicted bounding box, while B g t signifies the ground-truth box.
The formula for calculating loss function of I o U loss function is calculated as follows:
L I o U = 1 B p r B g t B p r B g t = 1 I o U
The formula for calculating E I o U is as follows:
L E I o U = L I o U + L d i s + L a s p
L I o U = 1 I o U
L d i s = ρ 2 b , b g t c 2
L a s p = ρ 2 w , w g t C w 2 + ρ 2 h , h g t C h 2
The formula for calculating loss function of E I o U loss function is calculated as follows:
L E I o U = 1 I o U + ρ 2 b , b g t c 2 + ρ 2 w , w g t C w 2 + ρ 2 h , h g t C h 2
In this context, b represents the predicted bounding box, b g t represents the ground-truth bounding box; ρ 2 b , b g t represents the Euclidean distance between the center points of the predicted and ground-truth boxes, and c is the length of the diagonal of the smallest enclosing box that contains both the predicted and ground-truth boxes. Thus, ρ 2 b , b g t c 2 represents the ratio of the Euclidean distance between the centers of the predicted and ground-truth boxes to the diagonal distance of the smallest enclosing box. Similarly, ρ 2 w , w g t C w 2 and ρ 2 h , h g t C h 2 represent the ratios of the Euclidean distances of width and height to the width and height of the smallest enclosing box, respectively.

3.2.4. Data Augmentation

The Mosaic augmentation technique involves using four images, subjected to operations like scaling, translation, flipping, and color domain transformations, subsequently stitched together. Each image contains corresponding bounding boxes, and post-stitching, a composite image showcasing the bounding boxes from all four images, is created. This significantly diversifies the environments where the targets are present. The implementation process is depicted in Figure 9. Figure 9a illustrates the four images before transformation, while Figure 9b displays the effect post-transformation and stitching. It is evident that the composite image offers a more enriched background compared to the original four images, with the locations of targets exhibiting greater diversity. Consequently, this technique substantially expands the original dataset, augments the model’s target detection precision, and bolsters detection robustness, thus enhancing the overall performance of the model in various detection scenarios.
M i x u p is a data augmentation strategy that involves class mixing. This technique randomly selects two samples from each training batch, each comprising an image and its associated label. The images and labels from these samples undergo linear interpolation based on a predefined ratio λ . A weighted summation of the images is calculated, and the labels are similarly mixed according to this ratio. This method effectively enhances the diversity and richness of the training data, aiding in the development of more robust and accurate models. The formula for M i x u p is as follows:
I m a g e m i x e d = λ × I m a g e 1 + 1 λ × I m a g e 2
L a b e l m i x e d = λ × L a b e l 1 + 1 λ × L a b e l 2
  λ ϵ 0 ,   1
Using mudslide remote sensing images as an example, in the training phase, an initial sample image is loaded, depicted in Figure 10a. Subsequently, a second sample image is randomly selected, illustrated in Figure 10b. These images are then combined through a weighted fusion process, culminating in a composite image, as exhibited in Figure 10c. This method effectively synthesizes diverse visual data, enriching the dataset and enhancing the model’s ability to generalize from complex remote sensing imagery.
In this research, the data augmentation strategy for RS-YOLOX-Nano model training was enhanced by integrating Mosaic, complemented by M i x u p as an additional reinforcement technique. For each training batch, 50% of the samples are randomly chosen for Mosaic data augmentation, followed by further M i x u p processing of 50% of the Mosaic-enhanced images. This approach amplifies the randomness and diversity of the data augmentation, supplying the model with an array of varied and enriched image samples. Utilizing these samples for training significantly bolsters the model’s robustness and generalization capacity. These improvements endow the RS-YOLOX-Nano model with greater adaptability, enabling it to more effectively handle target detection tasks across diverse scenarios.

4. Experiments

4.1. Experimental Environment

The study was conducted using the Pytorch1.7 deep learning framework, powered by an Intel(R) Core(TM) i5-11260H @ 2.60 GHz processor, 8 GB of RAM, and an NVIDIA GeForce RTX 3060 Laptop GPU, with CUDA11.0 serving as the underlying parallel computing framework. Training parameters were set as follows: the SGD optimizer was employed for a total of 1000 iterations. During the initial 50 epochs, the backbone network was subject to frozen training, with an initial learning rate of 0.001, a weight decay of 0.0005, and a batch size of 16. Subsequent epochs (51–1000) involved unfrozen training, with an initial learning rate of 0.0001, weight decay of 0.0005, and a reduced batch size of 8. This training configuration was meticulously designed to maximize the efficiency and effectiveness of the model training process.

4.2. Evaluation Indicators

The post-training evaluation of the model encompasses the harmonic mean F1 score ( F 1 s c o r e ), recall ( R e c a l l ), precision ( P r e c i s i o n ), average precision ( A P ), detection speed (frames per second, F P S ), and model size. These metrics collectively provide a comprehensive assessment of the model’s performance. The calculation formulas for F 1 , P r e c i s i o n , and R e c a l l are delineated below, offering a quantitative measure of the model’s accuracy, reliability, and efficiency in processing. This multifaceted evaluation approach ensures a thorough understanding of the model’s capabilities and limitations.
P r e c i s i o n = T P T P + F P × 100 %
R e c a l l = T P T P + F N × 100 %
A P i = 0 i P i R i d R i
m A P = 1 n i = 1 n A P i
T P   (true positive) denotes the count of accurately identified positive samples, while F P (false positive) signifies the quantity of falsely identified positive samples, and F N (false negative) indicates the count of incorrectly identified negative samples. F 1 0.5 represents the harmonic mean of model precision and recall at an intersection over union ( I o U ) threshold of 0.5. A P (average precision) is defined as the area under the precision-recall ( P R ) curve, with values ranging from 0 to 1; A P 0.5 calculates the average precision at various recall levels when   I o U is set at 0.5. The m A P (mean average precision) metric, representing the average of these average precision values, serves as a comprehensive indicator of the overall accuracy of object detection algorithm models. This metric is crucial for evaluating the effectiveness of the model across different detection scenarios.

4.3. Experimental Results and Analysis

To ascertain the viability of the model enhancements and their efficacy in mudslide target detection, this research incorporated a series of comparative experiments. These included an exhaustive evaluation of six fundamental models: YOLOv3, YOLOv4, YOLOv5, YOLOv7, YOLOv8, and YOLOX, with a focus on aspects such as detection accuracy, model parameter size, and inference speed. Additionally, a comparative analysis was conducted between the enhanced RS-YOLOX-Nano model and the standard YOLOX-Nano, assessing metrics like model detection P r e c i s i o n , R e c a l l rate, F 1 score, m A P value, and actual detection outcomes. Furthermore, ablation studies were undertaken to gauge the effects of varied enhancement strategies on the   m A P value in mudslide target detection, providing comprehensive insights into the overall performance and improvements of the models.

4.3.1. Comparative Experiment of Mainstream Lightweight Network Performance

To objectively reflect the performance of the YOLOX-Nano network, this study also trained other lightweight YOLO models and the standard YOLOv3 model using the same parameters and settings for comparison with the YOLOX-Nano model. The comparative results of these five object detection networks are presented in Table 1. It is evident that under the same testing set, the m A P 0.5 value of the YOLOX-Nano network reached 82.51%, which is higher than that of the other models. Furthermore, the m A P 0.5 value of this network shows an increase of 3.44%, 10.71%, 0.72%, 1.27%, and 1.93% compared to YOLOv3, YOLOv4-Tiny, YOLOv5-S, YOLOv7-tiny, and YOLOv8-Nano, respectively. In the context of debris flow geological disaster detection in remote sensing images, the R e c a l l rate is an essential metric for assessing the model’s coverage of targets, as missing debris flow targets could lead to severe consequences. Observing the R e c a l l   values, it is discernible that the YOLOX-Nano network model demonstrates approximately a 15% increase in the R e c a l l rate compared to other lightweight YOLO network models. Therefore, with similar P r e c i s i o n rates, the significant improvement in the R e c a l l rate of the YOLOX-Nano model results in its composite performance indicators, the F 1 score and m A P 0.5 value, being higher than those of other benchmark models, making it most suitable as a base model for debris flow disaster target detection in remote sensing images.

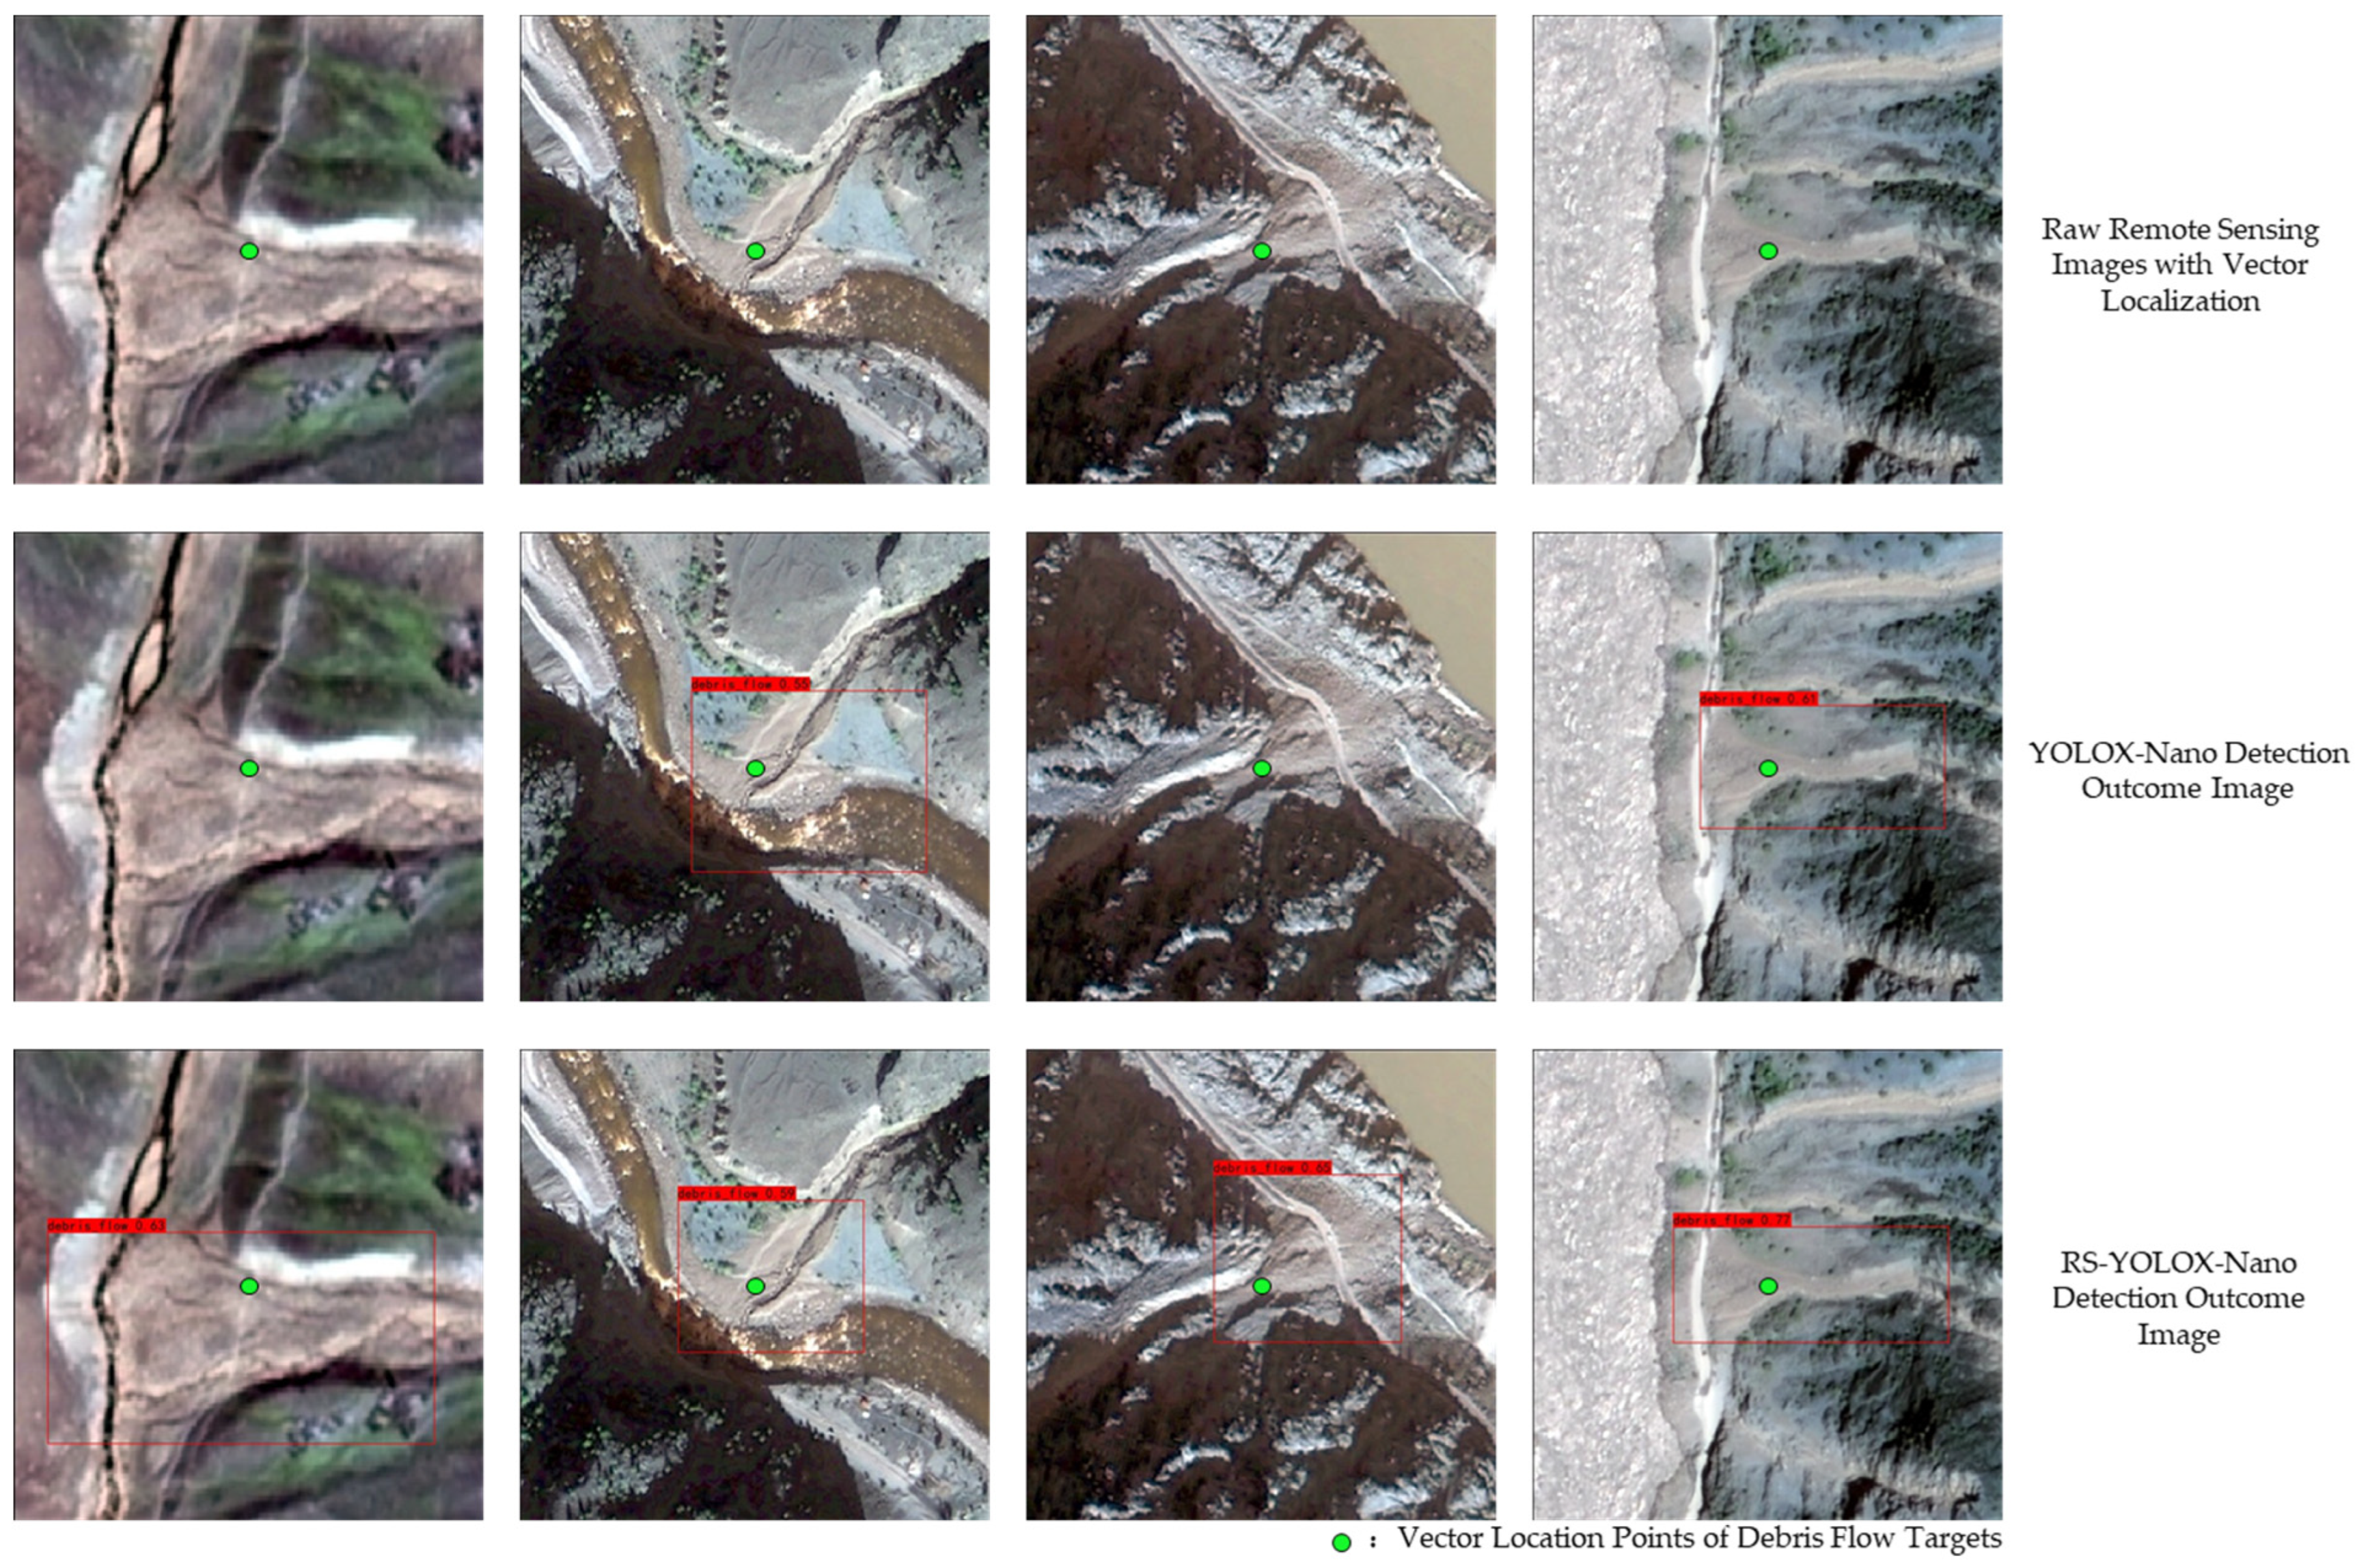
4.3.2. Comparative Experiments between the Original and Improved Models

The original YOLOX-Nano algorithm has a small parameter size and exhibits good performance in both detection accuracy and speed. The improved RS-YOLOX-Nano algorithm, presented in this paper, shows an increased parameter size of 0.12 MB compared to the original YOLOX-Nano, with a detection speed of 62.45 fps, a decrease of 1.03 fps. It can effectively and promptly detect debris flow geological disasters in remote sensing images in most scenarios. Despite a reduction in detection speed, it meets the real-time detection requirements for relevant scenarios and is capable of performing real-time detection tasks for debris flow geological disasters, suitable for hardware deployment. Most importantly, as shown in Table 2, the enhanced RS-YOLOX-Nano network achieves an m A P of 86.04% for debris flow geological disasters, an increase of 3.53 percentage points over the previous m A P of 82.51%, thereby demonstrating superior detection and recognition capabilities for such disasters.

4.3.3. Ablation Experiment

To demonstrate the direct impact of the improved algorithm on detection performance, a series of ablation studies were conducted. Using the original YOLOX-Nano as the backbone network, various optimization algorithms were incrementally added to assess their effects on network detection performance. The results of these experiments are presented in Table 3. After incorporating the Mosaic and Mix up strategies, the m A P value increased to 83.52%. Substituting the I o U loss function with   E I o U led to a further increase in algorithm performance, due to more accurate target identification. With the improved Focus and SPP modules, the m A P value further increased to 85.31%. Upon integrating various AM algorithms, the network performance varied, with CBAM showing the best effect, elevating the m A P to 86.04%. However, the use of ECA and SE resulted in a decrease in the m A P ; thus, the final model adopted the CBAM attention mechanism. In summary, the incremental addition of each optimization algorithm led to a steady improvement in m A P values, validating the effectiveness of each step in the improvement strategy. This resulted in the RS-YOLOX-Nano algorithm achieving better results in the detection of debris flow geological disasters.

5. Discussion

5.1. Overall Performance Analysis of RS-YOLOX-Nano

Utilizing the YOLOX-Nano model as the foundational network, this study integrates data augmentation strategies that combine Mosaic and Mix-up, employing the E I o U loss function to replace the original I o U loss function. Additionally, it incorporates redesigned Focus, SPP, and PAFPN modules, enhanced with various attention mechanisms, to substitute the original modules in the RS-YOLOX-Nano improvement network.

5.1.1. Introducing Combined Data Augmentation Strategies of Mosaic and Mix-Up

The network model trained using a combined data augmentation strategy of Mosaic and Mix-up demonstrated an average reduction of 8   m s in single-sample image detection time compared to before the improvements. Concurrently, its mean average precision ( m A P ) increased by 1.01%. This approach not only reduced the time required for detection inference but also enhanced the average detection accuracy for debris flow geological disasters. Thus, the introduction of the combined data augmentation strategy using Mosaic and Mix-up to expand the dataset evidently improves the efficiency of debris flow geological disaster detection, enabling more comprehensive model training and reduced inference time.

5.1.2. Introducing the E I o U Loss Function

Different bounding box regression loss functions have varying impacts on detection accuracy. The experiment compared the performance of the original model’s I o U loss function with the E I o U loss function employed in this study to determine the most suitable regression loss function. The final experiment revealed that the YOLOX-Nano using the   I o U loss function achieved an m A P of 82.51%, whereas the YOLOX-Nano with the E I o U loss function reached an m A P of 82.99%. The combination of the E I o U loss function with the YOLOX-Nano network, as adopted in this study, resulted in better control over the bounding box boundaries on the dataset, significantly enhancing the detection accuracy of debris flow geological disasters.

5.1.3. Introducing Various Attention Mechanisms

The YOLOX-Nano model exhibits relatively low accuracy in detecting and recognizing debris flow geological disasters, with a mean average precision ( m A P ) of only 82.51%. This is attributed to the complex and multifaceted nature of debris flow disaster characteristics. Different attention mechanisms can impart distinct features to the network’s various channels, selectively amplifying the weight of channels associated with debris flow characteristics. The SE attention mechanism compresses global information into channel weights, effectively discerning the importance among different channels. The CA attention mechanism captures long-range dependencies along one spatial direction while preserving precise positional information along another. The CBAM attention mechanism assigns varying weights to different feature points within the same feature map, distinguishing internal pixel points. After integrating various attention mechanisms, the model’s parameter size increased from 3.71 MB to 3.83 MB and single-sample inference time rose by 18 m s , but the m A P value improved from 82.51% to 84.56%, significantly enhancing the accuracy of debris flow geological disaster detection. Using the Grad-CAM tool [27], the feature extraction layers post-attention mechanism processing were visualized [28], elucidating their impact on feature extraction. As demonstrated in Figure 11, before the introduction of attention mechanisms, the network’s feature extraction from samples was somewhat arbitrary, lacking adequate focus on characteristic points in debris flow disaster areas. After the implementation of attention mechanisms, the network increasingly prioritized important feature channels during forward propagation, allowing it to focus on essential parts. This enabled the improved RS-YOLOX-Nano model to more efficiently extract features from complex images.

5.1.4. Actual Detection Results

It is evident from the detection result images that the improved algorithm demonstrates an enhanced performance compared to its prior version. The original algorithm previously exhibited issues with missing and falsely detecting debris flow targets, which have been substantially ameliorated following the revisions. As illustrated in Figure 12, the enhanced algorithm now detects more accurate targets with greater confidence than its predecessor, yielding superior detection performance.

6. Conclusions

This study focuses on the application of detecting debris flow geological disasters in remote sensing imagery. Compared to manual visual interpretation methods, utilizing computer vision for detecting debris flow geological disasters offers advantages such as lower cost, higher accuracy, and reduced latency. This paper introduces attention mechanisms to enhance the Focus, SPP, and FPN modules of the YOLOX-Nano classification model, and integrates Mosaic and Mix-up data augmentation strategies. By replacing the I o U loss function with the E I o U loss function, an improved YOLOX-Nano optimized network is proposed. Utilizing this network for training and testing on a debris flow disaster remote sensing image dataset, and deploying it on a platform for intelligent detection of feature factors in remote sensing images enhances the level of intelligence in the field of remote sensing geological interpretation. The conclusions are as follows:
Adopting YOLOX-Nano as the foundational network, and enhancing its Focus, SPP, and PAFPN modules with various attention mechanisms, has led to more effective extraction of debris flow geological disaster features. This approach not only maintains a low parameter count but also boosts the model’s recognition and classification accuracy, enhancing the m A P for debris flow geological disaster detection by 3.53% compared to the original model.
Various attention mechanisms facilitate the redistribution of weights across different feature map channels, augmenting the extraction of deep structural information and fine-grained features. Moreover, the combination of Mosaic and Mix-up data augmentation strategies enhances smaller network performance, and the E I o U loss function more effectively controls the boundaries of detection boxes, thereby improving the detection accuracy of debris flow geological disasters in remote sensing images.
Comparative analyses with multiple models, under identical training conditions, reveal that the improved RS-YOLOX-Nano model, with a parameter size of just 3.83 MB, offers substantial advantages in terms of computational efficiency and recognition accuracy. This refined model significantly reduces the computational demands on deployment platforms, providing robust technical support for the intelligent recognition of debris flow geological disasters.

Author Contributions

Conceptualization, S.M. and J.W.; methodology, S.M.; software, J.W.; validation, Z.Z. and Y.T.; formal analysis, S.M.; investigation, J.W.; resources, Z.Z.; data curation, Z.Z.; writing—original draft preparation, S.M.; writing—review and editing, Y.T.; visualization, S.M.; supervision, Y.T.; project administration, Z.Z.; funding acquisition, Z.Z. All authors have read and agreed to the published version of the manuscript.

Funding

This research was funded by the China Geological Survey Project (grant No. DD20191016, ZD20220409).

Data Availability Statement

The data are available from the corresponding authors on reasonable request.

Acknowledgments

The authors would like to thank each member of the team for their efforts.

Conflicts of Interest

The authors declare no conflicts of interest.

References

  1. Cui, P.; Gao, K.C.; Wei, F.-Q. The Forecasting of Debris Flow. Bull. Chin. Acad. Sci. 2005, 363–369. [Google Scholar]
  2. Zhang, P. Research on the Automatic Extraction of Remote Sensing Images of Earthquake-Induced Landslides; Institute of Geology, China Earthquake Administration: Beijing, China, 2021.
  3. Zheng, Y.; Chen, Q.; Zhang, Y. New Advances in Deep Learning and Its Application in Object and Behavior Recognition. J. Image Graph. 2014, 19, 175–184. [Google Scholar]
  4. Yin, B.; Wang, W.; Wang, L. A Survey of Deep Learning Research. J. Beijing Univ. Technol. 2015, 41, 48–59. [Google Scholar]
  5. Zhu, R. Research on Object Detection Based on Deep Learning; Beijing Jiaotong University: Beijing, China, 2018. [Google Scholar]
  6. Li, X.; Ye, M.; Li, T. A Survey of Object Detection Research Based on Convolutional Neural Networks. Appl. Res. Comput. 2017, 34, 2881–2886+2891. [Google Scholar]
  7. Wu, T.; Dong, Y. YOLO-SE: Improved YOLOv8 for Remote Sensing Object Detection and Recognition. Appl. Sci. 2023, 13, 12977. [Google Scholar] [CrossRef]
  8. Ren, J.; Xiong, W.; Wu, Z.; Jiang, M. Fire Detection and Recognition Based on Improved YOLOv3. Comput. Syst. Appl. 2019, 28, 171–176. [Google Scholar]
  9. Liu, B.; Wang, S.; Zhao, J.; Li, M. Ship Tracking and Recognition Based on Darknet Network and YOLOv3 Algorithm. Comput. Appl. 2019, 39, 1663–1668. [Google Scholar]
  10. Zheng, Z.; Hu, Y.; Qiao, Y.; Hu, X.; Huang, Y. Real-time detection of winter jujubes based on improved YOLOX-nano network. Remote Sens. 2022, 14, 4833. [Google Scholar] [CrossRef]
  11. Cheng, G.; Ma, C.; Zhou, P.; Yao, X.; Han, J. Scene classification of high resolution remote sensing images using convolutional neural networks. In Proceedings of the 2016 IEEE International Geoscience and Remote Sensing Symposium (IGARSS), Beijing, China, 10–15 July 2016; pp. 767–770. [Google Scholar] [CrossRef]
  12. Wang, Z.; Goetz, J.; Brenning, A. Transfer Learning for Landslide Susceptibility Modeling Using Domain Adaptation and Case-Based Reasoning. Geosci. Model Dev. 2022, 15, 8765–8784. [Google Scholar] [CrossRef]
  13. Redmon, J.; Divvala, S.; Girshick, R.; Farhadi, A. You Only Look Once: Unified, Real-Time Object Detection. In Proceedings of the 2016 IEEE Conference on Computer Vision and Pattern Recognition, Las Vegas, NV, USA, 27–30 June 2016; pp. 779–788. [Google Scholar]
  14. Redmon, J.; Farhadi, A. YOLOv3: An Incremental Improvement. arXiv 2018, arXiv:1804.02767. [Google Scholar]
  15. Bochkovskiy, A.; Wang, C.Y.; Liao, H.Y.M. YOLOv4: Optimal speed and accuracy of object detection. arXiv 2020, arXiv:2004.10934. [Google Scholar]
  16. Jocher, G. YOLOv5. Available online: https://github.com/ultralytics/yolov5 (accessed on 26 February 2024).
  17. Wang, C.Y.; Bochkovskiy, A.; Liao, H.Y.M. YOLOv7: Trainable Bag-of-Freebies Sets New State-of-the-Art for Real-Time Object Detectors. In Proceedings of the IEEE/CVF Conference on Computer Vision and Pattern Recognition, Vancouver, BC, Canada, 18–22 June 2023; pp. 7464–7475. [Google Scholar]
  18. Ultralytics. YOLOv8. Available online: https://github.com/ultralytics/ultralytics (accessed on 26 February 2024).
  19. Ge, Z.; Liu, S.T.; Wang, F.; Li, Z.; Sun, J. YOLOX: Exceeding YOLO Series in 2021. arXiv 2021, arXiv:2107.08430. [Google Scholar]
  20. Wang, C.Y.; Marklao, H.Y.; Yeh, I.-H.; Wu, Y.H.; Chen, P.-Y.; Hsieh, J.-W. CSPNet: A New Backbone That Can Enhance Learning Capability of CNN. In Proceedings of the 2020 IEEE/CVF Conference on Computer Vision and Pattern Recognition Workshops (CVPRW), Seattle, WA, USA, 14–19 June 2020; pp. 1571–1580. [Google Scholar]
  21. Lin, T.; Dollár, P.; Girshick, R.; He, K.; Hariharan, B.; Belongie, S. Feature Pyramid Networks for Object Detection. In Proceedings of the 2017 IEEE Conference on Computer Vision and Pattern Recognition, Honolulu, HI, USA, 21–26 July 2017; pp. 936–944. [Google Scholar]
  22. Li, W.; Zhang, Y.; Mo, J.; Li, Y.; Liu, C. Field Pedestrian and Agricultural Machinery Obstacle Detection Based on Improved YOLOv3-tiny. J. Agric. Mach. 2020, 51, 1–8. [Google Scholar]
  23. Ying, B.; Xu, Y.; Zhang, S.; Shi, Y.; Liu, L. Weed Detection in Images of Carrot Fields Based on Improved YOLOv4. Trait. Du Signal 2021, 38, 341–348. [Google Scholar] [CrossRef]
  24. Yang, S.; Liu, Y.; Wang, Z. Recognition of Cow Faces Based on an Improved YOLOv4 Model Integrating Coordinate Information. J. Agric. Eng. 2021, 37, 129–135. [Google Scholar]
  25. Hou, Q.B.; Zhou, D.Q.; Feng, J.S. Coordinate Attention for Efficient Mobile Network Design. In Proceedings of the 2021 IEEE/CVF Conference on Computer Vision and Pattern Recognition (CVPR), Nashville, TN, USA, 20–25 June 2021; pp. 13708–13717. [Google Scholar]
  26. Woo, S.; Park, J.; Lee, J.Y.; Kweon, I.S. CBAM: Convolutional Block Attention Module. In Computer Vision–ECCV 2018: 15th European Conference, Munich, Germany, 8–14 September 2018; Proceedings, Part VII; Springer: Berlin/Heidelberg, Germany, 2018; pp. 3–19. [Google Scholar]
  27. Selvaraju, R.R.; Cogswell, M.; Das, A.; Vedantam, R.; Parikh, D.; Batra, D. Grad-CAM: Visual Explanations from Deep Networks via Gradient-Based Localization. Int. J. Comput. Vis. 2020, 128, 336–359. [Google Scholar] [CrossRef]
  28. He, K.M.; Zhang, X.Y.; Ren, S.Q.; Sun, J. Spatial Pyramid Pooling in Deep Convolutional Networks for Visual Recognition. IEEE Trans. Pattern Anal. Mach. Intell. (TPAMI) 2015, 37, 1904–1916. [Google Scholar] [CrossRef] [PubMed]
Figure 1. (a) Study area extent map; (b) remote sensing image and debris flow vector data overlay.
Applsci 14 02158 g001
Figure 2. The debris flow JPG sample on the (left) is the labeled debris flow sample in the (middle) and the generated data set on the (right).
Applsci 14 02158 g002
Figure 3. The network architecture diagram of YOLOX-Nano.
Applsci 14 02158 g003
Figure 4. Computational processes of squeeze-and-excitation attention ( S E ) and coordinate attention ( C A ).
Applsci 14 02158 g004
Figure 5. Structure of CBAM convolutional attention mechanism.
Applsci 14 02158 g005
Figure 6. The Focus module after it is improved.
Applsci 14 02158 g006
Figure 7. The S P P B o t t l e n e c k module after it is improved.
Applsci 14 02158 g007
Figure 8. The PAFPN module after it is improved.
Applsci 14 02158 g008
Figure 9. Mosaic image processing. (a) The original image before the Mosaic; (b) The image after Mosaic.
Applsci 14 02158 g009
Figure 10. Weighted fusion image processing. (a) The original image1; (b) The original image2; (c) The Image after weighted fusion processing.
Applsci 14 02158 g010
Figure 11. Heatmap of feature extraction for debris flows before and after the addition of attention mechanisms.
Applsci 14 02158 g011
Figure 12. Comparative diagram illustrating the actual detection effects before and after the algorithm’s improvement.
Applsci 14 02158 g012
Table 1. Results of comparative performance experiments on mainstream lightweight networks.
MethodPara/MBFPSPrecision/%Recall/% F 1 0.5 m A P 0.5 /%
YOLOv3235.036.9886.0073.760.7979.07
YOLOv4-tiny22.5162.0580.4364.840.7272.34
YOLOv5-s26.9877.1689.0656.580.6981.79
YOLOv7-tiny23.1292.4688.9359.800.7281.24
YOLOv8-Nano11.6592.1687.9571.360.7980.58
YOLOX-Nano3.7163.4888.5184.120.8682.51
Table 2. Results of comparative experiments between the original and modified models.
MethodPara/MBFPSPrecision/%Recall/% F 1 0.5 m A P 0.5 /%
YOLOX-Nano3.7163.4888.5184.120.8682.51
RS-YOLOX-Nano3.8362.4589.6185.610.8886.04
Table 3. Ablation experiment results.
M i x u p M o s a i c E I o U FocusSPPPAFPN m A P 0.5 /%
ECASECBAM
83.52
83.99
85.31
80.32
83.19
86.04
Disclaimer/Publisher’s Note: The statements, opinions and data contained in all publications are solely those of the individual author(s) and contributor(s) and not of MDPI and/or the editor(s). MDPI and/or the editor(s) disclaim responsibility for any injury to people or property resulting from any ideas, methods, instructions or products referred to in the content.

