Article

Spatial and Temporal Distribution Characteristics of Landslide Surge Based on Large-Scale Physical Modeling Experiment

1
Research Institute of Geotechnical Engineering, Hohai University, Nanjing 210098, China
2
Key Laboratory of Ministry of Education for Geomechanics & Embankment Engineering, Hohai University, Nanjing 210098, China
3
PowerChina, Kunming Engineering Corporation Limited, Kunming 650051, China
4
Huaneng Lancang River Hydripower Inc., Kunming 650214, China
*
Author to whom correspondence should be addressed.
Appl. Sci. 2024, 14(5), 2104; https://doi.org/10.3390/app14052104
Submission received: 11 January 2024 / Revised: 17 February 2024 / Accepted: 22 February 2024 / Published: 3 March 2024
(This article belongs to the Special Issue Latest Research on Geotechnical Engineering)

Abstract

:
Surge is a common secondary disaster caused by reservoir landslides. The study of its spatial and temporal distribution characteristics is important since it affects not only the normal operation of reservoirs but also the safety of people residing along the river. This paper presents a large-scale three-dimensional physical modeling experiment using a near-dam high-position landslide project as a prototype. It investigated the relationships between the river course characteristics, the landslide volume, the head wave velocity of the landslide surge, the waveform of surges, and the head wave crest of the wave along the course in depth. The results indicate that the head wave velocity of the landslide surge is basically unchanged during the propagation process, and it is minimally affected by the landslide volume. The waveform distribution characteristics and head wave crests change considerably in the diversion area and the curved areas but remain mostly unchanged in the topographic similarity area. In addition, there is a negative correlation between the head wave crest and the cross-sectional area of the river course. Furthermore, under conditions of a large landslide volume, the influence of the cross-sectional area of the river channel on the wave height of landslide surges becomes more significant. Finally, the maximum wave height along the course may not necessarily occur in the head wave crest; it could occur in the second wave or even the subsequent ones.

1. Introduction

From a macroscopic point of view, the generation of landslide surge is due to a certain volume of landslide at a certain velocity disturbing the deformation of the water. Landslide surge mainly includes landslide instability, slippage, surge generation, near- and far-field propagation, and other phases. It is a complex fluid–solid coupling process which involves engineering geology, landslide dynamics, geotechnical mechanics, hydrodynamics, and other disciplines [1]. As landslide surge is affected by water depth, the surge caused by a landslide entering the water at a high speed has wavefront intermittency with huge destructive power [2]. As a result, in recent years, there have been a growing number of studies on landslide surges in reservoir areas. The current methods of investigating landslide surges that are internationally recognized include the empirical formula method, numerical simulation method, and physical modeling experiment method.
The empirical formula method is the earliest method used to study the characteristics of surge. It has the advantages of being simple and convenient with, however, many limitations. Additionally, it is unable to analyze complex river courses and complex landslides, making it difficult to reflect engineering reality. This method is mainly based on Noda’s method, Pan Jiazheng’s method, and the formula method of the Institute of Water Sciences. Noda’s method [3] is based on the linearized gravity surface wave theory to obtain the theoretical approximation solution of the surge wave heights in the nonlinear region, which was first applied to assess the hazard of the Lituya Bay landslide surge that occurred in Alaska in 1958. Later, Pan [4] predicted the maximum wave heights of onshore and alongshore surges based on the theory of wave generation and propagation, combined with the principle of reflection and superposition of nonlinear waves. Xu et al. [5] proposed a method to calculate the far-field propagation of surge waves applicable to complex branching channels. This method is based on the theory of the diversion ratio of branching channels combined with the classical slip velocity analysis methods, such as the slanting bar division method and water resistance influence. Meanwhile, the formula method of the Institute of Water Sciences [6] considers that the sliding velocity and volume of reservoir bank landslides are the most important factors affecting the height of surges based on the observation results of several examples of landslide surges.
The numerical simulation method has several advantages, including the capability of simulating a larger space and longer time, cost-effectiveness, and high repeatability, but its boundary conditions and the determination of landslide parameters are subjective, making the results deviate far from the engineering reality. Sakai et al. [7] proposed a method coupling the discrete unit method and particle semi-implicit solution method (DEM-MPS). Wang et al. [8] coupled the discontinuous deformation analysis method and the smooth particle hydrodynamics method (DDA-SPH) to calculate the generation process of landslide surges. Zhao et al. [9] used discrete cells to simulate the particle system and solved the locally averaged N-S equation to simulate the fluid flow, thus achieving the simulation of landslide surges through fluid–solid coupling. Chen et al. [10] simulated the generation and propagation of water waves induced by the landslide at Wangjiashan by coupling the particle flow model and the reformed group turbulence model in FLOW3D.
The physical model test method is subdivided into two types: the generalized model test and the prototype physical model test. The generalized model test formula method simplifies and generalizes the slide body and the river channel. It also extracts a limited number of important impact parameters for calculation, which takes a relatively short time to complete. Fritz [11] investigated wave types generated by landslides in a two-dimensional physical laboratory model based on the generalized Froude similarity. Heller [12] predicted the wave type directly by the diagram from the experiment, which was conducted by a prismatic wave channel. Mulligan [13] investigated the influence of slide mobility on wave generation by an experiment in a 33.0 m long and 2.1 m wide horizontal wave flume. Tan [14] studied the overall spatial distribution pattern of the maximum wave pressure by a generalized experimental model. Bregoli [15] measured the high velocity and the geometry of a landslide as well as the generated wave characteristics by a non-intrusive system in a 4.10 m long and 2.44 m wide space. Huang [16] used an experimental model coming from two aforementioned failure types in the Three Gorges Reservoir to study and compare slide kinematics and impulsive wave features. Ren [17] derived empirical equations based on most experiments on the first maximum wave amplitude and the second maximum wave amplitude. Evers [18] empirically derived the prediction equations based on experiments that were conducted at VAW in a 4.5 m by 8.0 m wave basin. Tang [19] investigated the impulse waves generated by subaerial landslides of combined solid-block and granular materials based on two-dimensional (2D) laboratory tests. Bregoli [20] developed empirical relationships linking the landslide parameters with the produced wave amplitude, propagation features, and energy by an experiment in a rectangular wave tank that had a length L of 4.10 m and a width W of 2.45 m.
The prototype physical similarity test method consumes more manpower and material resources and takes a very long time, so this method was not frequently used by domestic and foreign research. Since the method adopts the Froude similarity criterion, it is closer to the actual engineering, and is of great significance for solving engineering problems and predicting landslide surge disasters. Muller et al. [21] modeled planar lithic debris flows along the Urnersee River. Heller [22] found that the three-dimensional wave basin experiments are applicable on a much wider prototype range than the two-dimensional wave channel. A potential landslide surge at Mica Reservoir was modeled by Western Canada Hydraulic Laboratories (WCHL) [23]. Huang [24] constructed a large-scale physical Froude-similar model with a scale of 1:200 to produce impulse waves which were constructed based on the Chinese Gongjiafang landslide. Wang [25] conducted a prototype scaled experiment considering the topography effect to propose empirical equations to predict the maximum wave amplitude and wave decay in the channel direction. Landslide-generated tsunami source and propagation scenarios were physically modelled in a three-dimensional tsunami wave basin by Brian C [26]. Gómez J [27] designed the physical model abided by Froude similarity, without distortion, at a scale of 1:200. Wang [28] put forward a multiple regression equation to evaluate the maximum wave amplitude in the generation region by conducting an experiment in a water wave channel model with 1:200 scale based on the topography of the Yangtze River, China. Cao [29,30] considered the section of Wanzhou Jiangnan Tuokou Wharf within Three Gorges Reservoir as the test area to investigate the pressure on bank slopes under the effect of impulse waves generated by landslides.
In general, empirical formulas, generalized models and numerical calculations have some discrepancies with engineering reality, while the prototype physical model test can better restore engineering reality, which has a higher credibility and practical value for the study of landslide surge. The river course characteristics and the landslide volume have an important influence on the head wave height of landslide surge and the climbing height of the dam surface. Study on the influence of river course characteristics and landslide volume on the temporal and spatial distribution characteristics of landslide surge in a reservoir area is an important reference for coastal disaster prevention and mitigation work. This paper uses the Meilishi H3 landslide as an example and conducts a physical modeling experiment to investigate the relationships between the river channel characteristics, the landslide volume, the velocity of the head wave, the surge waveform, and the wave height of the head wave crest along the river course. This paper replaced river depth with river course cross-sectional area as the factor; it also systematically analyzed the influence of landslide volume and channel characteristics.

2. Methodology

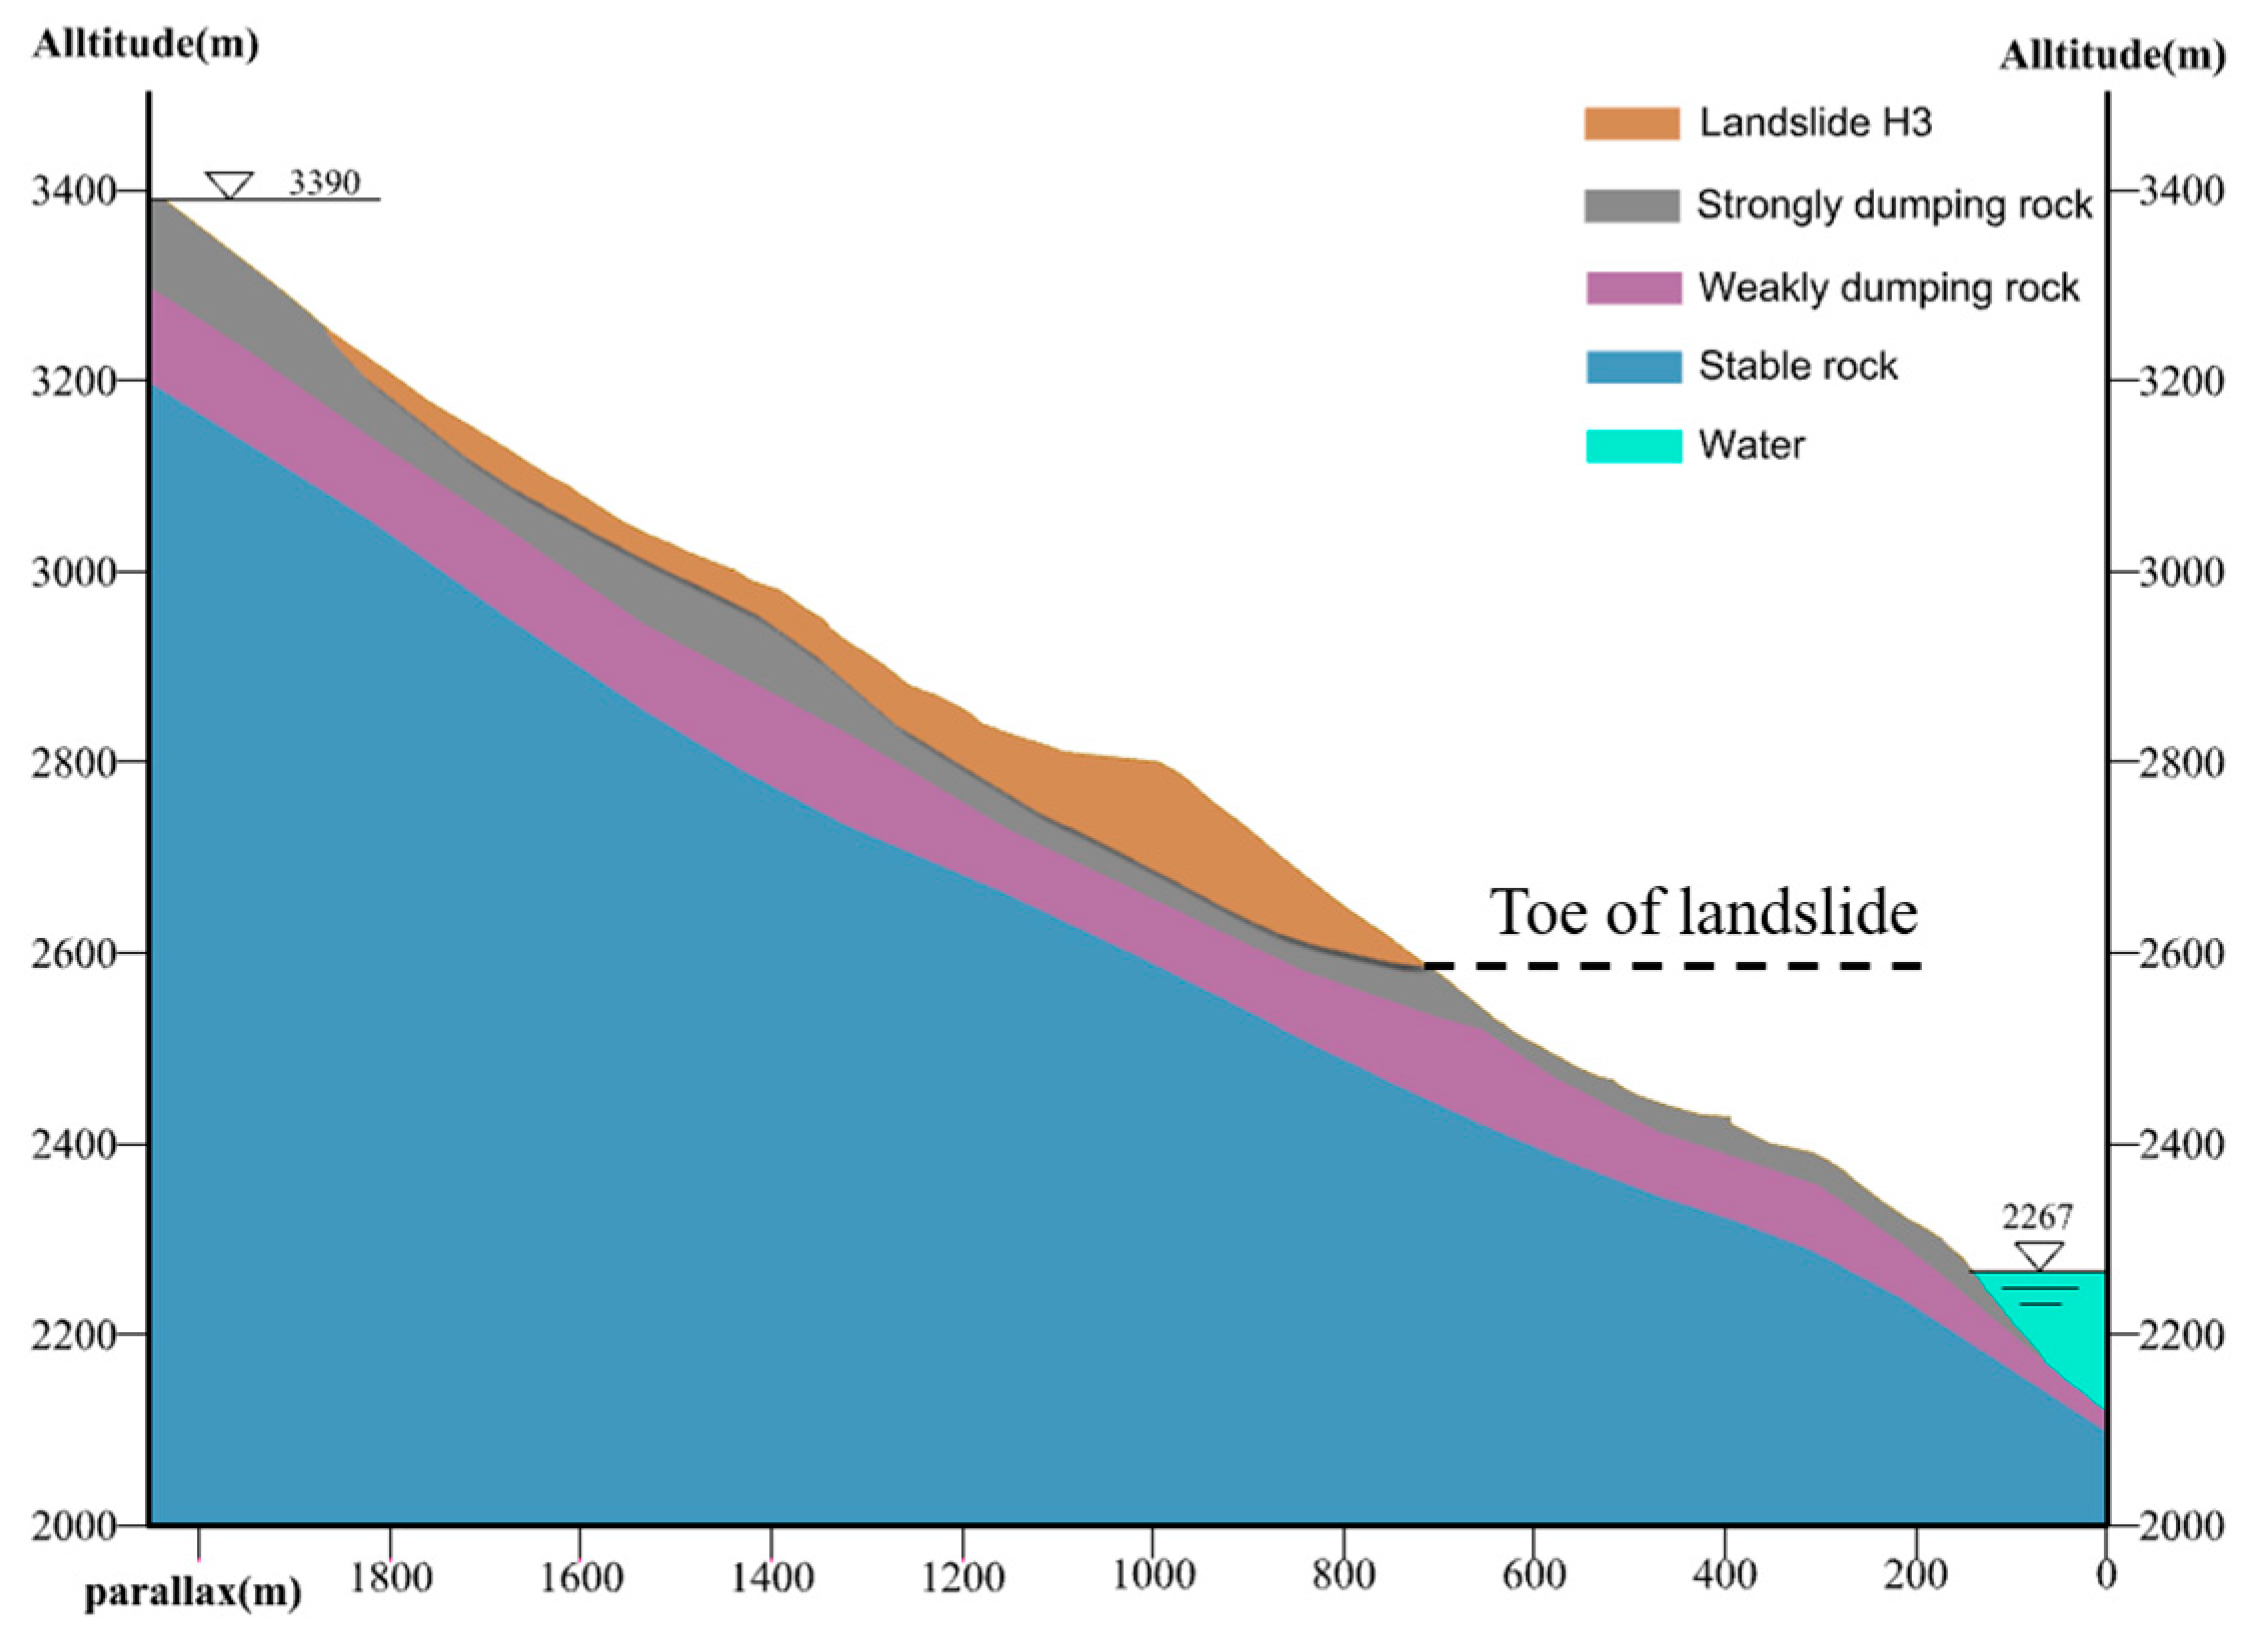
2.1. Overview of the Meilishi H3 Landslide

The Meilishi H3 landslide is about 4~5 km away from the dam site of GS Hydropower Station, the shear outlet of the H3 landslide is about 2600 m, the elevation of the top of the landslide is about 3250 m, and the normal water storage level of the GS Hydropower Station is 2267 m. The distance between the elevation of the mass center of the landslide and the water surface is more than 600 m; this is a typical high-level remote landslide with the volume of the H3 landslide accounting for 1.907 × 10⁷ m3. Such a landslide has the characteristics of large scale, high shear outlet and high destabilization hazard, so it needs to be paid more attention. The landslide body is composed by layered rocks (Figure 1). Its surface layer is basalt rock, which is obviously dragged by the sliding process of shear fault; it also plays the role of “big retaining wall” in the process of “dump-fracture-slip”. The strongly dumping rock in which the slide is located in is mainly composed of pulverized clay, with a small proportion of gravel, and a certain degree of well-cemented rounding.

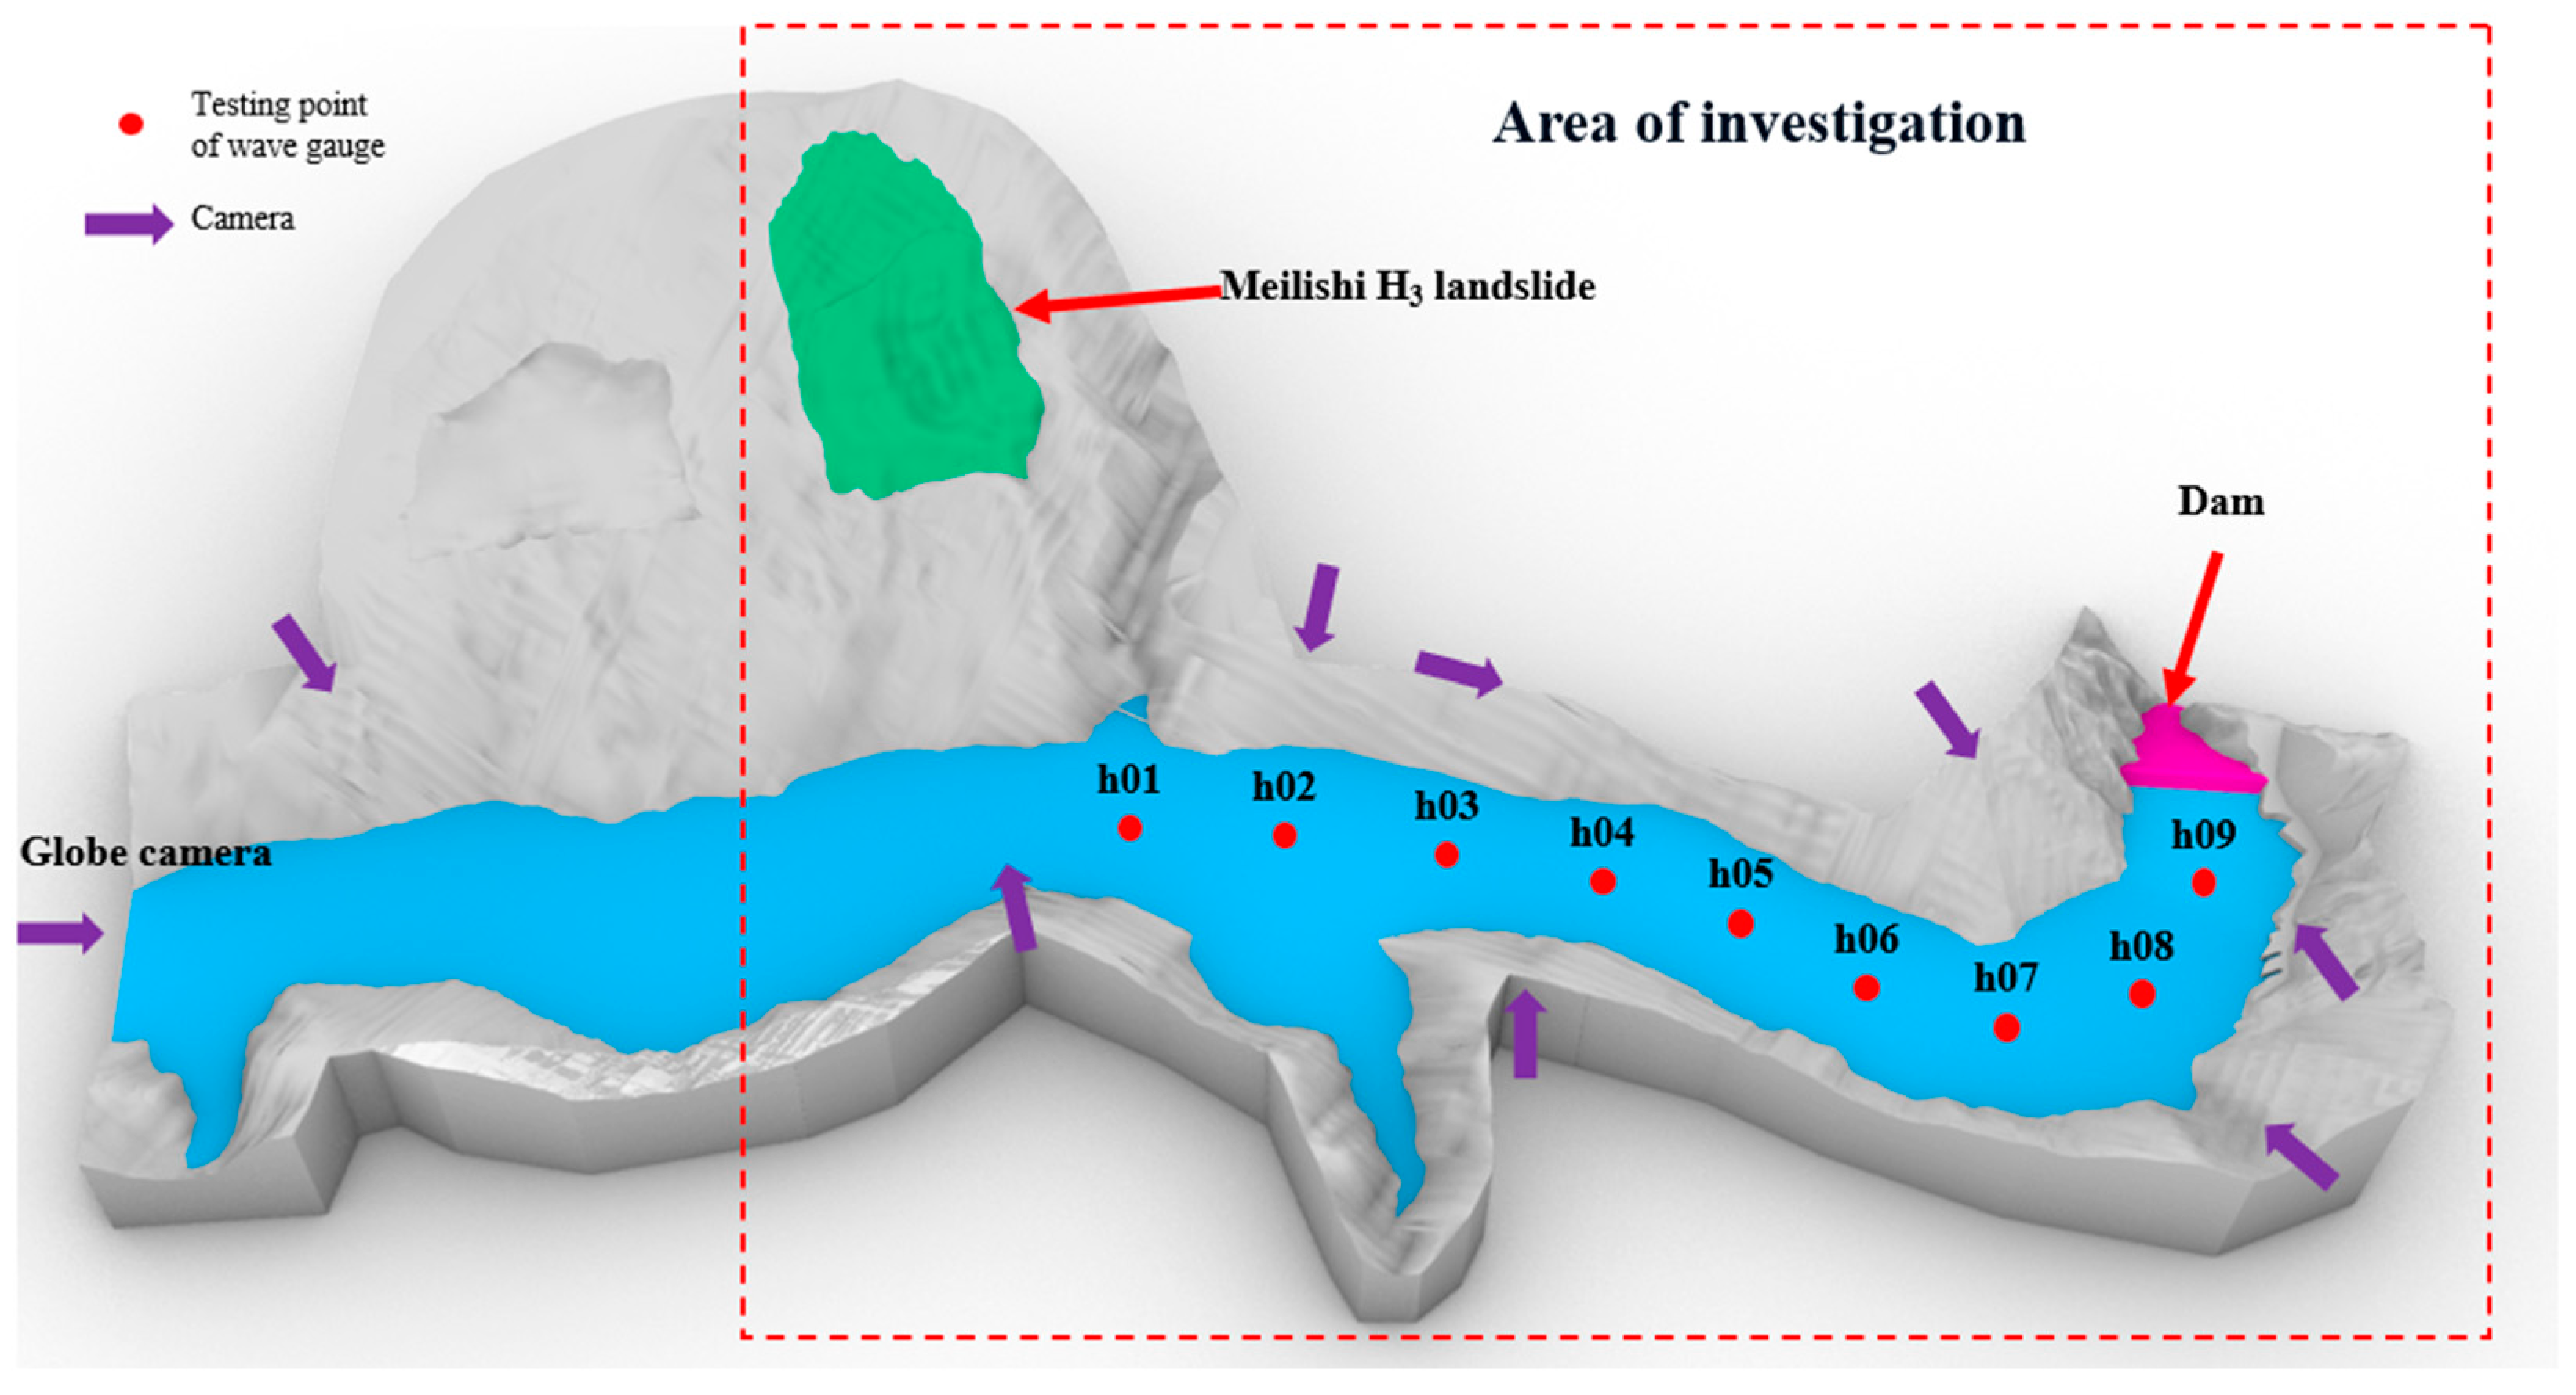
2.2. Setup of the Physical Test

The physical property of landslide surge is the Meilishi H3 landslide located on the river near the dam area of GS hydropower station. The experimental model is constructed with dimensions of 57 m × 27 m × 3.6 m abided by the Froude similarity rule, with the scale compared to actual size being 1:150. The whole model is mainly composed of a landslide test platform and a river course model. The model of river course adopts the cross-section panel method to take the topographic profile of the near-dam area of GS hydropower station as the reference design. The main structure of the river course model is reinforced concrete structure; high-speed cameras are arranged around the model for real-time filming of the surge process. Wave gauges are arranged in the river course to record the height of the surge wave along the course, and wave dissipation pools are set up in the upstream and downstream to minimize the impact caused by wave reflection. A water intake is set up on the opposite bank of the landslide and pumps water into the model.
The landslide platform is mainly composed of a landslide activation platform and crane. The elevation of the landslide platform is 2600 m, corresponding to the height of about 3.6 m in the model experiment. The landslide activation platform mainly consists of jacks, shelf and bar gate. The shelf is mainly made of steel; its substructure adopts a truss structure to improve the load-bearing capacity. On the other hand, the bar gate is used to block the landslide material from slipping down. The slipping speed can be controlled by regulating the height of jacks under the shelf, which adjusts the angle of inclination of the shelf. The crane is used to transport the bulk material, which is mainly composed of black pebbles, the accumulation density is about 1.5~1.6 g/cm3, and the particle size ranges between 2~8 cm.

2.3. Design of the Test Program

The physical model is arranged with wave gauges and high-speed cameras. The location of testing points is shown in Figure 2. A total of 9 wave gauges were arranged in the river course at 3 m intervals; on the other hand, 8 cameras were arranged to monitor the whole process of the surge wave propagation.
In order to study the influence of river course characteristics and landslide volume on the spatial and temporal distribution of landslide surge, five groups of landslide surge tests with different volumes were designed: 0.50 m3, 1.00 m3, 3.00 m3, 4.00 m3, and 5.65 m3. In order to ensure consistency, for each trial, the width and thickness of the surface of the landslide were 4.00 m and 0.20 m respectively, and the depth of the river course was 1.38 m. The test MLS2 was the reference group, and the other four tests were the comparison trials. The design of the test program is shown in Table 1. The river course characteristics investigated were mainly the cross-sectional area, water depth, diversion and river course curvature. The parameter values of these characteristics at each testing point are shown in Table 2:
The analysis of the river course characteristic parameters in Table 2 shows that the cross-sectional area of the river course changes greatly at the testing point h02, which belongs to the diversion. In contrast, the water depth of the river course between the testing points h01~h08 changes gently; nevertheless, testing point h09 changes a lot. The curvature of the river course among testing points h01~h07 ranged between 1.73 and 31.96, whereas the overall trend of the river course did not undergo a large turn, basically tracing a straight line; however, the curvature reached 84.58 at testing point h08, indicating that the river course here undergoes a large turn.

3. Analysis of Temporal and Spatial Distribution Characteristics of Landslide Surge

3.1. Analysis of Head Wave Velocity

The surge waves generated by the landslide are mostly low-frequency waves, and the experimental process is hampered by a variety of external factors, so it is necessary to carry out low-pass filtering on the wave height curve. In order to study the influence of river course characteristics on wave velocity, the test data with volume of 1.00 m3 are analyzed; the time of occurrence of the head wave is shown in Figure 3. An analysis of Figure 3. shows that the relationship between the time of head wave occurrence and the distance change of the nine testing points along the river is close to a straight line. This finding is consistent with the traditional wave theory that the wave velocity does not change when the wave propagation medium is stable. However, at testing point h09, which is located in the end of the curved area, there is a phenomenon of lag in the time of the head wave occurrence. The path of the wave propagation changes due to the curved area, thus increasing the distance that the head wave propagates from testing point h08 to h09. The propagation distance is more than 3 m spacing, set when arranging the testing point, so the head wave velocity still does not change during the propagation of the wave. The relationship between the time of head wave occurrence and the distance from the landslide follows the formula t = as + b. Solving for the parameters of the fitting curve a, b, the formula fits the relationship between t and s, so the reciprocal of a is the wave velocity studied, which is 2.62 m/s for this case.
In order to investigate whether the head wave velocity changes under different volumes, the fitting curve of the time of head wave occurrence was calculated. It refers to five groups of tests, as shown in Figure 4. The five groups of tests in the graph have a high degree of overlap in the time of head wave occurrence at each testing point, indicating that the volume has no effect on the wave velocity of the landslide surge. As a result, the wave velocity curves of each group of tests were fitted to obtain the values of the fitted curves of each group of tests, a and b. The maximum value of b is 0.06, which is close to 0; it is in consistent with the predetermined location of the initial testing point where the head wave occurs at the testing point h01. The wave velocity of each group of tests can be obtained after taking the reciprocal of the parameter a, and the wave velocity ranges between 2.54 m/s and 2.66 m/s. This verifies the limited influence of landslide volume on the head wave velocity of landslide surge. Regression is used to analyze the five groups of data to obtain the fitting curve of wave velocity, which was determined to be 2.65 m/s, as shown in Table 3.
In order to compare the accuracy of the obtained wave velocity, the wave velocity at each testing point in each testing group is calculated, (Table 4). Based on a discrete analysis of these values and the wave velocity sought by the fitted curve, the deviation rates of these data points are shown in Figure 5. It can be found that there are a total of 28 data points with a deviation rate of less than 15%, while there are a total of 12 data points with a deviation rate of more than 15%; the highest deviation rate is 29.08%. In general, it indicates that the fitting curve is in accordance with the propagation law of the wave velocity in the landslide surge.

3.2. Characterization of Surge Waveforms

Since factors such as diversion area and curved area existed in the physical experimental model, these factors were also taken into account when considering the arrangement of the testing points of wave gauges. Nine testing points were divided into a diversion area (h01~h03), a topographically similar area (h03~h07), and a curved area (h07~h09) according to their respective locations. The experimental data of the reference group MLS2 were analyzed. Figure 6 shows the wave height gauge data of the nine testing points within 40 s after low-pass filtering processing; the red line depicts the time of head wave occurrence at each point.
Figure 7 shows that the waveform changes greatly after 20 s. It is due to the fact that, during wave propagation, subsequent waves are affected by the wave reflections that the head wave encounters from the riverbanks, so only the waveforms in the 20 s after the head wave are analyzed. For the diversion area of 0 m~6 m away from the testing point h01, the waveforms are greatly affected by the significant changes in terms of river course width, average water depth and cross-sectional area of the river course during the surge propagation. Testing points h01 and h02 are only affected by the diversion area, so for the head wave, the waveforms are basically the same, with some differences in wave height. When the surge propagates to the testing point h03, the topography of the testing point h03 has been changed. The number of wave peaks at testing point h03 appear to decrease compared with testing point h02 in the same period of time; this is due to the superposition of the reflected wave and other waves, apart from head wave. The number of peaks of the surge changes considerably, so the number of peaks will be a big change for the surge propagating in the diversion area. In the physical model, there are also some areas where the topographic factors such as river course width and water depth are almost unchanged; these areas are called topographically similar areas, so the waveforms of the wave propagation are less affected. The area in the testing points h03~h07 belongs to the topographically similar area; waveforms are basically the same in the region of the testing points h04, h05 and h06. In 20 s, these waveforms all appear in five peaks, and the trend of change is also relatively close, so that the waveform can be considered to be similar when the wave propagates in the topographically similar area. There are also some curved areas in the river; in this kind of area, the direction of the water flow in the river changes a lot. So, for the surge, the propagation direction is also affected by the influence of the curves; then, the waveforms in these areas are greatly affected. The range of testing points h07~h09 belongs to the curved area, because in the wave propagation the river topography appears to turn, and the direction of the water flow appears to be a big change, so there is a more obvious change in the waveform. Testing points h07 and h08 are in the same propagation direction with the same number of wave peaks in 20 s. The waveform is relatively close, but the relative wave height will be changed a lot since h08 is not in the central axis of the wave propagation path. The number of wave peaks at testing point h09 change considerably compared with h07 in 20 s; this is due to the fact that testing point h07 and h09 are not in the same propagation direction. Thus, the waveforms appeared to be a big difference due to the influence of the curved area where the propagation direction changes a lot. Surge propagation in the curved area occurs more obviously under wave superposition effect, and the number of wave peaks decreases.
To analyze the graph of surge wave height at each testing point, it is easy to know that the maximum wave height at some testing points may not be the head wave crest. In order to verify its regularity, five groups of testing data at each testing point of the maximum wave height and the head wave crest are shown in Table 5:
From the analysis of the data in Table 5, it can be seen that the maximum wave height and the head wave crest are basically the same at the testing points in the similar area, while for the diversion area and the curved area, the maximum wave height does not appear in the head wave. Some of them appear in the second wave or even the third one; this is due to the superposition effect of the wave reflection, which is more significant in the two areas. When the landslide volume is small, the head wave crest may be the maximum wave height of the testing points; however, when the volume is more than 3 m3, the head wave crest is not the maximum wave height. This phenomenon is involved with the full submerge time. The full submerge time was calculated from the video, and the results are shown in Table 6. Based on the data in Table 6, it can be found that with the increase in volume, the landslide full submerge time also increases. When the time is greater than the wavelength, the subsequent volume into the water affects the wave height of the second wave of the surge, so the maximum wave height is not necessarily the head wave crest. For this project, when studying the impacts of landslide surge disasters on a river course with diversion or curved areas, not only the disaster risk of the head wave, but also the maximum wave height that occurs in the subsequent wave column should be considered.

3.3. Analysis of Factors Influencing the Head Wave Crest

As a natural disaster, landslide surge is mainly caused by the damage to the surrounding area by the surge height, so the study of the head wave crest is quite important. The head wave crest of each testing point along the river course is depicted. The wave height data along the course are also divided into three areas to analyze the height of the head wave crest.
In order to reduce the size effect of the surge brought by large volume, MLS2 was used as the reference group when analyzing the influence of river course characteristics on the head wave crest of landslide surge. For the two-dimensional experimental case, its topography is relatively simple. Water depth is the only factor that changes, so the main factor of the crest of the head wave along the river course is the water depth. For the three-dimensional complex river model, its topography is complex, the wave height along the river course is related not only to the water depth, but also to the diversion and the change of the cross-sectional area of the channel, the bends and other factors. The change in river course characteristics and the head wave crest curve are shown in Figure 7.
The analysis of each area in Figure 8 shows that for the topographically similar area, the change in wave height between the testing points h03~h07 is opposite to the change in cross-sectional area and water depth at the testing points. On the other hand, the head wave crest from the testing point h06 to h07 is inconsistent with the change in water depth, while it is opposite to the change in cross-sectional area. For the complex river course in the absence of huge differences in topography, the most important factor is the cross-sectional area of the river channel; in addition, the head wave crest and cross-sectional area are negatively correlated. For the diversion area, its cross-sectional area changes abruptly at the testing point h02, which corresponds to the actual situation of the river course that, as a diversion area between the testing point h01~h03, has a corresponding decrease in wave height. When the surge propagates from the testing point h02 to h03, although the cross-sectional area decreases, the wave height of the surge still decreases due to the diversion. Testing point h03 has a reduced cross-sectional area compared to testing point h01, but the wave height at testing point h03 decreases; therefore, when studying the wave height along the river, these diversion areas should be taken into consideration. Generally speaking, the wave height decreases after the surge passes through the diversion area. For the curved area, testing point h07 is the beginning of the river curve, testing point h08 is located in the middle of the curved area, and testing point h09 is located at the end of the curve. The cross-sectional area of the testing points h07 decreases compared to h08; meanwhile, the corresponding wave height increases. This phenomenon is inconsistent with the law of topographic similarity area, but the amplitude of the wave heights of the testing points is much larger than that of the topographic similarity area, whereas the cross-sectional area of the testing point h09 relative to the testing point h08 decreases significantly. This is due to the large change in the water depth of the river course in front of the dam when the river width changes insignificantly, but the height of the head wave at the testing point h09 relative to the testing point h08 decreases. However, the head wave crest at testing point h09 decreases relative to testing point h08, which is contrary to the law of topographically similar area. The head wave crest cuts down when there is a big turn in the river. For the testing points h07 and h09, the cross-sectional area of the testing points greatly decreased, and the head wave crest of both of them increase, so it can be seen that when the river does not have curved areas, it still follows the law of the topographic similarity area. But when judging the change in the head wave crest at the end of the curve, it is necessary to take into account the effect of the reduction in the height of the wave brought about by the curve. Based on the analysis of the head wave crest along the river, when the river width and water depth change a little and the steady wave moves forward, the cross-sectional area of the river is the main factor that determines the trend of the head wave crest. When the area includes large changes in the width of the river and diversion, the head wave crest of the river will decrease when passing through the area. Moreover, when there is a curve in the river, the head wave crest in the middle part of the bend increases due to wave reflection. The wave height at the end of the curve decreases compared to the middle part of the curve, and the height of the head wave crest decreases when the wave propagation completes the turn.
In order to investigate the effect of volume on the variation in head wave crests along the river, the head wave crests of the five sets of test landslide surges are plotted in Figure 8. The analysis of the data in the figure indicates that the five sets of data have the same pattern in the topographically similar area, meaning that the change in the cross-sectional area of the river course in the topographically similar area is the main factor affecting the head wave crest of the landslide surge. However, for the diversion area, the head wave crest at the testing point h03 relative to h02 increases when the square volume is more than 3 m3. Such a finding is opposite to the previous analysis for the small volume. But the head wave crest at the testing point h03 decreased compared to the testing point h01. The head wave crest in the curved area increased relative to the wave crest at the beginning of the curve, but the head wave crest at the end of the curve increased when the volume was more than 3 m3. It is opposite to the previous analysis of small volume. It also indicates that the increase in volume amplified the effect of the change in the cross-sectional area of the river course brought about by the cofferdam. Comparing the test groups with volume more than 3 m3 with the test groups whose volume are less than 3 m3, it can be found that the larger the volume, the larger the change in the head wave crest influence by the change in the cross-sectional area of the river course, so it is believed that the cross-sectional area of the river channel plays a significant role in the head wave crest of the landslide surge in the case of large landslide volume. For the Meilishi H3 landslide, the impact of the change in the head wave crest in the diversion area is small. There is no hazardous rock or other areas prone to secondary hazards in the vicinity; however, there are ice-water accumulations on the left bank and rock accumulations on the right bank in the curved area. As the head wave crest increases in the curved area, when an H3 landslide occurs, the surge wave propagates to the curved area. In addition, the landslide surge wave climbs on the left and right banks, which produce external force on the left and right banks of the pile, causing stress changes in the pile. If the surge wave height is too high, it will make both banks of the pile destabilize, and it will even cause a secondary landslide disaster. When the accumulations located in the curved area also undergo landslides at the same time, the height of the surge wave will be far more than that of a single landslide generated by the H3 landslide. Overall, when these surge waves superposed propagate to the front of the dam, it will be a serious threat to the dam and hydroelectric buildings.

4. Discussion

Based on the field survey and the collection of landslide data, a 1:150 scale physical model of the Meilishi H3 landslide surge was devised to investigate the influence of landslide volume and channel characteristics on the temporal and spatial distribution of landslide surge. It can be found that river course characteristics have a greater impact on the propagation of landslide surge. Considerations of landslide surge in the study need to pay attention to the diversion area and curved area. Both the head wave crest and waveform were affected and changed, especially in the curved area; hence, attention should be paid to the sudden change in the wave crest. In the area where the river cross-sectional area changes a lot, risk prevention and control measures against landslide surge need to be taken. The influence of landslide volume on the spatial and temporal distribution characteristics of landslide surge is also very significant, and the disaster risk of landslide surge increases in the case of large volume. For the surge wave speed, the influence of the square volume is small, so for the project, it can implement the test with small square volume to carry out the related disaster risk warning.
There are some advantages in the current research. This experiment, compared to the generalized model experiment method, is more desirable to the reality of landslides. The granular material, compared to other materials chosen as the slide body material, is closer to the process of landslide disintegration. In the analysis of the factors, the cross-sectional area of the river was considered as one of the factors of the river characteristics. The analysis also systematically synthesized the influence of landslide volume and river course characteristics.
There are some shortcomings in the current research. The selection of materials of the landslide did not consider the existence of cohesion in the landslide body, so in the future, the factor of cohesion can be taken into account in the selection of materials. The curved area constructed in the experiment was relatively small, and a certain model size limited the accuracy of the study of the curved area. Improving the construction of the curved area model can be considered to improve the accuracy of the test results.
In the future, for the Meilishi H3 landslide, it will be meaningful to study the pressure change induced by landslide surge on the two banks of the pile in the curved area, which will aid determination of whether the two banks of the pile will experience landslides or not. A numerical calculation can be conducted to compare and verify the results of the physical experiment. Experiments testing other landslide variables such as the material of the landslide body and the landslide velocity can be conducted, and it will be meaningful to fit some of the relevant empirical formulas.

5. Conclusions

Based on the large-scale physical modeling experiment, landslide surge caused by the Meilishi H3 landslide was investigated. The experiment adopted a water level of 1.38 m, designed five test groups of different volumes and chose the test volume of 1.00 m3 for the reference group. The other tests acted as the comparative test groups. The leading area of the landslide was 4.00 m × 0.20 m. The study combined with the river course characteristics and volume analyzed the wave height test data of the spatial and temporal distribution characteristics of the landslide surge waves. The main research objective was to find the relationships between the head wave velocity, surge waveform, and head wave crest along the river course. Based on the findings, the conclusions can be summarized as follows:
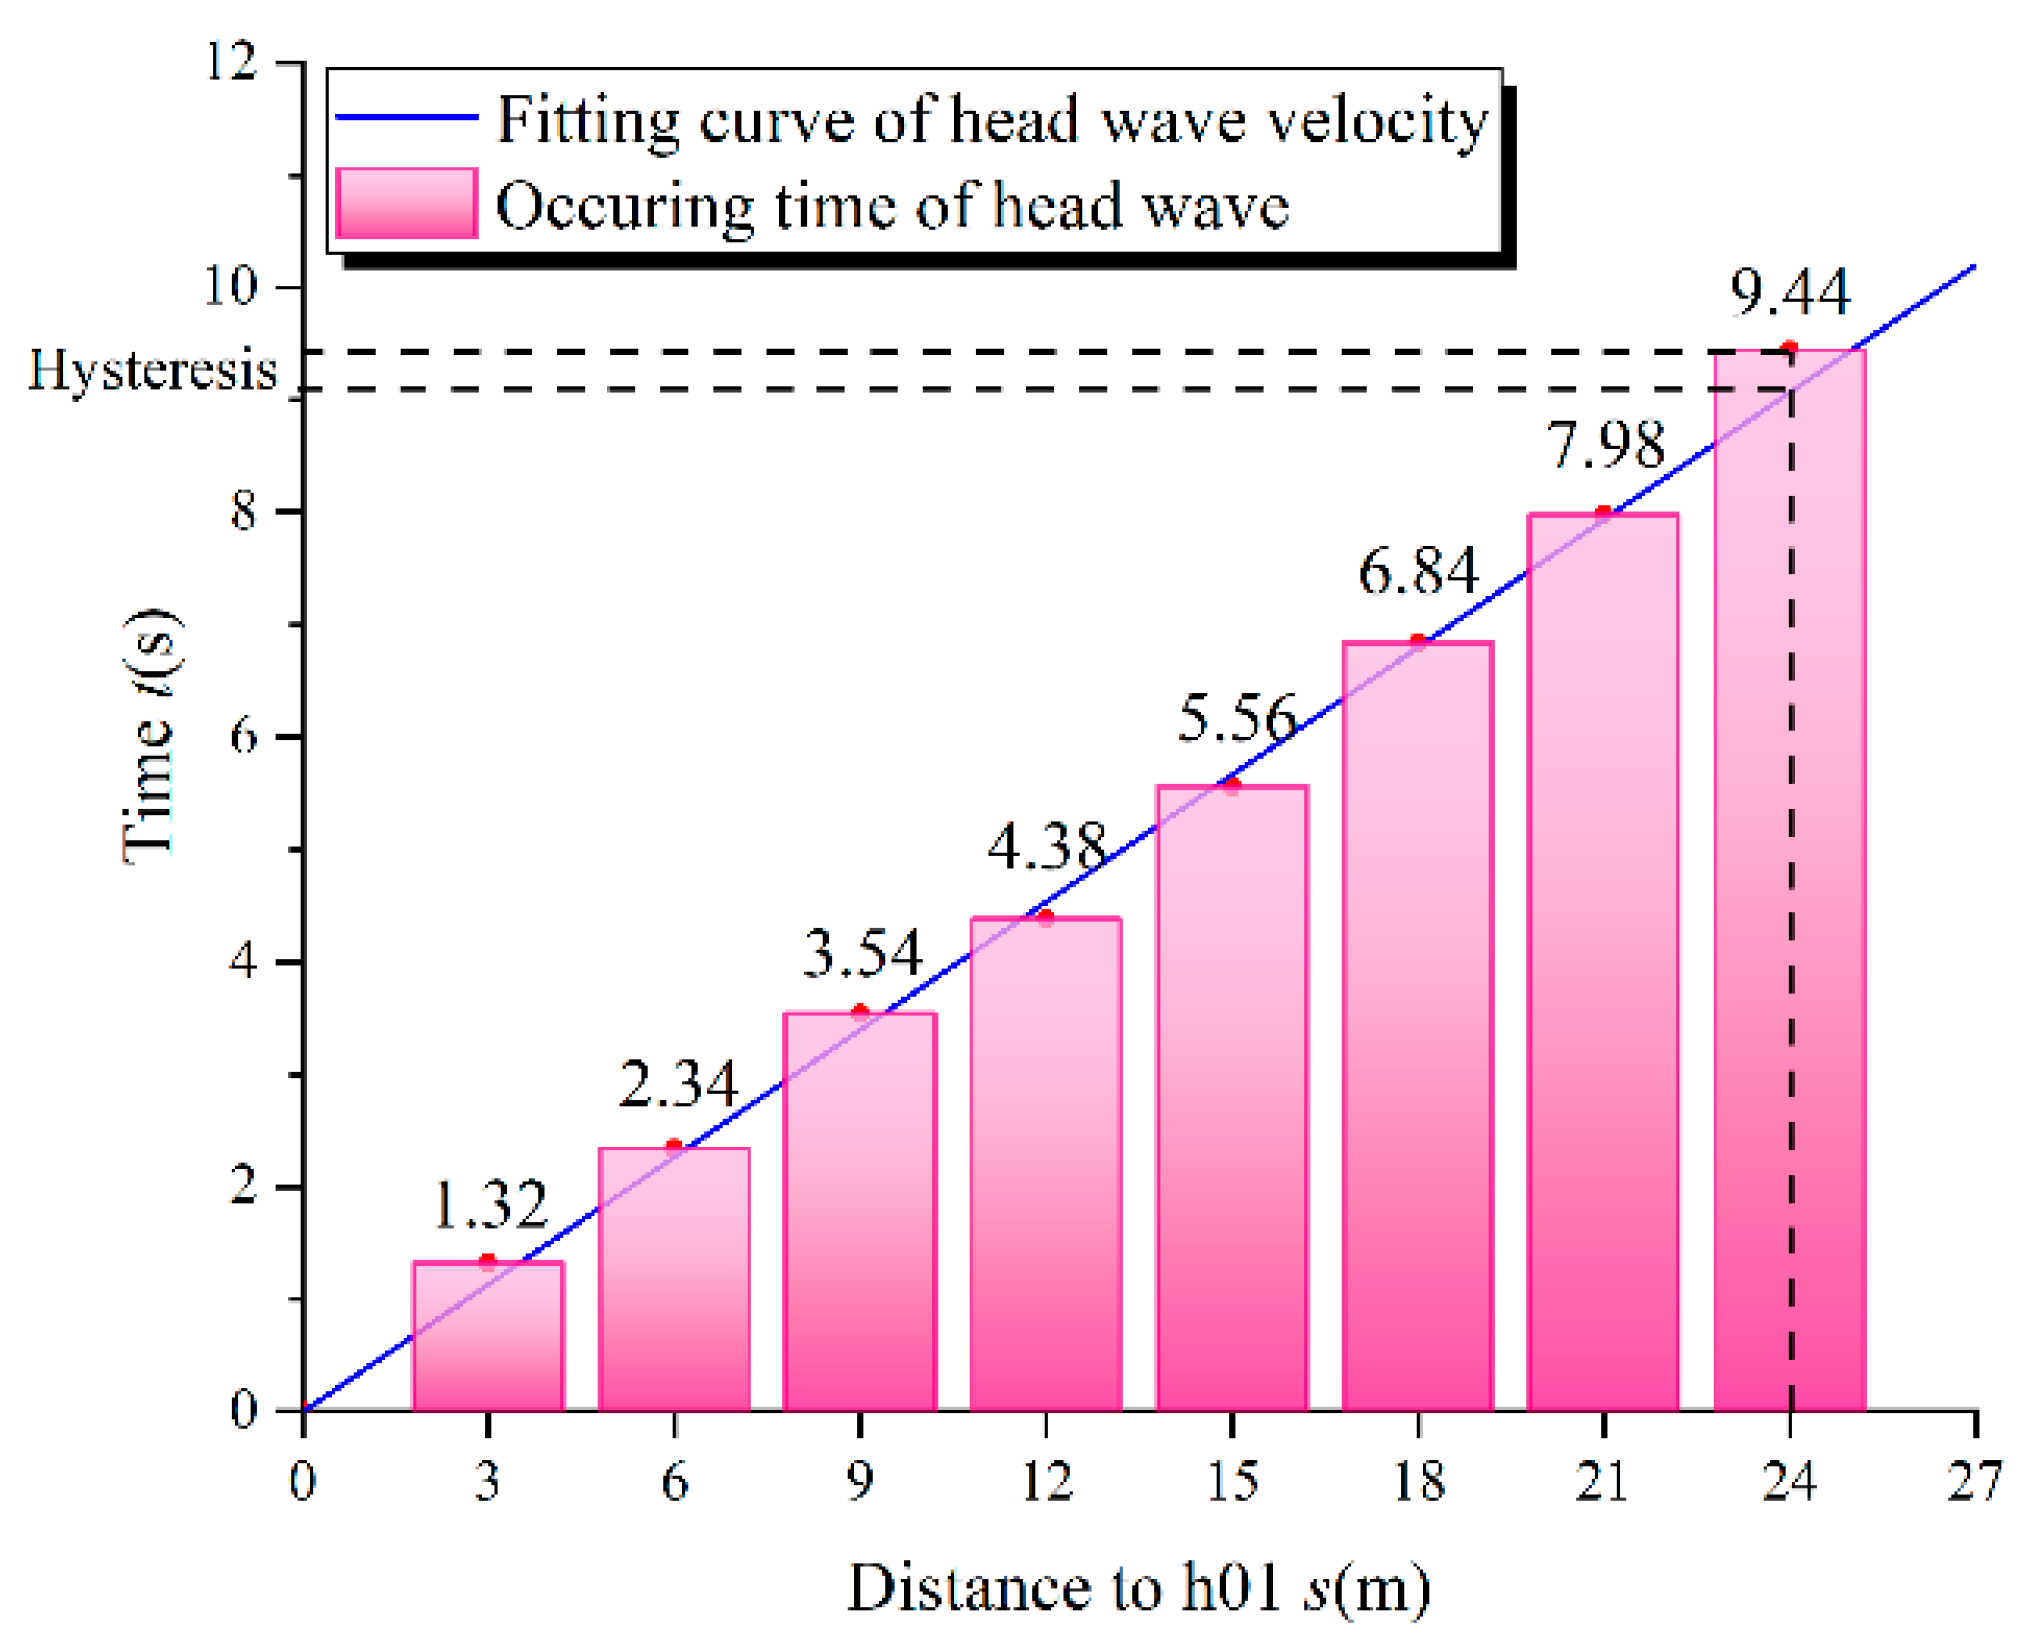
  • By analyzing the time of head wave occurrence, the fitting curve of the time of head occurrence was plotted, and the fitting curve was approximated as a straight line, indicating that the wave velocity of the head wave propagation is unchanged in the river course. Additionally, the wave velocity of the head wave of the MLSH3 landslide was about 2.65 m/s.
  • The waveforms of surges are greatly influenced by the river course characteristics. In the first 20 s, when the surges are less influenced by the reflected waves, the number of wave crests of the surge in the topographically similar area is basically the same, while the number of wave crests of the surge in the diversion area and the bending area have a large change. Comparing the maximum wave height and the head wave crest, it can be found that the maximum wave height does not necessarily occur at the head wave crest. Under the condition of small volume, the head wave crest is the maximum wave height for the topographically similar area. In contrast, for the diversion area and the curved area, the maximum wave height of the surges may occur in the secondary wave or even the subsequent waves. Under the condition of large volume, the head wave crest may not be the maximum wave height. Therefore, when studying the effect of landslide surge wave height on the river course in the reservoir area, the effect of the head wave is not the main factor to be analyzed; instead, the effect of the subsequent wave column needs to be considered.
  • For the analysis of the head wave height data of along-stream landslide surges, it can be seen that the river course characteristics have a greater influence on the head wave crest compared to that in the two-dimensional experiments. The main factor changes from the water depth to the cross-sectional area. In the river without diversion areas and curved areas, the head wave crest is negatively correlated with the cross-sectional area of the river course. Moreover, the head wave crest decreases after passing through diversion areas and curved areas in the river course; but the head wave crest increases in the middle of the curved area. The cross-sectional area of the river channel has a significant influence on the crest of the first broadcast wave in the process of propagation of landslide surges when the landslide volume is relatively large. Therefore, the cross-sectional area of the river course is a major factor that affects the head wave crest of the landslide surge.
  • There is a possibility of instability of the accumulations on both sides of the curved area near the dam, and the wave height in the middle section of the curved area increases. Thus, the surge climb on the accumulations in the curved area also increases. Since high surge climb affects the stability of the accumulations, it can cause secondary landslides to occur in the surge disaster chain. Therefore, when studying the disaster risk analysis of H3 landslide surge on the reservoir area, it is crucial to carry out the research on the influence of landslide surge on the stability of the accumulations on both sides.

Author Contributions

Conceptualization, Y.Z., Q.H. and W.X.; methodology, Y.Z. and S.C.; validation, W.X.; formal analysis, Y.Z. and F.C.; resources, Q.H. and W.X.; data curation, Y.Z., F.C. and H.W.; investigation, Y.Z., H.W. and S.C., writing—original draft, Y.Z., S.C. and W.X.; writing—review and editing, Y.Z., H.W. and W.X.; supervision, W.X. and Q.H. All authors have read and agreed to the published version of the manuscript.

Funding

This work was financially supported by National Natural Science Foundation of China (51939004), Major Science and Technology Special Program of Yunnan Province (202202AF080004) and Key Science and Technology Project of Huaneng Group (HNKJ22-H107).

Institutional Review Board Statement

Not applicable.

Informed Consent Statement

Not applicable.

Data Availability Statement

The original contributions presented in the study are included in the article. Further inquiries can be directed to the corresponding author.

Acknowledgments

The authors would like to thank PowerChina Kunming Engineering Corporation Limited for providing the study site and geological data.

Conflicts of Interest

The authors declare no conflicts of interest.

References

  1. Chen, S.Z.; Xu, W.Y.; Shi, A.C.; Yan, L. Review of hazard chain of landslide surge for high dams and large reservoirs. Adv. Sci. Technol. Water Resour. 2023, 43, 83–93. [Google Scholar] [CrossRef]
  2. Meng, Y.D.; Xu, W.Y.; Tian, B.; Dai, H.-C. Hydrodynamic analysis of river landslide disasters in deep-cut gorge. Rock Soil Mech. 2011, 32, 927–934. [Google Scholar] [CrossRef]
  3. Noda, E. Water waves generated by landslides. J. Waterw. Harb. Coast. Eng. Div. 1970, 96, 835–855. [Google Scholar] [CrossRef]
  4. Pan, J.Z. Anti-Slip Stability and Landslide Analysis of Buildings; China Water Power Press: Beijing, China, 1980. [Google Scholar]
  5. Xu, W.Y.; Qin, C.C.; Zhang, G.K.; Deng, S.H.; Hu, Y.F.; Zhang, H.L. Calculation method for far-field propagation of landslide surge based on flow diversion ratio of a bifurcated river. Adv. Sci. Technol. Water Resour. 2022, 42, 20–24. [Google Scholar] [CrossRef]
  6. Zhong, D.H.; An, N.; Li, M.C. 3D dynamic simulation and analysis of slope instability of reservoir banks. Chin. J. Rock Mech. Sand Eng. 2007, 26, 360–367. [Google Scholar]
  7. Sakai, M.; Shigeto, Y.; Sun, X.; Aoki, T.; Saito, T.; Xiong, J.; Koshizuka, S. Lagrangian–Lagrangian modeling for a solid–liquid flow in a cylindrical tank. Chem. Eng. J. 2012, 200–202, 663–672. [Google Scholar] [CrossRef]
  8. Wang, W.; Chen, G.-Q.; Zhang, H.; Zhou, S.-H.; Liu, S.-G.; Wu, Y.-Q.; Fan, F.-S. Analysis of landslide-generated impulsive waves using a coupled DDA-SPH method. Eng. Anal. Bound. Elements 2016, 64, 267–277. [Google Scholar] [CrossRef]
  9. Zhao, J.; Shan, T. Coupled CFD–DEM simulation of fluid–particle interaction in geomechanics. Powder Technol. 2013, 239, 248–258. [Google Scholar] [CrossRef]
  10. Chen, S.; Shi, A.; Xu, W.; Yan, L.; Wang, H.; Tian, L.; Xie, W.-C. Numerical investigation of landslide-induced waves: A case study of Wangjiashan landslide in Baihetan Reservoir, China. Bull. Eng. Geol. Environ. 2023, 82, 110. [Google Scholar] [CrossRef]
  11. Fritz, H.M.; Hager, W.H.; Minor, H.-E. Near field characteristics of landslide generated impulse waves. J. Waterw. Port Coastal Ocean Eng. 2004, 130, 287–302. [Google Scholar] [CrossRef]
  12. Heller, V.; Hager, W. Wave types of landslides generated impulse waves. Ocean. Eng. 2010, 38, 630–640. [Google Scholar] [CrossRef]
  13. Mulligan, R.P.; Take, W.A.; Bullard, G.K. Non-Hydrostatic Modeling of Waves Generated by Landslides with Different Mobility. J. Mar. Sci. Eng. 2019, 7, 266. [Google Scholar] [CrossRef]
  14. Tan, J.-M.; Huang, B.-L.; Zhao, Y.-B. Pressure characteristics of landslide-generated impulse waves. J. Mt. Sci. 2019, 16, 1774–1787. [Google Scholar] [CrossRef]
  15. Bregoli, F.; Medina, V.; Bateman, A. Versatile image-based measurements of granular flows and water wave propagation in experiments of tsunamis generated by landslides. J. Vis. 2020, 23, 299–311. [Google Scholar] [CrossRef]
  16. Huang, B.; Yin, Y.; Chen, X.; Liu, G.; Wang, S.; Jiang, Z. Experimental modeling of tsunamis generated by subaerial landslides: Two case studies of the Three Gorges Reservoir, China. Environ. Earth Sci. 2013, 71, 3813–3825. [Google Scholar] [CrossRef]
  17. Ren, K.J.; Bin Han, J.; Huang, G.B.; Jiang, Z.B. Preliminary Experimental Study of Landslide Generated Waves in the Reservoir. Appl. Mech. Mater. 2014, 641–642, 321–325. [Google Scholar] [CrossRef]
  18. Evers, F.M.; Hager, W.H. Spatial impulse waves: Wave height decay experiments at laboratory scale. Landslides 2016, 13, 1395–1403. [Google Scholar] [CrossRef]
  19. Tang, G.; Lu, L.; Teng, Y.; Zhang, Z.; Xie, Z. Impulse waves generated by subaerial landslides of combined block mass and granular material. Coast. Eng. 2018, 141, 68–85. [Google Scholar] [CrossRef]
  20. Bregoli, F.; Bateman, A.; Medina, V. Tsunamis generated by fast granular landslides: 3D experiments and empirical predictors. J. Hydraul. Res. 2017, 55, 743–758. [Google Scholar] [CrossRef]
  21. Muller, D.; Schurter, M. Impulse waves generated by an artificially induced rockfall in a Swiss lake. In Proceedings of the 25th IAHR Congress, Tokyo, Japan, 30 August–9 September 1993; pp. 209–216. [Google Scholar]
  22. Heller, V.; Moalemi, M.; Kinnear, R.D.; Adams, R.A. Geometrical Effects on Landslide-Generated Tsunamis. J. Waterw. Port Coastal Ocean Eng. 2012, 138, 286–298. [Google Scholar] [CrossRef]
  23. Ball, J.W. Hydraulic Model Studies, Wave Action Generated by Slides into Mica Reservoir; Western Canada Hydraulic Laboratories: Vancouver, BC, Canada, 1970. [Google Scholar]
  24. Huang, B.; Yin, Y.; Wang, S.; Chen, X.; Liu, G.; Jiang, Z.; Liu, J. A physical similarity model of an impulsive wave generated by Gongjiafang landslide in Three Gorges Reservoir, China. Landslides 2013, 11, 513–525. [Google Scholar] [CrossRef]
  25. Wang, W.; Chen, G.; Yin, K.; Wang, Y.; Zhou, S.; Liu, Y. Modeling of landslide generated impulsive waves considering complex topography in reservoir area. Environ. Earth Sci. 2016, 75, 1–15. [Google Scholar] [CrossRef]
  26. McFall, B.C.; Fritz, H.M. Physical modelling of tsunamis generated by three-dimensional deformable granular landslides on planar and conical island slopes. Proc. R. Soc. A Math. Phys. Eng. Sci. 2016, 472, 20160052. [Google Scholar] [CrossRef] [PubMed]
  27. Gómez, J.; Berezowsky, M.; Lara, A.; González, E. Prediction of the water waves generated by a potential semisubmerged landslide in La Yesca reservoir, Mexico. Landslides 2016, 13, 1509–1518. [Google Scholar] [CrossRef]
  28. Wang, Y.; Li, D.; Liu, Y. Experimental study on amplitudes of water waves generated by riverbank landslide. Natl. Nat. Sci. Found. China 2013, 7, 473–479. [Google Scholar]
  29. Cao, T.; Wang, P.; Hu, J.; Qiu, Z.; He, P. Experimental study on the pressure of impulse waves generated by landslides on a bank slope. Mar. Georesources Geotechnol. 2021, 39, 1125–1138. [Google Scholar] [CrossRef]
  30. Cao, T.; Wang, P.-Y.; Qiu, Z.-F.; Ren, J.-X. Influence of impulse waves generated by rocky landslides on the pressure exerted on bank slopes. J. Mt. Sci. 2021, 18, 1159–1176. [Google Scholar] [CrossRef]
Figure 1. Meilish H3 landslide rock layered structure.
Applsci 14 02104 g001
Figure 2. Layout of wave gauges.
Applsci 14 02104 g002
Figure 3. Timing of the head wave.
Applsci 14 02104 g003
Figure 4. Fitting curve of head wave velocity.
Applsci 14 02104 g004
Figure 5. The ratio of wave velocity deviation.
Applsci 14 02104 g005
Figure 6. Landslide surge wave height curve at nine testing points of test MLS2. (a) Diversion area; (b) topographically similar area; (c) curved area.
Applsci 14 02104 g006
Figure 7. Course characteristic factors and head wave crest at testing points.
Applsci 14 02104 g007
Figure 8. The head wave crest at each testing point under different volumes.
Applsci 14 02104 g008
Table 1. Test program.
FactorsMLS1MLS2MLS3MLS4MLS5
Water depth (m)1.381.381.381.381.38
Volume (m3)0.501.003.004.005.65
Width of landslide (m)4.004.004.004.004.00
Thickness of landslide (m)0.200.200.200.200.20
Length of landslide (m)0.631.253.755.007.06
Velocity of landslide (m/s)5.835.835.835.835.83
Table 2. River course characteristic parameters at nine testing points.
Testing PointCross-Sectional Area (m2)Water Depth (m)Diversion
(Yes/No)
River Course Curvature
h012.791.27No27.03
h024.541.25Yes12.58
h032.291.25No27.28
h042.791.33No4.37
h052.721.31No8.26
h062.801.35No31.96
h073.081.24No1.73
h082.831.28No84.58
h091.690.79No7.33
Table 3. Parameters of wave velocity fitting curve under different volumes.
ParametersMLS1MLS2MLS3MLS4MLS5Fitting Curve
a0.3770.3760.3820.3930.3770.378
b0.0600.0590.0160.0070.0500.008
R20.9990.9980.9970.9940.9960.997
1/a2.652.662.622.542.652.65
Table 4. Wave velocity of adjacent testing points under different volumes.
Testing PointMLS1MLS2MLS3MLS4MLS5
h01~h02 velocity (m/s)2.382.592.272.052.78
h02~h03 velocity (m/s)2.502.782.943.262.46
h03~h04 velocity (m/s)3.002.782.52.722.72
h04~h05 velocity (m/s)3.003.453.572.883.00
h05~h06 velocity (m/s)2.672.422.542.083.33
h06~h07 velocity (m/s)2.312.272.343.542.11
h07~h08 velocity (m/s)2.782.342.632.862.38
h08~h09 velocity (m/s)2.423.062.052.802.63
Table 5. Maximum wave height and head wave crest at testing points under different volumes.
AreaTesting PointHead Wave Crest (cm)Maximum Wave Height (cm)
MLS1MLS2MLS3MLS4MLS5MLS1MLS2MLS3MLS4MLS5
Diversion areah010.691.792.243.274.280.821.923.863.985.29
h020.651.601.992.483.610.761.953.143.314.30
h030.371.312.133.023.700.371.313.143.023.70
Similar areah040.310.981.742.643.370.310.982.872.883.90
h050.321.121.832.663.390.221.122.383.293.39
h060.291.001.802.413.260.591.122.152.873.80
Curved areah070.240.861.792.403.000.571.322.593.873.59
h080.771.482.412.653.330.841.653.302.873.44
h090.661.333.394.255.010.661.503.954.545.07
Table 6. Full submerge time under different volumes.
TestMLS1MLS2MLS3MLS4MLS5
Full submerge time (s)5.215.816.316.587.05
Disclaimer/Publisher’s Note: The statements, opinions and data contained in all publications are solely those of the individual author(s) and contributor(s) and not of MDPI and/or the editor(s). MDPI and/or the editor(s) disclaim responsibility for any injury to people or property resulting from any ideas, methods, instructions or products referred to in the content.

