Article

Large Eddy Simulation of the Effect of Hydrogen Ratio on the Flame Stabilization and Blow-Off Dynamics of a Lean CH4/H2/Air Bluff-Body Flame

1
PipeChina Institute of Science and Technology, Tianjin 300450, China
2
State Key Laboratory of Multiphase Flow in Power Engineering, Xi’an Jiaotong University, Xi’an 710049, China
*
Author to whom correspondence should be addressed.
Appl. Sci. 2024, 14(5), 1846; https://doi.org/10.3390/app14051846
Submission received: 13 December 2023 / Revised: 30 January 2024 / Accepted: 6 February 2024 / Published: 23 February 2024
(This article belongs to the Special Issue Advances in Combustion and Renewable Energy)

Abstract

:
This study investigated the flame structure and dynamics of a bluff-body flame when numerically close to blow-off conditions. This includes the impact of the hydrogen ratio on lean CH4/H2/air flame stabilization and blow-off characteristics. In this study, we assessed the impacts of four different hydrogen ratios: 0%, 30%, 60%, and 90%. Large eddy simulation (LES) was coupled with a thickened flame (TF) model to determine the turbulent combustion using a 30-species skeletal mechanism. The numerical results were progressively validated using OH-PLIF and PIV techniques. The results obtained from the numerical simulations showed minor differences with the experimental data on the velocity field and flame structure for all conditions. The presented results reveal that the flame is stabilized in higher-strain-rate spots more easily in the presence of high hydrogen ratios. Moreover, the flame location moves away from the concentrated vortex area with an increasing hydrogen ratio. The results of our blow-off investigation indicate that the blow-off sequence of a premixed bluff-body flame can be separated into two stages. The entire blow-off process becomes shorter with an increase in the hydrogen ratio. The primary reason for global extinction is a reduction in the heat release rate, and enstrophy analysis implies that blending hydrogen can reduce the enstrophy values of flames at the downstream locations. The dilatation and baroclinic torque terms decrease close to blow-off, but their decline is not significant in high-hydrogen-ratio conditions.

1. Introduction

Increasing the application and development of renewable energy sources (RESs) such as wind and solar power is an effective means of reducing carbon emissions. However, fluctuations in the generation and transmission of energy via RESs, particularly in electricity generation, are still a major concern [1]. Hydrogen is one of the most promising energy storage media that eliminates the fluctuations in RESs. Moreover, hydrogen can be burned without producing CO2 emissions to fuel power plants since it is a carbon-free molecule. Therefore, the development of hydrogen gas turbines is potentially a future carbon-neutral technology through which long-term energy saving goals could be achieved [2]. Applying hydrogen in gas turbines (GTs), which are currently the most advanced and compact combustion device, will play a leading role in the energy transition period and long-term energy development strategy. As of January 2019, the gas turbine industry is strongly committed to developing 100% hydrogen-fueled gas turbines by 2030 [3]. In the transition from carbon-based fuel to pure hydrogen, the fuel mix comprising natural gas and hydrogen in the GT combustion chamber will be the center of attention for the combustion community [4,5,6].
Lean premixed combustion (LPC) is viewed as one of the most promising combustion techniques in the context of gas turbines due to its capability to significantly reduce NOx emissions [7,8,9]. However, the implementation of this technique is associated with the risk of flame instability and blow-off [10,11]. Several studies have suggested that blending hydrogen with carbon oxides (i.e., methane or DME, etc.) as the fuel can reduce the emission of carbon oxides, exergy losses, and the likelihood of blow-off [12,13,14,15]. This is because hydrogen addition enhances the combustion intensity of the CH4/air flame. However, it may increase the risk of flashback, especially in high-hydrogen-ratio conditions. Although enriching methane with hydrogen may lead to an increase in NOx emissions due to the higher burnt gas temperature, this issue can be addressed by LPC [16]. Meanwhile, fueling gas turbines with hydrogen is also an efficient way to consume hydrogen produced from wind or solar energy [17].
The bluff body and swirl geometries are widely used to anchor and stabilize the flame in a GT combustion chamber by establishing a recirculation zone (RZ) of hot gas near the burner outlet, igniting the fresh gas from the burner [18,19]. Turbulent premixed flames stabilized by bluff bodies have received considerable attention [20]. Wan et al. reviewed the recent progress made in flame stabilization methods for micro-combustors [21]. They investigated single-flame stabilization technologies including flame holders, and pointed out that a bluff body is a classic flame-anchoring method that has been extensively employed in various industrial combustion devices. Dawson et al. studied a short lean flame stabilized by bluff bodies using a fast-response apparatus in pure CH4/air conditions [22]. They described the mechanism of the blow-off process and mentioned that the structure of the flame close to extinction supported the underlying assumptions behind well-stirred reactor concepts of blow-off. Tong et al. examined the recirculation zone of a bluff body-stabilized CH4/air flame numerically and experimentally [23]. They analyzed the flame’s characteristics under different conditions and demonstrated that the position of the outer recirculation zone was affected by the size of the bluff body and the swirl strength. A simplified mechanism with only 16 species was used in their study. A high-precision LES with a more detailed chemical mechanism is needed for the further study of flame stabilization mechanisms. In addition, these studies focused on the stabilization mechanism of bluff-body CH4/air flames, but hydrogen addition can also largely influence flame characteristics and stabilization mechanisms.
Kim et al. researched the effect of hydrogen addition in premixed CH4/air flames experimentally using a maximum hydrogen ratio of 9% [24]. They found that low swirl intensity assisted in reducing the cold-flow recirculation into the reaction zone and elevated the stability limit at lower adiabatic temperature conditions. Furthermore, the addition of hydrogen shifted the reaction zone to the upstream locations of the flame. Michaels et al. numerically investigated the role of mixture composition and temperature in defining the steady-flow structure in premixed CH4/H2/air flames stabilized by bluff bodies [25]. They showcased the flow structures and flame stability maps for fuels with different hydrogen ratios and inlet conditions using the extinction strain rate as the chemical time scale. Their simulation was performed for a 2D domain, and the results yielded rather qualitative implications.
Several studies have explored the effect of adding hydrogen on flame stabilization, the underlying mechanisms, and the blow-off behavior near the lean limit. However, most of the research in the literature is limited to the use of low hydrogen ratios or 2D simulations, neglecting the three-dimensional (3D) flow stress. For instance, vortex stretching and the processing vortex core (PVC) cannot be illustrated in a 2D combustion field. Overall, turbulence is a well-known 3D phenomenon, and 2D simulations cannot capture the turbulence flow features completely. Moreover, most simulations are coupled with a simplified chemical mechanism that may not explain the interaction mechanism between the flame and the 3D flow at high hydrogen ratios. The best approach seemingly involves the use of 3D simulations with detailed chemistry, which capture the real 3D interaction processes. Furthermore, enstrophy analyses can also be carried out to investigate flame stability and the dynamics of the H2 swirl flames, as enstrophy is a scalar field that inherently measures the strength of the vorticity field without implying directionality and can be partially attributed to the intensity of vortical structures [26].
The primary aim of this study was to investigate the mechanism of flame stabilization and the blow-off process by applying hydrogen ratios of up to 90% to a bluff-body burner and using the large eddy simulation (LES) technique with a dynamic thickened flame (DTF) model. A bluff-body burner with a high blockage ratio, developed by R. Balachandran et al., was used [27]. Turbulence was created and enhanced through slotted plates upstream of the burner exit. The results obtained from our numerical simulation were validated with the experimental data, which included OH-PLIF images and velocity profiles.

2. Experimental Methodology

A series of premixed bluff-body flames were investigated in this study. A schematic of the burner we used is shown in Figure 1. The burner mainly included an inlet, a bluff body, and a quartz liner. The burner exit diameter was 35 mm, and the top surface diameter of the conical bluff body was 25 mm with a half-angle of 45°. The blockage ratio for the burner was approximately 0.51. To construct a combustion chamber, we implemented a 70 × 70 × 180 mm3 squared liner equipped with quartz glass at four sides, which allowed for optical access (i.e., laser diagnostics). Methane, hydrogen, and air were premixed upstream in the mixing section at the bottom of the burner. Then, the mixture travelled through a venturi nozzle and two sintered metal plates. The flame was stabilized by the bluff body inside the liner. All experiments were performed at room temperature and under atmospheric pressure conditions (T = 298 K, P = 0.1 MPa).
Four hydrogen ratios were investigated: Z = 0%, 30%, 60%, and 90%. The hydrogen ratio in fuel is defined as Z = χ H 2 / ( χ H 2 + χ C H 4 ) , where χ H 2 and χ C H 4 are the mole fractions of H2 and CH4, respectively. The mixture inlet velocity to the combustion chamber was set at 10 m/s (about 282.74 L/min), as illustrated in Figure 1. The premixed unburned mixtures of the four hydrogen ratios are abbreviated as 00H2, 30H2, 60H2, 90H2, as summarized in Table 1. The equivalence ratio was kept at 0.75 for each hydrogen ratio condition. PIV and PLIF measurements were recorded to investigate the velocity field and flame structure, as shown in Appendix A.

3. Simulation Setup

The computational domain consisted of one inlet, one outlet, the pipe, the surface of the bluff body, and the boundary walls. Figure 2 displays the geometry and the structured mesh. The finest grids (i.e., those with a grid size of approximately 0.5 mm) were placed in the flame’s front region. The total number of grids for the mesh was about 5 million. For the non-reacting flows, the mesh size was increased to about 700 million in a similar-scale swirl burner, while the results showed no differences.
In the experiment, turbulence was generated through two sintered metal plates. In the numerical simulation, a filtered noise inflow generator developed by Christian was used to produce the inlet turbulence [28]. In this method, the parameters of the velocity field were set based on the experimental measurements. For instance, the Reynold stress tensor and length scales, which were the input parameters, were applied based on the calculated values derived from the experimental data. Therefore, the turbulent Reynolds number Re was computed based on u, which equals 1.4641 m2/s2. The turbulence integral length scale was determined to be approximately 4.323 mm based on the experiments. It should be noted that the turbulence was introduced at 1.4d (d represents the top surface diameter of the bluff body) upstream of the combustion chamber. Therefore, the turbulence developed in such a way that the artificially generated turbulent flow was sufficient for capturing the flow features. A non-slip boundary condition was used at the burner and bluff body walls.
The temperature of the top surface of the bluff body and side walls in the simulation were selected based on the experimental measurements. Bluff body temperatures of 700 K, 710 K, 730 K, 750 K and mean liner wall temperatures of 800 K, 820 K, 830 K, and 850 K were applied as the temperature boundary conditions for 00H2, 30H2, 60H2, and 90H2, respectively. An adiabatic wall was set for the burner top surface. Wave-transmissive boundary conditions were utilized to reduce the backflow and the effect of pressure wave reflection on combustion.
Large eddy simulation (LES) directly solves the turbulence above the filter scale and calculates the small scale with the sub-grid model (SGS). As a result, LES can yield more detailed simulation results with relatively low computational costs. Therefore, the use of LES coupled with finite rate chemistry is apt for characterizing flames and clarifying the mechanisms of the combustion process. This study adopted the SGS model to describe small-scale vortices. The filtered conservation equations for mass, momentum, total energy, and species were solved using the open-source code, OpenFOAM 2.3.0, as described in Ref. [29]. A thickened flame (TF) model was used to resolve the filtered flame front [30]. The filtered transport equation for instantaneous species is described as follows [29]:
ρ ¯ Y k t + · ρ ¯ u ¯ Y k = · ρ ¯ Ξ F D k Y k + Ξ ω k ˙ ( Q ) F ,
where ρ and u are the density and velocity vector, respectively; ω k ˙ is the chemical source term of k ; F is the thickening factor. The flame can be resolved in the LES grid with a proper thickening factor. D k is the mixture-averaged molecular diffusion coefficient, calculated from the following [31]:
D k = 1 x k j k N x j D k j ,
where x k is the mole fraction of species k and D j k is the binary diffusion coefficient of species j and k. Ξ Δ is the sub-grid flame wrinkling factor. The wrinkling factor is used to compensate for the lost flame surface due to the thickening process. This study employed the power-law flame wrinkling model shown in [32,33]:
Ξ = 1 + m i n max Δ δ l 1,0 , Γ Δ δ l , u Δ S l , R e Δ u Δ S l β ,
where u Δ is the sub-grid-scale turbulent velocity and R e Δ is the sub-grid-scale Reynolds number; β is the model coefficient. The thickening factor F is often associated with the mesh size Δ x , given by [34]:
F n = n Δ x δ l 0 ,
where δ l 0 is the laminar flame thickness, which can be calculated from a 0D simulation using CHEMKIN-PRO [35]. The number of grids n is typically 5~10 [36]. The heat release rate method was used to select the flame region to determine the thickening factor dynamically. The dynamical control method of F is shown by the following [37]:
F d y n = 1 + ( F n 1 ) t a n h c o n s t · m i n 1 , m a x 0 , ( H R R m i n H m a x H m i n H ) ,
where minH and maxH are the minimum and maximum values of the heat release rate (calculated by one-dimension laminar simulation), respectively. The F d y n depends on time and space, which are recalculated in each time step. Table 1 shows the parameters used in the thickened flame model.
TF modeling was performed using OpenFOAM 2.3.0 open-source software, which has been discussed in detail and validated in one of our previous works [38]. The governing equations were solved using a pressure-based finite volume method code in OpenFOAM 2.3.0. The Pressure Implicit Split Operator (PISO) algorithm was used to handle the pressure–velocity coupling term [39]. The transient term was discretized by the implicit Euler scheme. Second-order linear schemes were used to discretize the convection and diffusion terms. The fixed time step Δt was set at 1 × 10⁻⁶ s, and the maximum Courant number was always less than 0.3 during the simulations. This study employed the 30-species skeletal reaction mechanism proposed by Karalus et al. [40]. The validation of this mechanism is described in detail in Appendix B.

4. Results and Discussion

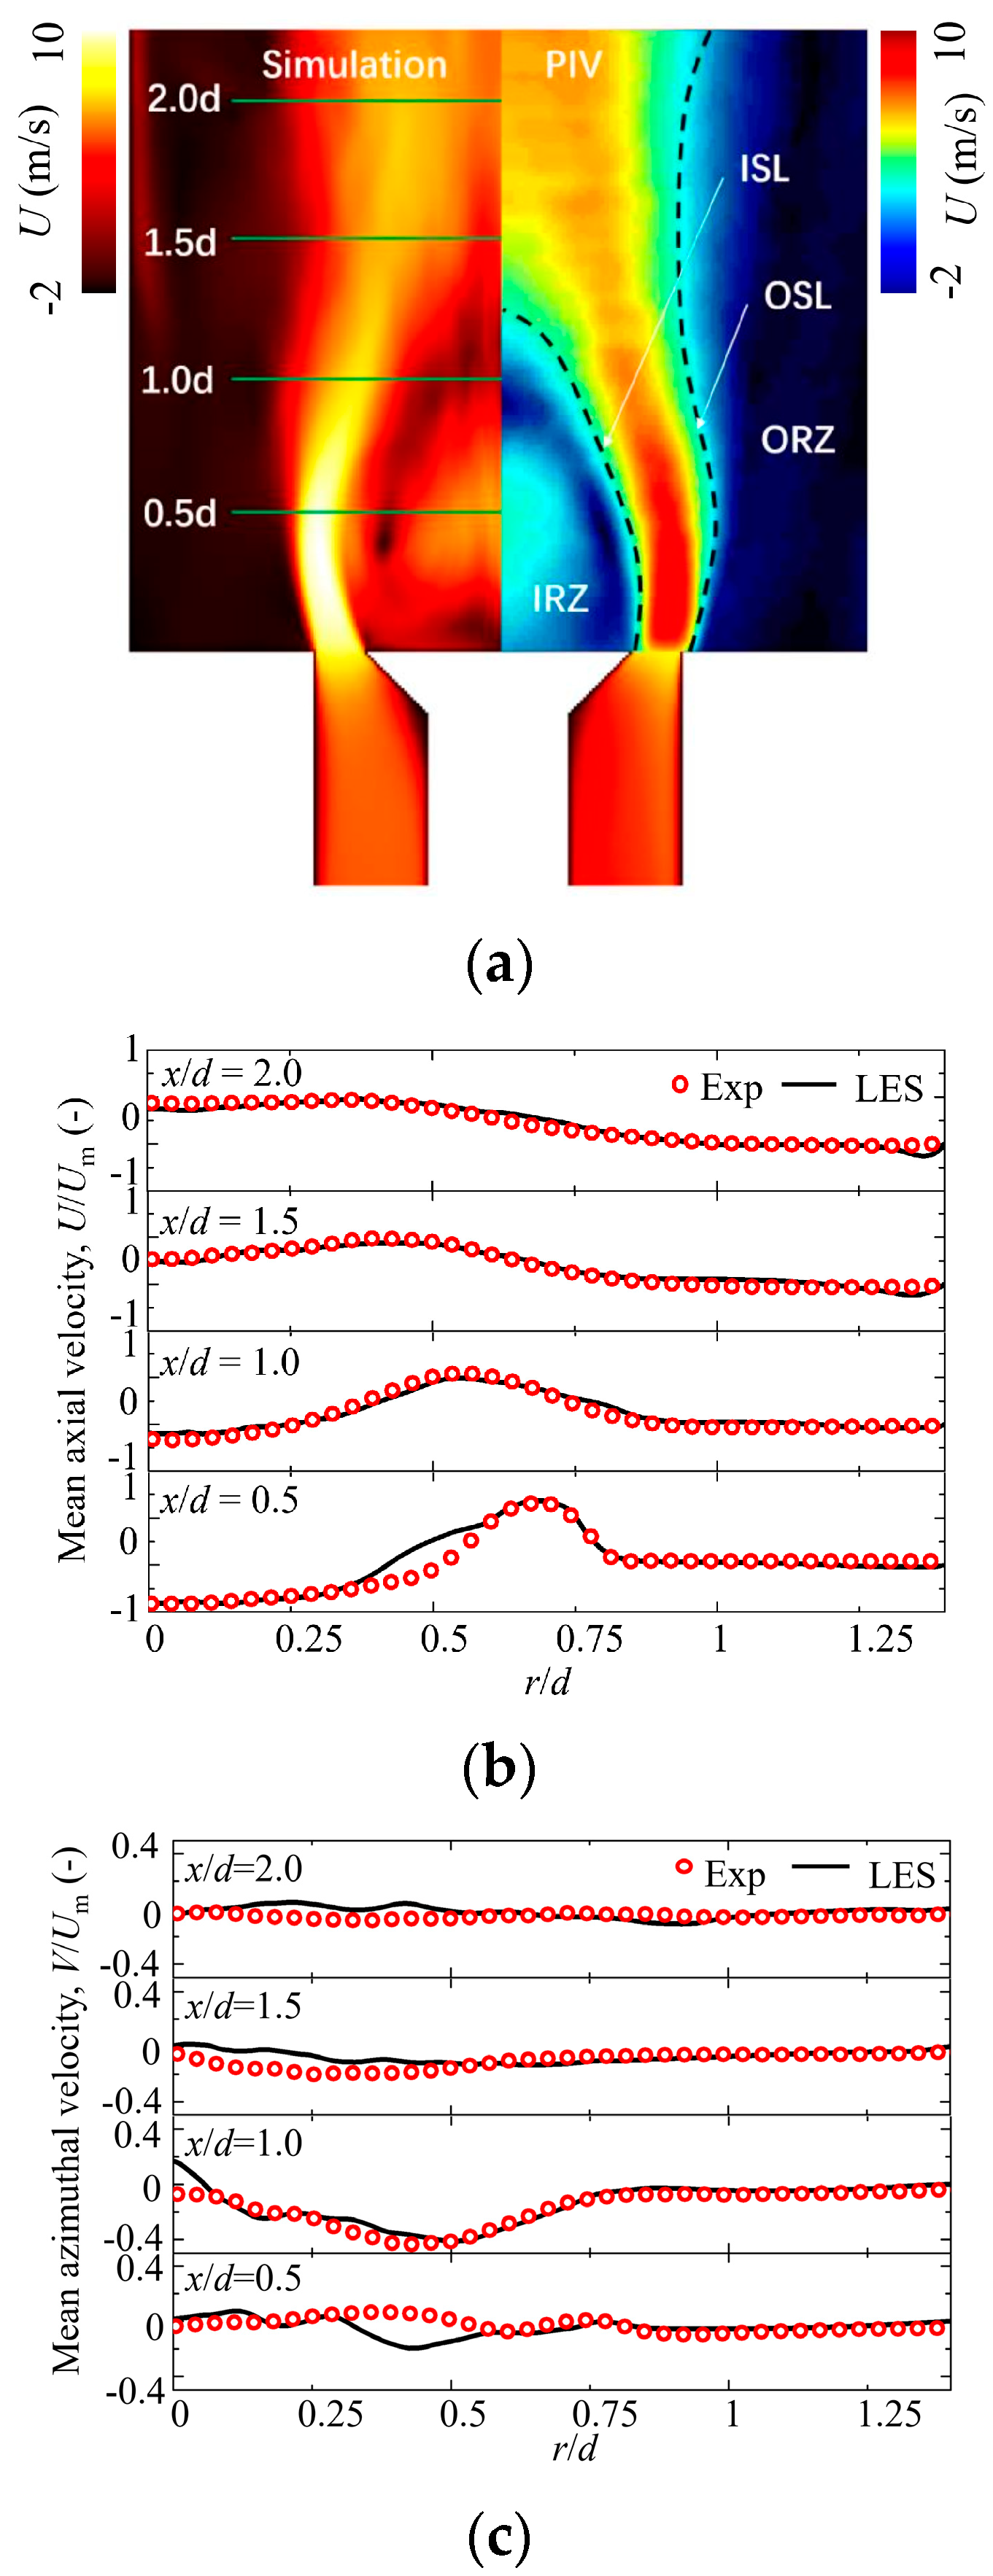
4.1. Model Validation

Figure 3 illustrates the OH-PLIF images obtained from the experiment and the mean OH concentration from the numerical results of four CH4/H2/air flames. The OH-PLIF images shown in Figure 3a represent the signal intensity of OH fluorescence corresponding to the instantaneous OH concentration during combustion. Figure 3b demonstrates the OH radical concentration obtained using LES. The flame macrostructure is exhibited by the mean OH concentration. It can be seen that LES shows excellent consistency with the OH-PLIF images in terms of the flame macrostructure for all cases. Specifically, the LES captured the “M” shape flame very well for the 90H2 flame.
A comparison of the α angles between the flame edge and burner axis (shown in Figure 3) from the experiment and simulation procedures is shown in Figure 4, where an overall agreement between the two sets of results can be observed. With an increase in the hydrogen ratio, α increased for both the experiment and simulation cases. A large α means an increased turbulent burning velocity, which mainly results from the larger reactivity of hydrogen [29]. It can be seen that the LES in this study has a good prediction capability if the boundary conditions are specified properly.
The experimental and numerical mean axial velocities of the non-reacting flow normalized by the inlet velocity are compared in Figure 5. As shown in Figure 5a, the experimental results showed that there was an inner recirculation zone (IRZ) just behind the bluff body, and an outer recirculation zone (ORZ) formed near the wall because of the influence of condensed space on the flow field. The layer between the fresh mixture and IRZ is defined as the inner shear layer (ISL). The mixing layer between the fresh mixture and near the negative-velocity ORZ is defined as the outer shear layer (OSL). These flow features were well-predicted in the simulation. Figure 5b shows a comparison of the mean axial velocities between the numerical and experimental results, indicating that good agreement was achieved between the two sets of results. The mean relative errors of axial velocity were approximately 16%, computed according to the data points calculated from the experiment and simulation results. Figure 5c shows the mean azimuthal velocity. Discrepancies could be observed near the ISL, and these discrepancies may be attributed to the uncertainties of the experimental data. On the other hand, a discrepancy near the inner shear layer could also be observed in the results presented by Lee et al. [41], and this discrepancy may have been caused by the SGS model.
Comparisons of the mean axial and azimuthal velocity profiles of the four flames at various heights are also presented in Appendix C. The discrepancy near the ISL is likely caused by both the SGS and the constant sub-grid wrinkling factor models. Because of the reactions occurring near the ISL and the complexity of combustion, especially with respect to the challenge of predicting flames with different hydrogen ratios, the differences between the experimental and simulation results are acceptable. The simulation reproduced the general trend of the flow field and flame.

4.2. Flame Stabilization

In Figure 6, three velocity conditions (5, 10, 20 m/s) for four H2 blending ratios (00H2, 30H2, 60H2, and 90H2) were considered. To obtain the lean blow-off limit equivalent ratio in every condition, firstly, a near blow-off condition (the equivalent ratio at 0.75) was employed to preheat the burner to the thermal equilibrium condition. Secondly, the fuel and air flow rates decreased synchronously until the flame was extinguished. The existing final flame equivalent ratio is defined as the lean blow-off limit equivalent ratio, both of which are marked in Figure 6 for all cases. It was observed that the blow-off limit could be extended to leaner conditions with increasing hydrogen ratios, indicating that the more H2 added, the better the stability of the flame. This can be firstly explained by the enhancement effects that increased H2 addition brings including increasing the flame laminar velocity to avoid the flame from petering out. Chemical effects that induce more active radicals may further increase flame stability. Moreover, the blow-off equivalence ratio slightly increases with an increase in the bulk velocity. This suggests that an increase in the bulk velocity can lead to disadvantages in terms of flame stability. More detailed analyses on this should be conducted. Therefore, to ensure comparability, the same equivalence ratio of 0.75 was selected for all cases. This criterion represents a stable condition for the four hydrogen ratios considered, according to the experimental results shown in Figure 6.
The simultaneous flame location and flow structure provide a useful framework for studying the effect of the hydrogen ratio on flame stabilization and the flame–turbulence interaction. Vortices play an important role in the self-sustained turbulence process; thus, they are widely used to study flow structure [42]. The simultaneous flame location and vorticity field were analyzed, as shown in Figure 7, to clarify the stabilization mechanism for each hydrogen ratio. The flame location is defined by the contour of 10% of the maximum heat release rate (red lines). The shear layer is identifiable by the high vorticity values (|ω| > 3000), colored in blue or red. The border of the recirculation region is marked by stagnation streamlines (black lines). The leading edge is defined by the most upstream flame location, as designated in Figure 7.
The hydrogen ratio affects the flame location and flow structure significantly. Figure 7 demonstrates that the leading edge is located inside the recirculation zone for all conditions. The location of the leading edge relative to the bluff body changes drastically when the hydrogen ratio changes. It can be seen that the recirculation zone is shorter at higher hydrogen ratios. As a result, the flame leading edge is closer to the edge of the bluff body. This results in a larger angle between the flame and the reactants outside the recirculation zone. This phenomenon was also described in a previous study [25]. The lift-off of the flame from the bluff body can be considered as the precursor of the final blow-off, which can be avoided by increasing the hydrogen ratio [43]. Moreover, the ISL moves closer to the burner axis with an increase in the hydrogen ratio. The vorticity at the flame root becomes larger, and the flame moves to the burner axis along the top surface of the bluff body. Figure 7 clearly illustrates that a flame can be stabilized within a higher-strain-rate region at a larger hydrogen ratio. In addition, the flame location overlaps more with the outer shear layer, and the region of high vorticity also gradually increases. To further assess the flame stabilization in the outer shear layer, the Q criterion was used to investigate the relation between the flame location and flow structure.
Since the vorticity field cannot distinguish between the vortex and shear motions, the Q criterion was used to identify the vortex. The Q criterion can be calculated by using the following formula [44]:
Q = 1 2 ( Ω 2 S 2 ) ,
where
      Ω = 1 2 U ( U ) T .
Ω is the rate of rotation corresponding to the pure rotational motion.
S = 1 2 U + ( U ) T ,
where S is the rate of strain corresponding to the pure irrotational motion [45]. Q describes a precise mathematical formulation that has an unambiguous physical interpretation [42]. This method is capable of extracting strong vortices, as when Q is larger than zero, the turbulence vertex can be identified as where the rotational tensor plays a dominant role. Therefore, the connected regions of positive Q are defined as vortices.
Q can be calculated using a three-dimensional mean velocity field. Figure 8 shows the Q field and the flame position (i.e., 10% of the maximum heat release rate (black lines)). The value of the vortices is indicated by the pseudo color. A large area of vortices was concentrated in the inner recirculation zone for all conditions, while only a small area of vortices was found in the outer recirculation zone. There were more vortices around the flame location when the hydrogen ratio was lower (i.e., for the 00H2 and 30H2 cases). Since the vortices stress the flame, the flame is prone to lift-off at larger vortex values. In the case of 60H2, the vortices moved close to the burner axis relative to the flame location, and the flame location tended to be away from the vortices. Thus, the attachment of the flame to the bluff body was stronger for this case. For the 90H2 case, there were few vortices near the ORZ. This explains why the 90H2 flame could stabilize in the outer shear layer.

4.3. Blow-Off Dynamics

To further investigate the transient blow-off behavior and the impact of hydrogen ratio on the transient flame process, the equivalence ratios for each case were suddenly decreased to 0.2 from the aforementioned stale condition (ϕ = 0.75). Data were collected over 55 ms, about three flow-through times (FTT), defined by the length of the combustor chamber divided by the mean bulk velocity in the chamber. The instance of the equivalence ratio decrease was specified at 0 ms. Figure 9 shows the integrated heat release rate normalized by the maximum value at the stable condition. The flame is considered blown out when the normalized heat release rate decreases below 50%. The resistance of the heat release rate over time for different equivalence ratios can be observed in Figure 9. The extinction process of a bluff-body-stabilized flame can be divided into two stages, as shown in Figure 9. In the first stage, the lean mixture slightly affects the combustion process, and the heat release rate decreases slowly. In the second stage, the heat release rate decreases rapidly due to the effect of the overall equivalence ratio reduction. In the current study, the beginning of the second stage was defined as when the derivative of Q/Qmax with respect to the time was smaller than −0.1. This metric can be employed to identify specific portents that trigger blow-off. It can be seen that 00H2 entered the second stage at 6.4 ms, 30H2 entered the second stage at 6 ms, 60H2 entered the second stage at 5 ms, and 90H2 entered the second stage at 4 ms. Additionally, with an increase in the hydrogen ratio, the duration of the first stage decreased, which corresponded to a faster occurrence of the onset of the second stage. This phenomenon is due to the reduction in the flame height for higher hydrogen ratios, meaning that the flame is more sensitive to the incoming fresh mixture.
The heat release rate along the central plane was collected at different time instances to further analyze the effect of increasing the hydrogen ratio. Figure 10 displays a comparison of the blow-off processes corresponding to the four hydrogen ratios considered in this study. For each operating condition, the heat release rate was normalized by the maximum heat release rate. The first time instance is selected during the stable process. The second instance refers to the initiation of the blow-off stage. The third instance represents the point at which the maximum release rate drops to 75% HRRmax, and the fourth instance refers to blow-off (blow-off is defined by HRR < 50% HRRmax).
Figure 10a shows the blow-off process for the 00H2 case, where the flame shrinkage as a result of flow field influence is evident at the beginning of the second stage (i.e., 6 ms). This is an indication of cool reactants going into the IRZ. The heat release rate at the flame root quickly decreases, and local extinction (local extinction is defined by local HRR < 50% HRRmax) occurs at the flame root at 9 ms. It can be seen that the flame lifts off from the bluff body completely at 12 ms. For 30H2, as shown in Figure 10b, the heat release rate of the flame roots decreased at 8 ms. The flame root detached from the bluff body, and local extinction occurred. Global extinction occurred at 11 ms. For the 60H2 and 90H2 cases, as shown in Figure 10c,d, flames were always anchored at the bluff body’s edge until the flame was completely blown out, since hydrogen reinforces the ability of the flame to attach to the bluff body. For 90H2, the flame height rose rapidly when close to extinction. For this case, the flame height rise was twice the flame height in stable conditions.
The hydrogen ratio has an obvious effect on the flame structure and the flame height. After comparing the blow-off processes of different conditions, one may conclude that the heat release area is significantly shorter at high-hydrogen-ratio conditions. It is worth noting that the HRR shape of 90H2 was different from the other three operating conditions. For a high hydrogen ratio case for which the heat release area is small, the heat release rate suddenly decreases when the lean fresh mixture (ϕ = 0.2) reaches the flame. In contrast, when the hydrogen ratio is low, the flame is high and the flame surface area is larger. Therefore, the effect of the suddenly decreased equivalence ratio on the entire flame is delayed. This results in a slower process HRR reduction and a longer period of the blow-off process.
Figure 11 shows scatter plots of HRR and temperature on a plane sliced along the axis. The different colored dots in Figure 11 correspond to the four instances in the blow-off sequence. Meanwhile, the first two instances (indicated by the black and red dots) were in the first stage of the blow-off process, and the remaining instances were in the second stage of the blow-off process. During the blow-off process, the heat release rate in the first and the second instance did not change significantly, which means that the heat release rate at the first stage of blow-off remained at the same level as a stable flame. After entering the second stage of blow-off, indicated by the blue dots and green dots in Figure 11, the heat release rate dropped rapidly, and the temperature also decreased. It can be concluded that a reduction in HRR influences the temperature and is one of the factors causing blow-off.

4.4. Vorticity Field during Blow-Off

To further explain the effect of the hydrogen ratio, the transport equation of enstrophy, defined as Ω = ω · ω , was examined by looking at the different terms shown in [46].
1 2 D Ω D t = ω · ω · u ω · ω · u ω · 1 ρ 2 ρ × ρ + ω · × ( · τ ) / ρ
The filtered velocity field was used to calculate vorticity. The right-hand side of Equation (9) includes four terms: vortex stretching (term 1), dilatation (term 2), baroclinic torque (term 3), and viscous diffusion (term 4). Figure 12 plots the mean value of enstrophy at x/d = 1.5 downstream of the flame for the four different hydrogen ratios considered in this study. The plotted time instance corresponds to the different stages during the blow-off process, as described in Section 4.3. The solid black line represents the stable operating condition, the red represents the moment when the HRR begins to decrease, and the blue represents the point at which the HRR is reduced to 75%; the green dotted lines mean that the flame is blowing-off. An increase in enstrophy over time was observed for the four hydrogen ratio cases during the blow-off sequence. When approaching blow-off, the enstrophy is expected to have a peak value. Similarly, the mean value of enstrophy decreases with the hydrogen blending.
Figure 13 shows the results of our enstrophy budget analysis at location x/d = 1.5. The vortex stretching source term highlights the dynamics between the vorticity vector and strain rate tensor. When the hydrogen ratio is low (i.e., as in the 00H2 and 30H2 cases), the vortex stretching source term has a positive contribution to the enstrophy value at near-blow-off conditions. In contrast, the vortex stretching term suppresses the growth of enstrophy at near-blow-off conditions at a high hydrogen ratio (i.e., for 60H2 and 90H2). It is evident that the vortex stretching source term significantly reduces in magnitude with an increase in the hydrogen ratio, which corresponds to a decrease in the absolute enstrophy value. The dilatation term represents the variable density effects and is a source of vorticity destruction across the flame due to volumetric gas expansion. The baroclinic torque accounts for density changes in the domain and generates additional vorticity across the flame due to the misalignment between the pressure gradient and the normal flame surface. It can be seen that the magnitudes of dilatation and baroclinic torque suddenly decrease near blow-off, which is caused by the drastic change in density. The decreasing values of term 2 and term 3 are the main reason for the enstrophy increase during the blow-off sequence. When the hydrogen ratio increases, the value of each component decreases. This is because the height of the high hydrogen ratio flame is low, and the flame is always at a lower position throughout the blow-off process. Therefore, the impact of each term on the downstream flow field is not significant, and the enstrophy value is correspondingly small.

5. Conclusions

In this study, a bluff-body-stabilized CH4/H2/air flame was investigated through large eddy simulation (LES) using hydrogen ratios of up to 90%. The LES was conducted using an OpenFOAM 2.3.0 open-source code and a thickened flame (TF) model coupled with a 30-species skeletal mechanism. Our numerical results were progressively validated based on the OH profile and velocity field. Four hydrogen ratio conditions, namely 0, 30%, 60%, and 90%, were investigated for both stable conditions and the blow-off process. The results of this study can be summarized as follows:
  • Under stable conditions, both the flame height and the inner/outer recirculation zone decrease with an increase in the hydrogen ratio. The angle between the flame edge and centerline increases linearly, and the ability of the flame to stabilize in higher-strain-rate locations is enhanced. The location of the flame moves away from the vortex concentration area. This implies that the flame tends to attach to the bluff body more strongly.
  • For blow-off conditions, a specific precursor event that triggers blow-off is identifiable by the rate of HRR decrease. The blow-off process is separated into two stages. With an increase in the hydrogen ratio, the duration of each stage decreases. The decrease in the heat release rate is one of the main factors that cause blow-off in lean CH4/H2/air flames and also influences flame temperature.
  • An increase in enstrophy during the blow-off sequence was observed in all cases. The mean value of enstrophy decreased with hydrogen blending. Our enstrophy budget analysis showed that the vortex stretching source term was significantly reduced in magnitude with an increase in hydrogen ratio, which corresponded to a decrease in the absolute enstrophy value. The dilatation and baroclinic torque terms suddenly decreased close to blow-off, but their decline was not significant in high-hydrogen-ratio conditions.

Author Contributions

L.C.: Investigation, resources, writing—original draft preparation. M.Z.: Conceptualization, writing—review and editing. S.P.: Project administration. J.W.: Supervision, funding acquisition. Z.H.: Supervision. All authors have read and agreed to the published version of the manuscript.

Funding

This work was financially supported by Research on key technologies of hydrogen-mixed natural gas transportation by pipeline in service (PipeChina, project No.: DTXNY202203).

Institutional Review Board Statement

Not applicable.

Informed Consent Statement

Not applicable.

Data Availability Statement

The original contributions presented in the study are included in the article, further inquiries can be directed to the corresponding author.

Acknowledgments

The authors thank Zhenhua An and Nannan Zhang for contributing to the data acquisition. This paper also benefited a lot from the invaluable discussions with them.

Conflicts of Interest

The authors declare no conflicts of interest.

Appendix A. PIV and PLIF Measurement

In our study, the OH species profile and velocity fields were measured using planar laser-induced fluorescence (OH-PLIF) and particle imaging velocimetry (PIV), respectively. A schematic of the laser-based diagnostic system we used is shown in Figure A1. The OH-PLIF system is in a box surrounded by blue dotted lines, and the PIV system is within the box delineated by the red dotted lines. The OH-PLIF system was used to measure the flame structure. The source laser beam was generated at a wavelength of 532 nm, 10 Hz. The energy of each pulse was 15 mJ. The laser frequency was doubled, and the wavelength was transferred to 282.769 nm to excite the Q1(8) line of the A2Σ←X2Π(1,0) transition. The fluorescence of OH was acquired by using an ICCD camera. The resolution of the ICCD was 1200 × 900 pixels, and that of the visualized field was adjusted to 116 mm × 87 mm (800 × 600 pixels) to capture OH signals with a spatial resolution of 0.14 mm/pixel. The PIV system was used to measure the 2D velocity fields. A double-cavity Nd:YAG laser produced two 532 nm laser pulses with a 10 Hz repetition rate. A double-shutter CCD camera with a resolution of 1600 × 1200 pixels and minimum 200 ns separation time was used to capture the dual frame, and TiO2 with a particle size of 1 µm was used as the seeding particle to visualize the velocity field. The visualized field was about 142 mm × 107 mm. The experimental images were analyzed using Davis 7.2 software. Each OH-PLIF or PIV measurement was carried out for at least 100 realizations. Each operating condition was measured for four times. Further details about the OH-PLIF and PIV systems can be seen in our previous work [43].
Figure A1. Experimental setup of the PIV (box bordered by red dotted lines)/PLIF (box bordered by blue dotted lines) measurement systems.
Applsci 14 01846 g0a1

Appendix B. Chemical Reaction Mechanism

In order to assess the simulation accuracy and lower computational costs simultaneously, an appropriate chemical mechanism should be chosen. In the current study, a 30-species skeletal mechanism with 177 reactions (referred to as Karalus-30) reduced from GRI 3.0 was used to simulate the CH4/H2/air combustion [40]. To verify the mechanism, we compared the laminar flame properties obtained by ANSYS CHEMKIN-PRO [35] with different hydrogen ratio conditions. Figure A2 shows a comparison between the adiabatic temperature and laminar flame speed from Karalus-30 and GRI 3.0. It can be readily seen that the results from these two mechanisms show excellent agreement, indicating that Karalus-30 is adequate for LES.
Figure A2. Comparison between GRI 3.0 and Karalus for (a) the adiabatic temperature and (b) laminar flame speed at different hydrogen addition ratios and equivalence ratios.
Applsci 14 01846 g0a2

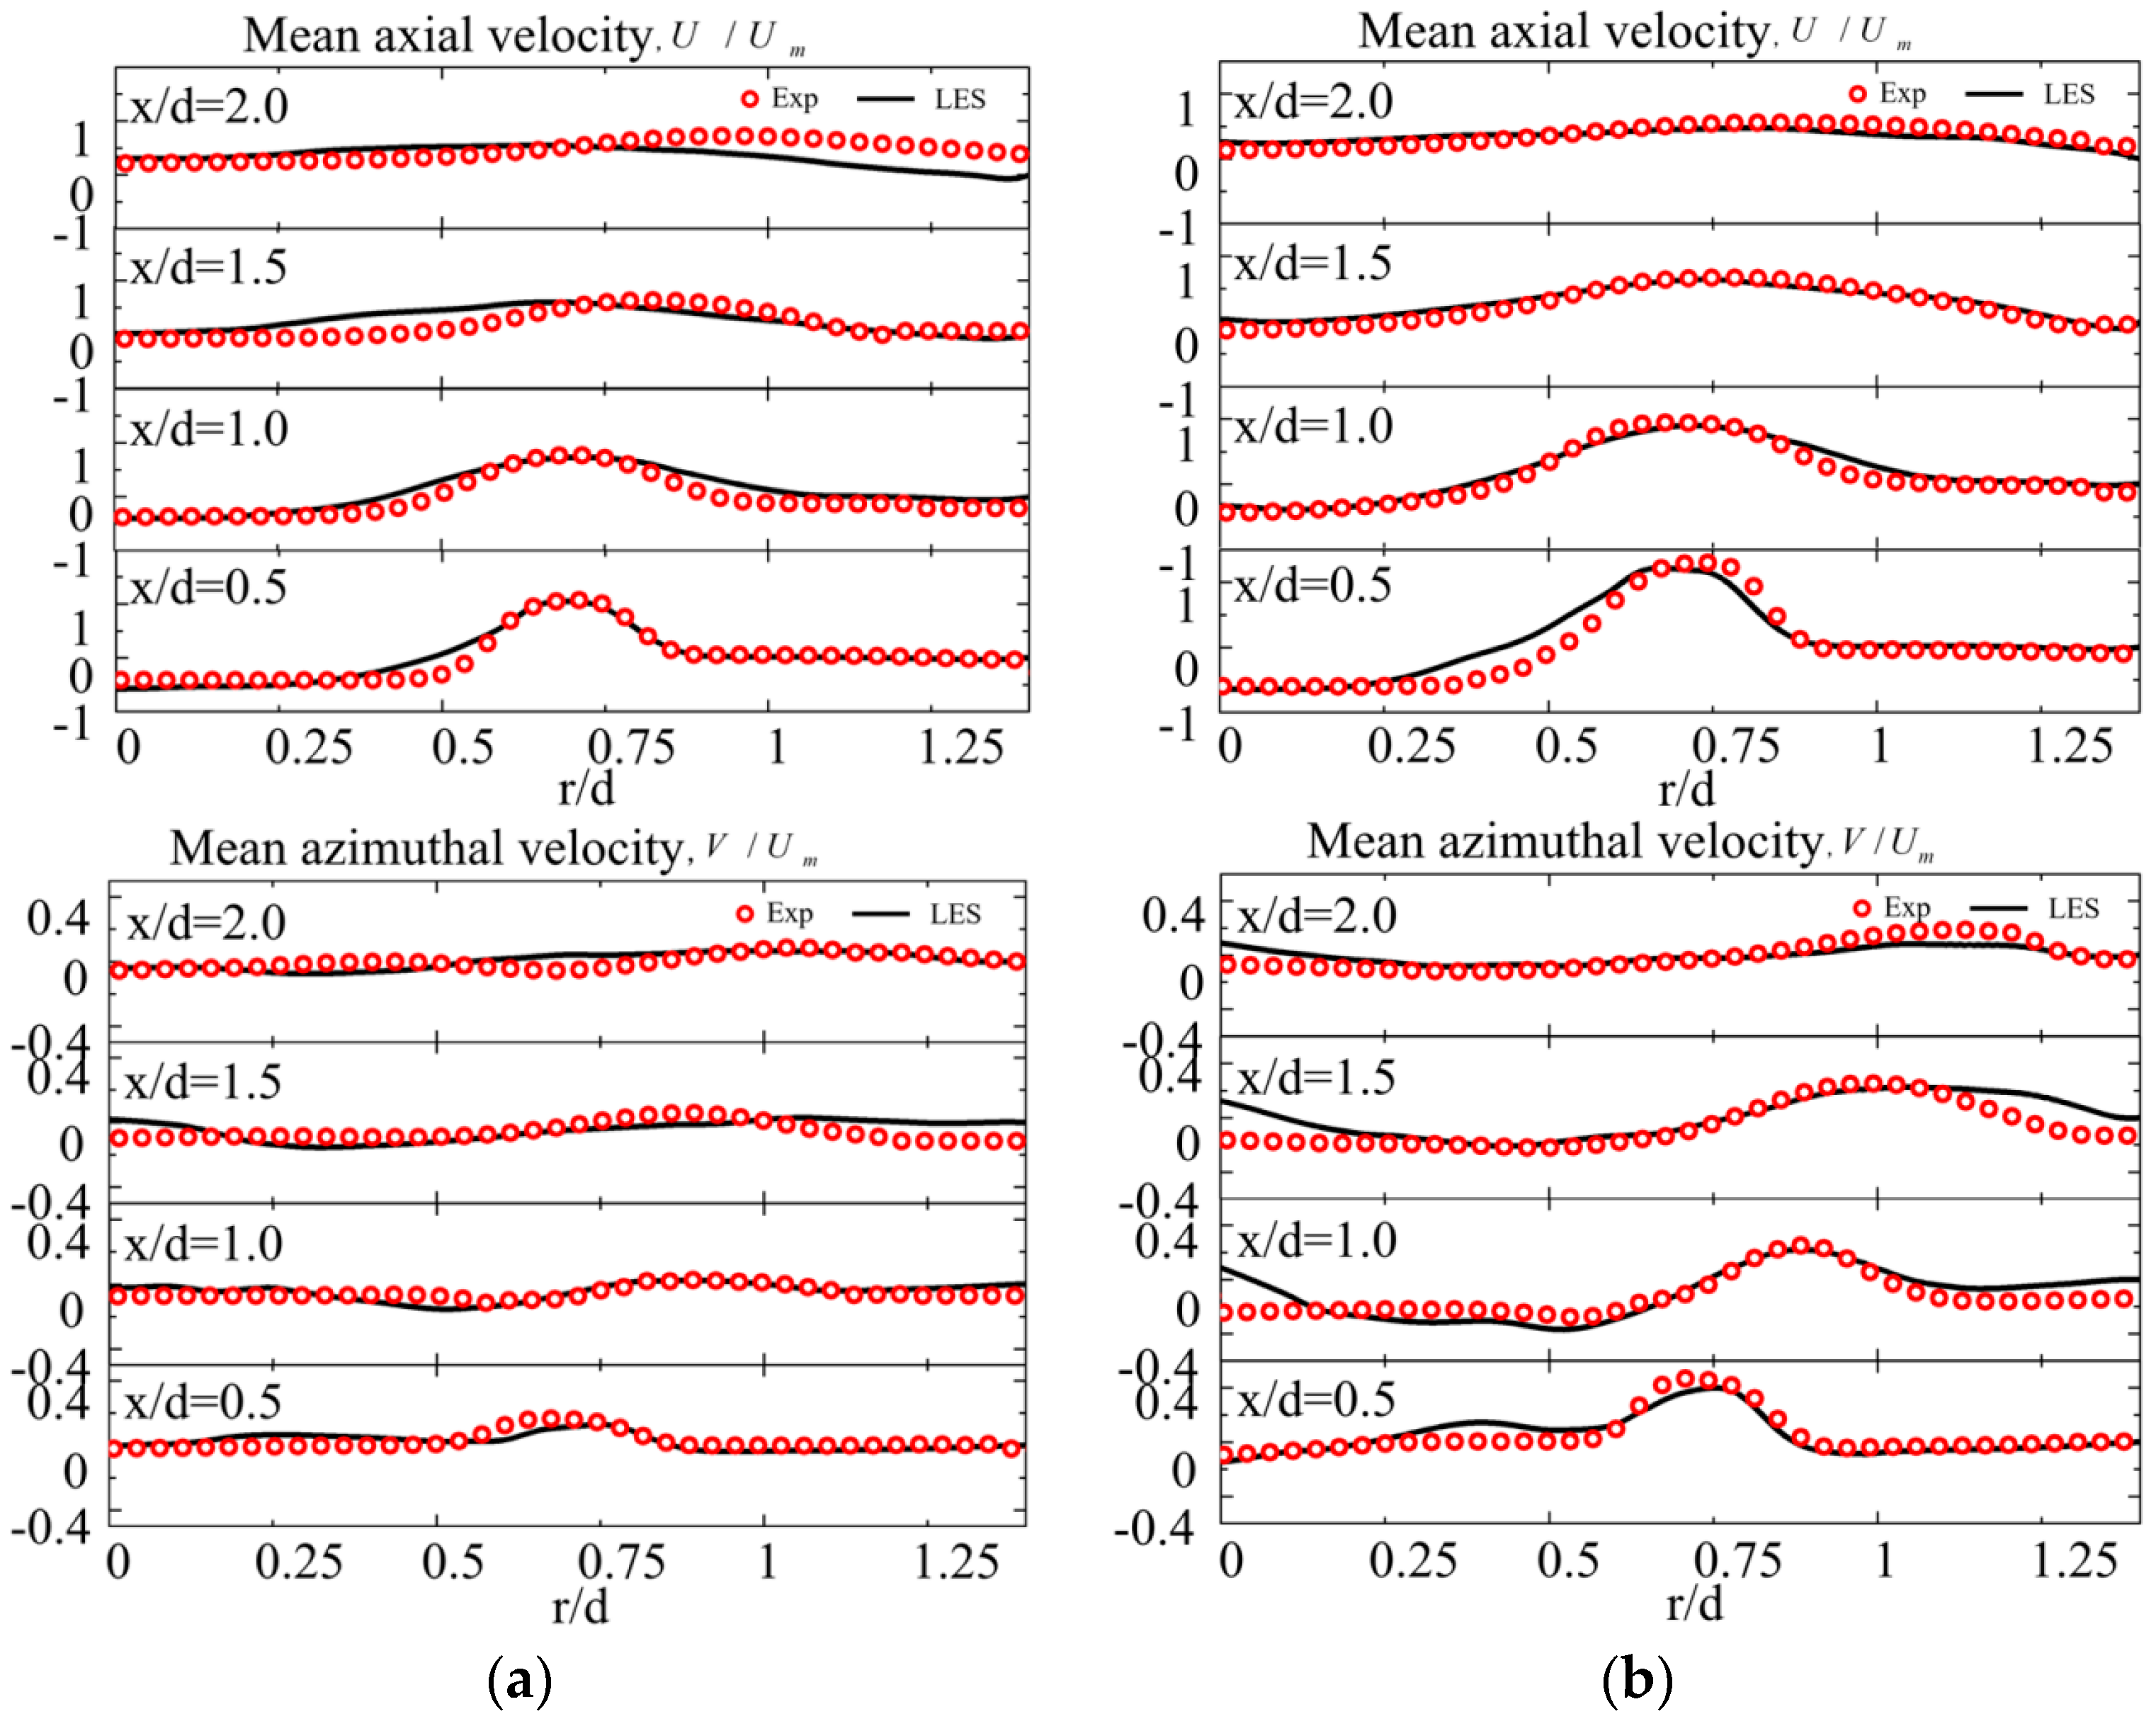
Appendix C. Velocity Field Validation

Figure A3. Profiles of the mean axial and azimuthal velocity for the different hydrogen ratio cases. (a) 00H2; (b) 30H2; (c) 60H2; (d) 90H2. The red symbols and solid black lines indicate the results obtained from the simulation and experimental procedures, respectively.
Applsci 14 01846 g0a3aApplsci 14 01846 g0a3b

References

  1. Lund, H.; Muenster, E. Management of surplus electricity-production from a fluctuating renewable-energy source. Appl. Energy 2003, 76, 65–74. [Google Scholar] [CrossRef]
  2. Bothien, M.R.; Ciani, A.; Wood, J.P.; Fruechtel, G. Sequential combustion in gas turbines: The key technology for burning high hydrogen contents with low emissions. In Proceedings of the ASME Turbo Expo 2019: Turbomachinery Technical Conference and Exposition, Phoenix, AZ, USA, 17–21 June 2019. [Google Scholar]
  3. Birol, F. The Future of Hydrogen, Seizing Today’s Opportunities, Report Prepared by the IEA for the G20, 82–83, Japan; IEA: Paris, France, 2019. [Google Scholar]
  4. Lee, M.C.; Seo, S.B.; Chung, J.H.; Kim, S.M.; Joo, Y.J.; Ahn, D.H. Gas turbine combustion performance test of hydrogen and carbon monoxide synthetic gas. Fuel 2010, 89, 1485–1491. [Google Scholar] [CrossRef]
  5. Valera-Medina, A.; Gutesa, M.; Xiao, H.; Pugh, D.; Giles, A.; Goktepe, B.; Marsh, R.; Bowen, P. Premixed ammonia/hydrogen swirl combustion under rich fuel conditions for gas turbines operation. Int. J. Hydrogen Energy 2019, 44, 8615–8626. [Google Scholar] [CrossRef]
  6. Tao, C.; Zhou, H. Dilution effects of CO2, Ar, N2 and He microjets on the combustion dynamic and emission characteristics of unsteady premixed flame. Aerosp. Sci. Technol. 2021, 111, 106537. [Google Scholar] [CrossRef]
  7. Ying, H.; Yang, V. Dynamics and stability of lean-premixed swirl-stabilized combustion. Prog. Energy Combust. Sci. 2009, 35, 293–364. [Google Scholar]
  8. Salvador, F.; Carreres, M.; García-Tíscar, J.; Belmar-Gil, M. Modal decomposition of the unsteady non-reactive flow field in a swirl-stabilized combustor operated by a Lean Premixed injection system. Aerosp. Sci. Technol. 2021, 112, 106622. [Google Scholar] [CrossRef]
  9. Ruan, C.; Chen, F.; Cai, W.; Qian, Y.; Yu, L.; Lu, X. Principles of non-intrusive diagnostic techniques and their applications for fundamental studies of combustion instabilities in gas turbine combustors: A brief review. Aerosp. Sci. Technol. 2019, 84, 585–603. [Google Scholar] [CrossRef]
  10. Zhao, D.; Lu, Z.; Zhao, H.; Li, X.; Wang, B.; Liu, P. A review of active control approaches in stabilizing combustion systems in aerospace industry. Prog. Aerosp. Sci. 2018, 97, 35–60. [Google Scholar] [CrossRef]
  11. Li, L.; Zhao, D. Prediction of stability behaviors of longitudinal and circumferential eigenmodes in a choked thermoacoustic combustor. Aerosp. Sci. Technol. 2015, 46, 12–21. [Google Scholar] [CrossRef]
  12. Hawkes, E.R.; Chen, J.H. Direct numerical simulation of hydrogen-enriched lean premixed methane–air flames. Combust. Flame 2004, 138, 242–258. [Google Scholar] [CrossRef]
  13. Schefer, R.W.; Wicksall, D.; Agrawal, A. Combustion of hydrogen-enriched methane in a lean premixed swirl-stabilized burner. Proc. Combust. Inst. 2002, 29, 843–851. [Google Scholar] [CrossRef]
  14. Zhao, T.; Zhang, J.; Ju, D.; Huang, Z.; Han, D. Exergy losses in premixed flames of dimethyl ether and hydrogen blends. Front. Energy 2019, 13, 658–666. [Google Scholar] [CrossRef]
  15. Wang, Z.; Hu, B.; Fang, A.; Zhao, Q.; Chen, X. Analyzing lean blow-off limits of gas turbine combustors based on local and global Damköhler number of reaction zone. Aerosp. Sci. Technol. 2021, 111, 106532. [Google Scholar] [CrossRef]
  16. Sacramento, E.M.D.; Lima, L.C.D.; Oliveira, C.J.; Veziroglu, T.N. A hydrogen energy system and prospects for reducing emissions of fossil fuels pollutants in the Ceará state—Brazil. Int. J. Hydrogen Energy 2008, 33, 2132–2137. [Google Scholar] [CrossRef]
  17. Koç, Y.; Yağlı, H.; Goerguelue, A.; Koc, A. Analysing the performance, fuel cost and emission parameters of the 50 MW simple and recuperative gas turbine cycles using natural gas and hydrogen as fuel. Int. J. Hydrogen Energy 2020, 45, 22138–22147. [Google Scholar] [CrossRef]
  18. Giacomazzi, E.; Battaglia, V.; Bruno, C. The coupling of turbulence and chemistry in a premixed bluff-body flame as studied by LES. Combust. Flame 2004, 138, 320–335. [Google Scholar] [CrossRef]
  19. Ruan, C.; Chen, F.; Yu, T.; Cai, W.; Li, X.; Lu, X. Experimental characterization of flame/flow dynamics during transition between stable and thermo-acoustically unstable conditions in a gas turbine model combustor. Aerosp. Sci. Technol. 2020, 102, 105858. [Google Scholar] [CrossRef]
  20. Shanbhogue, S.J.; Husain, S.; Lieuwen, T. Lean blowoff of bluff body stabilized flames: Scaling and dynamics. Prog. Energy Combust. Sci. 2009, 35, 98–120. [Google Scholar] [CrossRef]
  21. Wan, J.; Fan, A. Recent progress in flame stabilization technologies for combustion-based micro energy and power systems. Fuel 2020, 286, 119391. [Google Scholar] [CrossRef]
  22. Dawson, J.; Gordon, R.; Kariuki, J.; Mastorakos, E.; Masri, A.; Juddoo, M. Visualization of blow-off events in bluff-body stabilized turbulent premixed flames. Proc. Combust. Inst. 2011, 33, 1559–1566. [Google Scholar] [CrossRef]
  23. Tong, Y.; Liu, X.; Wang, Z.; Richter, M.; Klingmann, J. Experimental and numerical study on bluff-body and swirl stabilized diffusion flames. Fuel 2018, 217, 352–364. [Google Scholar] [CrossRef]
  24. Kim, H.S.; Arghode, V.K.; Linck, M.B.; Gupta, A.K. Hydrogen addition effects in a confined swirl-stabilized methane-air flame. Int. J. Hydrogen Energy 2009, 34, 1054–1062. [Google Scholar] [CrossRef]
  25. Michaels, D.; Shanbhogue, S.J.; Ghoniem, A.F. The impact of reactants composition and temperature on the flow structure in a wake stabilized laminar lean premixed CH4/H2/air flames; mechanism and scaling. Combust. Flame 2017, 176, 151–161. [Google Scholar] [CrossRef]
  26. Denaro, F.M. What Is the Basic Physical Meaning of Enstrophy? Available online: https://www.researchgate.net/post/What_is_the_basic_physical_meaning_of_enstrophy (accessed on 25 January 2024).
  27. Balachandran, R.; Ayoola, B.O.; Kaminski, C.F.; Dowling, A.P.; Mastorakos, E. Experimental investigation of the nonlinear response of turbulent premixed flames to imposed inlet velocity oscillations. Combust. Flame 2005, 143, 37–55. [Google Scholar] [CrossRef]
  28. Immer, M.C. Time-Resolved Measurement and Simulation of Local Scale Turbulent Urban Flow. Ph.D. Thesis, ETH Zurich, Zürich, Switzerland, 2016. [Google Scholar]
  29. Veynante, D.; Vervisch, L. Turbulent combustion modeling. Prog. Energy Combust. Sci. 2002, 28, 193–266. [Google Scholar] [CrossRef]
  30. Colin, O.; Ducros, F.; Veynante, D.; Poinsot, T. A thickened flame model for large eddy simulations of turbulent premixed combustion. Phys. Fluids 2000, 12, 1843–1863. [Google Scholar] [CrossRef]
  31. Wei, X.; Zhang, M.; An, Z.; Wang, J.; Huang, Z.; Tan, H. Large eddy simulation on flame topologies and the blow-off characteristics of ammonia/air flame in a model gas turbine combustor. Fuel 2021, 298, 120846. [Google Scholar] [CrossRef]
  32. Wang, G.; Boileau, M.; Veynante, D.; Truffin, K. Large eddy simulation of a growing turbulent premixed flame kernel using a dynamic flame surface density model. Combust. Flame 2012, 159, 2742–2754. [Google Scholar] [CrossRef]
  33. Charlette, F.; Meneveau, C.; Veynante, D. A power-law flame wrinkling model for LES of premixed turbulent combustion Part II: Dynamic formulation. Combust. Flame 2002, 131, 181–197. [Google Scholar] [CrossRef]
  34. Han, W.; Wang, H.; Kuenne, G.; Hawkes, E.R.; Chen, J.H.; Janicka, J.; Hasse, C. Large eddy simulation/dynamic thickened flame modeling of a high Karlovitz number turbulent premixed jet flame. Proc. Combust. Inst. 2019, 37, 2555–2563. [Google Scholar] [CrossRef]
  35. Ansys Chemkin-Pro. ANSYS React Des San Diego, version 17.2; Ansys Chemkin-Pro: Canonsburg, PA, USA, 2016.
  36. Martin, C.E.; Benoit, L.; Sommerer, Y.; Nicoud, F.; Poinsot, T. Large-eddy simulation and acoustic analysis of a swirled staged turbulent combustor. AIAA J. 2006, 44, 741–750. [Google Scholar] [CrossRef]
  37. Kitano, T.; Kaneko, K.; Kurose, R.; Komori, S. Large-eddy simulations of gas- and liquid-fueled combustion instabilities in back-step flows. Combust. Flame 2016, 170, 63–78. [Google Scholar] [CrossRef]
  38. Guo, S.; Wang, J.; Wei, X.; Yu, S.; Zhang, M.; Huang, Z. Numerical simulation of premixed combustion using the modified dynamic thickened flame model coupled with multi-step reaction mechanism. Fuel 2018, 233, 346–353. [Google Scholar] [CrossRef]
  39. Issa, R.I. Solution of the implicitly discretised fluid flow equations by operator-splitting. J. Comput. Phys. 1986, 62, 40–65. [Google Scholar] [CrossRef]
  40. Karalus, M.F.; Fackler, K.B.; Novosselov, I.V.; Kramlich, J.C.; Malte, P.C. A skeletal mechanism for the reactive flow simulation of methane combustion. In Proceedings of the Turbo Expo: Power for Land, Sea, and Air, San Antonio, TX, USA, 3–7 June 2013; p. V01BT04A065. [Google Scholar]
  41. Lee, C.Y.; Cant, S. Assessment of LES subgrid-scale models and investigation of hydrodynamic behaviour for an axisymmetrical bluff body flow. Flow Turbul. Combust. 2017, 98, 155–176. [Google Scholar] [CrossRef] [PubMed]
  42. Chen, Q.; Zhong, Q.; Qi, M.; Wang, X. Comparison of vortex identification criteria for planar velocity fields in wall turbulence. Phys. Fluids 2015, 27, 085101. [Google Scholar] [CrossRef]
  43. Guo, S.; Wang, J.; Zhang, W.; Zhang, M.; Huang, Z. Effect of hydrogen enrichment on swirl/bluff-body lean premixed flame stabilization. Int. J. Hydrogen Energy 2020, 45, 10906–10919. [Google Scholar] [CrossRef]
  44. Hunt, J.C.R.; Wray, A.A.; Moin, P. Eddies, streams, and convergence zones in turbulent flows. In Proceedings of the 1988 Summer Program, Stanford, CA, USA, 8–10 April 1988; pp. 193–208. [Google Scholar]
  45. Fu, W.-S.; Lai, Y.-C.; Li, C.-G. Estimation of turbulent natural convection in horizontal parallel plates by the Q criterion. Int. Commun. Heat Mass Transf. 2013, 45, 41–46. [Google Scholar] [CrossRef]
  46. Panesi, M. Influences Of The Darrieus-Landau Instability On Premixed Turbulent Flames. In Proceedings of the 70th Annual Meeting of the APS Division of Fluid Dynamics, Denver, CO, USA, 19–21 November 2017. [Google Scholar]
Figure 1. Schematic of the bluff-body burner (all undefined units: millimeter).
Applsci 14 01846 g001
Figure 2. The computational domain with mesh details (all undefined units: millimeter).
Applsci 14 01846 g002
Figure 3. Flame structure. (a) The time-averaged OH signal obtained using the OH−PLIF technique; (b) time−averaged OH mass concentration from the LES. (a) Experiment; (b) LES.
Applsci 14 01846 g003
Figure 4. The angle between the flame edge and centerline for both the experiment and simulation results.
Applsci 14 01846 g004
Figure 5. (a) The mean axial velocity field of non-reacting flow; (b) the mean axial velocity profiles U/Um, and (c) the mean azimuthal velocity profiles V/Vm of non-reacting flow.
Applsci 14 01846 g005
Figure 6. Blow-off limits ϕLBO for flames subjected to different hydrogen ratios.
Applsci 14 01846 g006
Figure 7. Vorticity maps of different hydrogen ratios. The lines mark the flame location (contour of 10% maximum heat release) and the stagnation streamline. The flame leading edge is also indicated in the figure.
Applsci 14 01846 g007
Figure 8. The vortices and the flame location characterized by 10% of the maximum heat release.
Applsci 14 01846 g008
Figure 9. The change in normalized integrated heat release rate over time (ms).
Applsci 14 01846 g009
Figure 10. Normalized heat release rates of different hydrogen ratios during the blow-off process. (a) 00H2; (b) 30H2; (c) 60H2; (d) 90H2.
Applsci 14 01846 g010aApplsci 14 01846 g010b
Figure 11. Scatter plots of HRR and temperature on a plane sliced along the axis.
Applsci 14 01846 g011
Figure 12. Enstrophy at x/d = 1.5 during blow-off for different hydrogen ratios.
Applsci 14 01846 g012
Figure 13. Vortex stretching (Term 1), dilatation (Term 2), and barolinic source (Term 3) at x/d = 1.5 during blow-off for different hydrogen ratios.
Applsci 14 01846 g013
Table 1. Summary of the characteristic parameters. δ l 0 : flame thickness; Tad: adiabatic flame temperature; Δ x : grid size in the main reaction zone; n: grid number inside the flame front; F: the thickening factor.
ID S l (m/s) δ l 0 (mm)Tad (K) Δ x (mm) Δ x / δ l 0 nF
00H20.24680.5731919.710.50.87276
30H20.29700.5101927.910.50.98077
60H20.41120.4291944.720.51.16678
90H20.85990.3632001.720.51.37779
Disclaimer/Publisher’s Note: The statements, opinions and data contained in all publications are solely those of the individual author(s) and contributor(s) and not of MDPI and/or the editor(s). MDPI and/or the editor(s) disclaim responsibility for any injury to people or property resulting from any ideas, methods, instructions or products referred to in the content.

