Article

Classification of Belts Status Based on an Automatic Generator of Fuzzy Rules Base System

by
Graciliano Nicolás Marichal
1,*,
Ángela Hernández
1,
Deivis Ávila
1 and
Juan Carlos García-Prada
2
1
Escuela Superior de Ingeniería y Tecnología, Universidad de La Laguna, 38200 Tenerife, Spain
2
E.T.S. de Ingenieros Industriales, Universidad Nacional de Educación a Distancia, 28040 Madrid, Spain
*
Author to whom correspondence should be addressed.
Appl. Sci. 2024, 14(5), 1831; https://doi.org/10.3390/app14051831
Submission received: 16 January 2024 / Revised: 9 February 2024 / Accepted: 21 February 2024 / Published: 23 February 2024
(This article belongs to the Special Issue Advances in Intelligent Control and Engineering Applications)

Abstract

:
The automation of maintenance is a growing field and consequently, predictive maintenance is achieving more importance. The main objective is to predict a breakage before it happens. In order to reach this, it is necessary to have an intelligent classification technique that analyzes the state of the key breakage elements and evaluates whether a replacement is necessary or not. This work presents a study to classify belts according to their state of use. For training, vibration data have been collected on a test bench using new belts, belts with half use and belts near the breaking point. The processing of these vibrations allows for extracting the characteristic parameters that can be related to its state of use, and then, after the initial analysis, these values are used as inputs for training the intelligent system. In particular, the Genetic Neuro-Fuzzy (GNF) technique has been chosen and, with the proposed algorithm, more detailed Fuzzy rules are obtained. Once the algorithm has been trained, it is possible to establish a relationship between the vibration shown by the belt and its state of use. The achieved results show that a good classifier has been built.

1. Introduction

The implementation of Industry 4.0 involves a major focus on maintenance [1]. Traditionally, a preventive or corrective technique would be carried out based on inspections and replacements that have been scheduled or based on repairing breakdowns when they occur. However, in the last decades, predictive maintenance has acquired great relevance because it is based on the anticipation of failures and the minimization of downtime [2,3]. Its axis of execution is the continuous monitoring of equipment, using advanced technologies and techniques to collect real-time data on its internal state. In this way, key information can be interpreted in order to determine if an intervention is necessary. This information is examined using algorithms and artificial intelligence techniques to obtain and identify patterns or trends that may indicate possible failures or imminent problems. With these procedures, action can be taken before a breakdown occurs, avoiding costly downtime and improving efficiency and productivity in the industry [4,5].
Transmission belts are one of the key units in many industrial pieces of equipment, since, as elements of power transmission and movement between different components, they are present in practically all types of machinery [6,7]. They should be considered as delicate elements since they are subject to permanent erosion due to friction, tension and environmental conditions [8,9]. For this reason, predictive maintenance is the most appropriate methodology to guarantee optimal performance. In this technique, condition monitoring is crucial, since the reception of digital signals from sensors located on the machinery allows for obtaining relevant data. These measurements are the first phase in fault diagnosis and allow for a Remaining Useful Life (RUL) study on a particular component or equipment. In this way, it is possible to develop accurate predictive maintenance. Monitoring the condition of the transmission belts can be carried out using various techniques and technologies [10,11]. Although the most common is visual inspection, it is not adequate, since it only allows the visible problems to be detected and this, in addition to not providing an exhaustive evaluation of the internal condition of the belt, can result in a too-late evaluation. Therefore, the use of vibration sensors is usually chosen [12,13]. Vibration monitoring allows for detecting anomalies, which may be indicative of misalignments, imbalances or tension problems in the transmission belts, allowing corrective measures to be taken before catastrophic failure occurs [14].
In addition to monitoring, the processing of recorded data is the second principal element of predictive maintenance. In this sense, due to the great evolution of artificial intelligence techniques, these represent powerful information processing tools that make it possible to anticipate failures and minimize downtime in the industry. In the last decades, there has been a great expansion in the application of signal processing techniques. Machine Learning (ML) techniques have been widely used owing to their successful results in predictive problems [15]. However, they are considered black boxes, since it is not possible to establish a relation between their inputs and outputs. This involves an important limitation because there is a lack of capability for interpretation in their learning. Meanwhile, the relevance of Artificial Neural Network (ANN) in multiple fields of research should be pointed out, but they stand out especially in fatigue modeling [16], in classification problems or life predictions [17]. The principal advantages reside in the excellent adaptivity, brilliant self-learning properties and important capabilities for extracting relations in complex data sets [18]. There are different variants of the ANN model, such as adaptive neuro-diffuse inference systems (ANFIS) [17,19,20], but Genetic Neuro-Fuzzy (GNF) techniques [21] stand out for their ability to analyze large volumes of data, identify complex patterns and generate accurate prediction models [22,23,24].
This research presents an intelligent classification system for the state of transmission belt wear. The starting point is the study of the vibration behavior as a determining factor to identify the level of use. In particular, signals are processed in the frequency spectrum, obtaining data for the intelligent classifier through analysis by band division. With the characteristic values obtained for each band, the set is built to train the classification algorithm. In particular, in this work, a method based on the Genetic Neuro-Fuzzy technique, developed by the researchers of this work, is proposed. The presented technique has resulted in the generation of a good classifier since promising results have been achieved. In this sense, it is important to highlight that the proposed algorithm is novel and not only because it combines artificial neural networks, Fuzzy systems and genetic algorithms. Moreover, the trained system is able to automatically provide a set of Fuzzy rules that solve the posed problem; in this research, belts are classified according to their deterioration. Although there are similar techniques in the bibliography, the proposed method allows the use of a large amount of inputs, which affords a wider application. In addition, one of its advantages is that it allows for close monitoring of how the process of obtaining rules occurs, which would allow explicating them in an additional phase.

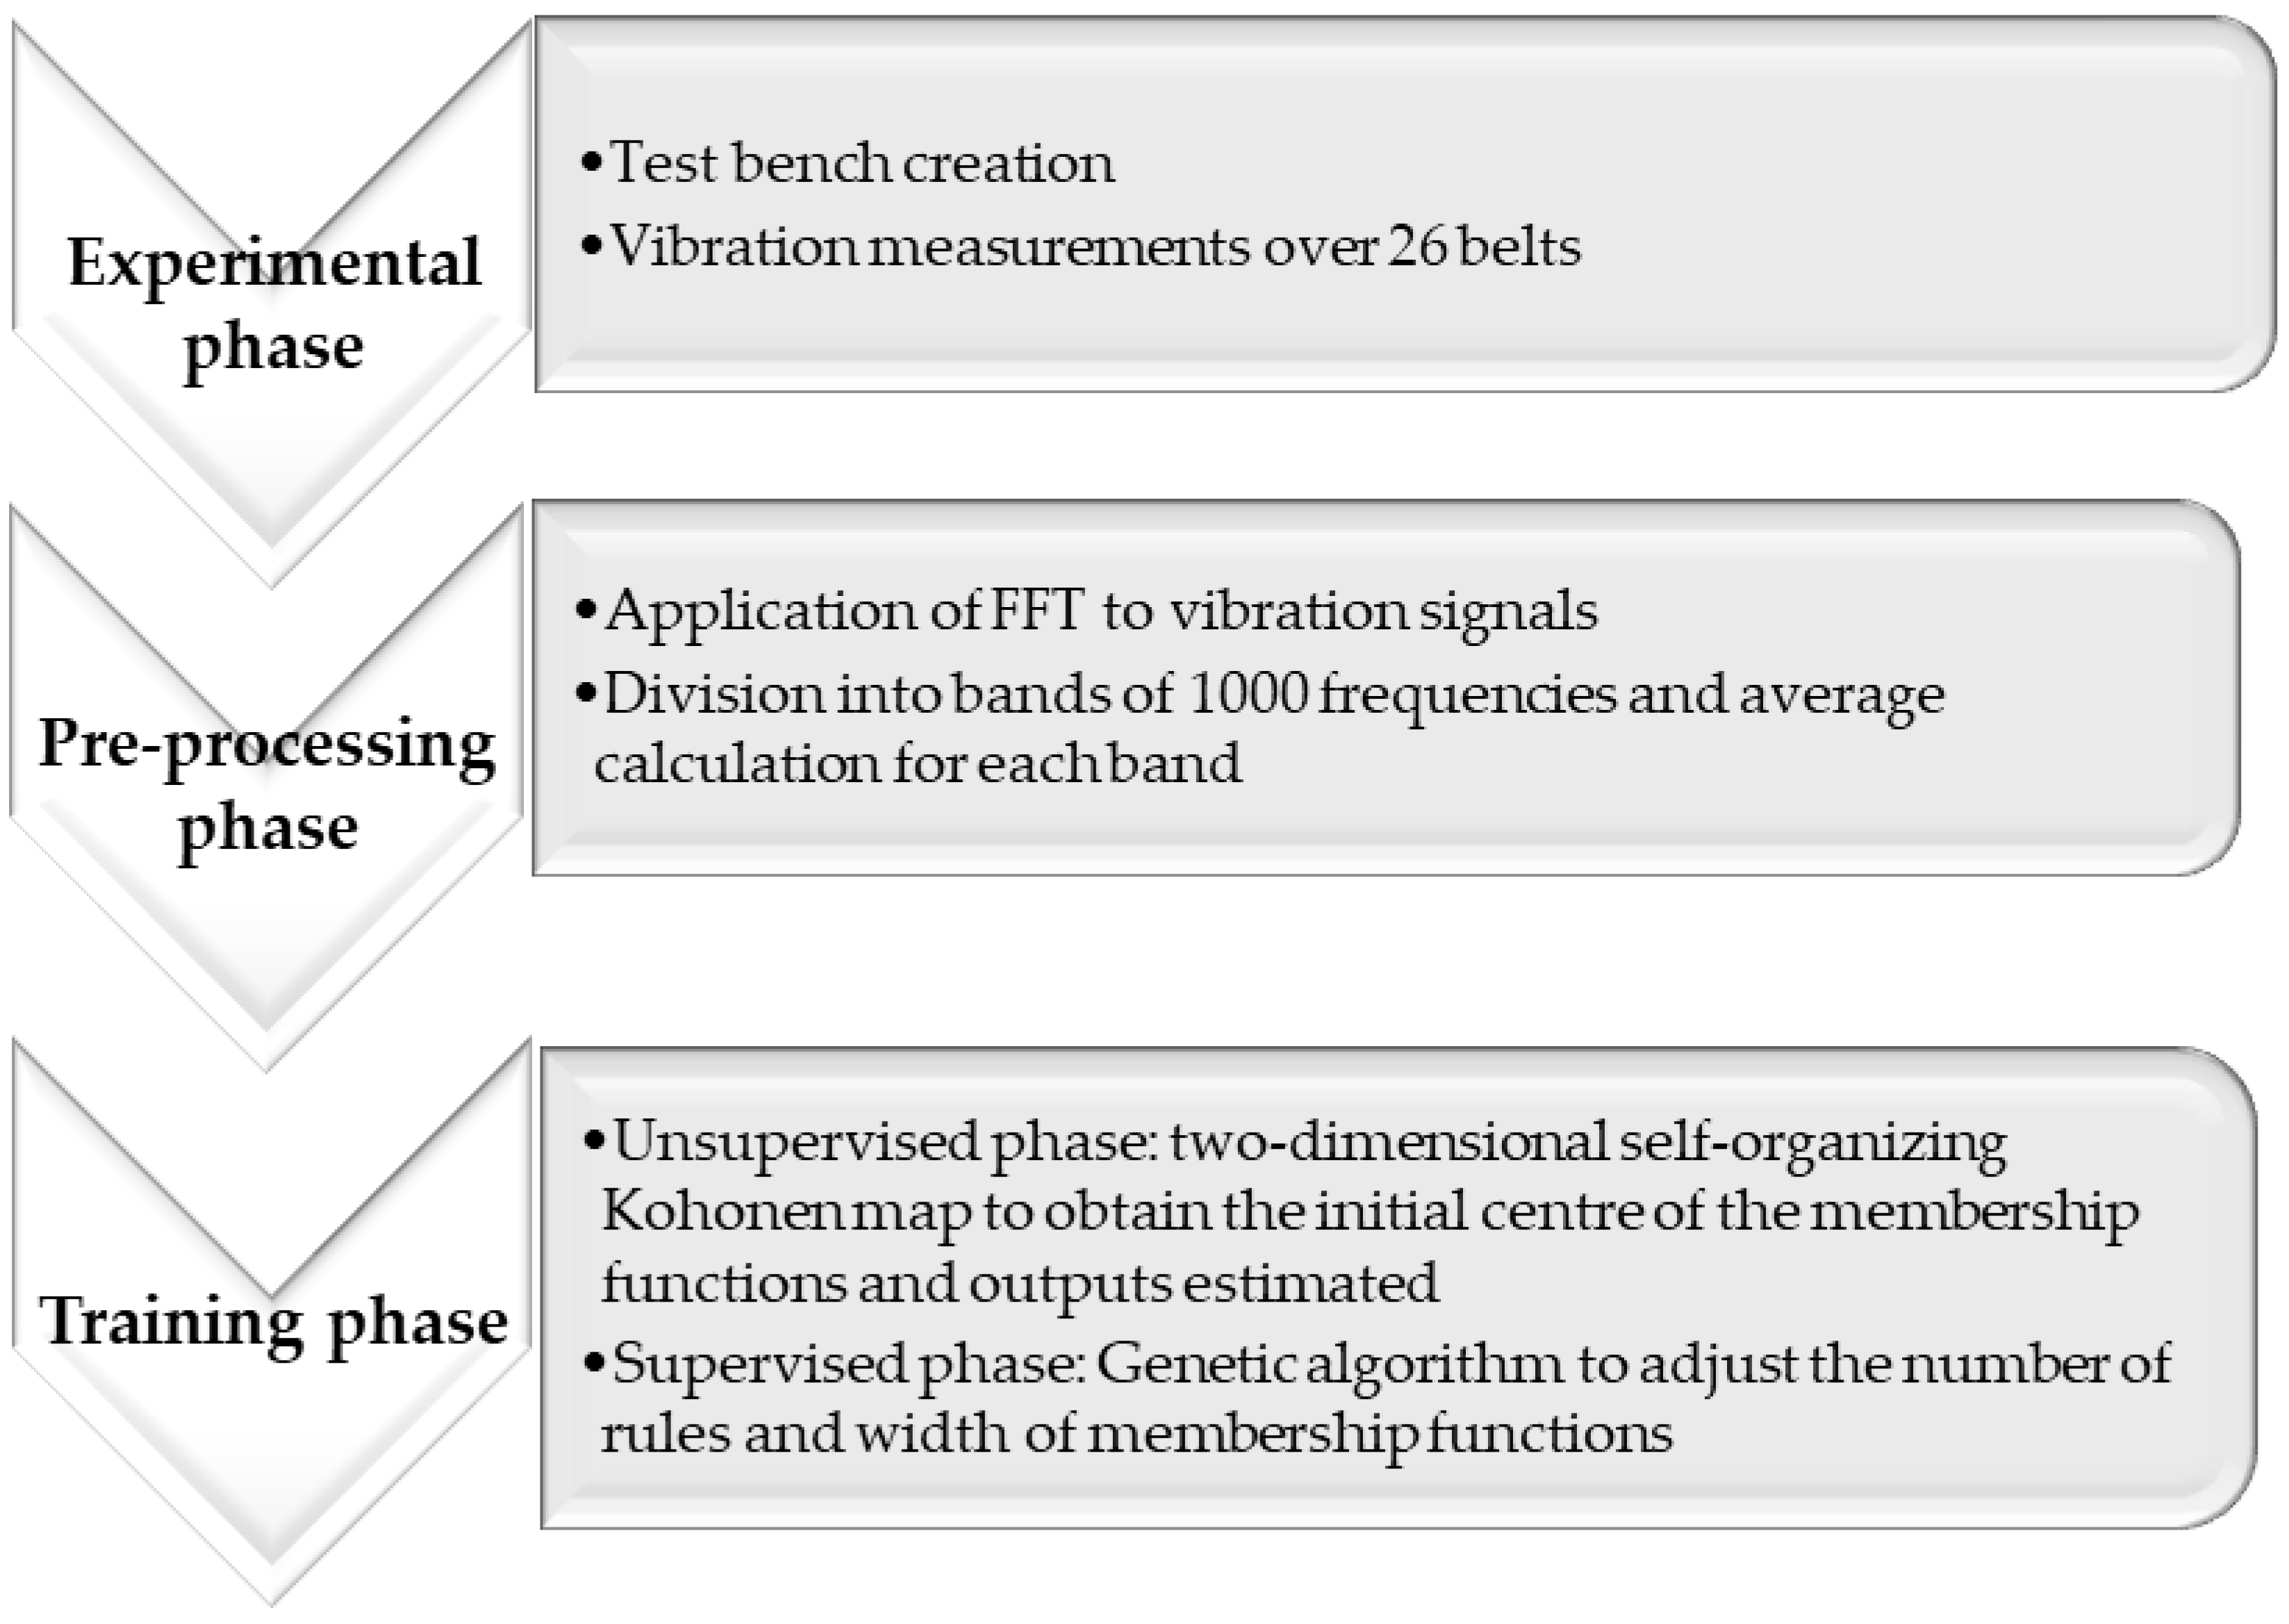
2. Materials and Methods

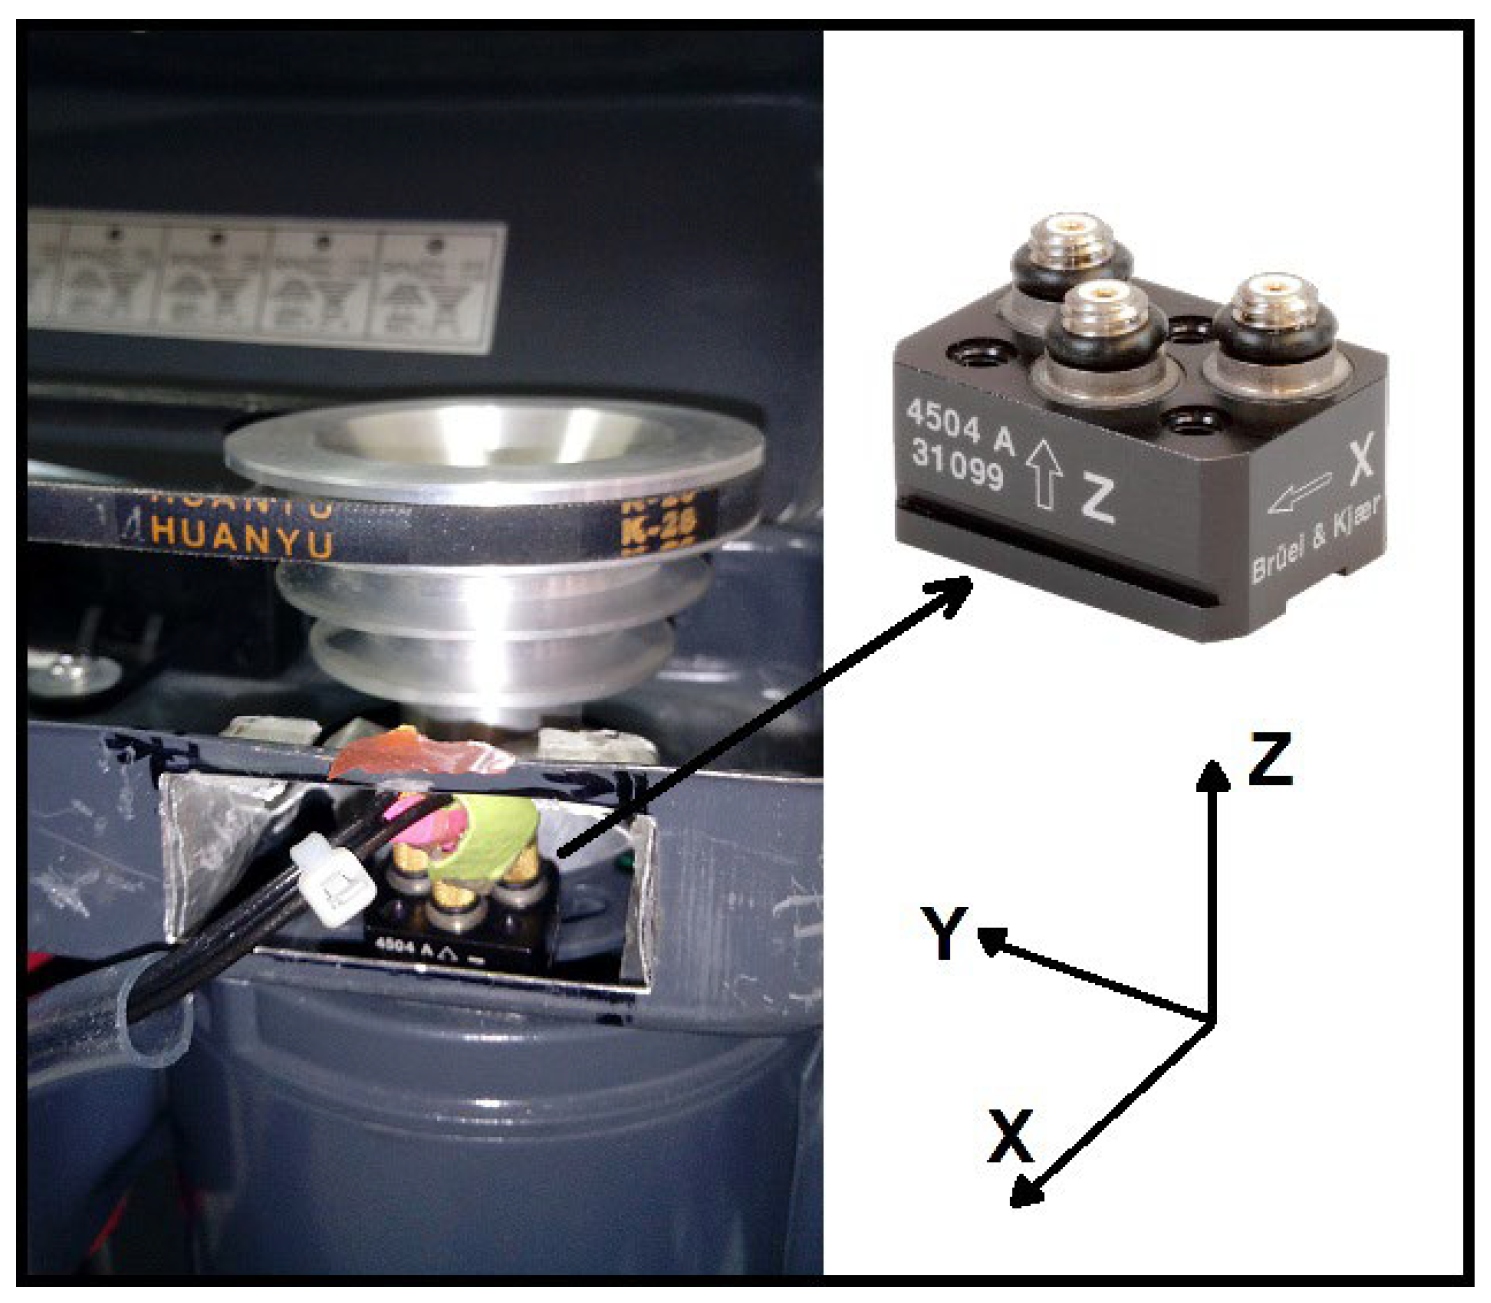
2.1. Experimental Bench

In order to carry out the measurements, a laboratory-scale high-speed rotating machine was built. This prototype allows us to more easily search for key elements in detecting breakdowns in this type of transmission system. Specifically, a test bench of a modified column drill has been used, where the mechanical transmission is carried out using V-belts. The technical characteristics of the electric motor of the drill are shown in Table 1. All measurements were carried out without loads on the motor.
The necessary modifications have been carried out on this prototype to reach the research objectives. On the one hand, it was necessary to be able to access the most suitable area for the installation of a piezoelectric accelerometer that would allow for safely measuring vibrations for the operator and the sensor and with an adequate level of accuracy. And, on the other hand, the system should be adapted, so that different belts could be changed and adjusted precisely.
The technical analysis of the test bench concludes that the best location to carry out the measurements is the electric motor that drives the rotary machine. Then, it was decided to place the piezoelectric accelerometer to collect data as close as possible to the bearing of the electric motor. In particular, in the area of the transmission shaft, where the pulley is attached (Figure 1).
Once the column drill test bench has been modified, the measuring devices are installed. In this work, a triaxial piezoelectric accelerometer type 4504 A (Bruel & Kjaer brand, Naerum, Denmark) was used along with a digital analog signal switch (Photon+), also from the Bruel & Kjaer brand (Naerum, Denmark), which transforms the obtained signals to digital format and a computer with processing software.
The block diagram of the system for performing vibration data collection is shown in Figure 2. The final assembly of the experimental bench is shown in Figure 3.
The obtained data were vibration measurements produced by 26 belts that are in different states of deterioration. Specifically, vibration signals have been obtained in the three Cartesian axes with 7 new belts, 10 belts that are half used and 9 belts close to breaking.

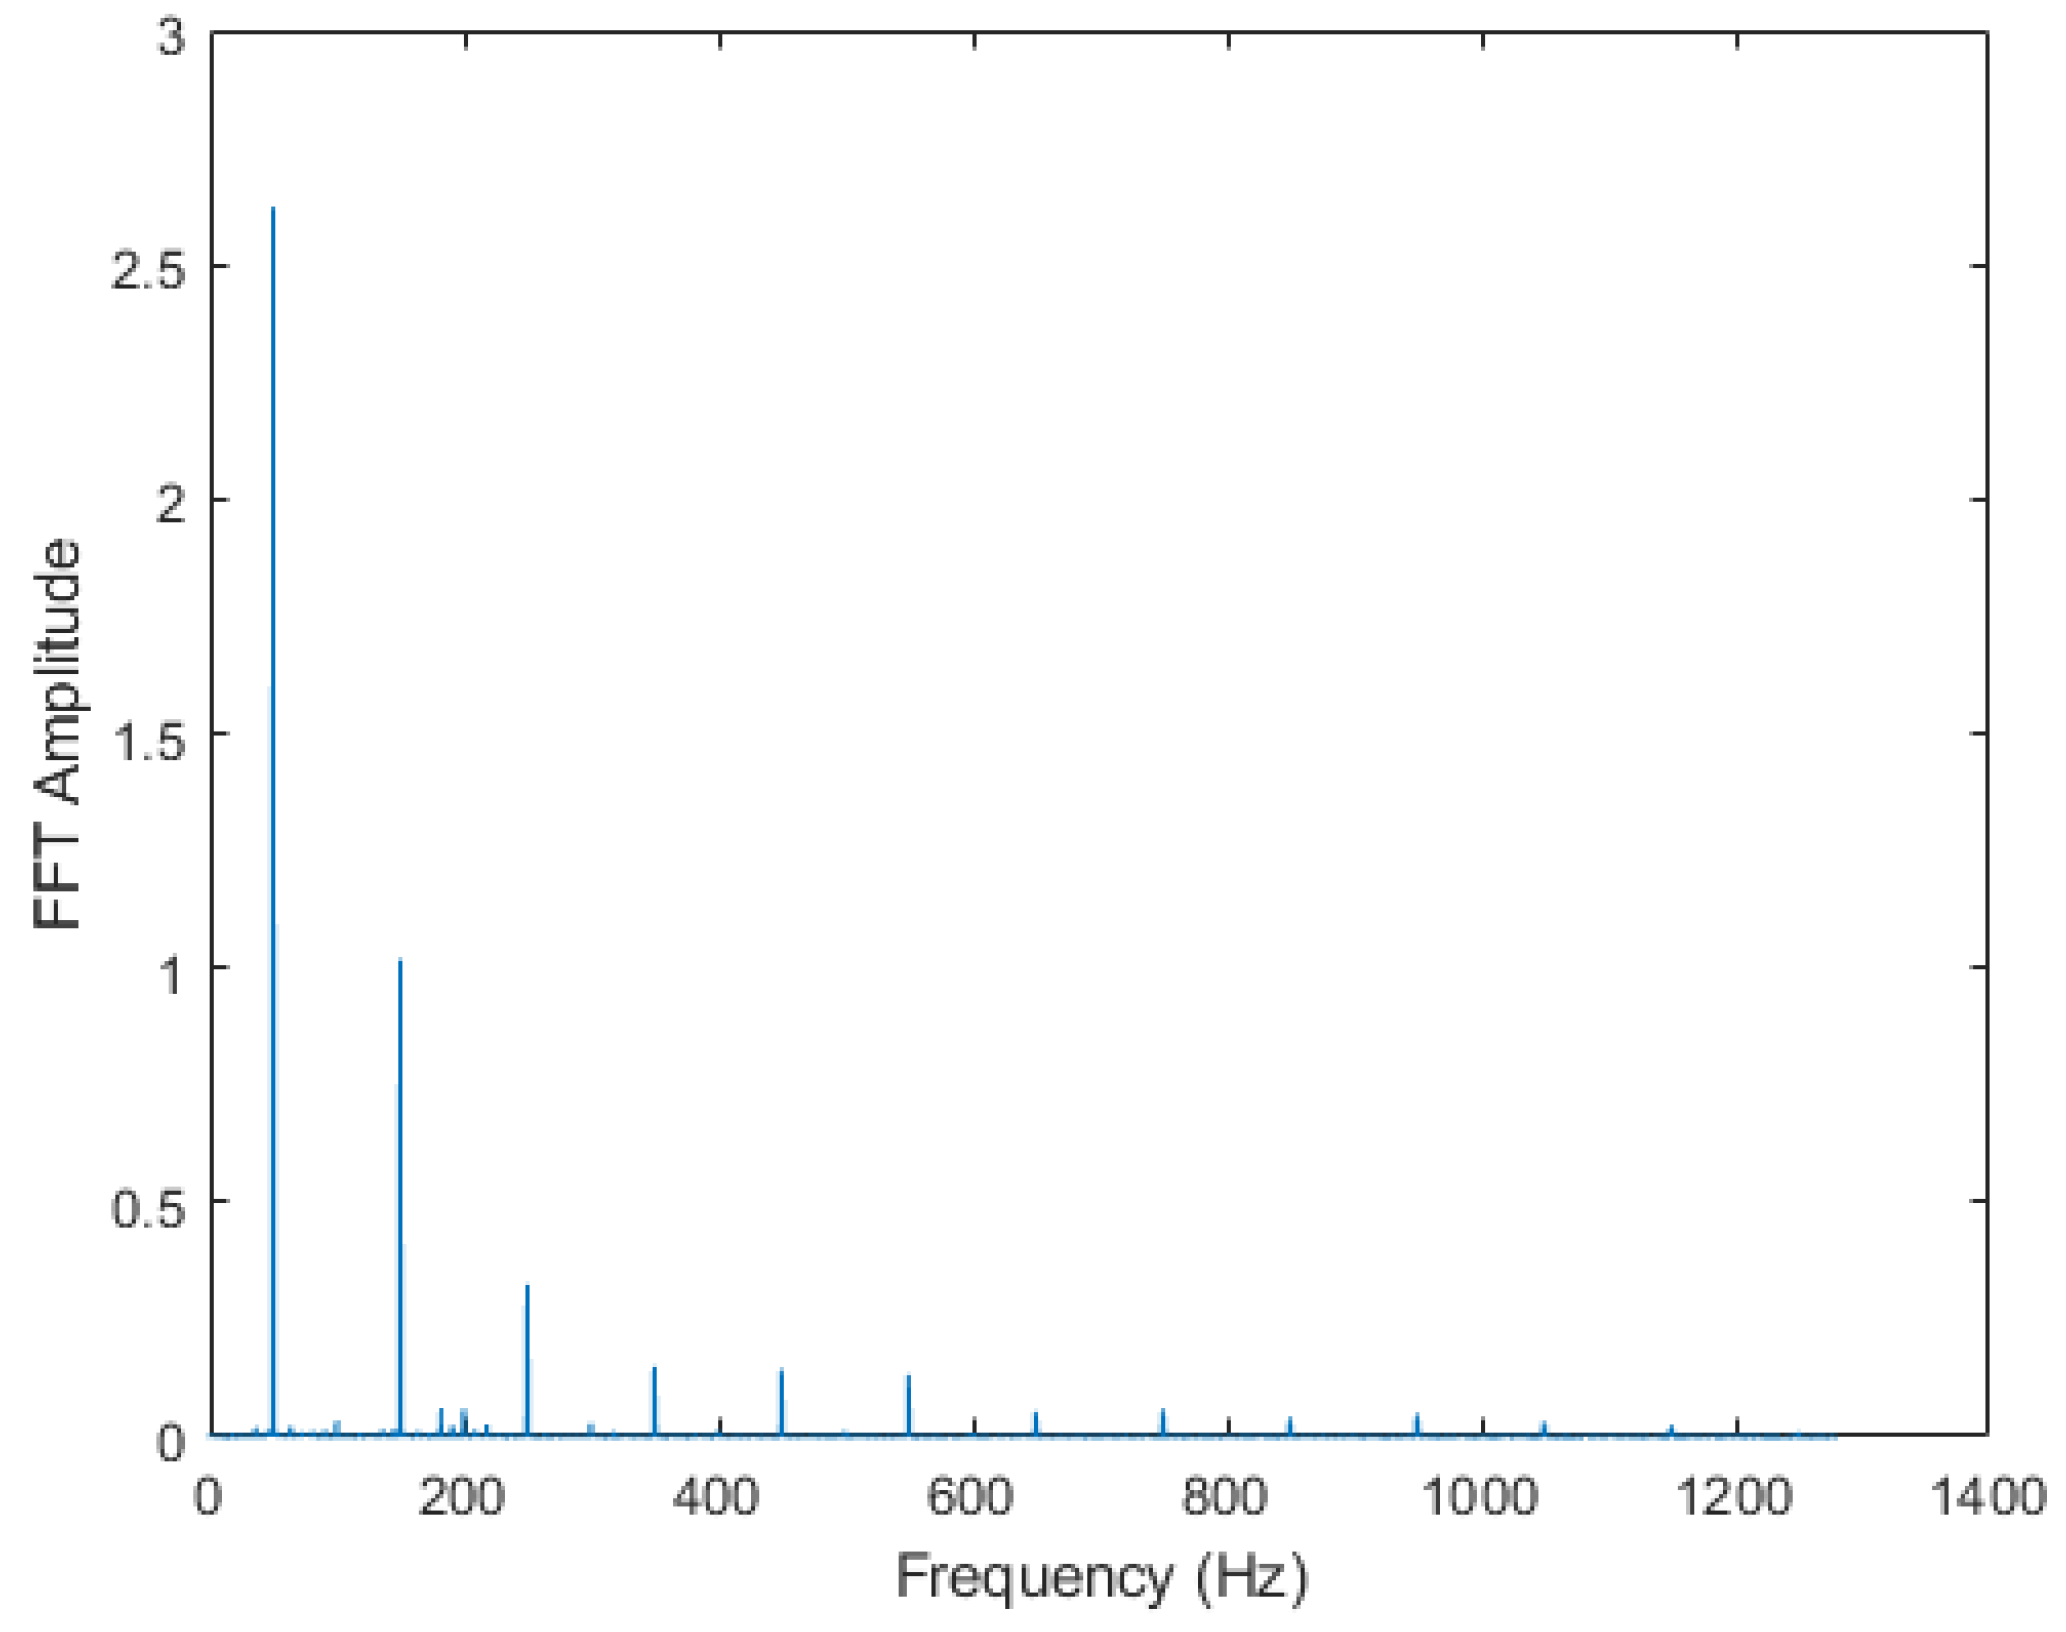
2.2. Signal Processing and Intelligent Method
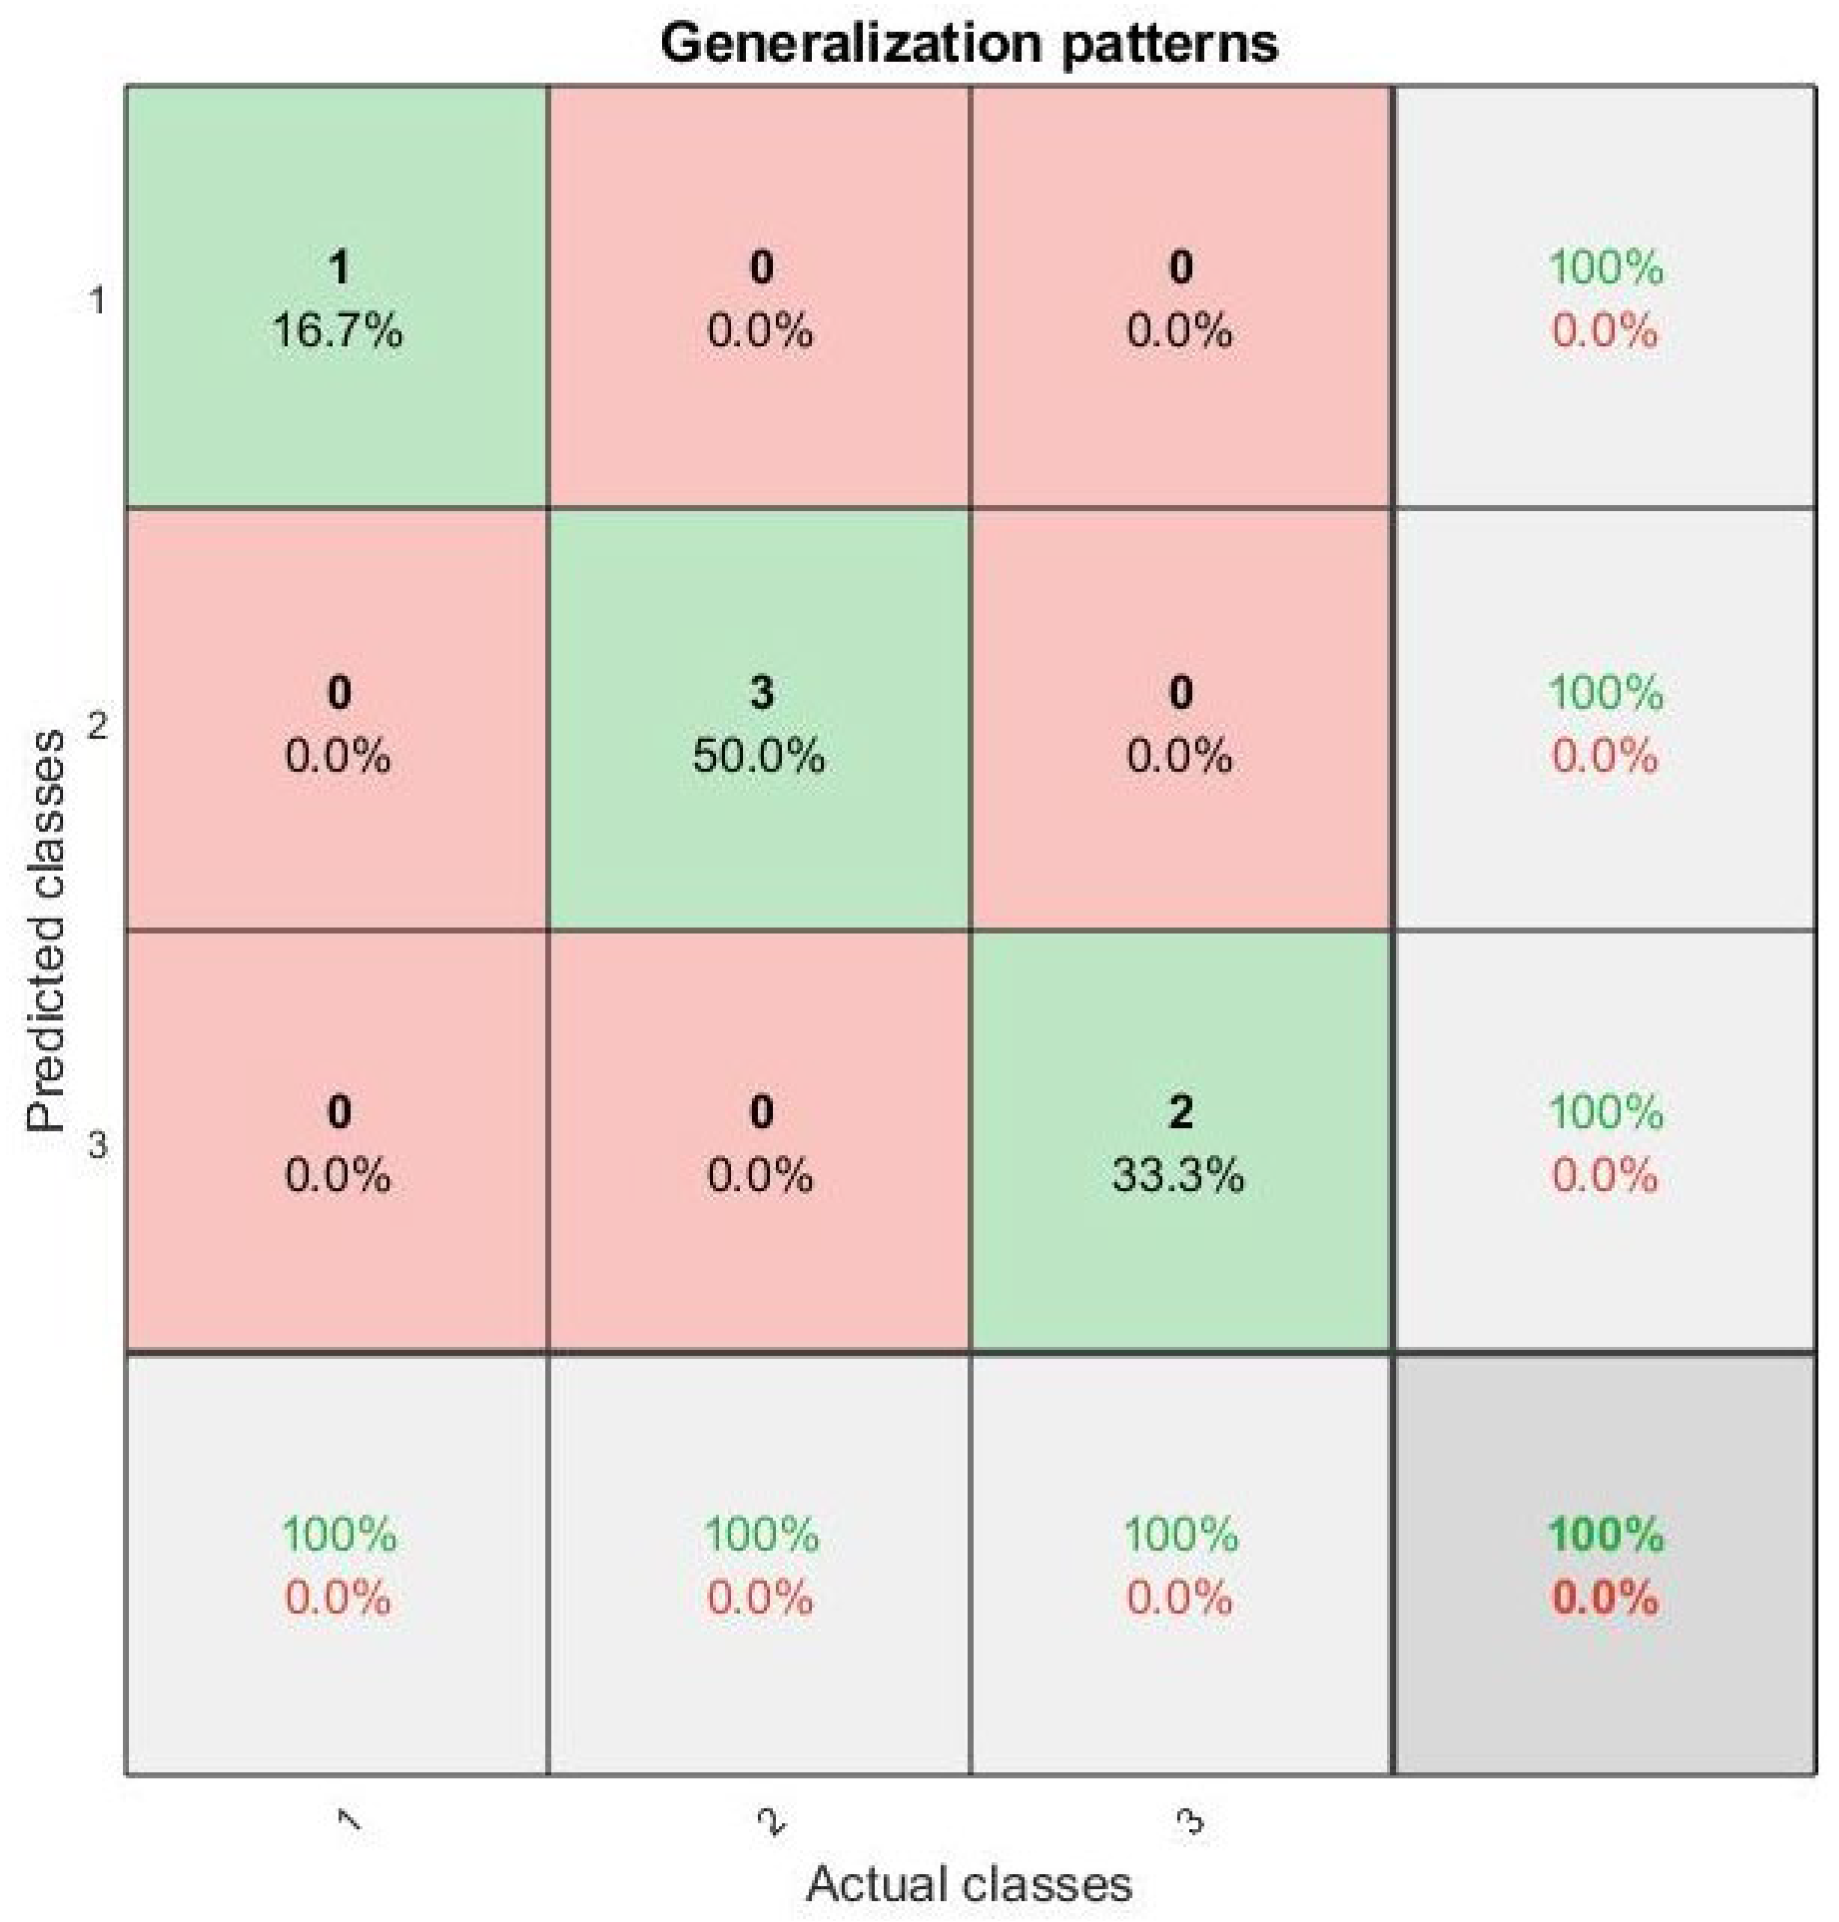
The main purpose of this research is to build an intelligent classifier that, once it has been trained, allows for identifying the use state of a belt from its vibration signal. Therefore, it is necessary to perform a previous phase of signal processing. These signals are acceleration values measured in each Cartesian axis during 2 s with a sampling frequency of 2560 Hz on the 26 belts. This results in a signal composed of 307,200 values for each axis.
In this work, the Fast Fourier Transform (FFT) and the following study by frequency bands have been chosen to generate the data set that will be used for training the Artificial Intelligence technique. After this pre-processing, each resultant signal has a dimension of 262,154 values. Figure 4 shows, as an example, the frequency spectrum after performing the FFT of the vibrations measured on one of the half-used belts along the z-axis.
In this first stage of pre-processing, it has been decided to average over a 1000 Hz wide frequency band. After this, each one of these average values becomes the input to the classifier. Regarding the outputs of the system, they have to indicate the use state of a particular belt, and since in this research three levels of belt deterioration have been studied, the classifier must have three outputs. Due to the design of the methodology used, which will be developed below, binary outputs are implemented. This involves only one output that will be activated, keeping the other two at zero to indicate the label that corresponds to the analyzed signal. Table 2 shows which output of the trained system is activated depending on the corresponding label.
Based on the designed set of input–output data, the classifier is trained. In this research, a three-layer Genetic Neuro-Fuzzy system [21,22,25] has been chosen and it maintains the structure of the ANFIS systems [26,27]. The inputs of the first layer correspond to the inputs of the system. In this work, as it was indicated previously, an analysis has been carried out in the frequency domain by bands, specifically, they have been divided into bands of 1000 Hz, for each axis. This means that for every 1000 values, an average is calculated; therefore, the inputs are composed of the concatenation of domain frequency signals of 262 data for each axis. At this point, it is important to remark that the program has been designed so that each band has the same amount of data. For that reason, the input vector U is composed of an array of 789 values instead of 786, since the last band of each axis had to be completed with an extra value. The output Pij of each neuron of the first layer, expressed in the following equation, is a function of the center of the membership function µij and the width of the membership function ƞij, where N1 represents the total number of inputs and N2 the number of intermediate layer nodes.
P i j = exp U i j μ i j 2 η i j 2 ;   i = 1 , , N 1 ;   j = 1 , , N 2 ,
The second layer outputs ρi correspond to the system rules. This involves that N2 is also indicating the rule numbers.
ρ i = min Ρ 1 j , , Ρ N 1 j ;   j = 1 , , N 2 ,
Finally, the third layer outputs, which are also the system outputs, are obtained from the output estimated values νjk, which are obtained of each node j, with N3 as the number of outputs, in this research is 3, as it can be seen in Table 2.
Ψ k = j = 1 N 2 ν j k ρ j j = 1 N 2 ρ j ;   k = 1 , , N 3
The set of parameters indicated in these equations is established through the two-phase learning algorithm.
In the first phase, the initial values for µij and νjk are obtained from a two-dimensional self-organizing Kohonen map [28], whose inputs are the set of inputs–outputs of the system:
Λ = ( U 1 U N 1 Y 1 Y N 3 )
In this work, the process starts with a 10 × 10 map, that is, initially there are 100 nodes and, therefore, 100 rules. Each node has an associated initial vector of weights, which will be linked to a classification label. Once this unsupervised learning phase is applied, an update of the weight vector is obtained, and values are assigned to µij and νjk.
In the second phase, the Genetic Neuro-Fuzzy (GNF) [21,25,29] is implemented, in order to adjust the parameter set obtained in the previous phase, as well as to reduce the number of nodes in the hidden layer and in the same way, to reduce the number of rules. The genetic algorithm is based on the biological processes of genetic evolution, where the content corresponding to an individual is provided from the basic information, known as a gene. In this work, a vector is established as an individual and its components as genes. Therefore, each individual will be composed of a vector of dimension N1 × N2, the first N2 components being binary values, which will indicate an activation if the associated rule is taken into consideration and 0 if it is rejected. The rest of the components of the vector are associated with the width of the membership function ƞij. Therefore, those that are linked to a node with a value of 0 will not be considered for the calculation of the final result. With this implementation, each individual becomes a possible NFG system and its non-null elements are used in the learning phase. In this way, after this phase, an adjustment of N2 and ƞij is achieved.
With the data measured in the experimental bench, these two phases are applied with different initial configurations in order to train a reliable classifier. In this research, once the FFT has been performed, the vibration signals of each Cartesian axis are divided into bands of 1000 Hz wide and each band is averaged, resulting in 789 data signals. Therefore, the input to the training will be made up of a vector of 789 values. The output of the classifier must indicate the status of the belt based on the associated signal. For this, the system has been designed so that the corresponding output is activated according to the identification label of that input, as it was indicated in Table 2.
Figure 5 a flowchart of the whole process is shown in order to illustrate the different phases.

3. Results

In order to develop this study, 26 belts in different states of use were used; therefore, there were 26 vibration patterns, each one with the signals of the three Cartesian axes. Firstly, the signal processing is conducted to obtain the frequency signature of each vibration measurement, and then they are divided into bands and the average is obtained for each band. In order to check the generalization capacity of the GNF system after training, 25% of the patterns are reserved. This involves that the algorithm has been trained with 75% of the signals, indicating in each case what type of belt each pattern corresponds to. Once the three phases of the algorithm, which have been explained in the previous section, are completed, the classifier is ready. The trained system is now capable of determining the status of the belt from the vibration signals captured by a sensor.
Figure 6 shows the results after the GNF phase. As it can be seen, while the iterations or generations are growing, the average distance between individuals is decreasing, and this involves a reduction in the rule number that is necessary to build the classifier. This can be tested with Figure 7, where the initial 100 rules are reduced to 43 rules that correspond to the nodes marked in red. This figure also shows which input activates each node. If only one input activates a particular node, its number is marked in red but if there is a second input linked to the same node, its number is marked in green and finally, if there is a third input, it is marked in pink.
The confusion matrix is an adequate method for visualizing the learning capacity of an algorithm. This tool shows as many columns as the number of predictions of each class and as many rows as the instances of the real class. With this representation, the successes and the errors that the classifier makes after training can be observed. In this work, there are three values to predict, and therefore, the confusion matrix will have dimension 3 × 3. The diagonal values represent the true positives, that is, those labels that the classifier has identified correctly, while the rest of the elements of the matrix show the erroneous identifications, and depending on the location, it is verified which erroneous label it is. Figure 8 presents the confusion matrix obtained after the training process. As can be seen, label 1 and label 2 have 100% accuracy, whereas label 3, corresponding to close-to-breaking belts, has an accuracy of 88.9% since there was a pattern that the classifier identified as class 2 (half-used belt) and the actual label was 3 (close-to-breaking belt). Green numbers correspond to percentage of right classified samples, whereas red ones correspond to percentage of wrong classified samples.
Figure 9 shows the confusion matrix for the generalization patterns, that is, the introduced signals have not been used for training, and therefore, they are unknown data for the classifier. It can be seen that a satisfactory result has been achieved since the classifier has correctly identified each generalization pattern, which means 100% accuracy for the three classes. Green numbers correspond to percentage of right classified samples, whereas red ones correspond to percentage of wrong classified samples.
The good training results obtained could be indicative of over-fitting; however, the classifier also shows good results when test data are introduced, that is, unknown patterns. In this way, it is possible to affirm that the trained algorithm has achieved an adequate level of generalization, and therefore, an over-fitting problem can be overcome.
Another technique to check the capacity of a classifier is through the ROC curve (acronym for Receiver Operating Characteristic). This is a graphical representation of the proportion of true positives or sensitivity versus the proportion of false positives or 1-specificity, according to the change in the threshold established for determining the classification. As it can be deduced from its definition; it only makes sense for binary classifiers; therefore, it only works to check the effectiveness of detecting a certain label. Consequently, there will be an ROC curve for each class. One of the possible interpretations of the ROC curve is the analysis of the area under the curve, also known as AUC. This value indicates the probability that the classifier correctly identifies the label being analyzed, so the closer this value is to 1, the better the classifier will be, while if it is close to 0.5, it will be the worst configuration since it indicates that it is a random classifier with a 50% probability of success.
An ROC curve has been obtained for each classifier label with its corresponding AUC value. It has been corroborated that the trained system has become a good classifier for the three classes, owing to the fact that the lower obtained AUC value is 0.99772 for the close-to-breaking belt label (Figure 10). The AUC value obtained for class 1 (new belt in Figure 11) and for class 2 (half-used belt in Figure 12) is 1, which means that the trained GNF identifies perfectly both labels; moreover, these results are expected since they are in concordance with their ROC matrixes.
At this point in this research, it is possible to affirm that an adequate classifier has been obtained. However, the use of this kind of method usually has a hidden development since there are phases that are unknown; for that reason, Artificial Neural Networks are said to be black boxes. However, in this research, an in-depth study has been conducted to know how the algorithm works.
Figure 13 shows the influence of each rule for a particular signal corresponding to vibrations from a half-used belt. The level of influence is expressed by a certain percentage. As can be seen, there is a rule with a much higher participation rate than the rest, with 18.2%. Therefore, that node corresponds to the Fuzzy rule with the higher influence for classifying this particular pattern. Below, there are five rules with 4.97%, another with 4.88% and the rest with much lower percentages. Although they participate in the classification, their influence is lower. Therefore, as can be seen in this example, this work allows for knowing the weight that each rule has in the classification of a belt status.

4. Conclusions

In this work, an experimental bench has been built, and it allows for measuring vibrations in the three Cartesian axes. The vibrations in each axis have been recorded for 26 belts with different states of use. The frequency spectrums of these signals have been treated through bands, whose width has been established at 1000 Hz, calculating the average for each one of those bands. Note that the preprocessing used is quite simple compared to other preprocessing algorithms. In fact, it is important to remark that this choice of preprocessing process avoids transforming the raw data, establishing a more direct relationship with the original data. A Genetic Neuro-Fuzzy system has been designed in this research, so that, once it has been trained, the algorithm is capable of classifying the status of the corresponding belt. It is important to point out that a Fuzzy system is built at the end of the process. In this paper, in addition to searching for adequate Fuzzy rules that solve the problem, an in-depth study has been conducted in order to determine which these particular rules are.
Once the Fuzzy rules have been obtained, it is possible to analyze the functioning of the algorithm. Depending on the particular problem, it would be possible to perform a specific resolution by manual adjustment of their provided rules. This could support a better generalization level.
It is necessary to mention that, although this methodology offers great potential, on occasion owing to the high complexity of data, it may not generate the Fuzzy rules. However, in this research, an analysis with respect to the way these rules are obtained has been performed. This means that the developed method is able to test if the complexity is so high that the current configuration of the algorithm is not able to resolve the problem.
The results show that the algorithm is a good classifier, obtaining excellent training results and a very good generalization, reaching satisfactory AUC values, all of which are above 0.99722.
It is important to highlight that this work represents the first step in generating a belt classifier since the aim is to expand the study by dealing with other belts in different states of deterioration.
The designed algorithm is capable of indicating the status of the belt without having to stop the equipment to check its deterioration. This is a great advantage since it would allow machinery to operate for longer, avoiding interruptions in production. Furthermore, it would be possible to prevent failure or breakage if it is detected that a belt is close to breaking. Hence, the maintenance could be carried out at the right time without reducing the lifetime of the belt and without exceeding the limit so that serious failure does not occur. Therefore, the proposed classifier represents an improvement in the predictive maintenance of mechanical transmission mechanisms based on belts.

Author Contributions

Conceptualization, G.N.M. and Á.H.; methodology, G.N.M., D.Á. and Á.H.; software, G.N.M.; validation, G.N.M. and Á.H.; formal analysis, G.N.M., D.Á., J.C.G.-P. and Á.H.; investigation, G.N.M., D.Á., J.C.G.-P. and Á.H.; resources, G.N.M., D.Á., J.C.G.-P. and Á.H.; data curation, G.N.M., D.Á. and Á.H.; writing—original draft preparation, Á.H.; writing—review and editing, G.N.M., D.Á., J.C.G.-P. and Á.H.; visualization, G.N.M., D.Á., J.C.G.-P. and Á.H.; supervision, G.N.M.; project administration, G.N.M.; funding acquisition, G.N.M. All authors have read and agreed to the published version of the manuscript.

Funding

This research was funded by Programa de I+D+I orientada a los retos de la Sociedad, Proyecto Nacional, PID2020-116984RB-C21 and for fondos FEDER, Programa INTERREGMAC 2014-2020 de la Unión Europea, parte del Proyecto E5DES (MAC2/1.1a.309).

Institutional Review Board Statement

Not applicable.

Informed Consent Statement

Not applicable.

Data Availability Statement

The data presented in this study are available on request from the corresponding author. The data are not publicly available due to privacy.

Conflicts of Interest

The authors declare no conflicts of interest. The funders had no role in the design of the study; in the collection, analyses, or interpretation of data; in the writing of the manuscript; or in the decision to publish the results.

References

  1. Cañas, H.; Mula, J.; Díaz-Madroñero, M.; Campuzano-Bolarín, F. Implementing Industry 4.0 principles. Comput. Ind. Eng. 2021, 158, 107379. [Google Scholar] [CrossRef]
  2. Zonta, T.; Da Costa, C.A.; da Rosa Righi, R.; de Lima, M.J.; da Trindade, E.S.; Li, G.P. Predictive maintenance in the Industry 4.0: A systematic literature review. Comput. Ind. Eng. 2020, 150, 106889. [Google Scholar] [CrossRef]
  3. Selcuk, S. Predictive maintenance, its implementation and latest trends. Proc. Inst. Mech. Eng. Part B J. Eng. Manuf. 2016, 231, 1670–1679. [Google Scholar] [CrossRef]
  4. Mafla, C.; Castejon, C.; Rubio, H. Mantenimiento predictivo en tractores agrícolas. Propuesta de metolodogía orientada al mantenimiento conectado. Rev. Iberoam. Ing. 2022, 26, 63–76. [Google Scholar]
  5. Ghobakhloo, M. Industry 4.0, digitization, and opportunities for sustainability. J. Clean. Prod. 2020, 252, 119869. [Google Scholar] [CrossRef]
  6. Carvalho, R.; Nascimento, R.; D’angelo, T.; Delabrida, S.; Bianchi, A.G.C.; Oliveira, R.A.R.; Azpúrua, H.; Garcia, L.G.U. A UAV-Based Framework for Semi-Automated Thermographic Inspection of Belt Conveyors in the Mining Industry. Sensors 2020, 20, 2243. [Google Scholar] [CrossRef] [PubMed]
  7. Zhu, H.; Zhu, W.; Fan, W. Dynamic modeling, simulation and experiment of power transmission belt drives: A systematic review. J. Sound Vib. 2020, 491, 115759. [Google Scholar] [CrossRef]
  8. Pollak, A.; Temich, S.; Ptasiński, W.; Kucharczyk, J.; Gąsiorek, D. Prediction of Belt Drive Faults in Case of Predictive Maintenance in Industry 4.0 Platform. Appl. Sci. 2021, 11, 10307. [Google Scholar] [CrossRef]
  9. Bonci, A.; Longhi, S.; Nabissi, G. Fault Diagnosis in a belt-drive system under non-stationary conditions. An industrial case study. In Proceedings of the IEEE Workshop on Electrical Machines Design, Control and Diagnosis (WEMDCD), Modena, Italy, 8–9 April 2021. [Google Scholar]
  10. Szurgacz, D.; Zhironkin, S.; Vöth, S.; Pokorný, J.; Spearing, A.J.S.; Cehlár, M.; Stempniak, M.; Sobik, L. Thermal Imaging Study to Determine the Operational Condition of a Conveyor Belt Drive System Structure. Energies 2021, 14, 3258. [Google Scholar] [CrossRef]
  11. Liu, X.; Pei, D.; Lodewijks, G.; Zhao, Z.; Mei, J. Acoustic signal based fault detection on belt conveyor idlers using machine learning. Adv. Powder Technol. 2020, 31, 2689–2698. [Google Scholar] [CrossRef]
  12. Popescu, T.D.; Aiordachioaie, D.; Culea-Florescu, A. Basic tools for vibration analysis with applications to predictive maintenance of rotating machines: An overview. Int. J. Adv. Manuf. Technol. 2022, 118, 2883–2899. [Google Scholar] [CrossRef]
  13. DHyun, D.; Kang, T.-J.; Kim, J. Fault Diagnosis of Belt Driving Power Transfer Facility Using Vibration Analysis. J. Electr. Eng. Technol. 2021, 16, 2257–2264. [Google Scholar]
  14. Nabhan, M.; El-Sharkawy, M.R.; Rashed, A. Monitoring of belt-drive defects using the vibration signals and simulation models. In Proceedings of the 20th International Conference on Innovations in Engineering and Technology Research, Roma, Italy, 20 November 2019. [Google Scholar]
  15. Pałczyński, K.; Skibicki, D.; Pejkowski, Ł.; Andrysiak, T. Application of machine learning methods in multiaxial fatigue life prediction. Fatigue Fract. Eng. Mater. Struct. 2023, 46, 416–432. [Google Scholar] [CrossRef]
  16. Chen, J.; Liu, Y. Fatigue modeling using neural networks: A comprehensive review. Fatigue Fract. Eng. Mater. Struct. 2022, 45, 945–979. [Google Scholar] [CrossRef]
  17. Gao, J.; Heng, F.; Yuan, Y.; Liu, Y. A novel machine learning method for multiaxial fatigue life prediction: Improved adaptive neuro-fuzzy inference system. Int. J. Fatigue 2023, 178, 108007. [Google Scholar] [CrossRef]
  18. Abiodun, I.; Jantan, A.; Omolara, A.E.; Dada, K.V.; Mohamed, N.A.; Arshad, H. State-of-the-art in artificial neural network applications: A survey. Heliyon 2018, 4, e00938. [Google Scholar] [CrossRef]
  19. Marichal, G.N.; Del Castillo, M.L.; López, J.; Padrón, I.; Artés, M. Diagnóstico de engranajes en sistemas de propulsión marinos utilizando técnicas ANFIS. Rev. Iberoam. DIng. Mecánica 2016, 20, 37–47. [Google Scholar]
  20. Abdulshahed, A.M.; Longstaff, A.P.; Fletcher, S. The application of ANFIS prediction models for thermal error compensation on CNC machine tools. Appl. Soft Comput. 2015, 27, 158–168. [Google Scholar] [CrossRef]
  21. Cordón, O.; Herrera, F.; Gomide, F.; Hoffmann, F.; Magdalena, L. Ten years of genetic fuzzy systems: Current framework and new trends. In Proceedings of the Joint 9th IFSA World Congress and 20th NAFIPS International Conference (Cat. No. 01TH8569), Vancouver, BC, Canada, 25–28 July 2001. [Google Scholar]
  22. Marichal, G.; Ávila, D.; Hernández, A.; Padrón, I.; Castejón, C. Feature Extraction from Indirect Monitoring in Marine Oil Separation Systems. Sensors 2018, 18, 3159. [Google Scholar] [CrossRef]
  23. Khalid, H.M.; Khoukhi, A.; Al-Sunni, F.M. Fault Detection and Classification Using Kalman Filter and Genetic Neuro; IEEE: Piscataway, NJ, USA, 2011. [Google Scholar]
  24. Akpofure, N. A neuro-genetic fuzzy system for the prediction of student’s academic performance. Asian J. Multidimens. Res. 2022, 11, 214–232. [Google Scholar]
  25. Nobre, F. Genetic-neuro-fuzzy systems: A promising fusion. In Proceedings of the IEEE International Conference Fuzzy Systems, Yokohama, Japan, 20–24 March 1995. [Google Scholar]
  26. Marichal, G.; Acosta, L.; Moreno, L.; Méndez, J.; Rodrigo, J.; Sigut, M. Obstacle avoidance for a mobile robot: A neuro-fuzzy approach. Fuzzy Sets Syst. 2001, 124, 171–179. [Google Scholar] [CrossRef]
  27. Jang, J. ANFIS: Adaptive-network-based fuzzy inference system. IEEE Trans. Syst. Man Cybern. 1993, 23, 665–685. [Google Scholar] [CrossRef]
  28. Kohonen, T. The Self-Organizing Map; IEEE: Piscataway, NJ, USA, 1990. [Google Scholar]
  29. Rajasekaran, S.; Pai, G. Neural Networks, Fuzzy Logic and Genetic Algorithm: Synthesis and Applications; PHI Learning Pvt. Ltd.: Delhi, India, 2003. [Google Scholar]
Figure 1. Final assembly of the triaxial accelerometer (Brüel & Kjaer 4504A).
Applsci 14 01831 g001
Figure 2. Block diagram of collecting data.
Applsci 14 01831 g002
Figure 3. Final assembly of the experimental bench.
Applsci 14 01831 g003
Figure 4. FFT spectrum of a signal vibration measured along the z-axis for a half-used belt.
Applsci 14 01831 g004
Figure 5. Flowchart of the process.
Applsci 14 01831 g005
Figure 6. Evolution of average distance between individuals in Genetic algorithm phase.
Applsci 14 01831 g006
Figure 7. Rules activation network after the genetic algorithm phase.
Applsci 14 01831 g007
Figure 8. Confusion matrix with training patterns.
Applsci 14 01831 g008
Figure 9. Confusion matrix with generalization patterns.
Applsci 14 01831 g009
Figure 10. ROC curve and area under the curve for determination of close-to-breaking belts class.
Applsci 14 01831 g010
Figure 11. ROC curve and area under the curve for determination of new belts class.
Applsci 14 01831 g011
Figure 12. ROC curve and area under the curve for determination of half-used belts class.
Applsci 14 01831 g012
Figure 13. Nodes activations for a half-used belt label.
Applsci 14 01831 g013
Table 1. Technical characteristics of the electric motor.
CharacteristicsValue
Power350 W
Voltage230 V
Amperage1.5 A
Electrical current frequency50 Hz
Speed, synchronous (50 Hz)1420 RPM
Table 2. Output activation and label belt.
Number of Classifier Output
123
New belt100
Half-used belt010
Close-to-breaking belt001
Disclaimer/Publisher’s Note: The statements, opinions and data contained in all publications are solely those of the individual author(s) and contributor(s) and not of MDPI and/or the editor(s). MDPI and/or the editor(s) disclaim responsibility for any injury to people or property resulting from any ideas, methods, instructions or products referred to in the content.

