Article

Effect of a Crystalline Admixture on the Permeability Properties of Concrete and the Resistance to Corrosion of Embedded Steel

1
Department of Marine Science and Applied Biology, University of Alicante, P.O. Box 99, 03080 Alicante, Spain
2
Department of Civil Engineering, University of Alicante, P.O. Box 99, 03080 Alicante, Spain
3
AG Corrosión, 03006 Alicante, Spain
*
Author to whom correspondence should be addressed.
Appl. Sci. 2024, 14(5), 1731; https://doi.org/10.3390/app14051731
Submission received: 28 December 2023 / Revised: 29 January 2024 / Accepted: 12 February 2024 / Published: 21 February 2024

Abstract

:
Reinforced concrete structure durability hinges on concrete permeability, which relies on the characteristics of the inner porous network. Harmful ions and gases can accelerate steel corrosion. Permeability-reducing admixtures (PRA), including crystalline admixtures (CA), are commonly used to mitigate this. This study examines a commercial CA’s impact on durability-related aspects in concrete specimens. Two concrete mixtures with matching proportions were prepared: a reference mix and another mix with a commercial crystalline admixture. Several properties were studied, such as compressive strength, density, porosity, electrical resistivity, water absorption capacity, chloride diffusion, air permeability, and corrosion resistance. The studied admixture in concrete yields several positive outcomes such as a slight reduction in mixing water, a potential 6% increase in concrete’s compressive strength and the development of a denser and less permeable structure with 3% lower porosity and water absorption than the reference mix. Electrical resistivity improves by 10%. Unidirectional chloride diffusion tests show no differences. Air permeability decreases by from 36% to 55%, and the water absorption rate diminishes by 23%. The admixture potentially reduces the scatter in corrosion initiation periods for steel reinforcements, delaying corrosion onset by around 60 days, although more extensive experiments are needed for definitive conclusions.

1. Introduction

The durability of reinforced concrete structures is highly related to the permeability properties of concrete, with the concrete cover over the steel reinforcement being the most critical zone in this regard [1]. The permeability properties depend mainly on the characteristics of the inner porous network of concrete (porosity, connectivity of the pores, and pore size distribution). The concrete cover can be permeated by water or aqueous solutions containing harmful ions, such as chloride (Cl) ions, or by gaseous substances such as oxygen (O2) or carbon dioxide (CO2) from the atmosphere [2]. All these transport processes have a marked influence on steel reinforcement corrosion in concrete. Both the contamination of concrete by Cl ions and the carbonation of the concrete cover due to CO2 are known to be circumstances leading to the onset of steel corrosion [3]. Later, the intensity of the process (corrosion rate) is highly dependent on the moisture of concrete and on the chloride content. The availability of O2 at the steel–concrete interface, mainly determined by the gas permeability of the concrete cover, may also play a significant role on the steel corrosion rate in certain cases or stages of the corrosion process [4,5].
One of the most popular strategies to avoid durability problems of reinforced concrete structures is the use of permeability-reducing admixtures (PRAs) [6]. These products are classified as admixtures able to reduce the water permeability of concrete under nonhydrostatic conditions (PRAN), and those that can also function under hydrostatic pressures (PRAH) [7]. These products can be used as surface treatments of concrete structures, under the form of coatings [8], or as additives incorporated to the concrete mix in order to obtain integral waterproof concrete [9].
Crystalline admixtures (CA) are products with a twofold effect: reducing the permeability of concrete and self-healing cracks [10]. CAs are composed of particles of different size and chemical compositions, including cement, fillers, pozzolans, slags, sands and “active chemicals” [10]. Most CAs are commercial products containing proprietary constituents and their formulations are kept confidential. It is important to consider that the constituents and chemical compositions of different CAs may be quite diverse; hence, different behaviors and properties can be found in practice. Certain components of CA show high hydrophilic character, they can react in presence of water to form insoluble pore/crack blocking precipitates [7], which contribute to reducing the permeability of concrete and provide some ability to self-seal cracks [10]. It is also possible that in some cases the newly formed precipitates can react with the surrounding products of cement hydration [11].
In this work, we will focus on the effects of using a commercial CA as an integral PRA for a conventional Portland cement concrete on several selected durability-related properties. There is a general consensus on the ability of CAs to significantly reduce the permeability of concrete and other cement-based materials to water under pressure [11,12,13,14]. There is also some evidence that CAs can increase the resistance of concrete to water capillary absorption [15]. Hence, it seems that CAs can be considered as PRAH and PRAN [16]. Regarding the resistance of concrete to Cl ion penetration, the reported results seem to be inconclusive: some authors found that the incorporation of an admixture characterized by crystallization activity had no detectable effect on the Cl diffusion coefficient (natural diffusion test) of a Portland cement concrete incorporating fly ash [17], while other researchers detected some reduction in the Cl diffusion coefficient (natural diffusion through ponding test) when incorporating a CA to a Portland cement and a Portland–Limestone cement [14]. In this latter case, the intensity of the effect seemed to be somewhat dependent on the length of the water curing period [14]. However, the same authors found that the difference in total charge passed (coulombs) in the rapid chloride permeability (RCP) test [18] between concrete mixes with and without CA was inconsistent [14]. Recently, a study [19] has reported a reduction in the Cl diffusion coefficient (obtained through a Cl migration test [20]) when incorporating a CA to two concretes prepared with a CEM II-type cement [21].
Very few publications [16,19] have addressed the effect of CA on the corrosion of steel reinforcement embedded in concrete. Both mentioned articles have concluded that the incorporation of CAs to reinforced concrete specimens can delay the onset of the steel corrosion [16,19].
The objective of this work is to perform a preliminary study of the effect of a commercial CA on selected durability-related properties of reinforced Portland cement concrete: some parameters related to the micro-structure (permeable porosity and electrical resistivity of water-saturated specimens) and some key mass transport parameters (Cl diffusion coefficient obtained through a natural diffusion test procedure, water absorption coefficient through Karsten’s test [22], and air permeability of concrete through Torrent’s test [23]). Finally, some preliminary tests have been performed on the corrosion of embedded steel into concrete specimens containing the CA. The corrosion behavior has been assessed through classical non-destructive electrochemical techniques. The same CA has been previously found to provide concrete with considerable resistance to water penetration under pressure [11] and to capillarity water absorption [24]. Although an air permeability test has been used before to assess the ability of concrete mixes (containing several additives including a commercial CA) to self-healing pre-cracked specimens [25], to the best of the authors’ knowledge, no previous publication has studied the effect of an integral CA on the air permeability of bulk uncracked concrete. Hence, this study might be the first to address the CA-mediated possible reduction in the air permeability of concrete, which can play a role on determining the corrosion rate of steel reinforcement. It can be also an important property to be considered in certain applications such are concrete enclosures of nuclear facilities or underground concrete walls in contact with the terrain, which can be susceptible to be permeated by radioactive radon gas.

2. Materials and Methods

2.1. Concretes Tested

Two mixtures of concrete were prepared: a reference one denoted by C and another one denoted by C*, incorporating a commercial crystalline admixture CCADM (generic acronym not corresponding to the commercial name of the product). The mix design criteria were the following: both mixes should have compositions and consistencies as similar as possible, and the use of other additives (different from CCADM) should be avoided. Table 1 shows the compositions and consistencies of both concretes. A Portland cement with additions (CEM II 42.5R [26]) was used together with local limestone sand and aggregates. For this preliminary study, the CCADM admixture dosage was set at 0.29% relative to cement mass. The water/cement (w/c) ratio of concrete C was 0.60 for a plastic consistency of 4.0 cm (Abrams cone setting [27]), while the (w/c) ratio for C* concrete was slightly lowered to a value of 0.57 in order to attain practically the same consistency. Different types of specimens, including some steel-reinforced samples, were prepared for the different tests to be performed (their shapes and sizes are described in the following Sections). All the specimens were cured over 75 days in a humid chamber at 90% RH and 23 °C, except the specimens intended for the compressive strength test, whose curing time was only 28 days in the same humid chamber. After these curing steps, each specimen was preconditioned, kept, and tested following the experimental conditions prescribed in the corresponding testing procedure.

2.2. Compressive Strength

Compressive strength tests were performed after 28 days curing according to standard UNE-EN 12390-3 [28]. Three cubic samples of 150 mm side length were used for each concrete type.

2.3. Density, Porosity, and Water Absorption

Density, absorption coefficient, and porosity accessible to water were determined according to standard ASTM-C642 [29]. They were determined after 75 days curing using broken pieces of concrete of at least 350 cm3 volume. Three pieces were used for each type of concrete.

2.4. Electrical Resistivity

The non-destructive measurement of the bulk electrical resistivity ( ρ ) of concrete in water saturated conditions was used as an indirect assessment of the evolution of the microstructure of both concrete mixes. After the 75-day curing step, three cylinders (10 cm diameter by 5 cm length) of each concrete mix (C and C*) were water saturated under vacuum [30] and later kept permanently immersed under tap water. The measurements were performed in saturated surface-dry condition just after vacuum saturation of the samples and after 7, 14, 28, 56, and 84 days of water immersion of the specimens. An EG&G INSTRUMENTS Model 362 potentiostat (Princeton Applied Research, Oak Ridge, TN, USA), with an ohmic drop compensation system, was used for determining the values of ρ [31].

2.5. Water Absorption Karsten Test

The Karsten tube test has been widely used to measure the water absorption characteristics of porous construction materials (mainly façade building materials), and to assess the effectiveness of water-repellent treatments [22]. Two main advantages of the test are its non-destructive character and the possibility of on-site determinations. It may be considered as representative of situations where the construction materials are subject to the action of wind-driven rain. However, in the case of materials with small pores, the test is mainly representative of capillary transport [22]. The test has also been used successfully for assessing the efficacy of surface hydrophobic agents in reducing the water penetration in concrete [32]. In the same work, it was demonstrated that the results of the Karsten tube and those of the classical water capillary absorption test presented a satisfactory correlation [32]. The test has been performed in this work on three samples of each concrete mix (C and C*). The specimens were concrete parallelepipeds of dimensions 170 mm × 170 mm × 80 mm, which, after the 75 days curing step, were kept under laboratory atmospheric condition (approximately 50% RH and 25 °C). Two testing campaigns were performed: at 14 days and 105 days after the end of the curing period.

2.6. Unidirectional Chloride Diffusion Test

Unidirectional chloride diffusion tests were performed according to the European standard EN 12390-11:2015 [33]. The ponding method was used. Three specimens (cylinders of 10 cm diameter by 5 cm length) were tested for each concrete mix (C and C*). The concrete samples were first water saturated under vacuum according to standard ASTM C1202-97 [18]. Then, all surfaces of the sample, except one of the cylinder bases, were sealed with hot paraffin, and a pond was attached to the test surface. The pond was filled with a 3% in mass NaCl aqueous solution and sealed with polyethylene. The whole system was wrapped in polyethylene. After 90 days of exposure to the NaCl solution, the pond was removed, and powder concrete samples were obtained from the exposed surface inwards in layers of 2 mm thickness through a grinding process [34]. Finally, the Cl content of the powder concrete samples was determined by potentiometric titration with a 0.01 M AgNO3 solution [35,36]. The Cl content values were expressed as % in mass of concrete.

2.7. Air Permeability Torrent Test

The air permeability of both concrete mixes (C and C*) was determined using the Torrent Permeability Test procedure, which yields values of the so-called Torrent’s air permeability coefficient ( k T ) [23]. Two main advantages of the test are its non-destructive character and the possibility of on-site determinations. Furthermore, it has been demonstrated [37] that the results of measurements of k T on concrete samples prepared with different cement types and different water/cement ratios, show an excellent correlation with the results of a reference method (oxygen permeability through the RILEM Cembureau Method [38]). Three samples were tested for each concrete mix. The specimens were concrete parallelepipeds of dimensions 170 mm × 170 mm × 80 mm, which, after the 75-day curing step, were kept under laboratory atmospheric conditions (approximately 50% RH and 25 °C). Four testing campaigns were performed at 7, 14, 28, and 56 days after the end of the curing period. Since the concrete’s permeability to gases is strongly dependent on the water saturation of the samples, it is necessary to make parallel measurements of the electrical resistivity of the specimens. In this case, it was performed by measuring the surface resistivity ( ρ s ) by means of a Wenner probe tester [39].

2.8. Rebar Corrosion Resistance Accelerated Test

Three samples were casted for each concrete type (C and C*). The reinforced concrete specimens had dimensions of 180 mm × 180 mm × 80 mm with an embedded 12 mm diameter corrugated steel rebar located at 20 mm (cover depth from surface), see Figure 1. The ends of the steel rebars were sealed with insulating tape in order to obtain an exposed to corrosion rebar length of 14 cm. The test specimens were cured in the humid chamber (90% RH and 23 °C) over 75 days. After curing, a PVC pool was attached to the top of each specimen in order to allow ponding with water and a NaCl solution, as shown in Figure 1.
It is known that it may take long to start the corrosion of steel bars embedded in concrete [1,2,3,4]. For this reason, it was decided to perform an accelerated corrosion test based on wetting–drying cycles coupled with the periodic surface application of a certain amount of a 0.5 M NaCl aqueous solution in order to emulate environmental conditions similar to those that may be found in the marine tidal and splash exposure classes of marine constructions (XS3 exposure class according to the Spanish Structural Code [40]). Non-destructive electrochemical measurements were performed during the test in order to detect the onset of the steel corrosion and to monitor the intensity of the process. The portable GECOR 6 equipment (GEOCISA, Madrid, Spain) was used to measure the potential corrosion E c o r r , the concrete resistivity ρ , and the corrosion rate I c o r r . A Cu/CuSO4 (saturated) reference electrode was used. The electrochemical measurements require a wet, but not saturated, state of the concrete. In order to meet this requirement, the testing surface was sprayed with tap water 15 min before taking the readings. The test procedure was as follows: in the first phase, the pond was filled with tap water for 14 days. This was performed to check the initial corrosion state. In the second phase, the pool was kept empty for 7 days. This is a drying stage of the specimens previous to the next phase. In the third and last phase, the wetting–drying cycles were applied with periodic surface application of a certain amount of a 0.5 M NaCl solution. See Figure 1 and Table 2 for details of the cycles, whose duration was of four or five days. The electrochemical measurements were taken with an approximate weekly periodicity during the whole accelerated corrosion test, which lasted about 36 weeks.

3. Results and Discussion

3.1. Compressive Strength

Compressive strength results at 28 days age for both concretes are shown in Table 3. An increase of about 6% is observed on concrete compressive strength when the admixture is used. This means that the presence of CCADM does not reduce the compressive strength of the concrete for the same consistency. This, together to the fact that the incorporation of CCADM, at the dosage rate recommended by the manufacturer, does not hinder the workability of the concrete mix (see Table 1 and Section 2.1), seems to indicate that the use of the admixture does not negatively affect some of the main technological properties of concrete. Hence, more research would be advisable to test comprehensively the influence of the admixture on the technological properties of concrete.

3.2. Density, Porosity, and Water Absorption

Results from the ASTM-C642 test are shown in Table 4 for both concretes. While the density is almost unaffected by the presence of CCADM, a slight decrease of about 3% is observed for water absorption and porosity when the admixture is used. These results show that the admixture has a certain capacity of producing a somewhat more closed porous structure of concrete, thus reducing the permeability to fluids and external aggressive substances.

3.3. Electrical Resistivity

The evolutions of the bulk electrical resistivity ( ρ ) values of saturated specimens of both concretes (C and C*) are shown in Figure 2. Mean values along with the corresponding error bars are shown. Electrical resistivity is an indicator of reinforced concrete durability [41], especially regarding rebar corrosion susceptibility [42]: the higher the resistivity, the lower the rebar corrosion susceptibility. Figure 2 shows that resistivity values are similar for both concretes up to 14 days. From 28 days onward, concrete C* shows values about 10% higher than concrete C. This shows, in qualitative agreement with results in Section 3.2, the ability of the admixture to create a more closed porous network, as compared to concrete C, which most probably will reduce the permeability of the concrete C*. However, quantitatively, the effect seems to be more pronounced in Figure 2 than what can be expected from the different values of permeable porosity shown in Table 4. The explanation can be traced to the different conditions in the experimental procedures (see Section 2.3 and Section 2.4). While the specimens used for the porosity measurement were cured in a humid chamber (no permanent contact with liquid water) and immediately tested, the specimens for the ρ measurements were water saturated in vacuum after the same curing step, and later kept immersed in tap water. This points to a possible important effect of the curing and service conditions of concrete, being most probably the permanent contact with liquid water the more favored condition for developing the permeability properties of concrete incorporating an admixture of type CCADM. A careful examination of Figure 2 shows that the differences in ρ of both concretes are apparent only after 14 days of water immersion.

3.4. Water Absorption Karsten Test

Figure 3a,b show the evolutions of the amounts of absorbed water during the Karsten tests. Mean values corresponding to the three specimens tested for each concrete type along with the corresponding error bars are shown. As a representative parameter of the behavior of the concretes under study it has been chosen the so-called water absorption coefficient ( W A C ) [22], expressed here in the units of kg m 2 · min , and calculated as the mean absorption rate during the first 150 min of the test [32]. Table 5 shows the values of this mean absorption rate ( W A C 150 ) for both concretes. It is apparent from Figure 3a that the water absorption behavior of both concretes is practically equal at 14 days after the end of the curing period. On the other hand, at 105 days after the end of the curing period, the concrete C* shows a lower water absorption rate, as compared to C (Figure 3b), which is quantified as a reduction in W A C 150 of 23%, see Table 5. These results can be compared to those obtained in previous researches [15], where it was shown that the incorporation of different CA materials to Portland cement concretes lead to a significant reduction in the water sorptivity, which can be 50% lower than that of the control mix. The reductions were dependent on the (w/c) ratio, being higher for a high w/c value of 0.60 than for low w/c values of about 0.39 and on the length of the curing period, being higher the longer was the curing [15]. The quantitative discrepancy of results of this work to previous results can be understood by considering the different curing procedures: humid chamber (no permanent contact with liquid water) in this work, and permanent water curing in the previous work [15]. This points again to a possible important effect of the curing and service conditions of concrete on the efficacy of crystalline admixtures in reducing the permeability of concrete, see Section 3.3.

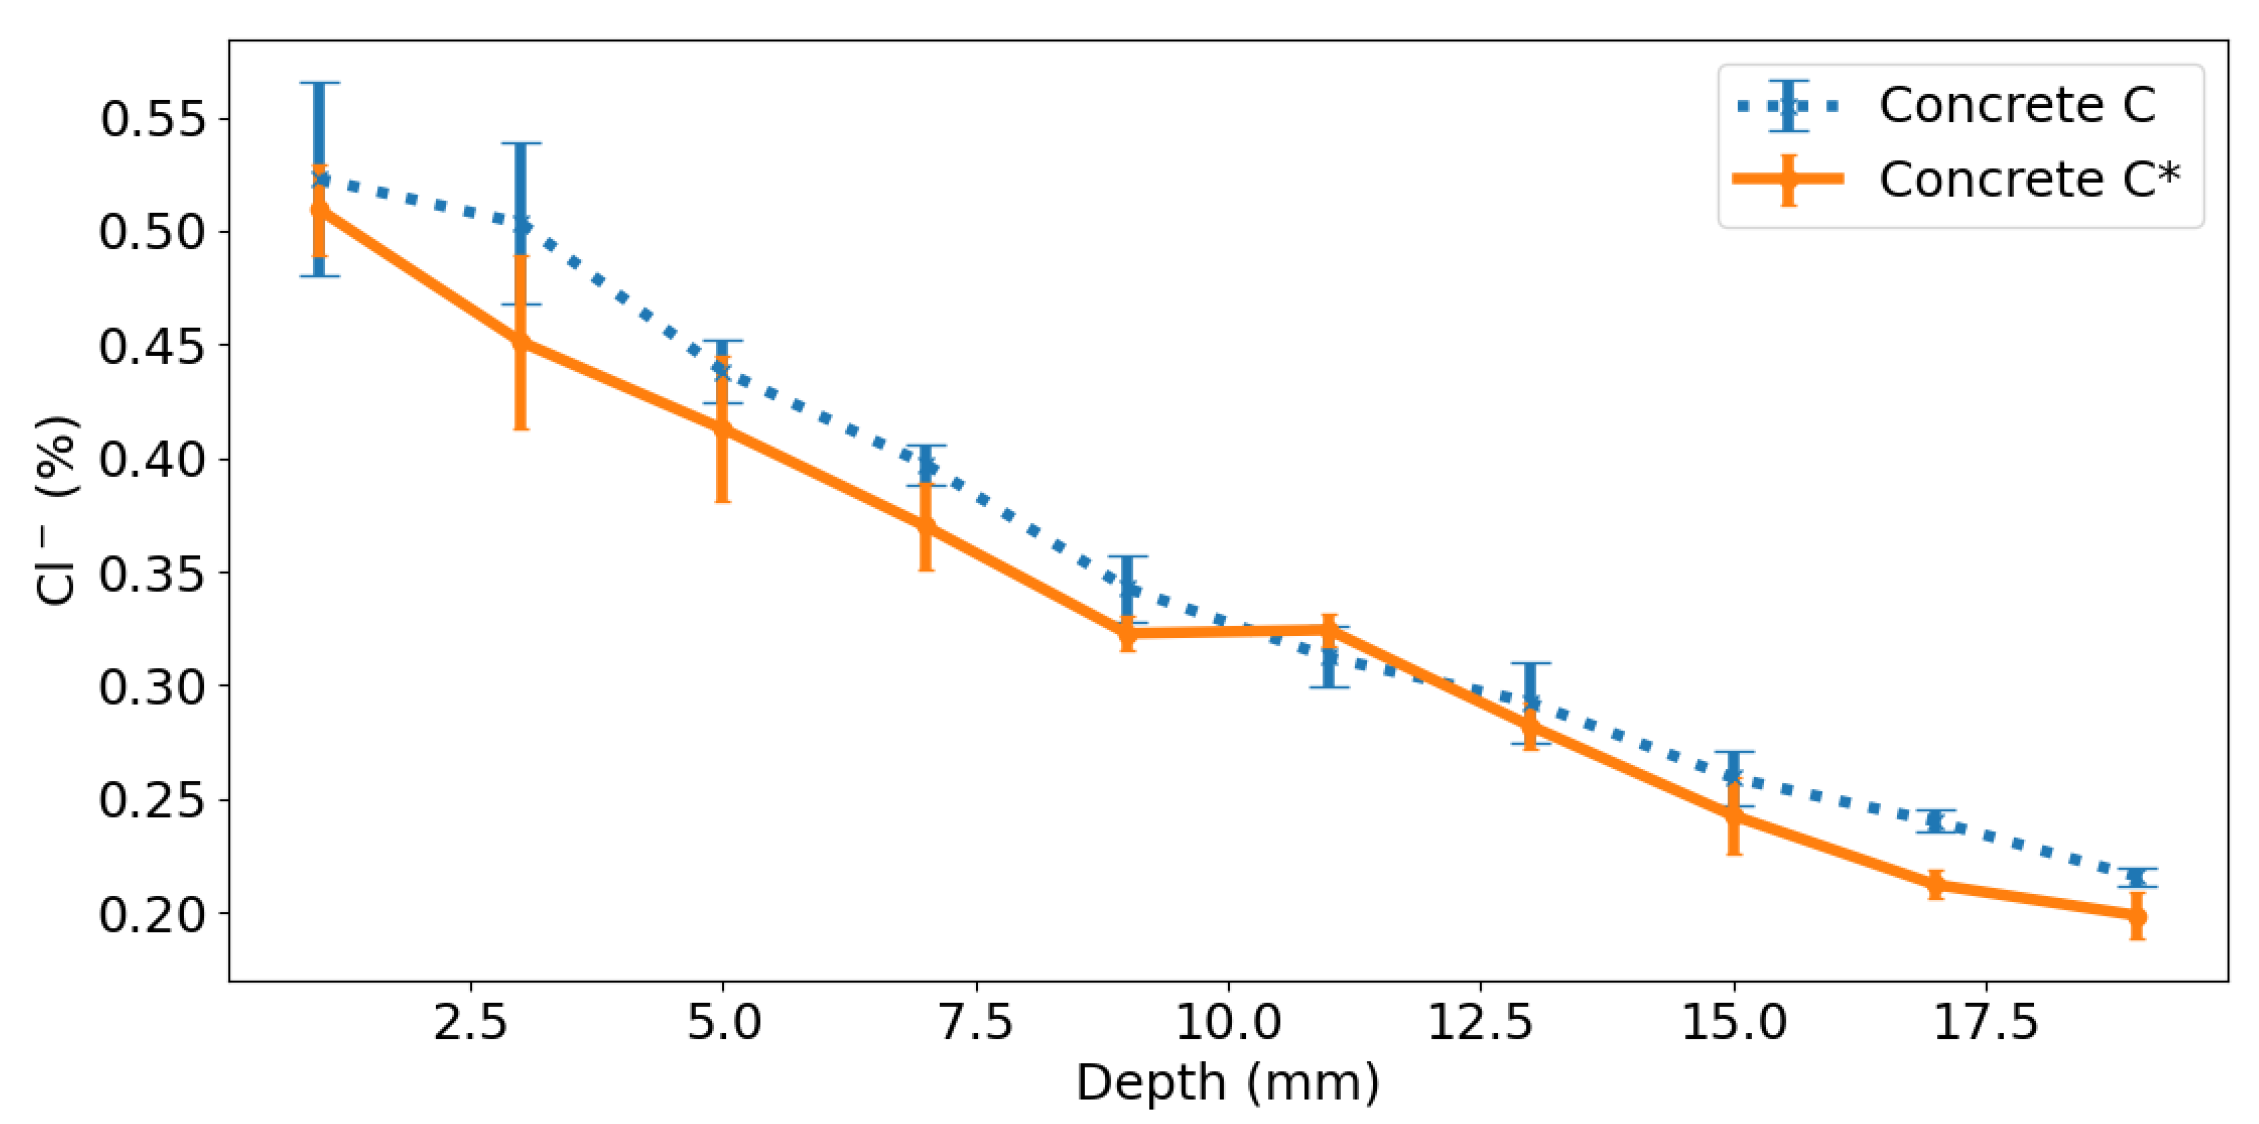
3.5. Unidirectional Chloride Diffusion Test

The obtained chloride content profiles after 90 days of unidirectional Cl diffusion are shown in Figure 4. Mean values of the determined Cl contents (three specimens tested for each concrete mix) along with the corresponding deviation bars are depicted in Figure 4.
The obtained Cl content profiles are fitted to Fick’s second law of diffusion [33].
C ( x , t ) = C S erfc x 2 D n s s t
where C ( x , t ) ( % ) is the chloride concentration as a function of depth x (m) and time t (s), erfc ( x ) = 1 2 π 0 x e u 2 d u is the complement of the error function, and the fitted parameters are the surface chloride concentration C S (%) and the non-steady state diffusion coefficient D n s s (m2/s). The obtained fitted parameters are shown in Table 6.
The mean chloride profiles of Figure 4, and also the values of their fitted parameters (Table 6), are very close for both concretes. This means that the presence of the admixture does not affect the chloride ingress by diffusion in the experimental conditions of this work. This result is in good agreement with findings of previous works [17].

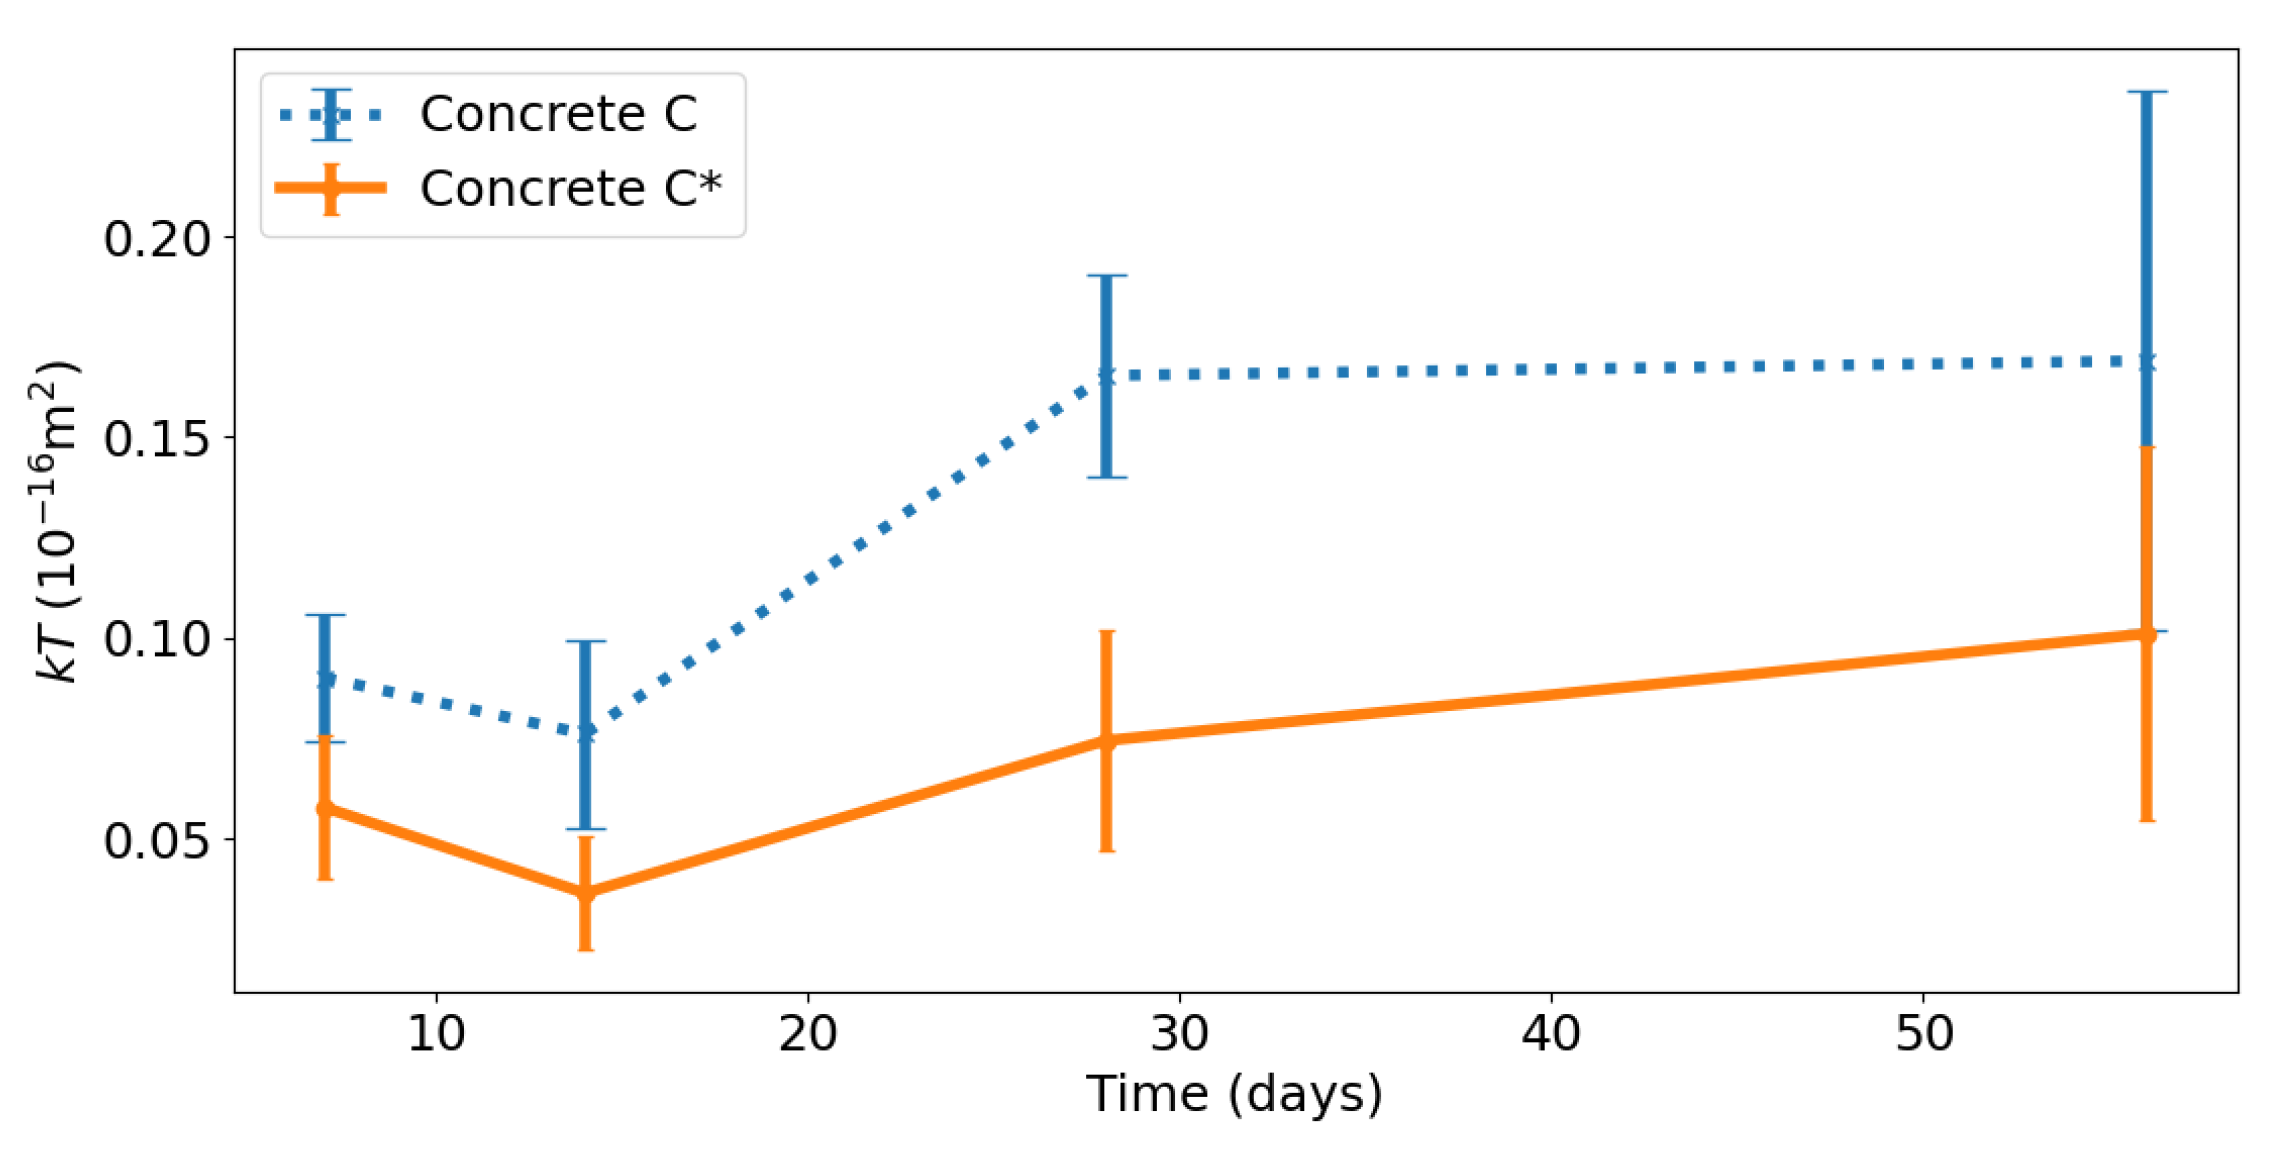
3.6. Air Permeability Torrent Test

The evolutions of the mean values of the air permeability coefficient k T and the surface electrical resistivity ρ s are shown in Figure 5 and Figure 6, respectively. The figures incorporate the corresponding dispersion bars. According to Figure 5, the concrete C* achieved a considerable reduction in the values of k T in comparison to the reference concrete C. These reductions were in the range 36–55%, thus indicating a better performance of C* regarding gas permeability.
At first glance, it would be possible to consider the results of Figure 6 to be in contradiction with those of Figure 2: in Figure 6 the concrete C specimens show higher electrical resistivity than those of concrete C*, while the opposite is observed in Figure 2. However, it should be considered that the bulk resistivity measurements of Figure 2 were performed under conditions of full water saturation of the pore network of concrete, while the surface resistivity measurements of Figure 6 were performed in a drying environment (exposure to the lab atmosphere), see Section 2.4 and Section 2.7. The permanent exposure to liquid water allows the concrete C* specimens to develop a more closed pore network, as compared to the concrete C, due to the hydrophilic character of the admixture, thus leading to higher values of ρ in Figure 2. On the other hand, the results of Figure 6 seem to indicate that the drying process of the concrete C specimens is quicker than that of the concrete C* specimens, most probably due also to a more open pore network of C in comparison to C*.
The quality of a concrete with respect to its permeability to gases can be established according to Table 7 if the resistivity is high enough, or according to nomogram of Figure 7 in any case [23]. The values of k T and ρ s have been plotted in the nomogram of Figure 7, showing that these criteria allow classifying the concrete C* with admixture as a good quality one while the reference concrete C would be classified as a normal quality one.

3.7. Rebar Corrosion Resistance Accelerated Test

Figure 8a,b show the evolutions of concrete resistivity ( ρ ) during the corrosion tests of the reinforced specimens of concretes C and C*, respectively. Figure 9 contains the evolutions of the mean values of ρ for both types of concrete. The graphs contain two vertical lines at 14 and 21 days, which indicate the end of the first phase of the corrosion experiments (permanent ponding with tap water) and the end of the second phase (drying period of 7 days), respectively. At 21 days from the beginning of the tests, the final phase began, consisting of wetting–drying cycles with periodic surface application of an amount of NaCl aqueous solution (see Section 2.8).
It is apparent from Figure 9 that both types of concrete show no significant differences regarding the electrical resistivity, except during approximately the first 30 days (see Figure 9). In this initial period the reinforced specimens of C* show higher ρ values than the corresponding specimens of C. This finding is in line with the behaviors shown in Figure 2. Considering that during the first 14 days of the corrosion tests the specimens are subject to a permanent ponding with tap water, it is likely that the presence of the hydrophilic admixture CCADM in the C* specimens might give rise to a more closed and hence less permeable pore network, as compared to the C specimens.
Figure 10a,b show the evolutions of steel corrosion potential ( E c o r r ) during the corrosion tests of the reinforced specimens of concretes C and C*, respectively. Figure 11 contains the evolutions of the mean values of E c o r r for both types of concrete. The potentials are measured against a saturated Cu/CuSO4 reference electrode. The graphs contain three horizontal lines at −200, −350, and −500 mV, which indicate the accepted limits separating the domains of low, intermediate, and high risk of corrosion, according to ASTM C876-22B [43], see Table 8.
A sharp decrease of E c o r r , below the −200 mV limit, is normally considered as indicative of the depassivation of steel, i.e., the breakdown of the passivating layer on steel reinforcement embedded in concrete [3,4]. Figure 10a shows a high scatter for the time of this depassivation event in the cases of concrete C, with 170, 150, and 90 days for samples C1, C2, and C3, respectively. The scattering in the depassivation time is much lower for concrete C* (Figure 10b), where the observed range is from 150 to 170 days. With the available data, it is not possible to explain the scattering observed in the depassivation times of the concrete C specimens. However, it should be considered that corrosion is always a complex stochastic process, for which it is frequent to find a considerable scattering.
Figure 12a,b show the evolutions of steel corrosion rate ( I c o r r ) during the corrosion tests of the reinforced specimens of concretes C and C*, respectively. Figure 13 contains the evolutions of the mean values of I c o r r for both types of concrete. The corrosion rate is expressed in electrochemical units, i.e., μ A/cm2. I c o r r is a kinetic parameter related with the actual intensity of the corrosion process. The values accepted in the literature [44,45] for its interpretation are shown in Table 9. The graphs contain three horizontal lines at 0.1, 0.5, and 1 μ A/cm2 which indicate the accepted limits separating the domains of negligible, low, intermediate, and high corrosion rate [44,45], see Table 9.
The increase in I c o r r at values higher than 0.1–0.2 μ A/cm2 is usually taken as indicative of the irreversible onset of the corrosion process of steel reinforcement in concrete [44,45]. This usually happens when the steel rebar depassivates or some days after. It is worth noting that this behavior is observed when the evolutions of E c o r r (Figure 10 and Figure 11) are compared with the evolutions of I c o r r (Figure 12 and Figure 13). In the case of concrete C, the depassivation (drop in E c o r r values) happened at 170, 150, and 90 days for samples C1, C2, and C3 respectively, while the corresponding corrosion initiation times (rise in I c o r r values) were at 180, 150, and 110 days, respectively. In the case of concrete C*, the depassivation took place in the range from 150 to 170 days, and the corresponding corrosion initiation times spanned in the same range. The comparison of the I c o r r mean values of both concretes in Figure 13 seems to show that the presence of the admixture could increase the corrosion initiation time from about 110 to 170 days, but this conclusion is not definitive due to the high scatter observed in the case of the concrete C specimens. The obtained results of electrochemical measurements seem to indicate that the presence of the admixture CCADM in concrete could reduce the scattering of the corrosion initiation period and could delay the corrosion initiation (from 110 to 170 days, according to Figure 13), in the experimental conditions of this work. This outcome is in fairly good agreement with findings of previous works [16,19]. However, the small number of tested specimens (from a statistical point of view) does not allow for unequivocal acceptance of this conclusion. More experiments would be necessary, with a greater number of specimens and a longer duration of the tests, to be able to carefully evaluate the effect of the incorporation of the admixture on the corrosion processes of steel reinforcement in concrete.

4. Conclusions

According to the results obtained in this study, the following conclusions can be drawn about the use of the studied admixture in concrete:
  • The incorporation of the admixture to the concrete allows the amount of mixing water to be slightly reduced for the same consistency. This makes it possible to improve the durability properties of the material or reduce the amount of plasticizing additive to be used in mixing (for the same consistency).
  • The incorporation of the admixture is not detrimental regarding the compressive strength of Portland cement concrete.
  • The admixture allows the generation of a more closed porous structure, and therefore less permeable, in Portland cement concrete. The reduction in porosity and water absorption is quantified at approximately 3% compared to a reference concrete.
  • Portland cement concrete incorporating the admixture shows electrical resistivity values (in water saturated state of the pore network) that are approximately 10% higher than those of the reference concrete. This reflects a greater capacity to reduce porosity and permeability, especially in conditions close to water saturation of the pore network.
  • Portland cement concrete incorporating the admixture has shown a slight reduction in the water absorption coefficient (water absorption test by Karsten’s method) in comparison to the reference concrete. This reduction is quantified at a value of 23% in the experimental conditions of this work.
  • The unidirectional chloride diffusion tests have not revealed differences in behavior, in terms of resistance to chloride penetration by diffusion, between a concrete incorporating the admixture and a reference concrete.
  • The incorporation of the admixture to Portland cement concrete has led to a considerable reduction in the air permeability coefficient (Torrent test) compared to a reference concrete. This reduction is quantified between 36% and 55%.
  • The incorporation of the admixture can reduce the scatter in the corrosion initiation times of the steel reinforcements and could have an effect of delaying the onset of their corrosion, with respect to a reference concrete. Under the test conditions of the present research, the delay in corrosion onset times could translate into an increase from about 110 days to about 170 days. However, more experiments would be necessary, with a greater number of specimens and a longer duration of the tests, to be able to carefully evaluate the effect of the incorporation of the admixture on the corrosion processes of steel reinforcement in concrete.

Author Contributions

Conceptualization, M.-Á.C.; methodology, C.A., H.G. and M.-Á.C.; software, G.d.V.; validation, C.A., H.G., and M.-Á.C.; formal analysis, C.A., G.d.V. and M.-Á.C.; investigation, C.A. and H.G.; resources, C.A. and M.-Á.C.; data curation, C.A., H.G. and G.d.V.; writing—original draft preparation, C.A., H.G. and G.d.V.; writing—review and editing, C.A., G.d.V. and M.-Á.C.; visualization, C.A., H.G. and G.d.V.; supervision, C.A. and M.-Á.C.; project administration, M.-Á.C.; funding acquisition, M.-Á.C. All authors have read and agreed to the published version of the manuscript.

Funding

This research was funded by the Spanish Agencia Estatal de Investigación (grant code BIA2016-80982-R) and by the European Regional Development Fund (grant code BIA2016-80982-R).

Institutional Review Board Statement

Not applicable.

Informed Consent Statement

Not applicable.

Data Availability Statement

The original contributions presented in the study are included in the article, further inquiries can be directed to the corresponding author.

Acknowledgments

The authors thank the company producing the admixture, which provided the samples of the product used in this study under the agreement that neither the name of the product nor that of the company should be disclosed.

Conflicts of Interest

Author Hebé Gurdián was employed by the company AG Corrosión. The remaining authors declare that the research was conducted in the absence of any commercial or financial relationships that could be construed as a potential conflict of interest.

References

  1. Pedeferri, P.; Bertolini, L. La Durabilità del Calcestruzzo Armato (The Durability of Reinforced Concrete); Mc Graw Hill: Milan, Italy, 2000. (In Italian) [Google Scholar]
  2. Kropp, J.; Hilsdorf, H.K.; Grube, H.; Andrade, C.; Nilsson, L.O. Transport mechanisms and definitions. In Performance Criteria for Concrete Durability; Kropp, J., Hilsdorf, H.K., Eds.; CRC Press: Boca Raton, FL, USA, 1995; pp. 4–14. [Google Scholar]
  3. ACI Committee 222R-96; Corrosion of Metals in Concrete. American Concrete Institute (ACI): Farmington Hills, MI, USA, 1996.
  4. Bertolini, L.; Elsener, B.; Pedeferri, P.; Redaelli, E.; Polder, R.B. Corrosion of Steel in Concrete: Prevention, Diagnosis, Repair; Wiley: Hoboken, NJ, USA, 2013. [Google Scholar]
  5. Moore, A.; Beushausen, H.; Otieno, M.; Ndawula, J.; Alexander, M. Oxygen Availability and Corrosion Propagation in RC Structures in the Marine Environment—Inferences from Field and Laboratory Studies. Corros. Mater. Degrad. 2022, 3, 363–375. [Google Scholar] [CrossRef]
  6. ACI Committee 212.3R; Report on Chemical Admixtures for Concrete. American Concrete Institute (ACI): Farmington Hills, MI, USA, 2015.
  7. de Belie, N.; Gruyaert, E.; Al-Tabbaa, A.; Antonaci, P.; Baera, C.; Bajare, D.; Darquennes, A.; Davies, R.; Ferrara, L.; Jefferson, T.; et al. A Review of Self-Healing Concrete for Damage Management of Structures. Adv. Mater. Interfaces 2018, 5, 1800074. [Google Scholar] [CrossRef]
  8. Reiterman, P.; Pazderka, J. Crystalline Coating and Its Influence on the Water Transport in Concrete. Adv. Civ. Eng. 2016, 2016, 2513514. [Google Scholar] [CrossRef]
  9. Jahandari, S.; Tao, Z.; Alim, M.; Li, W. Integral waterproof concrete: A comprehensive review. J. Build. Eng. 2023, 78, 107718. [Google Scholar] [CrossRef]
  10. Oliveira, A.; Gomes, O.; Ferrara, L.; Fairbairn, E.; Filho, R. An overview of a twofold effect of crystalline admixtures in cement-based materials: From permeability-reducers to self-healing stimulators. J. Build. Eng. 2021, 41, 102400. [Google Scholar] [CrossRef]
  11. García Calvo, J.L.; Sánchez Moreno, M.; Carballosa, P.; Pedrosa, F.; Tavares, F. Improvement of the Concrete Permeability by Using Hydrophilic Blended Additive. Materials 2019, 12, 2384. [Google Scholar] [CrossRef] [PubMed]
  12. Hassani, M.; Vessalas, K.; Sirivivatnanon, V.; Baweja, D. Influence of Permeability-Reducing Admixtures on Water Penetration in Concrete. ACI Mater. J. 2017, 114, 911–922. [Google Scholar]
  13. Zheng, K.; Yang, X.; Chen, R.; Xu, L. Application of a capillary crystalline material to enhance cement grout for sealing tunnel leakage. Constr. Build. Mater. 2019, 214, 497–505. [Google Scholar] [CrossRef]
  14. Azarsa, P.; Gupta, R.; Biparva, A. Assessment of self-healing and durability parameters of concretes incorporating crystalline admixtures and Portland Limestone Cement. Cem. Concr. Compos. 2019, 99, 17–31. [Google Scholar] [CrossRef]
  15. Elsalamawy, M.; Mohamed, A.; Abosen, A. Performance of crystalline forming additive materials in concrete. Constr. Build. Mater. 2020, 30, 117056. [Google Scholar] [CrossRef]
  16. Azarsa, P.; Gupta, R.; Azarsa, P.; Biparva, A. Durability and Self-Sealing Examination of Concretes Modified with Crystalline Waterproofing Admixtures. Materials 2021, 14, 6508. [Google Scholar] [CrossRef] [PubMed]
  17. Dao, V.; Dux, P.; Morris, P.; Carse, A. Performance of Permeability-Reducing Admixtures in Marine Concrete Structures. ACI Mater. J. 2010, 107, 291–296. [Google Scholar]
  18. ASTM-C1202-97; Standard Test Method for Electrical Indication of Concrete’s Ability to Resist Chloride Ion Penetration. ASTM: West Conshohocken, PA, USA, 1997.
  19. Sideris, K.; Mingou, E.; Solomou, C. Investigation of the Mechanical Properties and Durability of Concretes Produced with Microsilica and Crystalline Admixtures. In Proceedings of the International RILEM Conference on Synergising Expertise towards Sustainability and Robustness of Cement-Based Materials and Concrete Structures—SynerCrete 2023, Milos Island, Greece, 15–16 June 2023; RILEM Bookseries; Jȩdrzejewska, A., Kanavaris, F., Azenha, M., Benboudjema, F., Schlicke, D., Eds.; Springer: Cham, Switzerland, 2023; Volume 44, pp. 876–887. [Google Scholar] [CrossRef]
  20. NT Build 492; Concrete, Mortar and Cement-Based Repair Materials: Chloride Migration Coefficient from Non-Steady-State Migration Experiments. Nordtest: Espoo, Finland, 1999.
  21. EN 206-1; Concrete—Specification, Performance, Production and Compliance. European Committee of Normalization: Brussels, Belgium, 2016.
  22. Hendrickx, R. Using the Karsten tube to estimate water transport parameters of porous building materials. Mater. Struct. 2013, 46, 1309–1320. [Google Scholar] [CrossRef]
  23. Torrent, R.J. A two chamber vacuum cell for measuring the coefficient of permeability to air of the concrete cover on site. Mater. Struct. 1992, 25, 358–365. [Google Scholar] [CrossRef]
  24. Beltrán-Cobos, R.; Tavares-Pinto, F.; Sánchez-Moreno, M. Analysis of the Influence of Crystalline Admixtures at Early Age Performance of Cement-Based Mortar by Electrical Resistance Monitoring. Materials 2021, 14, 5705. [Google Scholar] [CrossRef] [PubMed]
  25. Wang, X.; Fang, C.; Li, D.; Han, N.; Xing, F. A self-healing cementitious composite with mineral admixtures and built-in carbonate. Cem. Concr. Compos. 2018, 92, 216–229. [Google Scholar] [CrossRef]
  26. Ministerio de Fomento. Instrucción Española de Recepción de Cementos (RC-16); Ministerio de Fomento: Madrid, Spain, 2016; (Spanish Code for Cements). [Google Scholar]
  27. UNE-EN 12350-2:2020; Ensayos de Hormigón Fresco. Parte 2: Ensayo de Asentamiento (Fresh Concrete Tests. Part 2: Setting Test, Spanish Standard). AENOR: Madrid, Spain, 2020.
  28. UNE-EN 12390-3; Ensayos de Hormigón Endurecido. Parte 3: Determinación de la Resistencia a Compresión de Probetas (Hardened Concrete Tests. Part 3: Compressive Strenght Test, Spanish Standard). AENOR: Madrid, Spain, 2003.
  29. ASTM-C642; Standard Test Method for Density, Absorption, and Voids in Hardened Concrete. ASTM: West Conshohocken, PA, USA, 2021.
  30. Safiuddin, M.; Hearn, N. Comparison of ASTM saturation techniques for measuring the permeable porosity of concrete. Cem. Concr. Res. 2005, 35, 1008–1013. [Google Scholar] [CrossRef]
  31. Climent, M.A.; de Vera, G.; López, J.; Viqueira, E.; Andrade, C. A test method for measuring chloride diffusion coefficients through non-saturated concrete. Part I: The instantaneous plane source diffusion case. Cem. Concr. Res. 2002, 32, 1113–1123. [Google Scholar] [CrossRef]
  32. Medeiros, M.; Helene, P. Efficacy of Surface hydrophobic agents in reducing water and chloride ion penetration in concrete. Mater. Struct. 2008, 41, 59–71. [Google Scholar] [CrossRef]
  33. EN 12390-11:2015; Testing Hardened Concrete. Determination of the Chloride Resistance of Concrete, Unidirectional Diffusion. European Committee of Normalization: Brussels, Belgium, 2014.
  34. Vennesland, Ø.; Climent, M.A.; Andrade, C. Recommendation of RILEM TC 178-TMC: Testing and Modelling Chloride Penetration in Concrete. Methods for obtaining dust samples by means of grinding concrete in order to determine the chloride concentration profile. Mater. Struct. 2013, 46, 337–344. [Google Scholar]
  35. Climent, M.; Viqueira, E.; de Vera, G.; López-Atalaya, M. Analysis of acid-soluble chloride in cement, mortar, and concrete by potentiometric titration without filtration steps. Cem. Concr. Res. 1999, 29, 893–898. [Google Scholar] [CrossRef]
  36. Climent, M.; de Vera, G.; Viqueira, E.; López-Atalaya, M. Generalization of the possibility of eliminating the filtration step in the determination of acid-soluble chloride content in cement and concrete by potentiometric titration. Cem. Concr. Res. 2004, 34, 2291–2295. [Google Scholar] [CrossRef]
  37. Romer, M. Recommendation of RILEM TC 189-NEC: Comparative test—Part I—Comparative test of “penetrability” methods. Mater. Struct. 2005, 38, 895–906. [Google Scholar] [CrossRef]
  38. Kollek, J. The determination of the permeability of concrete to oxygen by the Cembureau method—A recommendation. Mater. Struct. 1989, 22, 225–230. [Google Scholar] [CrossRef]
  39. Polder, R.; Andrade, C.; Elsener, B.; Vennesland, Ø.; Gulikers, J.; Weidert, R.; Raupach, M. Recommendation of RILEM TC 154-EMC: Test methods for on-site measurement of resistivity of concrete. Mater. Struct. 2000, 33, 603–611. [Google Scholar] [CrossRef]
  40. Ministerio de Transportes, Movilidad y Agenda Urbana. Instrucción Española de Hormigón Estructural (EHE-21); Ministerio de Transportes, Movilidad y Agenda Urbana: Madrid, Spain, 2021; (Spanish Code for Structural Concrete). [Google Scholar]
  41. Azarsa, P.; Gupta, R. Electrical resistivity of concrete for durability evaluation. A review. Adv. Mater. Sci. Eng. 2017, 2017, 8453095. [Google Scholar] [CrossRef]
  42. Andrade, C.; D’Andrea, R. La resistividad eléctrica como parámetro de control del hormigón y de su durabilidad (The electrical resistivity as a control parameter of concrete and its durability). Rev. Alconpat 2011, 1, 90–98. (In Spanish) [Google Scholar] [CrossRef]
  43. ASTM-C876-22B; Standard Test Method for Corrosion Potentials of Uncoated Reinforcing Steel in Concrete. ASTM: West Conshohocken, PA, USA, 2022.
  44. Andrade, C.; Alonso, C.; González, J. An Initial Effort to Use the Corrosion Rate Measurement for Estimating Rebar Durability. Corrosion Rates of Steel in Concrete; American Society for Testing and Materials ASTM STP 1065: Philadelphia, PA, USA, 1990; pp. 29–37. [Google Scholar]
  45. Andrade, C.; Alonso, C.; Gulikers, J.; Polder, R.; Cigna, R.; Vennesland, Ø.; Salta, M. Test methods for on-site reinforcement corrosion rate measurement of steel reinforcement in concrete by means of the Polarization Resistance method. RILEM Recommendation of TC-154 Electrochemical Techniques for measuring metallic corrosion. Mater. Struct. 2004, 37, 623–643. [Google Scholar] [CrossRef]
Figure 1. Concrete sample for corrosion test, and the steps of the wetting–drying cycles during the corrosion test. See text and Table 2 for details.
Applsci 14 01731 g001
Figure 2. Evolution of the bulk electrical resistivity ρ of saturated concrete specimens. The specimens were kept permanently immersed in tap water after the curing period.
Applsci 14 01731 g002
Figure 3. Evolutions of the mean amounts of absorbed water during the Karsten tests at 14 days (a) and at 105 days (b) after the end of the curing period.
Applsci 14 01731 g003
Figure 4. Chloride profiles.
Applsci 14 01731 g004
Figure 5. Evolutions of the mean values of the air permeability coefficient k T for both concretes. Times are taken after the end of the curing period.
Applsci 14 01731 g005
Figure 6. Evolutions of the mean values of the surface electrical resistivity ρ s for both concretes. Times are taken after the end of the curing period.
Applsci 14 01731 g006
Figure 7. Nomogram of concrete quality with respect to permeability to gases.
Applsci 14 01731 g007
Figure 8. Evolution of resistivity ρ for the reinforced specimens of concrete C (a) and C* (b) during the corrosion tests.
Applsci 14 01731 g008
Figure 9. Evolution of the mean values of resistivity ρ for the reinforced specimens of concretes C and C* during the corrosion tests.
Applsci 14 01731 g009
Figure 10. Evolution of steel corrosion potential E c o r r for the reinforced specimens of concrete C (a) and C* (b) during the corrosion tests.
Applsci 14 01731 g010
Figure 11. Evolution of the mean values of steel corrosion potential E c o r r for the reinforced specimens of concretes C and C* during the corrosion tests.
Applsci 14 01731 g011
Figure 12. Evolution of steel corrosion rate I c o r r for the reinforced specimens of concrete C (a) and C* (b) during the corrosion tests.
Applsci 14 01731 g012
Figure 13. Evolution of the mean values of steel corrosion rate I c o r r for the reinforced specimens of concretes C and C* during the corrosion tests.
Applsci 14 01731 g013
Table 1. Mixtures of concretes tested.
ParameterConcrete CConcrete C*
CEM II 42.5 R (kg/m3)350.0350.0
Sand (kg/m3)630.0630.0
Aggregate 4/6 (kg/m3)465.5465.5
Aggregate 6/12 (kg/m3)679.0679.0
Deionized water (kg/m3)210.0199.5
Water/cement ratio0.600.57
CCADM admixture (% ref. cement mass)0.29
Abrams cone setting (cm)4.03.5
Table 2. Details of the wetting–drying cycles with application of a 0.5 M NaCl solution during the accelerated corrosion test.
DayAction
1Spread 65 mL of 0.5 M NaCl solution on the tested concrete surface inside the pond
2Allow the specimen to dry 1
3Moisten the specimen during 3 h by ponding with 300 mL of tap water. Empty the pond and take the electrochemical measurements: ρ , E c o r r and I c o r r
4Allow the specimen to dry 1
1 In case any of the dry periods were coincident with a weekend, the drying time was extended to two days.
Table 3. Compressive strength at 28 days age of the tested concretes.
ParameterConcrete CConcrete C*
Mean value (MPa)30.0031.71
Standard Deviation (MPa)0.170.33
Table 4. Results from the ASTM-C642 test.
ParameterConcrete CConcrete C*
Mean ValueStandard DeviationMean ValueStandard Deviation
Absorption after immersion and saturation (%)8.330.268.050.33
Dry bulk density (kg/m3)220010221020
Bulk density after immersion and saturation (kg/m3)238010239010
Apparent density (kg/m3)2690027000
Permeable pore volume (%)18.310.4617.830.61
Table 5. Water absorption rate at 150 min determined by the Karsten test.
Time of Testing (Days) 1ParameterConcrete CConcrete C*
14 W A C 150 10 3 kg m 2 · min 7.07.3
14Standard deviation of W A C 150   10 3 kg m 2 · min 3.13.4
105 W A C 150 10 3 kg m 2 · min 7.96.1
105Standard deviation of W A C 150   10 3 kg m 2 · min 2.63.3
1 The times of testing are expressed as days after the end of the curing period.
Table 6. Fitted parameters to the Fick’s second law of diffusion.
ParameterConcrete CConcrete C*
D n s s mean value (10−12 m2/s)23.322.2
D n s s standard deviation (10−12 m2/s)6.41.6
C S mean value (%)0.5470.516
C S standard deviation (%)0.0340.031
Table 7. Quality classification of concretes with respect to permeability to gases.
QualitykT (10−16 m2)
1—Very good<0.01
2—Good0.01–0.1
3—Normal0.1–1
4—Poor1–10
5—Very poor>10
Table 8. Corrosion probability according to E c o r r values.
E corr (mV vs. Cu / CuSO 4 (Sat))Corrosion Probability
>−200Low risk of corrosion (10%)
350 < E c o r r < 200 Intermediate
500 < E c o r r < 350 High risk of corrosion (90%)
<−500Severe corrosion
Table 9. Interpretation of I c o r r values.
I corr ( μ A/cm2)Corrosion Rate ( μ A/year)Corrosion State
<0.1<1.16Negligible
0.1–0.51.16–5.8Low–Moderate
0.5-15.8–11.6Intermediate
>1>11.6High
Disclaimer/Publisher’s Note: The statements, opinions and data contained in all publications are solely those of the individual author(s) and contributor(s) and not of MDPI and/or the editor(s). MDPI and/or the editor(s) disclaim responsibility for any injury to people or property resulting from any ideas, methods, instructions or products referred to in the content.

