Article

MSIE-Net: Associative Entity-Based Multi-Stage Network for Structured Information Extraction from Reports

School of Physics and Electronics, Shandong Normal University, Jinan 250358, China
*
Author to whom correspondence should be addressed.
Appl. Sci. 2024, 14(4), 1668; https://doi.org/10.3390/app14041668
Submission received: 30 December 2023 / Revised: 10 February 2024 / Accepted: 14 February 2024 / Published: 19 February 2024

Abstract

:
Efficient document recognition and sharing remain challenges in the healthcare, insurance, and finance sectors. One solution to this problem has been the use of deep learning techniques to automatically extract structured information from paper documents. Specifically, the structured extraction of a medical examination report (MER) can enhance medical efficiency, data analysis, and scientific research. While current methods focus on reconstructing table bodies, they often overlook table headers, leading to incomplete information extraction. This paper proposes MSIE-Net (multi-stage-structured information extraction network), a novel structured information extraction method, leveraging refined attention transformers and associated entity detection to enhance comprehensive MER information retrieval. MSIE-Net includes three stages. First, the RVI-LayoutXLM (refined visual-feature independent LayoutXLM) targets key information extraction. In this stage, the refined attention accentuates the interaction between different modalities by adjusting the attention score at the current position using previous position information. This design enables the RVI-LayoutXLM to learn more specific contextual information to improve extraction performance. Next, the associated entity detection module, RIFD-Net (relevant intra-layer fine-tuned detection network), identifies each test item’s location within the MER table body. Significantly, the backbone of RIFD-Net incorporates the intra-layer feature adjustment module (IFAM) to extract global features while homing in on local areas, proving especially sensitive for inspection tasks with dense and long bins. Finally, structured post-processing based on coordinate aggregation links the outputs from the prior stages. For the evaluation, we constructed the Chinese medical examination report dataset (CMERD), based on real medical scenarios. MSIE-Net demonstrated competitive performance in tasks involving key information extraction and associated entity detection. Experimental results validate MSIE-Net’s capability to successfully detect key entities in MER and table images with various complex layouts, perform entity relation extraction, and generate structured labels, laying the groundwork for intelligent medical documentation.

1. Introduction

With the advancement of digital transformation, the push for digitizing paper-based documents and reports is ever-increasing, especially in sectors such as healthcare, insurance, and finance [1,2,3]. In this context, the medical examination report (MER) stands out. MER, serving as an important type of medical document, encapsulates crucial information such as patient demographics, doctor’s advice, test items, and results. This is important for guiding medical decision-making. As such, the transition of the MER to an electronic format has great practical value. The purpose of this study is to explore and enable the effective conversion of MER document images into digital formats, which can improve the accessibility of healthcare information, facilitate information exchange, support healthcare decision-making, and facilitate the modernization process of healthcare and related industries.
As shown in Figure 1a, the MER image contains two tables, delineated by red boxes, termed “Header” and “Body”. The “Header” includes the testing organization and the patient’s basic information, while each row in the “Body” section means a specific test item, including item name, result, unit, reference range, anomalies indication, etc. At the early stage, optical character recognition (OCR) technology is used to recognize image textual content [4]. However, MER document images not only have text information but also contain table-structured information, such as the layout position and layout structure of the text. The structured output of text information cannot be satisfied by relying only on OCR technology. Convolutional neural networks (CNNs) and sequence recognition-based methods describe the structural sequences of tables in structured languages such as HTML and LaTeX [5]. However, these methods could be more accurate for table structure reconstruction recognition in practical scenes. In general, the prevalent approach to digitizing paper-based MER involves recovering the structure and content of the “Body” of the form and converting them into computer-readable structured data, as shown in Figure 1b. However, the current methods need to pay more attention to some unstructured information in the table header. This omission results in the loss of key information and fails to establish the correlation among key forms of information across the entire MER, hindering optimal medical decision-making and analysis.
The development of information extraction (IE) technology provides new ideas for document image digitization. Open information extraction (OIE) can automatically extract structured information from unstructured data [6]. Key information extraction (KIE) is more suitable for scenarios where key information in text needs to be extracted accurately, where the semantic entity recognition (SER) task categorizes blocks of text, and the relationship extraction (RE) task extracts the relationships that exist between different entities [7]. The early KIE-based methods are limited to a single modality, ignoring the location of key information and image layout information [8]. Nowadays, mainstream methods focus on combining multimodal features in document images to improve the system’s performance. The grid, graph neural network (GNN), Transformer [9], and end-to-end-based approaches have progressed in this direction [10,11,12,13]. However, exploring different modalities by these models is still limited, as it is difficult to balance the different contribution levels of multimodal features in different scenarios. For documents such as MER, which are rich in text and layout structures and have less visual information, the effect of visual modalities is less effective. Therefore, further exploration of the extent of multimodal information utilization in different scenes and enhancement of the interaction between different modalities are directions for further study. Moreover, MERs are similar to some business documents in that table bodies usually have lists of inspection items, where each item has a set of key information; it is challenging to rely on multimodal feature fusion alone to achieve the association of this key information within table bodies.
To address the existing problems, this paper proposes an information structure extraction method named MSIE-Net, and it is applied to the Chinese medical examination report dataset (CMERD) for validation. The overview of this method is demonstrated in Figure 2; it consists of four parts: optical character recognition (OCR), key information extraction (KIE), associated entity detection, and structured post-processing. Notably, OCR, as the upstream task of KIE, is not the main work of this study. However, to minimize the impact of its results on the subsequent KIE stage, a well-established OCR algorithm is adopted for training on CMERD, aiming at obtaining the most accurate OCR results possible. This research focuses on the other three stages. The KIE stage uses the text box coordinates and text content output from the OCR sub-module to identify entity categories and explore their possible entity relationships through semantic entity recognition (SER) and relationship extraction (RE) techniques. The associated entity detection stage directly takes the image as input and accurately obtains the coordinate information of the table body line items with the help of object detection techniques. Finally, the structured post-processing stage aggregates and organizes the coordinates of the output information from the first two stages to form a structured output format for further study, as shown in Figure 1c. Through this series of processing flows, MSIE-Net can realize the comprehensive and structured extraction of medical examination report information, which provides powerful support for research in related fields. The contributions of this paper are as follows:
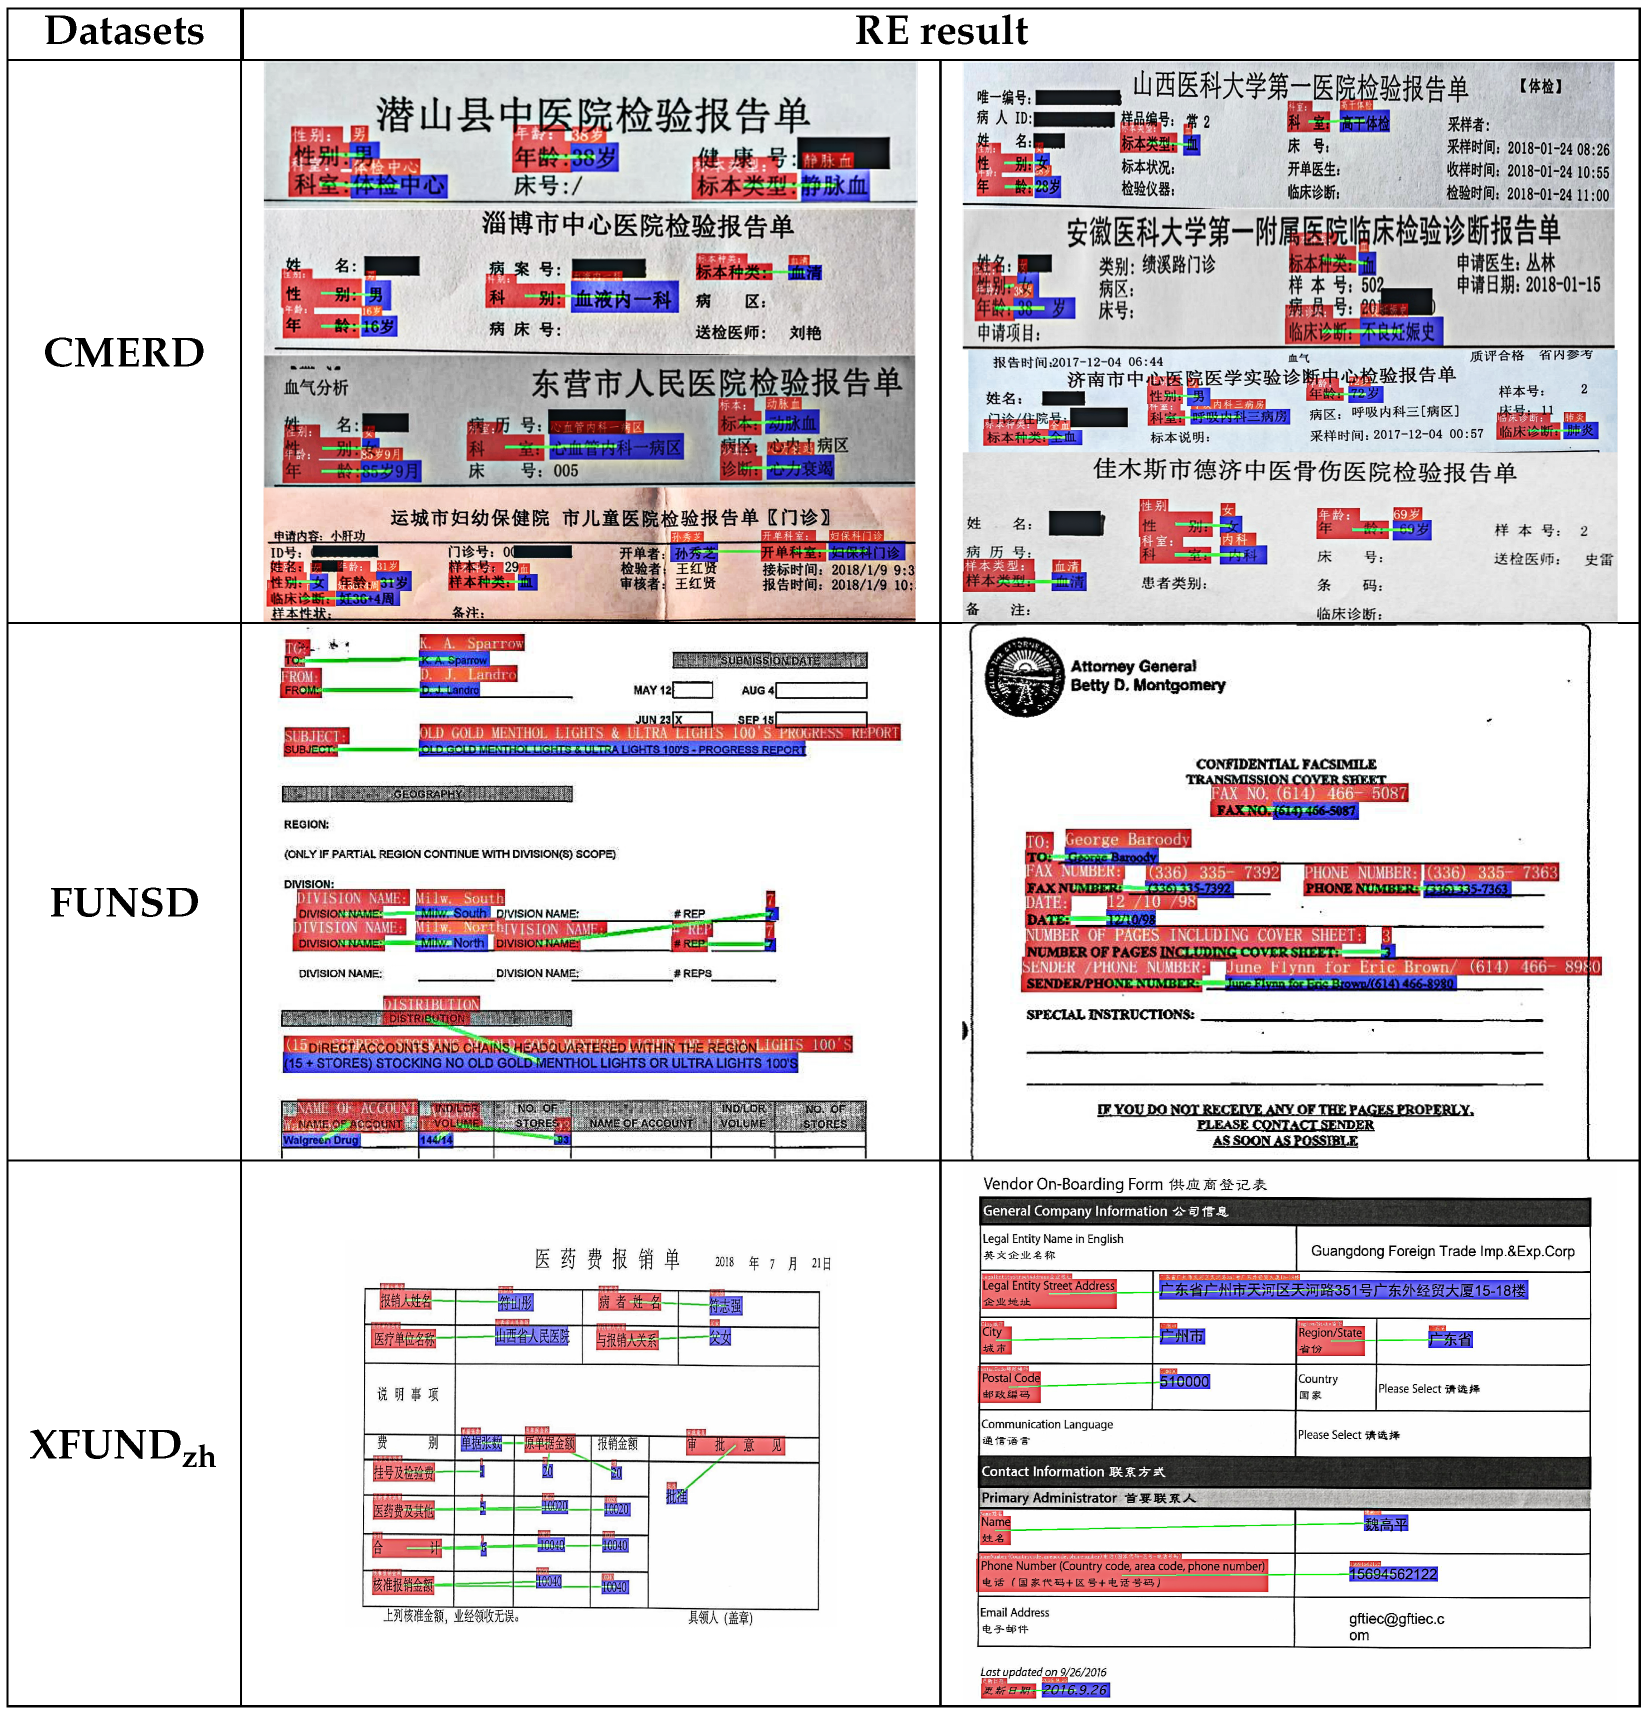
  • We introduce MSIE-Net for structured information extraction from MERs. Experiments have shown its superior ability to provide more complete information and more structurally organized output compared to existing methods for extracting examination report information.
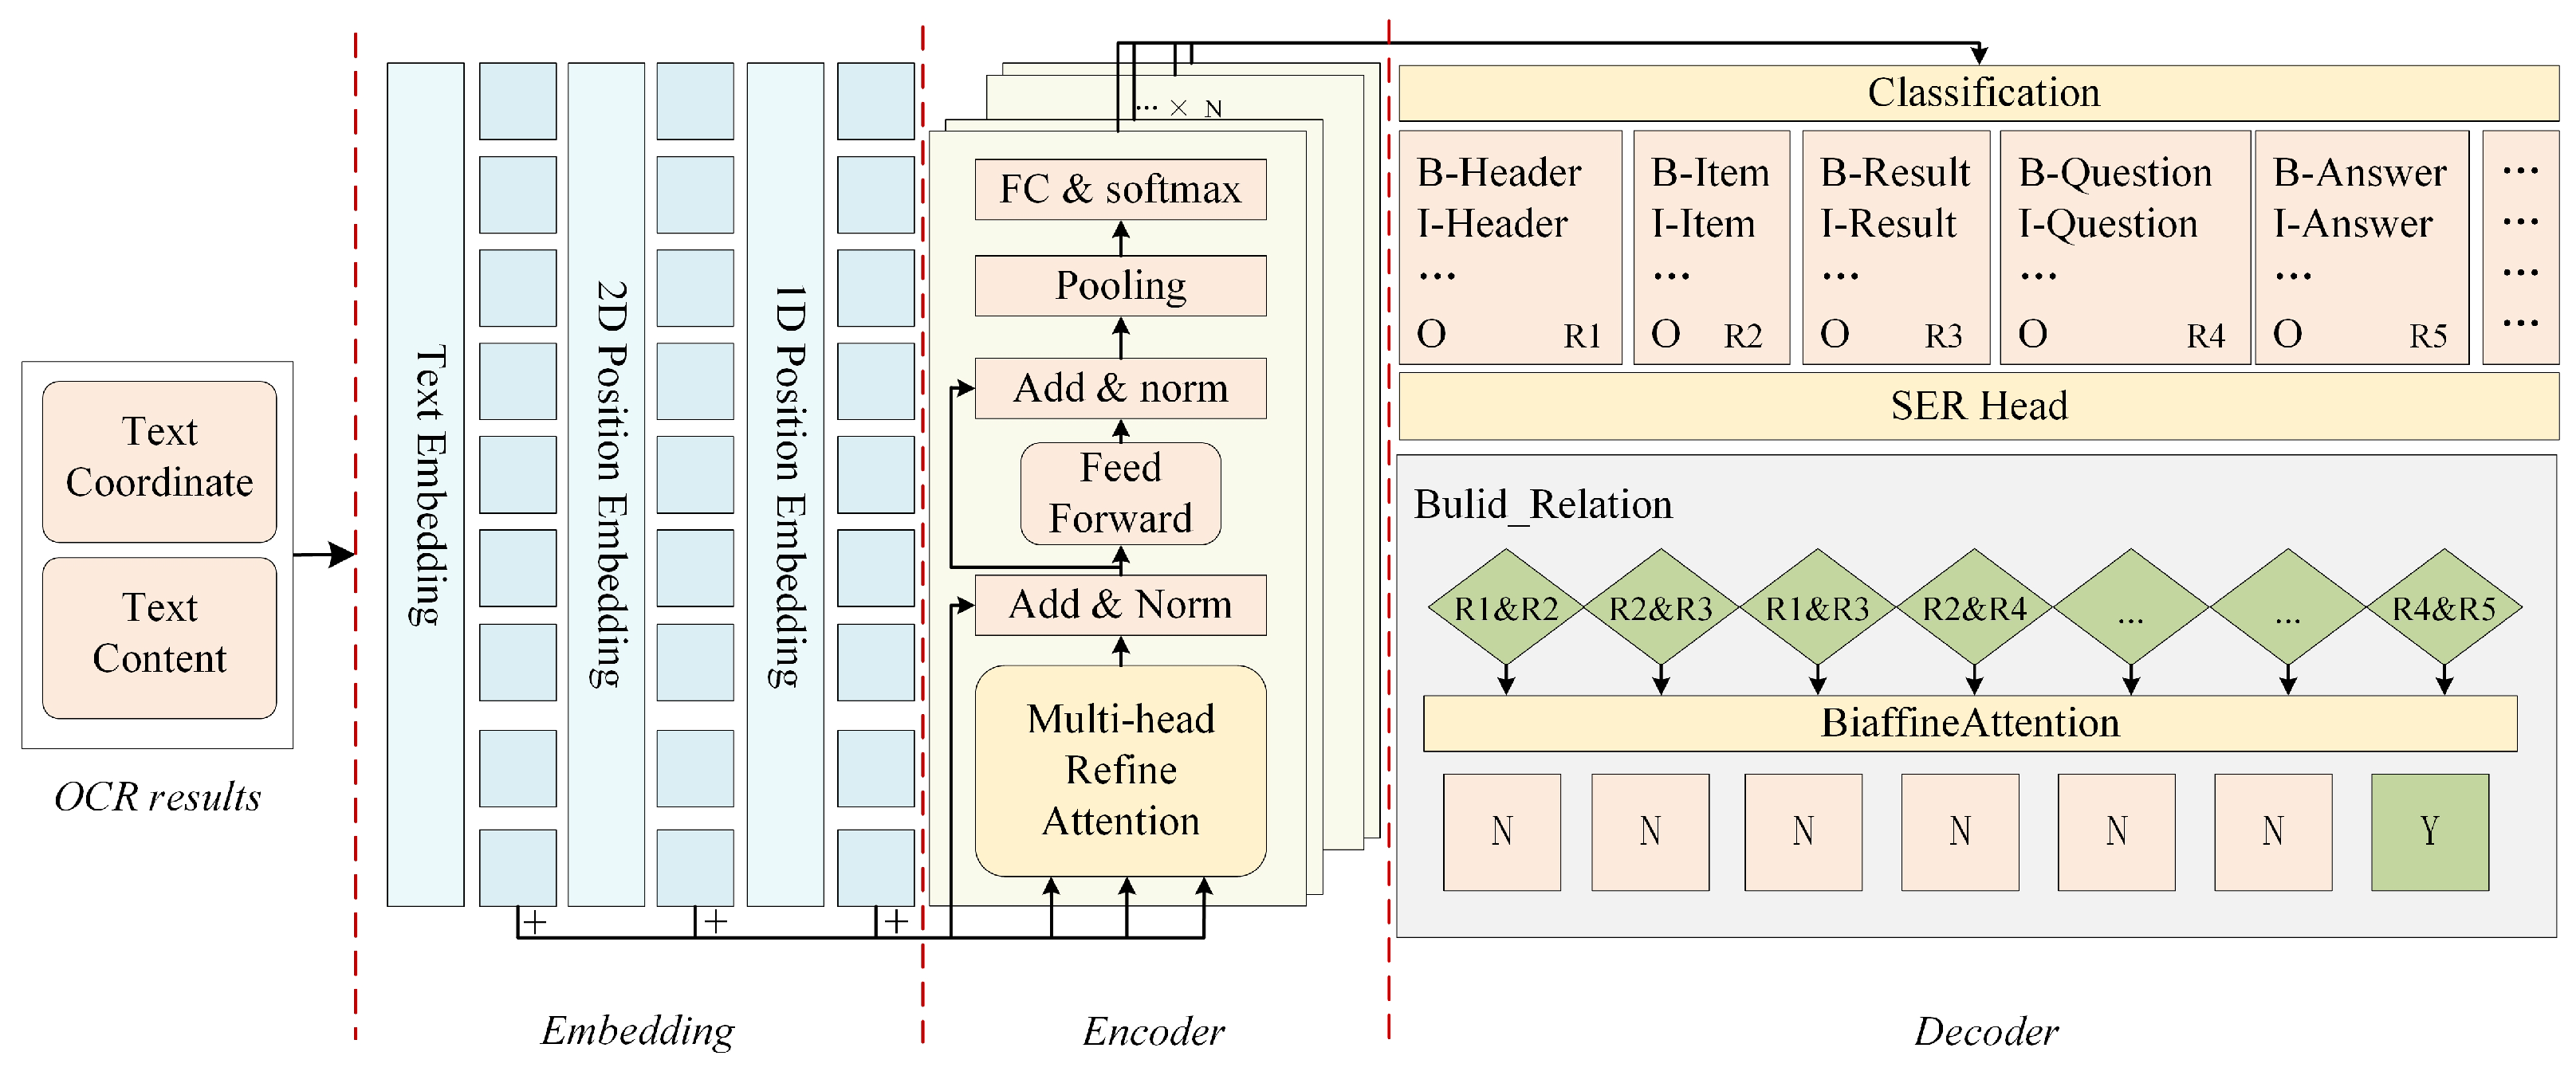
  • We propose an attention refinement module that augments traditional self-attention mechanisms. The module uses information from previously parsed regions to adjust the attention score of the current input, focusing on yet unparsed regions and, thus, enhancing the model’s contextual comprehension.
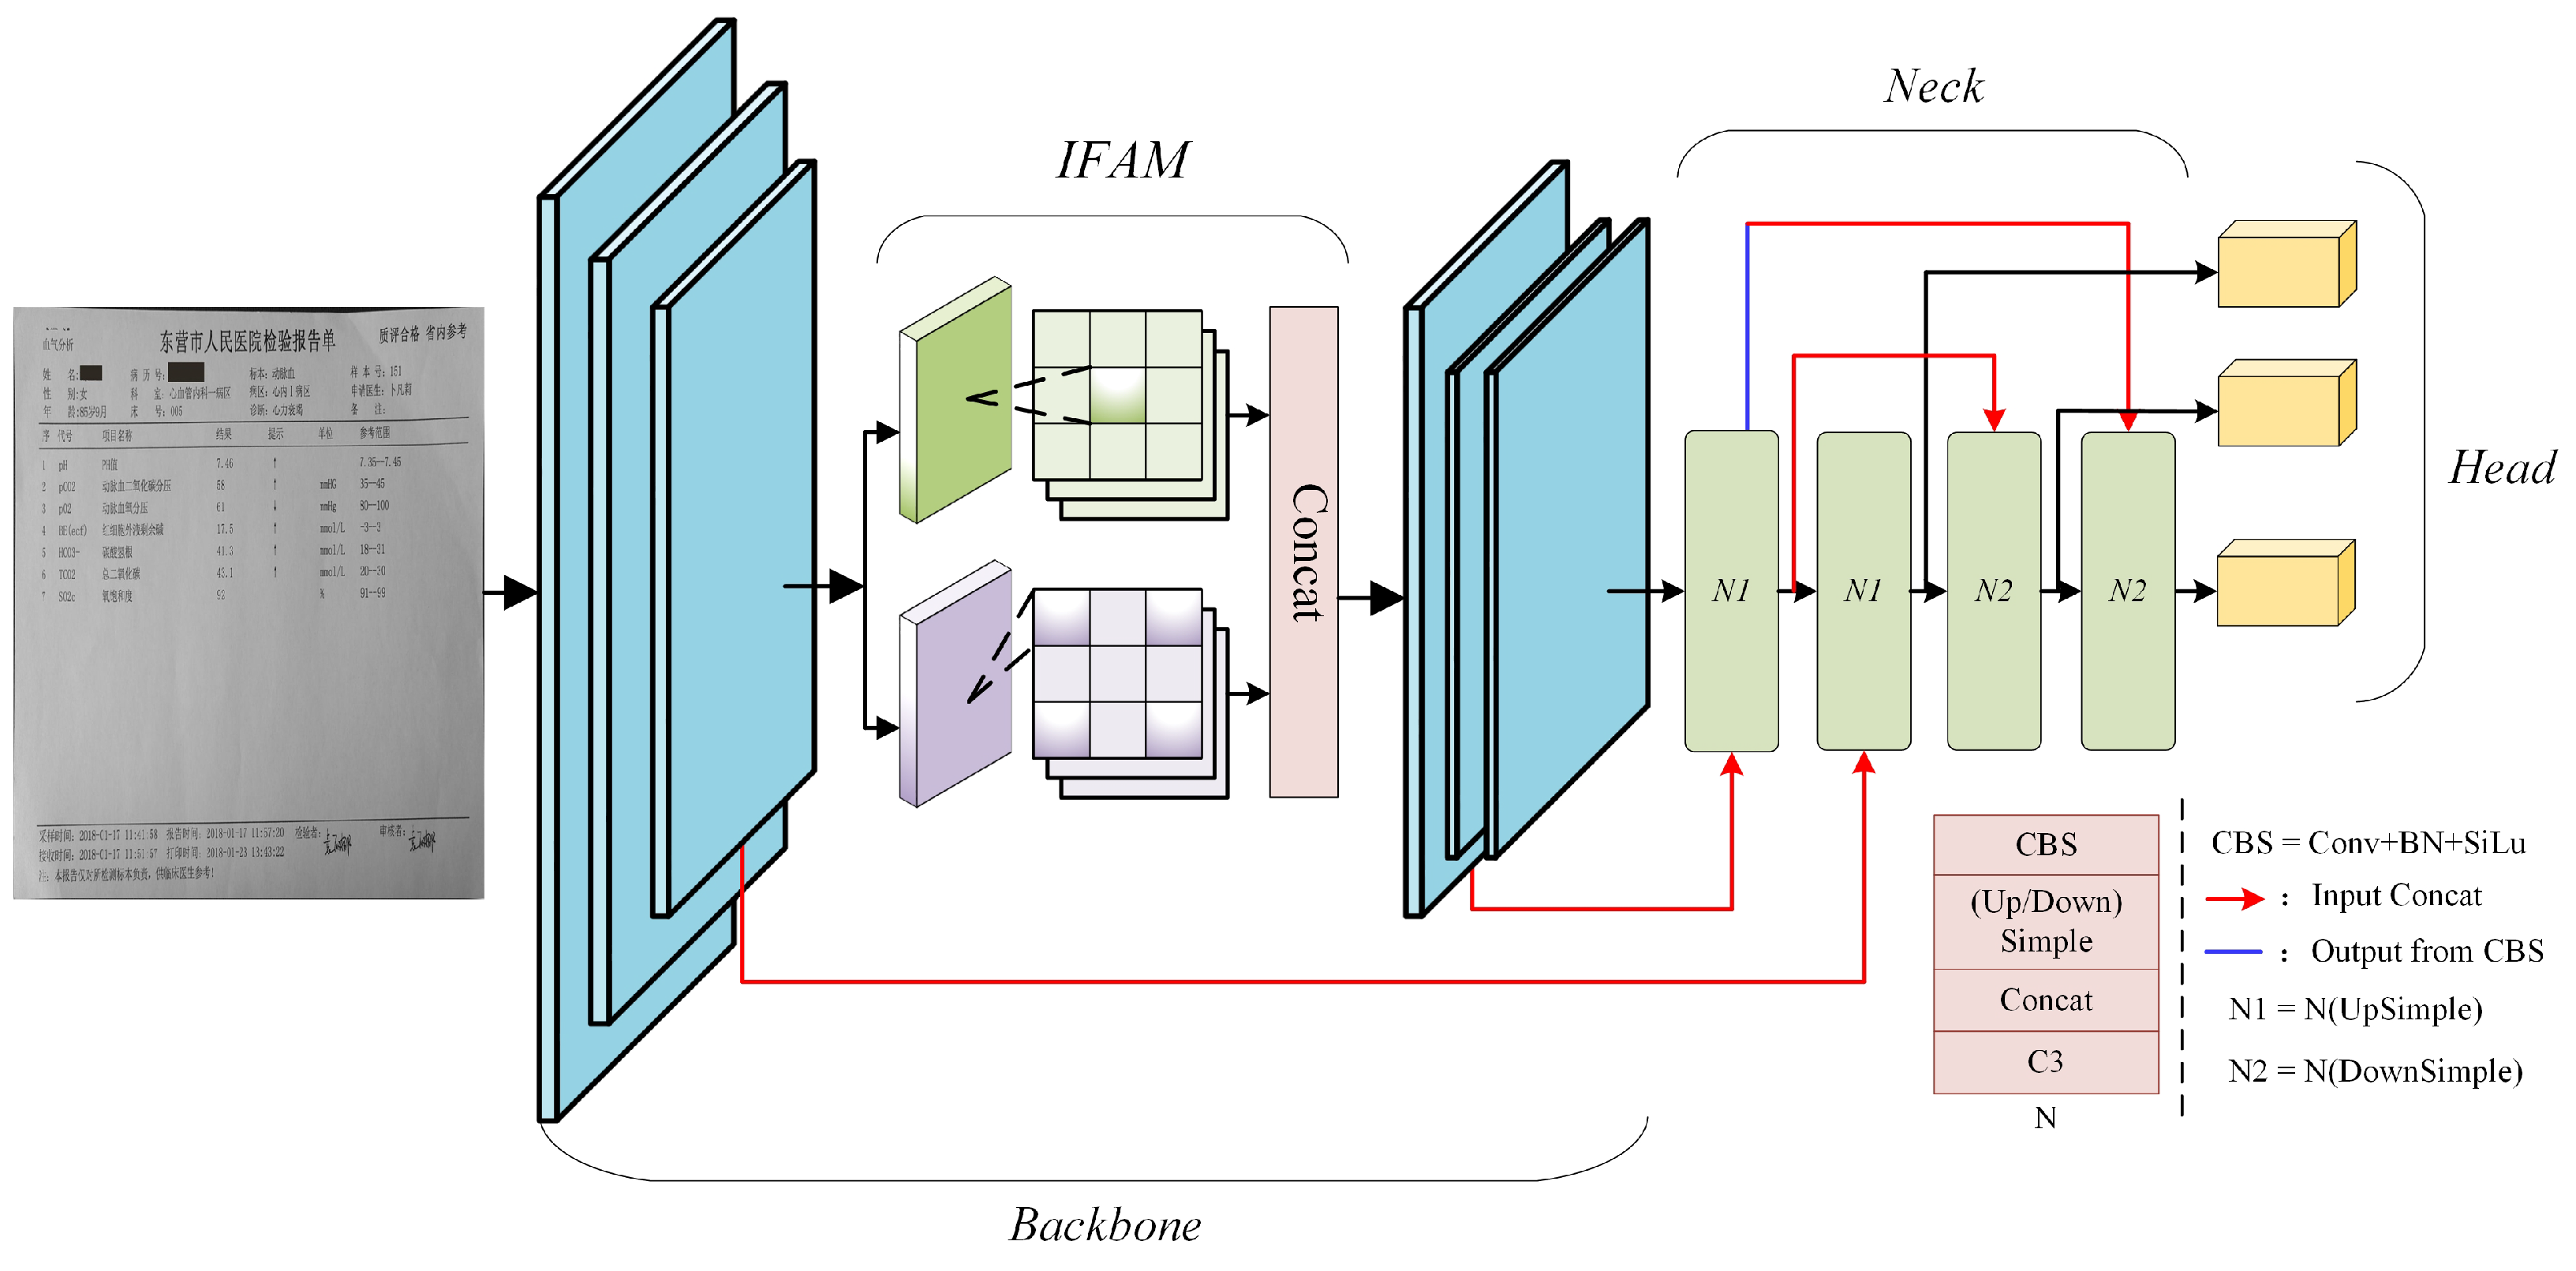
  • We introduce the intra-layer feature adjustment module (IFAM), designed for detecting MER-associated entities, to fuse global and local features. This addresses prevalent issues like omitted rows and inaccurate edge demarcation.
  • For the CMERD images constructed in this study, we devised an exhaustive annotation scheme. Apart from the pixel location, the annotation of the dataset includes the content and entity class of the text, the entity class relationship of the “Header”, and the position of the smallest bounding rectangle of all entities in each row of the “Body”.

2. Related Work

This work focuses on key information extraction and associated entity detection in MER document image processing. Most of the early key information extraction methods used rule-based schemes, which usually required a lot of manual operations, were time-consuming, delivered average performance, and had poor generalization ability. However, with the development of deep learning, several high-performance visual information extraction methods have demonstrated broad applicability and superiority in applications. In addition, the task of associated entity detection for MER document images essentially employs techniques related to object detection. Previous object detection methods mainly relied on manual feature extraction, which was not very effective in recognition and was computationally slow. In order to overcome these limitations, researchers have started to explore deep learning-based object detection methods.

2.1. Key Information Extraction

2.1.1. Traditional Key Information Extraction Methods

Key information extraction (KIE) is a pivotal task in document image processing. It aims to extract textual content of specified categories, such as names and telephone numbers from documents like certificates or contracts. Traditional key information extraction from document images mainly includes rule-based filtering methods, template matching methods, and traditional natural language processing-based methods [16]. Rule-based filtering and template matching methods often require many pre-designed rules or templates, which are based on location coordinates, with poor generalization performance and high migration costs.
Deep learning methods based on natural language processing consider key information extraction as the recognition task of named entities; they distinguish the attributes of named entities by calculating strong correlations between sequences using semantic text features. BiLSTM-CRF [8] pre-extracts temporal features of sequences, applies syntactic constraints on the extracted contextual feature vectors, and finally completes the training for sequence labeling. However, these methods only use textual semantic features, ignoring the location of key information and the layout information of the image. With the deepening of research, Jiang et al. [17] propose that text block coordinate embedding features are directly added to the BiLSTM-CRF model. Post-OCR [18] attempts to implement coordinate information in the labels of sequence annotation. Although introducing coordinate information can improve extraction accuracy, it cannot effectively construct the correlation between discontinuous entities.

2.1.2. Modern Key Information Extraction Methods

With the rapid development of deep learning, various deep neural networks such as convolutional neural networks (CNNs), recurrent neural networks (RNNs), graph neural networks (GNNs), and Transformer have been used for document image information extraction, and these algorithms are mainly concerned with the extraction and fusion of multimodal features. Grid-based methods represent images as 2D grids with word embeddings, preserving the layout features in 2D feature maps and adding encoded textual information. Chargrid [10] utilizes 2D grid representations of rich visual information to predict the classes of entities in the grid, transforming the visual information extraction task into an instance-level semantic segmentation task. However, such methods only simplify text and structure embedding, and the fusion effect is ineffective. The GNN-based approach [11,19] views the document image as a graph structure consisting of text slices, using a neural network model to learn the relationships between the text slices. Liu et al. [11] propose using GNN to learn the semantic and layout information of the text slices. Although it takes advantage of the textual and structural information, the image information is not well utilized. The end-to-end-based approach directly uses the original image as input to obtain the key information content of the document. TRIE [13] combines the text detection and recognition system with the information extraction module into an end-to-end joint optimization system. This method can reduce the accumulation of OCR errors to a certain extent, but it has many parameters and still has a gap with the Transformer-based model. The Transformer-based method uses the attention mechanism in the Transformer to fuse multimodal features [12,20,21,22,23]. BERT [20] proposes a pre-training paradigm for large-scale datasets based on the Transformer structure. LayoutLM [12] introduces additional positional embedding features based on BERT and introduces a pre-trained model to the key information extraction task. BROS [21] focuses on the logical relationships and semantic associations between each text segment, encoding the relative positional relationships between each word. LayoutLMv2 [22], LayoutXLM [23], LayoutLMv3 [24], StrucTexT [25], and StrucTexTv2 [26] further implement cross-modal interactions of image, text, and layout information in the pre-training phase. LayoutLMv2 [22] proposes a spatial-aware self-attention mechanism to encode the relative relationship between text boxes to provide a broader perspective for contextual spatial modeling. LayoutXLM [23] extends the multilingual visual richness model by utilizing the initialization weights of the pre-trained multilingual InfoXLM [27] based on the LayoutLMv2 framework. XYLayoutLM [28] proposes an augmented XYCut module to generate a reasonable reading order, further improving the model’s performance. VI-LayoutXLM [29] reduces the cost of the inference time by removing the visual feature part based on the LayoutXLM structure.

2.2. Object Detection

In the context of MER, obtaining the location of each inspection item is essentially an object detection task. Traditional object detection methods rely on manually designed feature extractors to extract features from images and then use classifiers to classify the features for object detection. However, due to the limitations of manually designed features and computational resources, traditional object detection methods have certain limitations in performance. With the rapid development of deep learning technology, object detection methods based on deep learning have gradually become mainstream. These methods can be further classified into two-stage and one-stage methods. Two-stage methods divide the object detection task into two stages: first, generating a series of candidate object regions, and then classifying and positionally refining each candidate region. Examples include R-CNN [30], Fast R-CNN [31], and Faster R-CNN [32]. However, this method is not only computationally expensive but also fails to capture the global feature representation. Single-stage methods directly perform dense sampling of the objects in the image and simultaneously complete object classification and position regression through a single forward propagation. Representative mainstream single-stage methods include SSD [33], the YOLO series [34,35,36,37,38], etc.

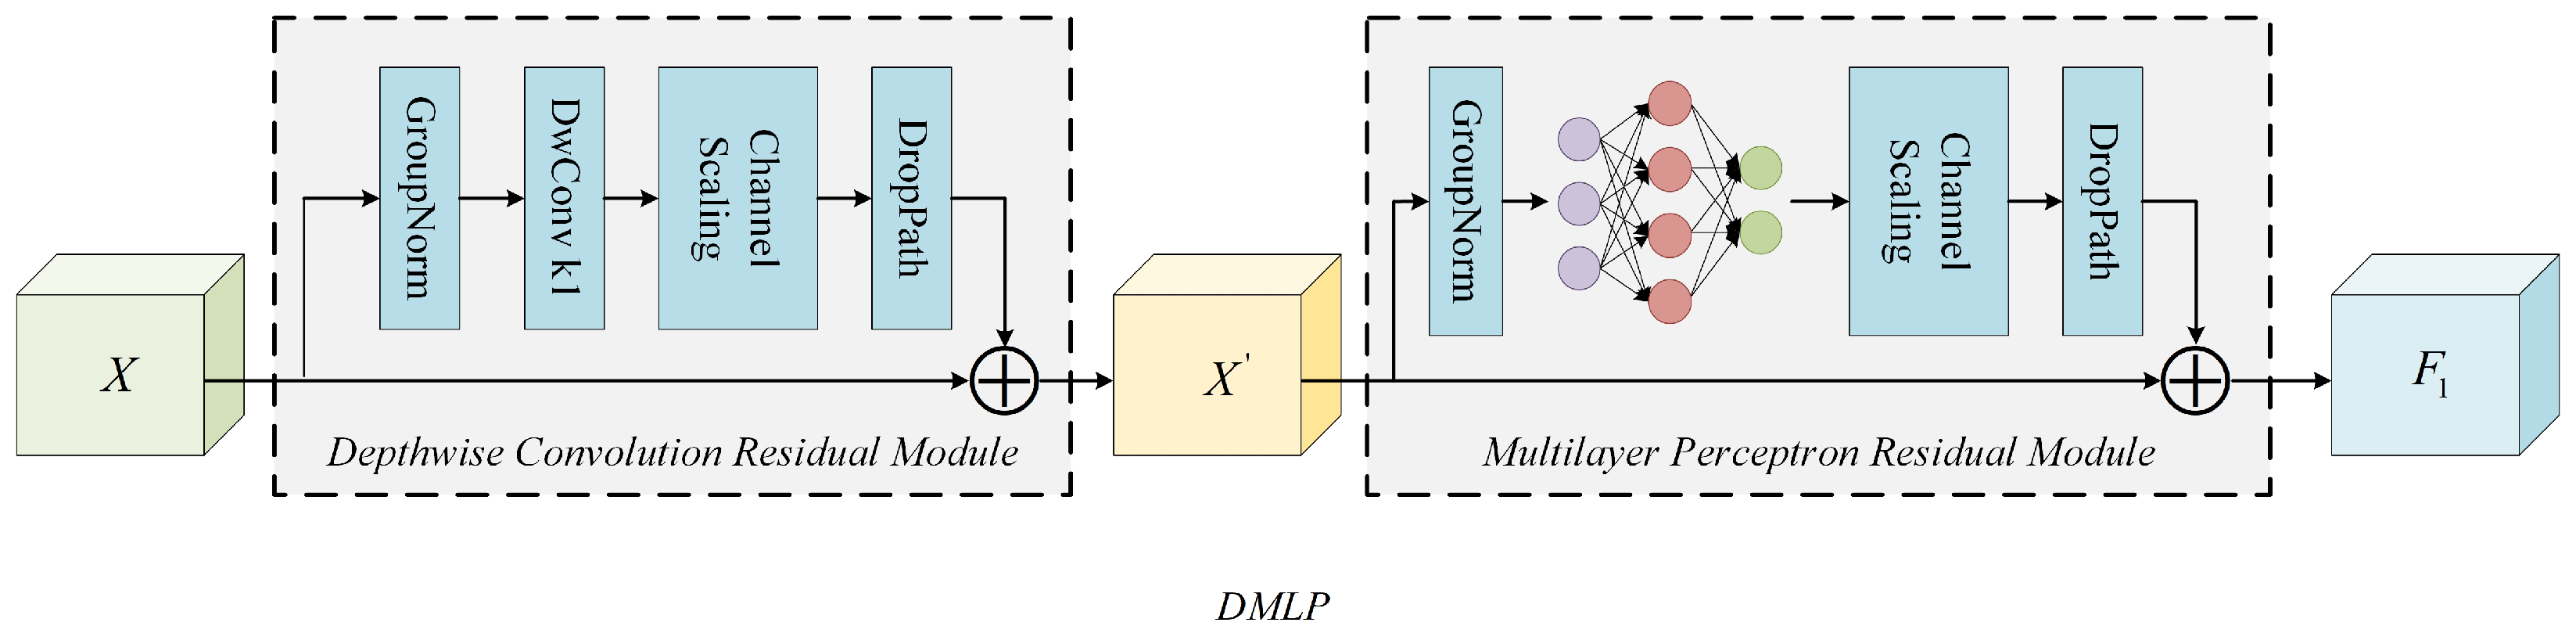
2.2.1. MLP in Object Detection

Multilayer perceptron (MLP) [39] can capture global information due to its fully connected structure, multilayer combination, nonlinear activation function and multitask learning. Faster R-CNN [32] utilizes MLP for both category and bounding box prediction. PANet [40] uses MLP for feature fusion and contextual transfer. Lightweight-based MLP [41] captures feature global dependencies, subsequently assisting in feature fusion.

2.2.2. Learnable Residual Encoding

Traditionally, residual coding methods predominantly relied on manual feature extraction, followed by encoding these features using BOW. However, studies [42,43] have showcased the feasibility of fusing the features extracted by CNNs, eliminating the need for manually designed features. Deep-TEN [44] proposes a deep learning model that generalizes traditional dictionary learning and residual encoders. The proposed encoding layer can seamlessly integrate with existing convolutional neural networks (CNNs) by adding it as a residual encoding layer on top of the convolutional layers. This allows the encoding layer to act as a pooling layer, accepting arbitrary input sizes and providing output as a fixed-length representation.

3. Method

Our proposed MSIE-Net for the structured extraction of essential information from MER images contains three stages: (1) The key information extraction phase is based on the existing Transformer method; the improved self-attention mechanism is used to adjust the allocation of attention weights and promote modal interactions, aiming to achieve more accurate semantic entity recognition and relationship extraction. (2) Linked entity detection is based on the classical architecture of target detection, the YOLOX [37] model, and the addition of the intra-layer feature adjustment module (IFAM) to its backbone network enhances the overall feature representation of the network, which contributes to the row detection of the table body. (3) Structured post-processing aggregates the information from the first two stages in the coordinates and outputs this information in a structured form to achieve efficient information integration.

3.1. Key Information Extraction

Considering the complex structure and varied layouts intrinsic to MER, we integrate an attention-refining module in the multilingual pre-training LayoutXLM [23] and explore the influence of visual information on accuracy, i.e., RVI-LayoutXLM, as illustrated in Figure 3. RVI-LayoutXLM contains three parts: multimodal information embedding, a multimodal encoder with attention refinement, and a decoder.

3.1.1. Multimodal Information Embedding

Serving as the foundational layer of RVI-LayoutXLM, multimodal information embedding encapsulates text, layout, and one-dimensional location embeddings. Text embedding involves dividing the text from the OCR result into words and converting these words into indices in a word table. Conceptually the index can be envisioned as one-dimensional position vectors. The i-th text embedding, T i , is defined by Equation (1):
T i = T o k e n E m b ( t i ) + P o s E m b 1 D ( i ) , 0 i L
where L denotes the sequence length, and t i denotes the i-th word vector.
The layout vector is used to record the spatial layout. Every MER image is considered a coordinate system with the upper left corner as the origin. The 2D position of a word is represented using a bounding box. As with LayoutLM [12], all the coordinates are normalized to values in [0, 1000] and use two vector layers to encode the position features of the x-axis and y-axis, respectively. The layout vector layer integrates the six bounding box features to form a layout vector. For the i-th text bounding box, b o x i , the text vector, P i , in the input encoder is defined by Equation (2):
P i = C o n c a t ( P o s E m b 2 D x ( x 0 , x 1 , w ) , P o s E m b 2 D y ( y 0 , y 1 , h ) ) , 0 i < L
where x 0 , y 0 denotes the coordinate of the upper-left corner, x 1 , y 1 denotes the coordinate of the lower-right corner, w denotes the width of the bounding box, and h denotes the height of the bounding box.

3.1.2. Multimodal Encoder with Attention Refinement

The multimodal encoder with attention refinement is built on the foundation of the Transformer encoder. Internally, it mainly consists of two parts: the multi-attention refinement module and a two-layer feed-forward neural network. Both parts incorporate residual connectivity and a layer normalization operation is performed after residual connectivity. The primary focus of this section is the multi-attention refinement module, as visualized in Figure 4a.
General self-attention [9] starts with the input X = { x 1 , x 2 , , x L } L × d m o d e l multiplied by three different matrices to obtain Q (the query used to match other units), K (the key used to be matched by other units), and V (the value needed to be extracted), i.e.,
Q = X W Q , K = X W K , V = X W V
where W Q , W K d m o d e l × d k , W V d m o d e l × d v are the trainable parameter matrices, L is the length of the input sequence, d m o d e l is the model depth, and d k is the depth of each attention head.
Subsequently, the attention score A for each input cell is calculated as defined by Equation (4):
A = s o f t m a x ( α ) = s o f t m a x ( Q · K T d k )
where d k is set to avoid vanishing gradients, and α is the similarity matrix between the input cells.
In this paper, an attention refinement module is proposed to optimize the attention output of the Transformer encoder, as shown in Figure 4b. Specifically, first, the attention score A in Equation (4) is used as the input to the attention refinement module, and then all the attention scores before the current position t [ 0 , L ) are accumulated to obtain the attention score, α t , at position t. Next, the attention scores go through the convolutional neural network, and a 1 × 1 convolution is used for feature dimensionality reduction. The refinement matrix is obtained by batch normalization and dimension adjustment. The whole process can be expressed as in Equations (5) and (6):
α t = k = 1 t 1 A k
and
R = r e s h a p e ( n o r m ( max ( 0 , c o n v ( r e s h a p e ( α t ) ) ) W R )
where the convolutional kernel size represents k = 5 , W R d c × n is the matrix of trainable parameters, d c is the intermediate dimension of the convolutional layer, and n denotes the number of attention heads. The final step subtracts the refinement term, R, from the initially generated similarity matrix, α , to obtain the final similarity matrix, B
B = α R
The R matrix can extract local coverage features to record the edges of the attended region and identify the incoming unattended region. The adjusted attentional similarity matrix B puts more attention on the unattended region of the input features. The i-th attention head H i can be expressed as in Equation (8):
H i = s o f t m a x ( B ) V i
The final output of the multi-attention refinement module is a splicing of n attention heads followed by a linear transformation. Detailed network details are displayed in Figure 4c, i.e.,
H = c o n c a t ( H 1 , H 2 , , H n ) W n
where W n n d × d m o d e l is the matrix of trainable parameters.
The output features of the multi-attention refinement module are residual-concatenated and normalized into a two-layer fully connected network for further feature extraction, i.e.,
F F N ( x ) = max ( 0 , x W 1 + b 1 ) W 2 + b 2
where the dimension of the input x is d m o d e l and the dimension of the output of the second linear layer is equal to that of x.

3.1.3. Decoder

Our decoder consists of two parts to handle the SER and the RE task, respectively. The SER is essentially a classification task, aiming to label each time step of the input sequence with a predefined entity class. For instance, within a given MER, the model is required to classify entities such as “Diagnostic Result”, “Diagnostic Result Reference”, etc. The SER decoder first classifies entities with a fully connected layer for the output of the encoder. The pre-defined MER image contains 11 classes of entities, and BIO annotations [45] are used to represent each class. Subsequently, the prediction results are combined with the OCR results.
The RE task focuses on discerning relationships among entities of the predicted classes. For this purpose, our approach involves building all possible relationship pairs for all entities from a given MER image. These pairs are then fed into the biaffine attention [34] classifier. The RE decoder processes the MER images to produce our predefined key–value representation of billing-like departmental, clinical diagnostic results.

3.2. Associated Entity Detection

The “Body” of MER is typically a complicated borderless table structure, comprising various contents. Existing multimodal fusion models fall short of learning the correlation between complex keys, like nested keys, and multiple rows of keys/values. To address this, our paper proposes an associated entity detection model, RIFD-Net. This model treats each test item and its related information as a distinct category, thereby producing the corresponding detection box. The overall architecture is shown in Figure 5.
In the backbone, the intra-layer feature adjustment module (IFAM), by combining the global information extraction capability of the MLP with the local detail-capturing capability of the learnable residual encoding module, the feature extractor can provide a richer and more discriminative feature representation for the backbone network. This helps enhance the model’s adaptability to complex scenes, thereby improving the accuracy of line localization and detection accuracy. The neck employs PANet [40] to extract various level features and fuse them to create a more comprehensive understanding. The head uses a decoupled head [37] separately to predict confidence and regression frames, thereby enhancing the detection accuracy and precision.
The RIFD-Net backbone consists of a series of basic convolutional blocks and residual layers, as shown in Figure 6. To minimize noise, the features generated by B 2 undergo initial processing via a basic convolution with a kernel size of 7. Subsequent to this, the extracted features are sent to a deep multilayer perceptron (DMLP) and a learnable residual encoding module (LREM). Ultimately, the two outputs pass through a convolution layer with a kernel of size 1 to adjust the output channel to 256.
The DMLP consists of a depthwise convolution residual module and a multilayer perceptron residual module, as shown in Figure 7. Depthwise convolution [46] has fewer computational parameters and more efficiency compared to normal convolution. MLP [39] can achieve global information processing. Both modules use residual structures, which help to prevent information loss during information processing. DMLP can detect dense objects by sufficiently integrating global features. The entire process is expressed in Equation (11):
X = D W ( G N ( X ) ) + X F 1 = M L P ( G N ( X ) ) + X
where X is the output of B 2 after smoothing feature processing, X is the output of the deep convolution module, G N is GroupNorm, and F 1 denotes the output of DMLP.
The LREM is constructed based on the encoding layer of the texture encoding network (Deep-TEN) [33], The encoding layer learns both the encoding parameters and the intrinsic dictionary in a supervised learning way. The network structure is shown in Figure 8.
To break it down, the feature map, X, is fed into an encoding layer with a fixed learned codebook, C. For each input datum, x i , i [ 1 , N ] , we calculate its residual vector r i k = x i c k , with each codeword c k , k [ 1 , K ] in the dictionary, where N is the total spatial number of the input features, and K is the total number of codewords. Then, an attentional weight α i k is assigned to each codeword, for the k-th codeword, c k , the attentional weight is denoted as in Equation (12):
α i k = e s k | | r i k | | 2 j = 1 K e s j | | r i j | | 2
where S = { s 1 , s 2 , , s k } is a learnable smooth primer. X = { x 1 , x 2 , , x N } , C = { c 1 , c 2 , , c K } , r i k denotes the difference between x i and c k . The learned attentional weights are then used to weight the residual vectors to obtain a fixed-length coded representation, i.e.,
e k = i = 1 N e i k = i = 1 N α i k r i k
The output of the encoding layer E = { e 1 , e 2 , , e K } is fed into a convolutional and mean layer with SiLU activation to fuse all the coded representations, i.e.,
e = i = 1 K B S M ( e k )
The resulting e is fed into the fully connected layer and multiplied channel-by-channel with the original input features. The entire process is expressed in Equation (15):
F 2 = X + X × F C ( e )
where F C denotes a fully connected layer. The output of IFAM is directly concatenated from the output feature map F 1 of DMLP with the output feature map F 2 of LREM along the channel dimensions, i.e.,
F = c o n v ( c o n c a t ( F 1 , F 2 ) )
The fused multi-scale features are fed into the decoupled head for confidence and regression frame predictions, respectively. The final MER-associated entity detection result is obtained by concatenating the target box category score, coordinate information, and an indication of whether it is foreground or background.

3.3. Structured Post-Processing

Based on RVI-LayoutXLM and RIFD-Net, this paper presents a coordinate integration approach to correlate MER table body information. RIFD-Net outputs the minimum bounding rectangular box of all entities in each row, and the RVI-LayoutXLM SER task outputs a pre-defined box of key entity coordinates. The intersection over union (IOU) [30] is calculated from the output coordinate of the two models. Through such judgment and integration, it is possible to determine which key entities belong to the same row and, thus, obtain all the nested relationships in the “Body”. Finally, the key–value information of the “Header” and the processed “Body” are jointly exported to Excel. The output key information contains the name of the current MER image, the unit where the test occurred, the patient identification, the requesting department, clinical diagnosis, type of specimen, test item, respective test result, and its reference range.

4. Experiments and Analyses

4.1. Datasets and Metrics

This study employs extensive experiments on two benchmark datasets, FUNSD [7] and XFUND [23], and the Chinese medical examination report dataset (CMERD) gathered from real medical scenarios. FUNSD contains 199 real, fully labeled scanned images and is divided into 149 training sets as well as 50 test sets for many types of KIE tasks. XFUND is a multilingual dataset for KIE tasks. It contains form data across 7 languages. Each language contains 199 form-data instances and is divided into 149 training sets and 50 test sets. XFUND statistics are presented in Table 1, where each number indicates the number of units in each category. CMERD contains 657 images from different medical institutions, covering different types, departments, diseases, etc.
Text block content and its spatial coordinates within the images are labeled by DBNet++ [14], while text recognition is facilitated by CRNN [15]. For key information extraction, 11 entity categories are denoted, including the test unit, the full Chinese name of the test item, the test result, reference range, hint information, etc. The number of categories presented in the training and test labels is counted in Figure 9. Due to the complexity and variety of entities in the patient identification table header (application department, clinical diagnosis, specimen type, etc.), the key–value is adopted for annotation. The key is defined as a question, and its corresponding value is defined as the answer entity, with all remaining information categorized as Other. The final result is that each piece of information on the MER image exists in the form of a dictionary. Each message contains “transcription”, “label”, “points”, “id”, and “linking” segments. Specifically, the “points” segment corresponds to the coordinates ( x 1 , y 1 , x 2 , y 2 ) , and the value of the “linking” segment is [question id, answer id]. If no key–value information is present, the “linking” remains empty. Moreover, this paper labels the “Body” with the smallest bounding rectangular box that encompasses all the entities in each row, and employs its position as the training label for the associated entity detection. The 657 images from CMERD are randomly divided into a training set (70%) and a test set (30%). A visual representation of some results is provided in Figure 10. An example of a MER document image with annotations and an explanation is shown in Figure 11.
Experiments were conducted to evaluate the model performance using precision (P), recall (R), and the F1 score (F1) as evaluation metrics. The associated entity detection experiments follow commonly used target detection assessment metrics of average precision ( A P ) , including m A P 50 , m A P 75 , and m A P 0.5 : 0.95 .

4.2. Implementation Details

The experiments in this paper were conducted under the Linux system, based on Python 3.8 and PaddlePaddle 2.3.2 implementation. The hardware configuration was Nvidia-Quardo-P5000 16G with CUDA11.0 and CUDNN8.0. For selecting hyperparameter values, a random set of values was first initialized. Then, we used these initial values to train the model on the training data, continuously adjust the hyperparameter values, and record the combination of hyperparameter values when the model performance reached an optimal level. The same hyperparameter value selection method was applied throughout Section 3. For the key information extraction module, RVI-LayoutXLM, the number of layers N of the RVI-LayoutXLM coding layer is 12, and the number of attention heads per layer n is 12. It has a model depth d m o d e l of 768, a depth d k of 64 for each header, and a maximum input sequence length L of 512. The attention refinement module has a convolution kernel size k of 5 and an intermediate size d c of 32. For training, the learning rate ( l r ) is initially set at 0.000025 and the batch size is 4. For RIFD-Net, the input image size is 640, the initialized l r is 0.00125, and the CosineDecay l r schedule is used. The weight decay is set to 0.0005.
In this study, DBNet++ incorporates spatial self-attention to enhance the fusion of features at various scales in the segmentation network. In the training phase, the initial l r is set to 0.007 and the batch size is set to 8. After 2000 training epochs, the model with the highest accuracy in the validation set is obtained and used to capture the text layout.
CRNN is used for text recognition. In CMERD, there are 66,054 text images (47,615 in the training set and 18,439 in the validation set) and corresponding text content labels. In CRNN training, the initial l r is set to 0.001 and the batch size is 32. After 10,000 iterations, the accuracy of the validation set reaches 98%.
The text detection and recognition model with the highest validation accuracy is saved and converted into an inference model for subsequent key information extraction. The specially trained model leads to superior OCR results, minimizing potential performance issues in subsequent tasks.

4.3. Result and Discussion

For key information extraction, in this paper, we perform 5-fold cross-validation. In each fold, images are randomly selected from the CMERD dataset according to a 7:3 ratio for the training and test sets. The final results are shown in Figure 12. Table 2 lists the averages of the results from the 5-fold cross-validation of the different KIE models on the CMERD dataset. For the SER task, our method achieves the highest F1 score (97.38%). Also, it reveals that the P and R of RVI-LayoutXLM are relatively high. In the RE task, our approach achieves the highest F1 score (95.77%), further demonstrating its consistent performance across diverse tasks. To verify whether the attention refinement module significantly improves accuracy in both SER and RE tasks, two-sample t-tests are performed. Specifically, five sets of results based on five-fold cross-validation are compared between the RVI-LayoutXLM model, incorporating refined attention and the other models, respectively. The test results are shown in Figure 13. The t-test results show that RVI-LayoutXLM significantly outperforms the baseline model, on average, in the SER task and the RE task at the 95% confidence level, demonstrating the effectiveness of the attention refinement module for entity classification and table header relationship extraction. It is pertinent to highlight that, due to the limitation of dataset annotation, all the comparison methods used in this paper serialize the document images and fuse the multimodal features using the Transformer-based network. This ensures a balanced evaluation of the capability of RVI-LayoutXLM within the context of the MER image KIE.
To evaluate the visual modality in CMERD, this paper attaches image modality to the RVI-LayoutXLM. As depicted in Figure 9, the sample count for the “other” category surpasses that of the “header” by a factor of 25. This significant category imbalance hinders the recognition accuracy of less prevalent categories. To solve this problem, we replace the cross-entropy loss [47] of the SER with focal loss [48]. Specifically, focal loss introduces a modulation factor that builds upon the standard cross-entropy loss function, expressed through the following formula:
Focal Loss ( p t ) = α t ( 1 p t ) γ log ( p t )
where p t represents the probability predicted by the model. For binary classification tasks, p t takes its value according to the label; for multi-classification tasks, it is usually the category probability output by the softmax function. α t is the category weight factor. For a category with a small number of samples, giving a more significant value to α t increases the weight of the category and improves the attention of the model to the category. ( 1 p t ) γ is the modulation factor; when the sample is easy to classify ( p t is close to 1), this factor tends to 0, decreasing its loss weight; when the sample is difficult to classify ( p t is small), this factor is more significant, increasing its loss weight. In short, focal loss improves classification performance by adjusting the category weights so that the model can focus more on samples that are difficult to categorize and are in a small number of categories.
Table 3 demonstrates the effect of reintroducing visual modalities into the current RVI-LayoutXLM model and changing the loss on the model accuracy. Visual modalities are added to both the SER and RE tasks, which are experimentally found to result in a larger set of model parameters but do not improve mAP performance. In contrast, employing the focal loss proves efficacious in addressing the category imbalance problem. As shown in Figure 14, a comparative analysis based on the two loss functions reveals an uptick in the entity recognition rate across categories.
To evaluate the generality of the proposed method, we tested the KIE model on two public datasets, FUNSD and XFUND. A comparison with prior models, as detailed in Table 4, shows that our RVI-LayoutXLM outperformed others, achieving the best F1 scores for both the SER and RE tasks on XFUNDzh and FUNSD. This underscores the robust generalizability of our approach.
For the associated entity detection, we initially deployed YOLOX [27] for training and testing on the CMERD dataset. However, the results obtained after inference exhibited issues such as missing rows and inaccurate edge localization. In response, we introduced IFAM to the backbone of YOLOX. Table 5 shows the experimental results, demonstrating that our proposed method exhibits excellent performance in the given scenario.
This improved model also demonstrates significant advantages in the task of associated entity detection. It improves the accuracy and robustness of the detection by addressing the problems of missing rows and inaccurate edge localization. In addition, the model achieves a large performance improvement compared to other models, proving its superiority in the current scenario.
Finally, the information processed by RVI-LayoutXLM and RIFD-Net is unified in the post-processing module. The goal is to concatenate the four key entities of predefined entities, namely the project name, result, reference range, and unit, with the table header information, and output them uniformly into an Excel spreadsheet. Some of the visualization results are presented in Figure 15, Figure 16, Figure 17, Figure 18 and Figure 19.

5. Conclusions

In this study, an innovative structured key information extraction network, MSIE-Net, is proposed for MER document images. This network adopts the RVI-LayoutXLM model, which is based on the refined attention module to optimize the allocation of attention, enhance inter-modal interactions between the text and layout, and effectively identify and extract predefined key entities and table header information relations of MER. The IFAM-based RIFD-Net model sufficiently integrates global and local features and improves the accuracy of MER text row coordinate recognition, which provides solid support for integrating structured information. In addition, the structured post-processing module integrates key information from the entire MER and structures the output. Through validation on CMERD, FUNSD, and XFUND, the method of this study demonstrates excellent performance. The experimental results show that the method effectively solves the current problem of incomplete MER information extraction and achieves comprehensive and efficient structured output. In addition, it demonstrates application potential in tasks such as bank flow and receipt information extraction.
However, exploring the role of multimodal features in this study is limited to documents such as MER, which are rich in text and layout structure but have less visual information. Moreover, this study addresses the compartmentalization in the model’s design, which lacks unity and wholeness. In order to overcome these limitations, future research will concentrate on three main directions: first, to explore in depth the effect of visual modality on model performance in visually rich document images and to further improve the use of visual features; second, to work on models that can adaptively adjust the weights of multimodal features and integrate the models into a unified end-to-end framework; and finally, to explore the effect of multimodal features on model performance by collecting more diverse and complex document images and exploring the effect of multimodal features on model performance by collecting more diverse and complex document images. By collecting more diverse and complex document image data and fine-grained annotation and processing, we expect to train more robust and resilient models to meet the challenges of different scenarios.

Author Contributions

Conceptualization, Q.L. and H.W.; methodology, Q.L. and H.W.; software, Q.L. and H.W.; validation, Q.L.; formal analysis, M.S.; investigation, H.S.; resources, H.W.; data curation, Q.L.; writing—original draft preparation, Q.L.; writing—review and editing, Q.L. and H.W.; visualization, Q.L., M.S. and H.S.; supervision, H.W.; project administration, H.W. All authors have read and agreed to the published version of the manuscript.

Funding

This research received no external funding.

Institutional Review Board Statement

Not applicable.

Informed Consent Statement

Not applicable.

Data Availability Statement

Data are available upon request due to patient privacy constraints.

Conflicts of Interest

The authors declare no conflicts of interest.

References

  1. Hong, T.P.; Chen, W.C.; Wu, C.H.; Xiao, B.W.; Chiang, B.Y.; Shen, Z.X. Information Extraction and Analysis on Certificates and Medical Receipts. In Proceedings of the 2022 IEEE International Conference on Consumer Electronics (ICCE), Las Vegas, NV, USA, 7–9 January 2022; pp. 1–4. [Google Scholar] [CrossRef]
  2. Krieger, F.; Drews, P.; Funk, B.; Wobbe, T. Information extraction from invoices: A graph neural network approach for datasets with high layout variety. In Proceedings of the Innovation Through Information Systems: Volume II: A Collection of Latest Research on Technology Issues, Duisburg, Germany, 9–11 March 2021; Springer: Berlin/Heidelberg, Germany, 2021; pp. 5–20. [Google Scholar]
  3. Wan, H.; Zhong, Z.; Li, T.; Zhang, H.; Sun, J. Contextual transformer sequence-based recognition network for medical examination reports. Appl. Intell. 2023, 53, 17363–17380. [Google Scholar] [CrossRef]
  4. Cheng, Z.; Bai, F.; Xu, Y.; Zheng, G.; Pu, S.; Zhou, S. Focusing Attention: Towards Accurate Text Recognition in Natural Images. In Proceedings of the 2017 IEEE International Conference on Computer Vision (ICCV), Venice, Italy, 22–29 October 2017; pp. 5086–5094. [Google Scholar] [CrossRef]
  5. Ye, J.; Qi, X.; He, Y.; Chen, Y.; Gu, D.; Gao, P.; Xiao, R. PingAn-VCGroup’s Solution for ICDAR 2021 Competition on Scientific Literature Parsing Task B: Table Recognition to HTML. arXiv 2021, arXiv:2105.01848. [Google Scholar]
  6. Guarasci, R.; Damiano, E.; Minutolo, A.; Esposito, M.; Pietro, G.D. Lexicon-Grammar based open information extraction from natural language sentences in Italian. Expert Syst. Appl. 2020, 143, 112954. [Google Scholar] [CrossRef]
  7. Jaume, G.; Kemal Ekenel, H.; Thiran, J.P. FUNSD: A Dataset for Form Understanding in Noisy Scanned Documents. In Proceedings of the 2019 International Conference on Document Analysis and Recognition Workshops (ICDARW), Sydney, Australia, 22–25 September 2019; Volume 2, pp. 1–6. [Google Scholar] [CrossRef]
  8. Lample, G.; Ballesteros, M.; Subramanian, S.; Kawakami, K.; Dyer, C. Neural Architectures for Named Entity Recognition. In Proceedings of the 2016 Conference of the North American Chapter of the Association for Computational Linguistics: Human Language Technologies, San Diego, CA, USA, 12–17 June 2016; Knight, K., Nenkova, A., Rambow, O., Eds.; Association for Computational Linguistics: Stroudsburg, PA, USA, 2016; pp. 260–270. [Google Scholar] [CrossRef]
  9. Subakan, C.; Ravanelli, M.; Cornell, S.; Bronzi, M.; Zhong, J. Attention Is All You Need In Speech Separation. In Proceedings of the ICASSP 2021—2021 IEEE International Conference on Acoustics, Speech and Signal Processing (ICASSP), Toronto, ON, Canada, 6–11 June 2021; pp. 21–25. [Google Scholar] [CrossRef]
  10. Katti, A.R.; Reisswig, C.; Guder, C.; Brarda, S.; Bickel, S.; Höhne, J.; Faddoul, J.B. Chargrid: Towards Understanding 2D Documents. In Proceedings of the 2018 Conference on Empirical Methods in Natural Language Processing, Brussels, Belgium, 31 October–4 November 2018; Riloff, E., Chiang, D., Hockenmaier, J., Tsujii, J., Eds.; Association for Computational Linguistics: Stroudsburg, PA, USA, 2018; pp. 4459–4469. [Google Scholar] [CrossRef]
  11. Liu, X.; Gao, F.; Zhang, Q.; Zhao, H. Graph Convolution for Multimodal Information Extraction from Visually Rich Documents. In Proceedings of the 2019 Conference of the North American Chapter of the Association for Computational Linguistics: Human Language Technologies, Volume 2 (Industry Papers), Minneapolis, MN, USA, 2–7 June 2019; Loukina, A., Morales, M., Kumar, R., Eds.; Association for Computational Linguistics: Stroudsburg, PA, USA, 2019; pp. 32–39. [Google Scholar] [CrossRef]
  12. Xu, Y.; Li, M.; Cui, L.; Huang, S.; Wei, F.; Zhou, M. LayoutLM: Pre-training of Text and Layout for Document Image Understanding. In Proceedings of the 26th ACM SIGKDD International Conference on Knowledge Discovery & Data Mining, Online, 6–10 July 2020. [Google Scholar]
  13. Zhang, P.; Xu, Y.; Cheng, Z.; Pu, S.; Lu, J.; Qiao, L.; Niu, Y.; Wu, F. TRIE: End-to-End Text Reading and Information Extraction for Document Understanding. In Proceedings of the 28th ACM International Conference on Multimedia, Seattle, WA, USA, 12–16 October 2020; pp. 1413–1422. [Google Scholar] [CrossRef]
  14. Liao, M.; Zou, Z.; Wan, Z.; Yao, C.; Bai, X. Real-Time Scene Text Detection With Differentiable Binarization and Adaptive Scale Fusion. IEEE Trans. Pattern Anal. Mach. Intell. 2023, 45, 919–931. [Google Scholar] [CrossRef] [PubMed]
  15. Shi, B.; Bai, X.; Yao, C. An End-to-End Trainable Neural Network for Image-Based Sequence Recognition and Its Application to Scene Text Recognition. IEEE Trans. Pattern Anal. Mach. Intell. 2017, 39, 2298–2304. [Google Scholar] [CrossRef] [PubMed]
  16. Rusiñol, M.; Benkhelfallah, T.; dAndecy, V.P. Field Extraction from Administrative Documents by Incremental Structural Templates. In Proceedings of the 2013 12th International Conference on Document Analysis and Recognition, Washington, DC, USA, 25–28 August 2013; pp. 1100–1104. [Google Scholar] [CrossRef]
  17. Jiang, Z.; Huang, Z.; Lian, Y.; Guo, J.; Qiu, W. Integrating Coordinates with Context for Information Extraction in Document Images. In Proceedings of the 2019 International Conference on Document Analysis and Recognition (ICDAR), Sydney, Australia, 20–25 September 2019; pp. 363–368. [Google Scholar] [CrossRef]
  18. Hwang, W.; Kim, S.; Seo, M.; Yim, J.; Park, S.; Park, S.; Lee, J.; Lee, B.; Lee, H. Post-OCR parsing: Building simple and robust parser via BIO tagging. In Proceedings of the 33rd Conference on Neural Information Processing Systems (NeurIPS 2019), Vancouver, BC, Canada, 8–14 December 2019. [Google Scholar]
  19. Zhang, Z.; Ma, J.; Du, J.; Wang, L.; Zhang, J. Multimodal Pre-Training Based on Graph Attention Network for Document Understanding. IEEE Trans. Multimed. 2023, 25, 6743–6755. [Google Scholar] [CrossRef]
  20. Devlin, J.; Chang, M.W.; Lee, K.; Toutanova, K. BERT: Pre-training of Deep Bidirectional Transformers for Language Understanding. In Proceedings of the 2019 Conference of the North American Chapter of the Association for Computational Linguistics: Human Language Technologies, Volume 1 (Long and Short Papers), Minneapolis, MN, USA, 2–7 June 2019; Burstein, J., Doran, C., Solorio, T., Eds.; Association for Computational Linguistics: Stroudsburg, PA, USA, 2019; pp. 4171–4186. [Google Scholar] [CrossRef]
  21. Hong, T.; Kim, D.; Ji, M.; Hwang, W.; Nam, D.; Park, S. BROS: A Pre-trained Language Model Focusing on Text and Layout for Better Key Information Extraction from Documents. In Proceedings of the AAAI Conference on Artificial Intelligence, Online, 2–9 February 2021. [Google Scholar]
  22. Xu, Y.; Xu, Y.; Lv, T.; Cui, L.; Wei, F.; Wang, G.; Lu, Y.; Florencio, D.; Zhang, C.; Che, W.; et al. LayoutLMv2: Multi-modal Pre-training for Visually-rich Document Understanding. In Proceedings of the 59th Annual Meeting of the Association for Computational Linguistics and the 11th International Joint Conference on Natural Language Processing (Volume 1: Long Papers), Online, 2–5 August 2021; Zong, C., Xia, F., Li, W., Navigli, R., Eds.; Association for Computational Linguistics: Stroudsburg, PA, USA, 2021; pp. 2579–2591. [Google Scholar] [CrossRef]
  23. Xu, Y.; Lv, T.; Cui, L.; Wang, G.; Lu, Y.; Florêncio, D.A.F.; Zhang, C.; Wei, F. LayoutXLM: Multimodal Pre-training for Multilingual Visually-rich Document Understanding. arXiv 2021, arXiv:2104.08836. [Google Scholar]
  24. Huang, Y.; Lv, T.; Cui, L.; Lu, Y.; Wei, F. LayoutLMv3: Pre-training for Document AI with Unified Text and Image Masking. In Proceedings of the 30th ACM International Conference on Multimedia, Lisboa, Portugal, 10–14 October 2022; pp. 4083–4091. [Google Scholar] [CrossRef]
  25. Li, Y.; Qian, Y.; Yu, Y.; Qin, X.; Zhang, C.; Liu, Y.; Yao, K.; Han, J.; Liu, J.; Ding, E. StrucTexT: Structured Text Understanding with Multi-Modal Transformers. In Proceedings of the 29th ACM International Conference on Multimedia, Online, 20–24 October 2021; pp. 1912–1920. [Google Scholar] [CrossRef]
  26. Yu, Y.; Li, Y.; Zhang, C.; Zhang, X.; Guo, Z.; Qin, X.; Yao, K.; Han, J.; Ding, E.; Wang, J. StrucTexTv2: Masked Visual-Textual Prediction for Document Image Pre-training. arXiv 2023, arXiv:2303.00289. [Google Scholar]
  27. Chi, Z.; Dong, L.; Wei, F.; Yang, N.; Singhal, S.; Wang, W.; Song, X.; Mao, X.L.; Huang, H.; Zhou, M. InfoXLM: An Information-Theoretic Framework for Cross-Lingual Language Model Pre-Training. In Proceedings of the 2021 Conference of the North American Chapter of the Association for Computational Linguistics: Human Language Technologies, Online, 6–11 June 2021; Toutanova, K., Rumshisky, A., Zettlemoyer, L., Hakkani-Tur, D., Beltagy, I., Bethard, S., Cotterell, R., Chakraborty, T., Zhou, Y., Eds.; Association for Computational Linguistics: Stroudsburg, PA, USA, 2021; pp. 3576–3588. [Google Scholar] [CrossRef]
  28. Gu, Z.; Meng, C.; Wang, K.; Lan, J.; Wang, W.; Gu, M.; Zhang, L. XYLayoutLM: Towards Layout-Aware Multimodal Networks For Visually-Rich Document Understanding. In Proceedings of the 2022 IEEE/CVF Conference on Computer Vision and Pattern Recognition (CVPR), New Orleans, LA, USA, 18–24 June 2022; pp. 4573–4582. [Google Scholar] [CrossRef]
  29. Li, C.; Guo, R.; Zhou, J.; An, M.; Du, Y.; Zhu, L.; Liu, Y.; Hu, X.; Yu, D. PP-StructureV2: A Stronger Document Analysis System. arXiv 2022, arXiv:2210.05391. [Google Scholar]
  30. Girshick, R.; Donahue, J.; Darrell, T.; Malik, J. Rich Feature Hierarchies for Accurate Object Detection and Semantic Segmentation. In Proceedings of the 2014 IEEE Conference on Computer Vision and Pattern Recognition, Columbus, OH, USA, 23–28 June 2014; pp. 580–587. [Google Scholar] [CrossRef]
  31. Girshick, R. Fast R-CNN. In Proceedings of the 2015 IEEE International Conference on Computer Vision (ICCV), Santiago, Chile, 7–13 December 2015; pp. 1440–1448. [Google Scholar] [CrossRef]
  32. Ren, S.; He, K.; Girshick, R.; Sun, J. Faster R-CNN: Towards Real-Time Object Detection with Region Proposal Networks. IEEE Trans. Pattern Anal. Mach. Intell. 2017, 39, 1137–1149. [Google Scholar] [CrossRef] [PubMed]
  33. Liu, W.; Anguelov, D.; Erhan, D.; Szegedy, C.; Reed, S.E.; Fu, C.Y.; Berg, A.C. SSD: Single Shot MultiBox Detector. In Proceedings of the European Conference on Computer Vision, Tel Aviv, Israel, 23–27 October 2015. [Google Scholar]
  34. Redmon, J.; Farhadi, A. YOLOv3: An Incremental Improvement. arXiv 2018, arXiv:1804.02767. [Google Scholar]
  35. Wang, C.Y.; Bochkovskiy, A.; Liao, H.Y.M. Scaled-YOLOv4: Scaling Cross Stage Partial Network. In Proceedings of the 2021 IEEE/CVF Conference on Computer Vision and Pattern Recognition (CVPR), Nashville, TN, USA, 20–25 June 2021; pp. 13024–13033. [Google Scholar] [CrossRef]
  36. Glenn Jocher. ultralytics/yolov5. 2021. Available online: https://github.com/ultralytics/yolov5/releases (accessed on 1 December 2023).
  37. Ge, Z.; Liu, S.; Wang, F.; Li, Z.; Sun, J. YOLOX: Exceeding YOLO Series in 2021. arXiv 2021, arXiv:2107.08430. [Google Scholar]
  38. Xu, S.; Wang, X.; Lv, W.; Chang, Q.; Cui, C.; Deng, K.; Wang, G.; Dang, Q.; Wei, S.; Du, Y.; et al. PP-YOLOE: An evolved version of YOLO. arXiv 2022, arXiv:2203.16250. [Google Scholar]
  39. Rosenblatt, F. Principles of neurodynamics. Perceptrons and the theory of brain mechanisms. Am. J. Psychol. 1963, 76, 705. [Google Scholar]
  40. Liu, S.; Qi, L.; Qin, H.; Shi, J.; Jia, J. Path Aggregation Network for Instance Segmentation. In Proceedings of the 2018 IEEE/CVF Conference on Computer Vision and Pattern Recognition, Salt Lake City, UT, USA, 18–23 June 2018; pp. 8759–8768. [Google Scholar] [CrossRef]
  41. Quan, Y.; Zhang, D.; Zhang, L.; Tang, J. Centralized Feature Pyramid for Object Detection. IEEE Trans. Image Process. 2023, 32, 4341–4354. [Google Scholar] [CrossRef] [PubMed]
  42. Arandjelovic, R.; Zisserman, A. All About VLAD. In Proceedings of the 2013 IEEE Conference on Computer Vision and Pattern Recognition, Portland, OR, USA, 23–28 June 2013; pp. 1578–1585. [Google Scholar] [CrossRef]
  43. Perronnin, F.; Dance, C. Fisher Kernels on Visual Vocabularies for Image Categorization. In Proceedings of the 2007 IEEE Conference on Computer Vision and Pattern Recognition, Minneapolis, MN, USA, 17–22 June 2007; pp. 1–8. [Google Scholar] [CrossRef]
  44. Zhang, H.; Xue, J.; Dana, K. Deep TEN: Texture Encoding Network. In Proceedings of the 2017 IEEE Conference on Computer Vision and Pattern Recognition (CVPR), Honolulu, HI, USA, 21–26 July 2017; pp. 2896–2905. [Google Scholar] [CrossRef]
  45. Zhang, R.; Kikui, G.; Sumita, E. Subword-based Tagging by Conditional Random Fields for Chinese Word Segmentation. In Proceedings of the Human Language Technology Conference of the NAACL, Companion Volume: Short Papers, New York, NY, USA, 4–9 June 2006; Moore, R.C., Bilmes, J., Chu-Carroll, J., Sanderson, M., Eds.; Association for Computational Linguistics: Stroudsburg, PA, USA, 2006; pp. 193–196. [Google Scholar]
  46. Howard, A.G.; Zhu, M.; Chen, B.; Kalenichenko, D.; Wang, W.; Weyand, T.; Andreetto, M.; Adam, H. MobileNets: Efficient Convolutional Neural Networks for Mobile Vision Applications. arXiv 2017, arXiv:1704.04861. [Google Scholar]
  47. Krizhevsky, A.; Sutskever, I.; Hinton, G.E. ImageNet classification with deep convolutional neural networks. Commun. ACM 2012, 60, 84–90. [Google Scholar] [CrossRef]
  48. Lin, T.Y.; Goyal, P.; Girshick, R.; He, K.; Dollár, P. Focal Loss for Dense Object Detection. In Proceedings of the 2017 IEEE International Conference on Computer Vision (ICCV), Venice, Italy, 22–29 October 2017; pp. 2999–3007. [Google Scholar] [CrossRef]
  49. Conneau, A.; Khandelwal, K.; Goyal, N.; Chaudhary, V.; Wenzek, G.; Guzmán, F.; Grave, E.; Ott, M.; Zettlemoyer, L.; Stoyanov, V. Unsupervised Cross-lingual Representation Learning at Scale. In Proceedings of the 58th Annual Meeting of the Association for Computational Linguistics, Online, 5–10 July 2020; Jurafsky, D., Chai, J., Schluter, N., Tetreault, J., Eds.; Association for Computational Linguistics: Stroudsburg, PA, USA, 2020; pp. 8440–8451. [Google Scholar] [CrossRef]
  50. Wang, J.; Jin, L.; Ding, K. LiLT: A Simple yet Effective Language-Independent Layout Transformer for Structured Document Understanding. In Proceedings of the 60th Annual Meeting of the Association for Computational Linguistics (Volume 1: Long Papers), Dublin, Ireland, 22–27 May 2022; Muresan, S., Nakov, P., Villavicencio, A., Eds.; Association for Computational Linguistics: Stroudsburg, PA, USA, 2022; pp. 7747–7757. [Google Scholar] [CrossRef]
  51. Zhang, Y.; Bo, Z.; Wang, R.; Cao, J.; Li, C.; Bao, Z. Entity Relation Extraction as Dependency Parsing in Visually Rich Documents. In Proceedings of the 2021 Conference on Empirical Methods in Natural Language Processing, Punta Cana, Dominican Republic, 7–11 November 2021; Moens, M.F., Huang, X., Specia, L., Yih, S.W.t., Eds.; Association for Computational Linguistics: Stroudsburg, PA, USA, 2021; pp. 2759–2768. [Google Scholar] [CrossRef]
Figure 1. (a) An example of a Chinese medical examination report document; (b) example of the result of the table structure reconstruction for table body only; (c) example of the final extracted result of the method in this paper.
Applsci 14 01668 g001
Figure 2. Overall flow diagram of structured information extraction. Among them, DBNet++ [14] is used for text detection and CRNN [15] is used for text recognition.
Applsci 14 01668 g002
Figure 3. Overall architecture of refined visual-feature independent LayoutXLM (RVI-LayoutXLM).
Applsci 14 01668 g003
Figure 4. (a) is a single self-attention refinement layer; (b) is the attention refinement module; (c) is the overall architecture of the multi-attention refinement module. The multi-attention refinement module is made up of several self-attention refinement layers. Each layer is created by adding a refinement module to the traditional Attention mechanism.
Applsci 14 01668 g004
Figure 5. Relevant intra-layer fine-tuned detection network (RIFD-Net) architecture.
Applsci 14 01668 g005
Figure 6. RIFD-Net backbone architecture. k denotes the convolution kernel size, s denotes the step size, p is the padding, and c denotes the output channel size. C 3 is composed of the basic convolution block with a k of 1, and bottleneck, which consists of the basic convolution block with k = 1 , 3 and optional additive modules.
Applsci 14 01668 g006
Figure 7. Detailed architecture of the DMLP network.
Applsci 14 01668 g007
Figure 8. LREM architecture.
Applsci 14 01668 g008
Figure 9. Statistical chart of the number of entities in the 11 categories in the training and test sets.
Applsci 14 01668 g009
Figure 10. Some results of Chinese medical examination report dataset (CMERD) annotations; (a) is the annotated medical examination repor (MER) image sample; (b) is the label sample of the MER image; (c) denotes semantic entity recognition (SER) label results; (d) denotes relationship extraction (RE) label results; (e) is the sample of the minimum bounding rectangular box for each row of entities for additional annotations; (f) denotes a sample of associated entity detection training labels.
Applsci 14 01668 g010
Figure 11. An example of a MER document image. Top: class descriptions and text translation of some areas in the image. Bottom: color legend for the classes.
Applsci 14 01668 g011
Figure 12. Comparison of F1 results obtained through 5-fold cross-validation on CMERD for different KIE models; (a) is the comparison of F1 results obtained through 5-fold cross-validation for the SER task; (b) is the comparison of F1 results obtained through 5-fold cross-validation for the RE task.
Applsci 14 01668 g012
Figure 13. Results of the two-sample t-test for F1 scores obtained through 5-fold cross-validation on the CMERD dataset for different KIE models; (a) results of the two-sample t-test for the SER task; (b) results of the two-sample t-test for the RE task.
Applsci 14 01668 g013
Figure 14. Comparison of recognition accuracy for different loss functions on the SER task.
Applsci 14 01668 g014
Figure 15. SER task visualization results for the three datasets.
Applsci 14 01668 g015
Figure 16. RE task visualization results for the three datasets.
Applsci 14 01668 g016
Figure 17. Detailed results of the associated entity detection stage on the CMERD dataset.
Applsci 14 01668 g017
Figure 18. Result of the integration of the CMERD table body coordinate.
Applsci 14 01668 g018
Figure 19. Visualization results of the structured information exported to Excel.
Applsci 14 01668 g019
Table 1. The list of data from the XFUND dataset.
LanguageSplitHeaderQuestionAnswerOtherTotal
ZHtraining set22936924641166610,228
test set58125317325863629
JAtraining set1502397383626409005
test set58726128013323383
EStraining set25330134254392911,449
test set90909121811963413
FRtraining set1832497342727098816
test set6661023128111313501
ITtraining set16637624932335512,215
test set651230159911354029
DEtraining set1552609399218768632
test set5985813226502889
PTtraining set18535105428253111,654
test set59128819408824196
Table 2. Evaluation results of multimodal models with key information extraction subtasks for the SER and RE tasks.
TaskModelModalityF1 (%)P (%)R (%)
SERLayoutLM [12]Text + Layout95.4195.6195.22
LayoutLMv2 [22]Text + Layout + Image96.7396.6496.84
LayoutXLM [23]Text* + Layout + Image96.7496.3197.18
VI-LayoutXLM [29]Text* + Layout97.0896.7597.41
RVI-LayoutXLM (Ours)Text* + Layout97.3897.0197.76
RELayoutLMv2 [22]Text + Layout + Image89.0285.7392.58
LayoutXLM [23]Text* + Layout + Image93.2293.9792.49
VI-LayoutXLM [29]Text* + Layout95.2295.4095.04
RVI-LayoutXLM (Ours)Text* + Layout95.7795.7595.80
Text* indicates that the pre-trained model was obtained by training on the multilingual dataset.
Table 3. Comparison between image modalities and loss functions. The results presented in this table are the average values obtained from multiple experiments.
TaskModelF1 (%)P (%)R (%)
SERRVI-LayoutXLM97.3897.0197.76
RVI-LayoutXLM + Image96.0596.5497.35
RVI-LayoutXLM + Image + Focal Loss96.6497.0497.56
RVI-LayoutXLM +  Focal Loss97.6297.0398.22
RERVI-LayoutXLM95.2795.7595.80
RVI-LayoutXLM + Image94.5194.2794.75
Table 4. Comparison with existing published models on the FUNSD and XFUNDzh datasets. The data reported in this table represent the mean values calculated from several experimental runs.
TaskModelModalityFUNSD (F1%)XFUNDzh (F1%)
SERBERT [20]Text60.26-
LayoutLM [12]Text + Layout79.27-
XLM-RoBERTa [49]Text*66.7087.74
InfoXLM [27]Text*68.5288.68
BROS [21]Text + Layout83.05-
LiLT [50]Text* + Layout88.4189.38
StrucTexT [25]Text + Layout + Image83.09-
LayoutLMv2 [22]Text + Layout + Image82.7685.44
LayoutXLM [23]Text* + Layout + Image89.5089.24
XYLayoutLM [28]Text + Layout + Image83.3591.76
VI-LayoutXLM [29]Text* + Layout87.7990.46
RVI-LayoutXLM (Ours)Text* + Layout89.5791.92
REBERT [20]Text27.65-
LayoutLM [12]Text + Layout45.86-
XLM-RoBERTa [49]Text*26.5951.05
InfoXLM [27]Text*29.2052.14
SERA [51]Text + Layout65.96-
BROS [21]Text + Layout71.46-
LiLT [50]Text* + Layout62.7672.97
LayoutLMv2 [22]Text + Layout + Image42.9167.77
LayoutXLM [23]Text* + Layout + Image54.8370.73
XYLayoutLM [28]Text + Layout + Image-74.45
VI-LayoutXLM [29]Text* + Layout74.8783.92
RVI-LayoutXLM (Ours)Text* + Layout76.3585.01
The winner is in bold. Text* indicates that the pre-trained model was obtained by training on the multilingual dataset.
Table 5. Comparison of evaluation results of different object detection models on CMERD.
ModelBackbonemAP@.5mAP@.5-.95mAP@.75
Faster-RCNN [32]Swim97.31%70.82%77.62%
YOLOv3 [34]Darknet-5387.30%60.87%68.43%
YOLOv4 [35]CSPDarknet-5387.64%65.19%70.52%
YOLOv5-s [36]CSPDarknet-5392.35%67.94%73.28%
YOLOX-s [37]CSPDarknet96.21%72.23%78.94%
PPYOLOE-s [38]CSPResnet95.21%63.07%75.93%
RIFD-Net (Ours)CSPDarknet + IFAM98.26%74.00%81.10%
Disclaimer/Publisher’s Note: The statements, opinions and data contained in all publications are solely those of the individual author(s) and contributor(s) and not of MDPI and/or the editor(s). MDPI and/or the editor(s) disclaim responsibility for any injury to people or property resulting from any ideas, methods, instructions or products referred to in the content.

