Article

Performance Characterization and Evaluation of Innovative Cement Mortars and Concretes Made with Recycled EPS

DICATECh Department, Polytechnic of Bari, Via Orabona, 4, 70125 Bari, Italy
*
Author to whom correspondence should be addressed.
Appl. Sci. 2024, 14(4), 1583; https://doi.org/10.3390/app14041583
Submission received: 11 January 2024 / Revised: 11 February 2024 / Accepted: 14 February 2024 / Published: 16 February 2024
(This article belongs to the Special Issue Applications of Waste Materials and By-Products in Concrete)

Abstract

:
The construction industry involves some of the activities with the highest consumption of raw materials and significant waste production. According to the European Commission, it requires large quantities of resources, representing approximately 50% of all extracted materials, and accounting for over 35% of the EU’s total waste production. In particular, the production and use of concrete, as well as that of EPS (expanded polystyrene), largely exploited for energy-efficient buildings, involve a substantial amount of extracted raw materials and waste. This study focuses on the development of construction materials, such as lightweight and thermally efficient mortars and concretes, incorporating recycled EPS (R-EPS) instead of fine aggregates. Mixtures were designed by partially or completely replacing the fine aggregate with R-EPS on a volume basis. All designed mortars exhibit compressive strength exceeding the minimum values required by Italian legislation and show thermal performance improvements of up to 89.49% compared to the reference mortar. Similarly, the concretes demonstrate strengths compliant with regulations and exhibit thermal characteristic enhancements, ranging from 27.68% for structural lightweight mixes to 74.58% for non-structural ones.

1. Introduction

In recent years, waste management issues have become highly relevant in boosting a model of development and consumption that prioritizes sustainability in the use of new resources and energy [1,2,3,4,5]. The construction industry involves some of the activities with the highest consumption of raw materials, along with significant waste production [6,7,8,9,10,11,12,13]. According to the European Commission, the built environment requires large quantities of resources and accounts for approximately 50% of all extracted materials. The construction sector is responsible for over 35% of the total waste production in the EU. It is estimated that greenhouse gas emissions resulting from material extraction, construction product manufacturing, and building construction and renovation contribute to 5–12% of the total national greenhouse gas emissions [14].
Specifically, according to data from the Global Cement and Concrete Association, global concrete production amounts to approximately 14 × 1013 m3/year. This massive utilization leads to the predominant extraction of raw materials for cement and concrete aggregates, making them the most extracted mineral resources globally [15,16]. Consequently, the need to reduce extraction from non-renewable sources becomes an essential imperative to safeguard natural ecosystems for future generations [17,18,19].
Similarly, expanded polystyrene (EPS), used as packaging or thermal insulation in 85% of cases, generates a significant amount of plastic waste [20,21]. Globally, approximately 32.7 × 10⁹ kg/year of EPS is generated [22]. The widespread use of plastic in construction/building applications, particularly EPS, necessitates the adoption of new environmentally friendly approaches to optimize production processes and reduce by-product generation [23,24]. In this context, recycling operations emerge as crucial tasks to improve the sustainability of a material that can be transformed into a new resource, commonly referred to as secondary raw material. In this regard, expanded polystyrene, widely used for its low cost, versatility, and performance properties, is completely recyclable [25].
Furthermore, in recent years, the construction sector has experienced a significant increase in energy consumption, currently contributing to approximately 40% of the total primary energy consumption in the United States and the European Union. This trend has emphasized the importance of designing, constructing, and managing buildings efficiently to achieve a net-zero energy balance. This goal is crucial for addressing the energy crisis, reducing climate-altering emissions, and mitigating serious environmental threats [26]. This is particularly relevant considering the climate change, involving a long-term increase in global energy demand [27].
Numerous studies and experiments have focused on the use of sustainable raw materials, particularly the valorization and reuse of waste materials in the production of mortars and cements. This approach aims to optimize the properties of construction materials, especially mechanical and thermal ones, while reducing the extraction and use of raw materials and minimizing landfill waste disposal [28,29,30,31,32,33,34,35,36,37,38,39,40,41,42,43]. In various studies, waste products, such as fly ash (FA) [28,32], plastic waste [33], green pozzolan (GP) [34], waste paper sludge ash (WPSA) [35], food waste [36,40], and wood biomass ash (WBA—wood bottom ash) from power plants [38,39] have been added to concrete or mortar mixes. The use of EPS and recycled expanded polystyrene (R-EPS), as a replacement for aggregate in concrete and mortar formulations, has been extensively experimented with, successfully achieving lightweight and thermally efficient mortars. Lightweight concrete with EPS has been proposed for several decades. EPS is used to reduce the structural weight of materials for both on-site and prefabricated constructions, resulting in improved thermal and acoustic insulation. The experiments involve the partial replacement of both fine and coarse aggregates with EPS beads. The EPS content in concrete and mortar mixtures can vary from partial replacement to complete replacement (100%). Mechanical performance, particularly compressive strength, progressively and linearly decreases with the increasing percentage of replaced EPS. Additionally, discussions have covered the performance related to moisture insulation, thermal insulation, and acoustic insulation of the material. The primary advantages arising from the adoption of EPS concrete in civil engineering works are not only the reduced own weight but also enhanced thermal and acoustic insulation performance. This is crucial, as the construction and building sectors consume a significant amount of energy, and this material could contribute to reducing it. In general, concretes with thermal insulation characteristics must have very low densities. Lower densities result in higher porosities, and larger air gaps lead to improved insulation performance. Thermal conductivity is directly proportional to concrete density. These materials, with high thermal insulation, can also be applied to plaster mortars to reduce heat transfer in walls with plaster finishes in buildings. Recently, many similar studies have been conducted using recycled EPS waste in concretes, with the aim of reducing environmental impacts [44,45,46,47,48,49,50,51,52,53]. Mixtures containing R-EPS can be effectively used in prefabricated components in the building sector. This is particularly relevant, given that prefabrication of elements and the automation of on-site construction techniques are recognized as fundamental requirements to ensure the economic, social, and environmental sustainability of the building sector, both for new constructions and renovations [54,55]. Moreover, several authors have addressed the issue of energy optimization of prefabricated building components, focusing on the selection of sustainable materials and the development of high-performance insulation solutions, including R-EPS [56,57,58,59,60]. These approaches consider the life cycle of the material and adopt principles of circular economy.
With reference to the outlined topics, this contribution describes the research by addressing the following objectives:
  • Reducing the quantities of extracted raw materials, such as sand, for the production of mortars and cements.
  • Reducing the amount of EPS waste disposed of in landfills.
  • Testing construction materials with improved thermal performance that contribute to the reduction in the energy demand of buildings.
These objectives have been addressed by this study throught the experimentation of innovative mixtures for the production of mortars and concretes. It involves the substitution of parts of aggregate with R-EPS to enhance thermo-energetic performance and utilize innovative materials, thus recovering waste from the supply chain.
The innovation in this study lies in the approach to mix design, as well as the assessment of the resulting characteristics. These characteristics have been compared with current Italian regulations, identifying potential applications for the experimented products within the construction sector, considering the performances for each mixture. The aim is to guide the industry of construction and building materials towards innovative solutions for the production of more sustainable mortars and cements through the use and valorization of R-EPS.

2. Materials and Methods

2.1. Characterization of Raw Materials and Mix Design for Mortars

The raw materials used in the production of mortars are listed below, along with the standard codes by which they have been characterized:
  • Portland cement CEM I 52,5 R, conforming to the prescribed composition of UNI EN 197-1:2011 [61];
  • Water: as required in UNI EN 1008:2003 [62];
  • Aggregates: use of natural standard sand (according to CEN EN 196-1 [63]) and sieved sand in three specific size fractions (Ø 1–2 mm, 2–4 mm and 4–6 mm);
  • Recycled EPS: polystyrene beans resulting from grinding of industrial scraps, sifted in the sieve fractions 1–2 mm, 2–4 mm and 4–6 mm.
On this basis, the composition of mortars was formulated by replacing fine aggregate volume (sand)—partial or total aggregate—with recycled R-EPS grains.
The mortar selected as reference for the sampling and the testing phases is the reference mortar, as introduced by UNI EN 196-1. The identification of samples M2, M3, M4, M5, M6, M7, and M8 was conducted in accordance with the percentages indicated in Table 1, and with a water–cement ratio of 0.5.
Table 2 displays the quantity of each material used for each tested mixture.

2.2. Characterization of Raw Materials and Mix Design for Concretes

The raw materials used in the production of concrete are listed below, along with the standard codes by which they have been characterized:
  • Portland cement CEM I 52,5 R, as in Section 2.1;
  • Water: as in item 2.1;
  • Aggregates: use of natural sand, as in Section 2.1, and gravel (according to UNI EN 12620 [64]) in specific size fractions, as indicated in Table 3, and with the following mixture: sand 100 kg/mc, gravel 730 kg/mc;
  • Recycled EPS: polystyrene beans resulting from grinding of industrial scraps. In Table 4, the granulometric analysis is presented.
In order to propose the use of recycled R-EPS as a lightweight material in concrete, its apparent density was calculated according to the APPENDIX B of UNI 10667-12:2021 [65] standard. The test showed an apparent density equal to 15.2 kg/mc.
In reference to the mix design of concrete with a characteristic compressive strength (Rck) of 35 N/sqmm, the experimental process involved progressively replacing the volume of sand with recycled expanded polystyrene (R-EPS). The experimental setup included the preparation of 11 mixtures:
  • S0, which corresponds to the mix design for concrete with Rck of 35 N/sqmm, considered as the reference.
  • Mixtures from S1 to S4 with R-EPS, volumetrically replacing increasing percentages of sand across the entire particle size distribution, as shown in Table 5.
  • Mixtures from S5 to S10 with R-EPS, volumetrically replacing parts of the particle size distribution of sand (particle sizes 1–2 mm, 2–4 mm, and 4–8 mm), as illustrated in Table 5.
Table 6 displays the quantity of each material used for each tested mixture.
The experimental procedure, both for mortars and concretes, employs two distinct approaches: the incorporation of ground R-EPS, volumetrically replacing increasing percentages of sand across the entire particle size distribution; the introduction of R-EPS through volumetric substitution of specific particle size ranges of sand. Both approaches are utilized in similar studies [29,30,31,32,33,34,35,36,37,38,39,40,41,42,43,44,45,46,47,48,49,50,51,52,53], mainly focusing on the first approach.
During the experimental phase, in order to increase the cohesion of polystyrene granules with the binding agent (cement), the granules have been hydrophilized. The highest hydrophilization level is reached within the first 5 min. The R-EPS underwent the addition of a hydrophobizing agent approximately 30 min before the preparation of the mixtures (Figure 1).
A superplasticizer additive for high-strength concrete was used, and the standard quantity for each mixture was calculated. Additionally, a range (minimum and maximum) was determined to ensure optimal workability conditions for the hypothesized mixtures. Workability optimization was necessary for all mixtures to achieve a consistency class of S5.
The sand used in the mixtures underwent a drying process in an oven (T = 200 °C for 2–3 h). After the drying phase, it was cooled, weighed, measured, and screened as needed, according to the established quantities.
In the preparation of each mixture, the same mixing order was consistently maintained, as follows:
1. Aggregates; 2. Cement; 3. Water drawn from the water supply (fixed water-to-cement ratio, w/c = 0.55); 4. R-EPS previously treated with a segregating agent before mixing activities; 5. Superplasticizer additive (at the standard dosage, added after at least 1 min of mixing); 6. Potential addition of an additional superplasticizer additive, in dosages aimed at improving workability and, in any case, up to the maximum allowed. This addition was always made after at least 4–5 min of mixing the mixture.

2.3. Experimentation Activity

The experimentation activity was carried out to identify the performance resulting from the use of R-EPS in the production of lighter mortars and concretes for the construction industry. For this purpose, therefore, the materials necessary for the experimentation were first characterized and then aggregated according to the designed mix designs, as described in Section 2.1 and Section 2.2.
For all prepared mixtures, whether for mortar or concrete production, during the mixing phase, as soon as the desired workability was achieved, the flow test was immediately conducted, followed by the preparation of specimens for mechanical and thermal characterization tests. The curing of all specimens was carried out according to UNI EN 12390-2:2002 [66].
For mortars, workability was determined in accordance with UNI 7044:1972 [67], using the shaking table, while for concretes, the mix flowability was measured using the Abrams cone, according to the procedure outlined in EN 12350-2 [68]. Three specimens were prepared and tested for each mixture (Figure 2).
Regarding the thermal property measurements, all samples, three for each mixture, with dimensions of 175 × 150 × 30 mm, were initially dried in an oven at 50 °C until reaching constant mass ±0.5%. Thus, they were cooled to room temperature, 20 °C, in laboratory desiccators containing silica gel. Thermal conductivity measurements at dry conditions (λdry [W/mK]) and thermal diffusivity at dry conditions (αdry [m2/s]) were then acquired using an ISOMET 2104 apparatus from Applied Precision. The equipment operates a dynamic thermal measurement using the flat-source method (Figure 3).
The vapor permeability measurement was conducted using a wet cup method in a Perani AC520 climatic cell (T = 23 °C; R.H. = 50%), following the standard UNI EN 1015-19:2008 [69]. Cylindrical specimens with a diameter of 12 cm and a thickness of 1 cm were used for this test (Figure 4). Three specimens were prepared and tested for each mixture. Regarding the mechanical tests for mortars, bending and compressive strength tests were carried out following UNI EN 196-1:2016 [70]. These tests were conducted on prismatic specimens measuring 4 × 4 × 16 cm, prepared in standardized steel molds, and cured according to UNI EN 196-1. In particular, the molds used in the experiment were filled with two successive layers, each compacted with a shaking apparatus. Three specimens were prepared and tested for each mixture.
After hardening (28-day curing), the specimens were demolded and left in the air at 20 °C for a few minutes. The specimens were first subjected to bending tests and then to compression tests on the two resulting specimens (Figure 5).
Regarding the concrete tests, the compressive strength was measured on cubic specimens, prepared in accordance with UNI EN 12390-2 [71], after 28 days of curing. Three specimens were prepared and tested for each mixture. These specimens underwent a crushing test following the guidelines in UNI 12390, parts 3 and 4 [72,73]. At the time of demolding and immersion in the water tank, the laboratory conditions were T = 23 °C and R.H. = 74% (Figure 6).
After the completion of the curing phase, the specimens were measured, weighed, and subjected to the compressive strength test (Figure 7).

3. Results and Discussion

3.1. Mortars

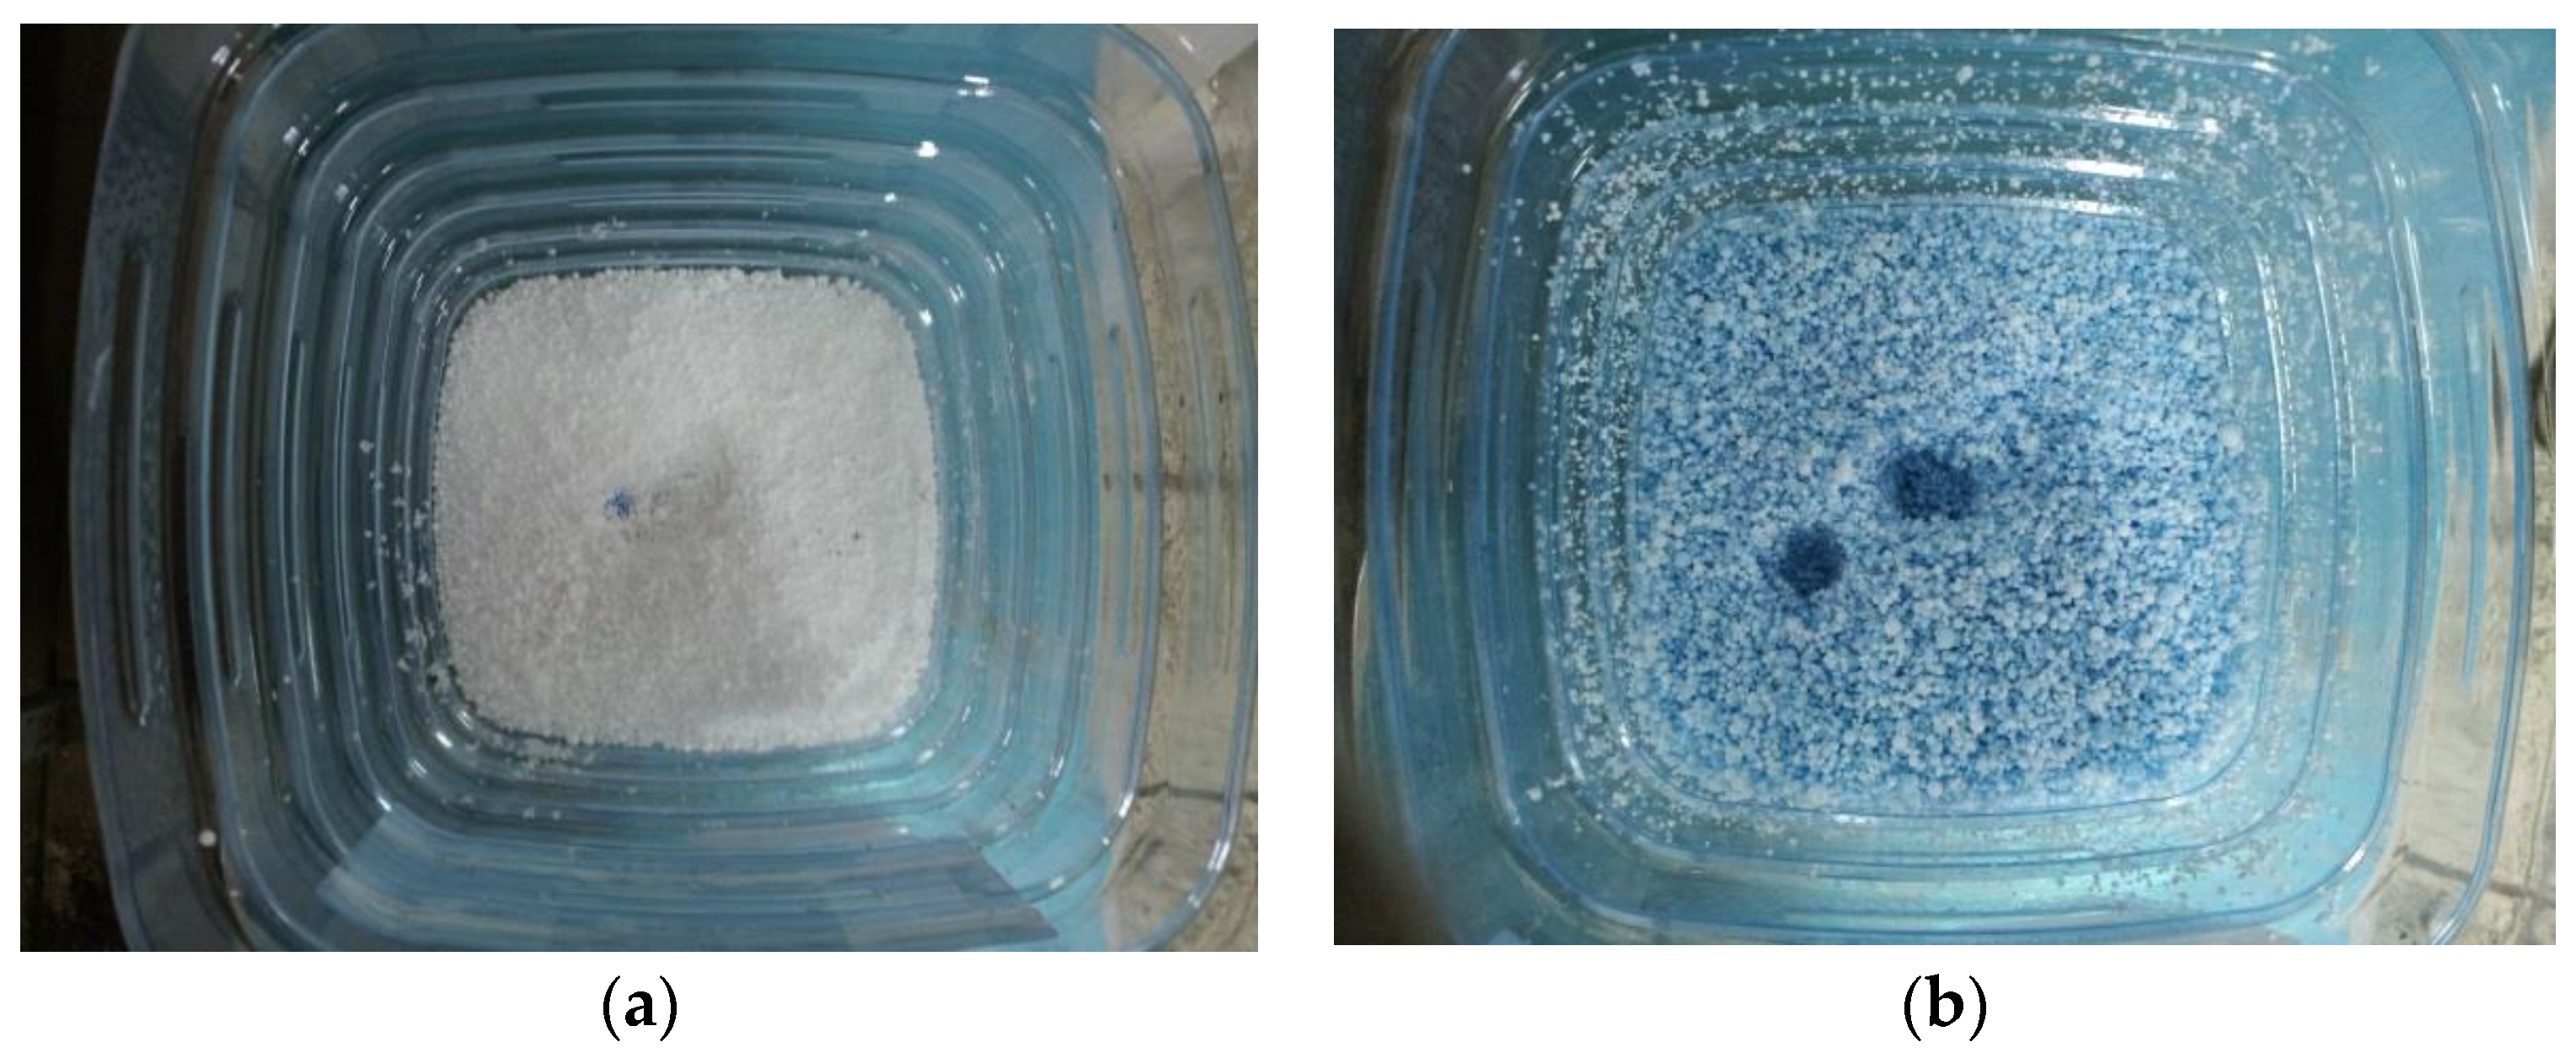
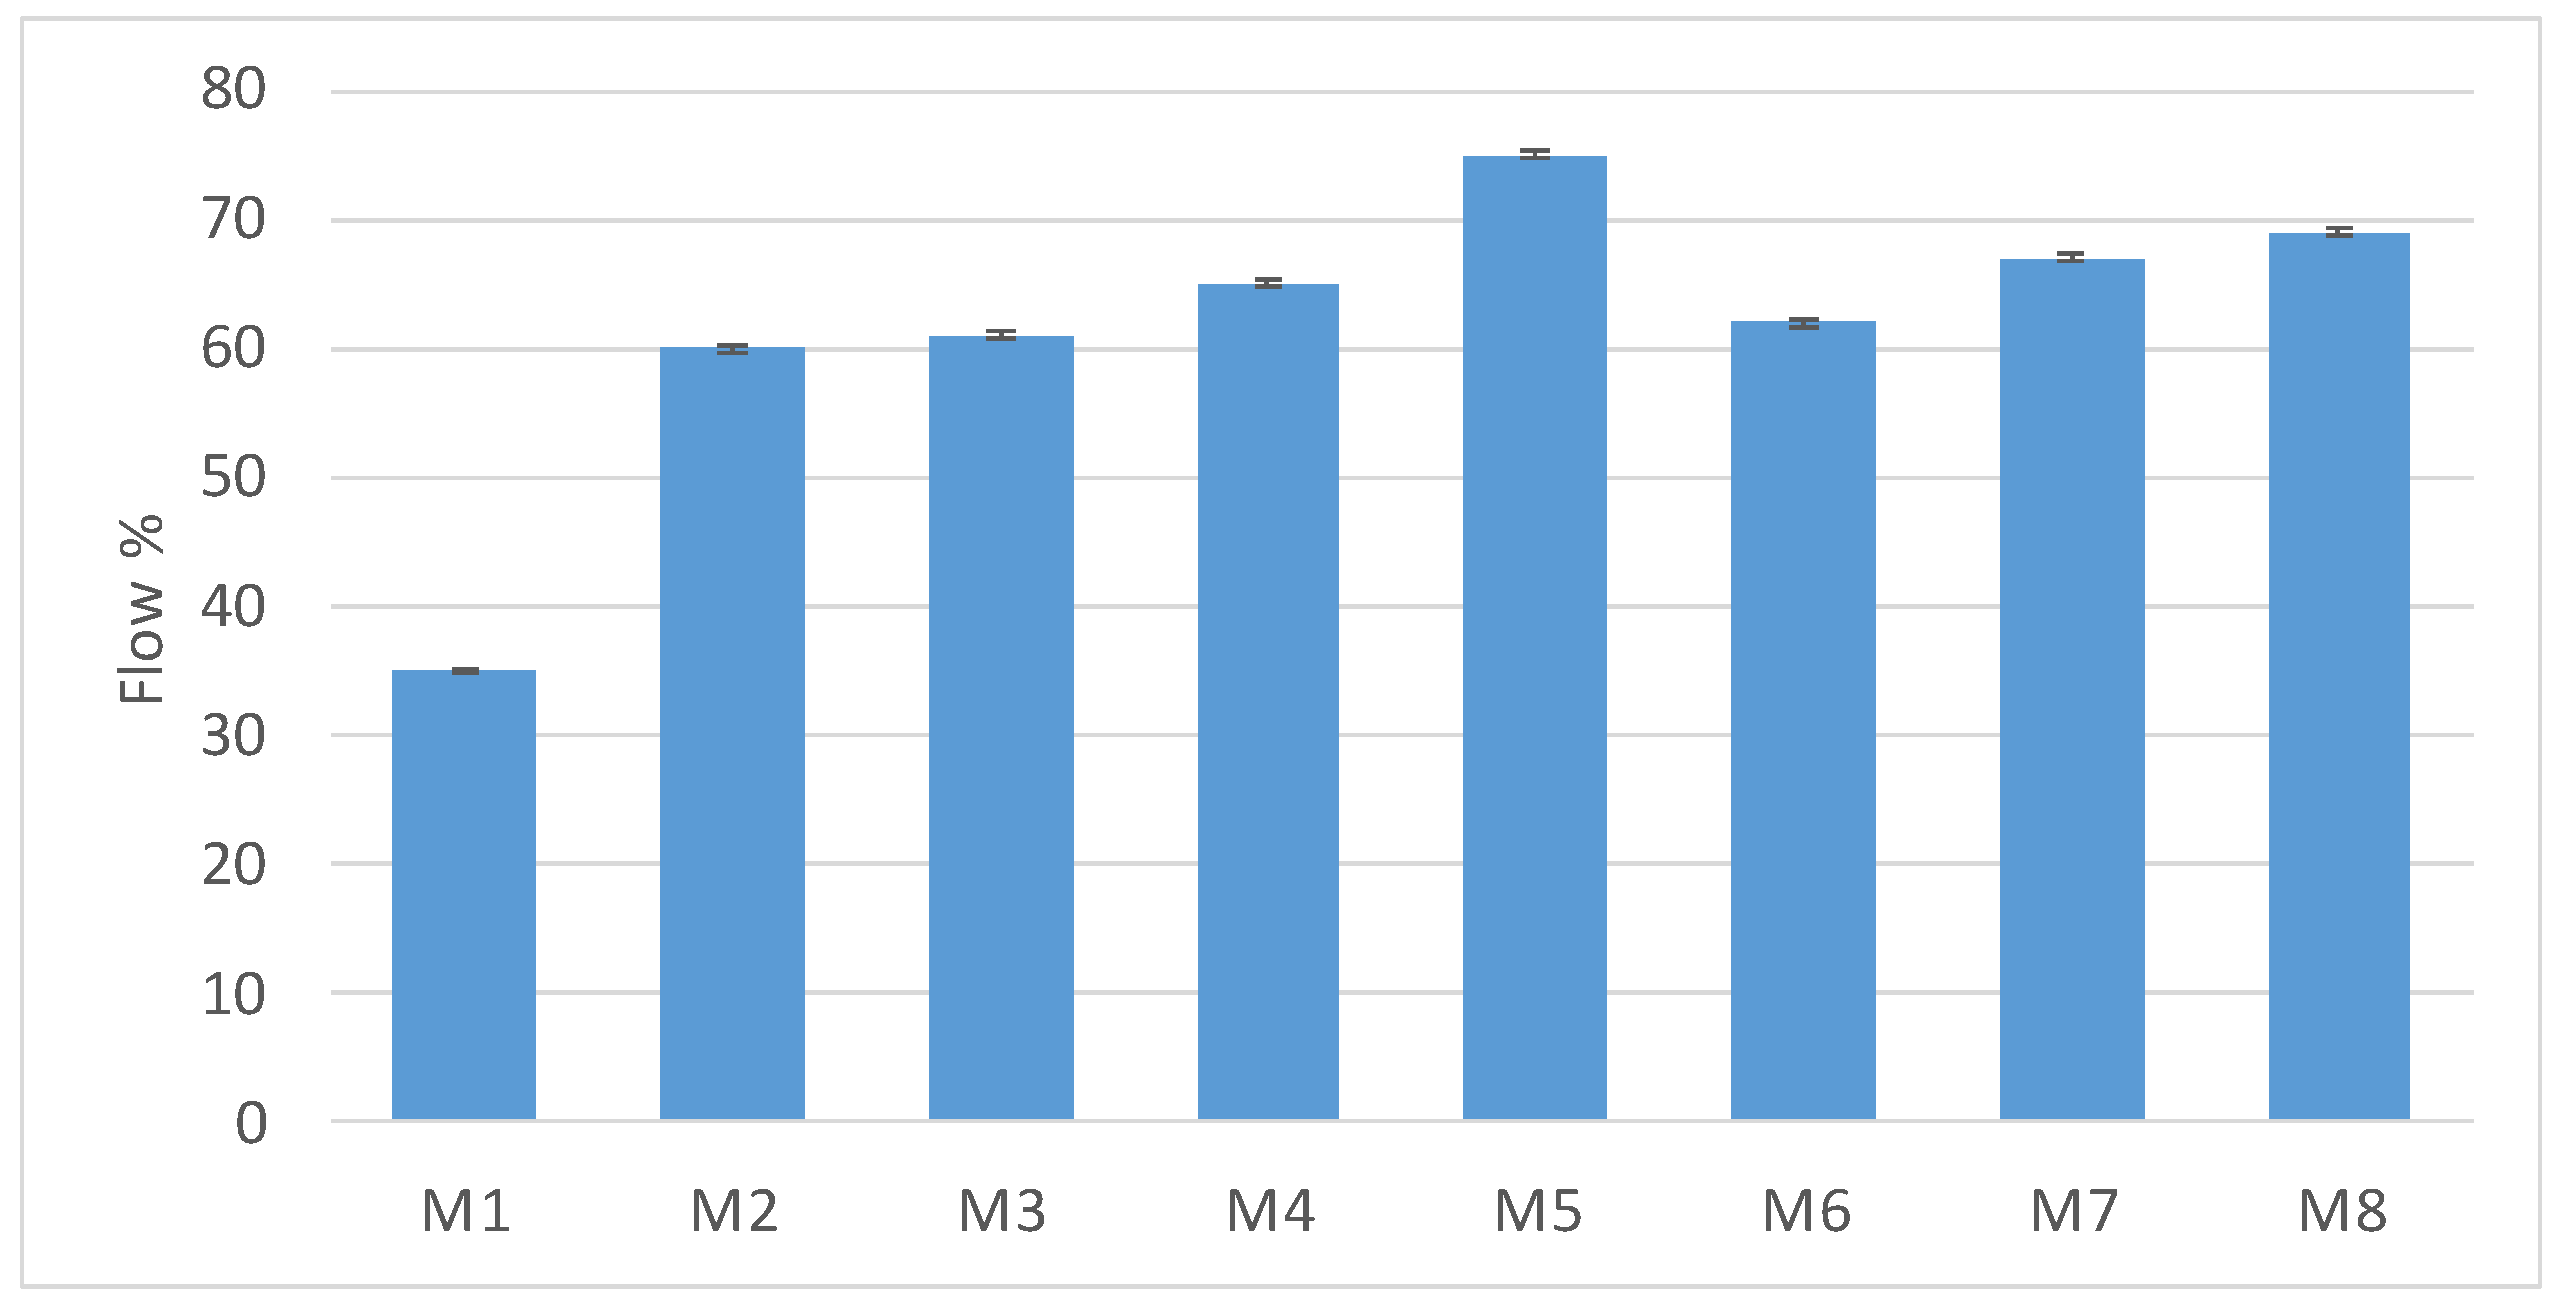
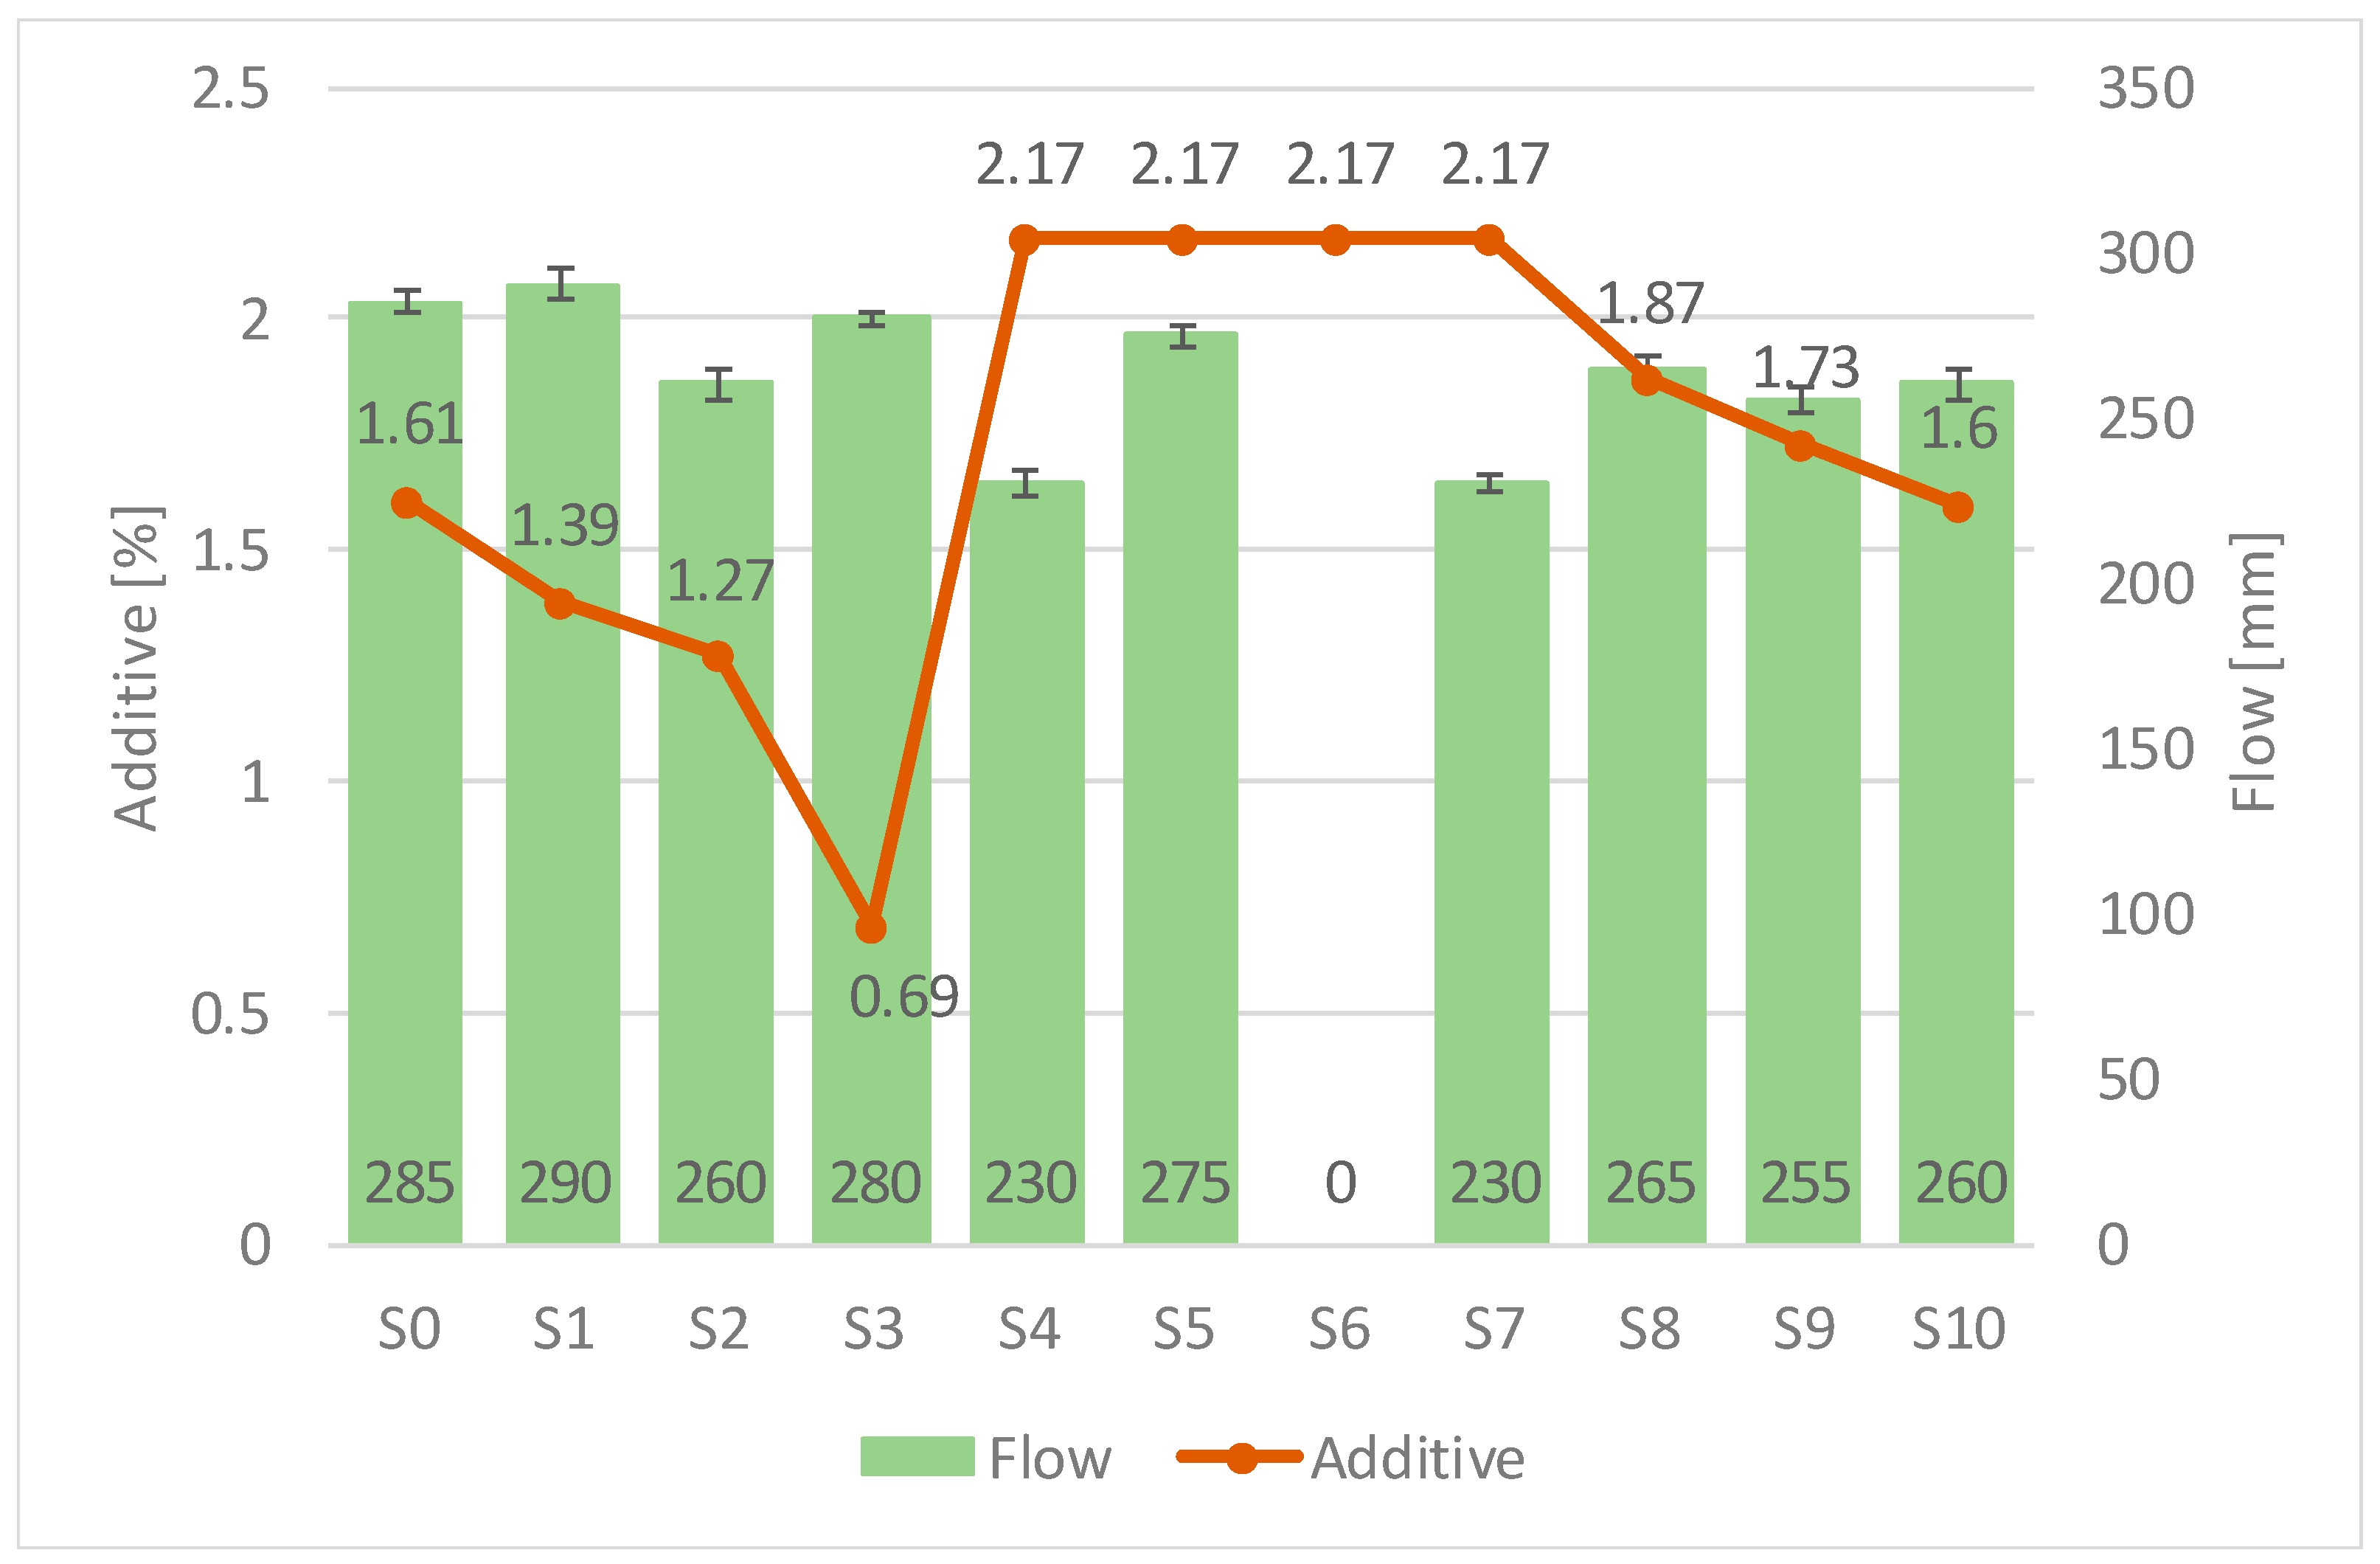
3.1.1. Mortars Workability

Figure 8 displays the results of fresh mortars and their respective percentage spread. From the experimental results, it is observed that the traditional mortar M1 behaves more like a plastic mortar compared to the others, whose behavior is fundamentally fluid.
In relation to this phenomenon, it is observed that, although all specimens are composed of coarse aggregates with a large size (4–6 mm), only specimens M4, M5, M6, M7, and M8 also include fine aggregates (1–2 mm). Additionally, the fraction below 1 mm is not present in any of these mixtures, justifying the reduced aggregations of the proposed blends. Consequently, it can be inferred that an improved hypothesis for the designed mix could involve increasing the dosage of fine aggregates (Ø < 1 mm) or the overall quantity of aggregates in the mixtures.

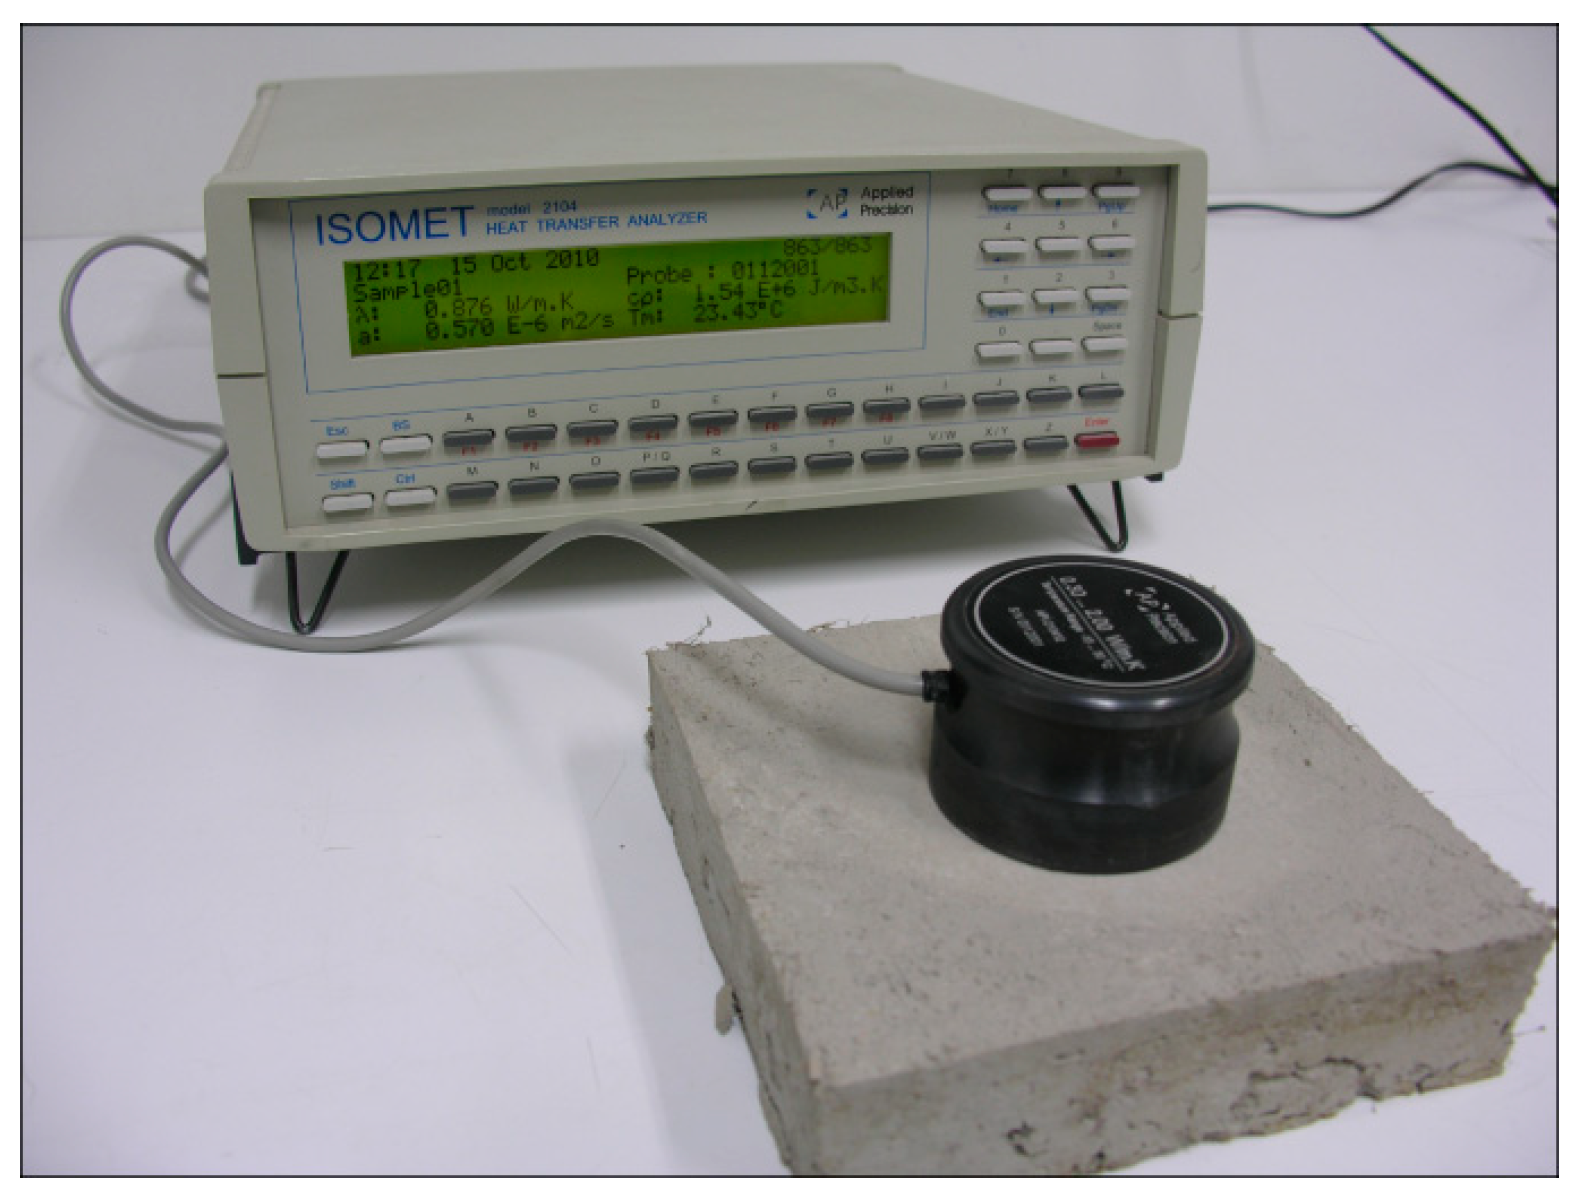
3.1.2. Thermo–Hygrometric Tests

The results of the thermo–hygrometric tests are presented in Table 7 and Table 8, showing their close correlation with the density of the specimens. As the density increases, according to the R-EPS fraction replacing the sand, conductivity (Figure 9) and thermal diffusivity (Figure 10) increase, while vapor permeability (Figure 11) decreases.
The EPS granules contribute to creating air voids within the microstructure of the material, causing an increase in the insulating performance of the end product. Mixtures M1 and M6, without EPS, exhibit higher thermal conductivity values compared to those of the other blends. This is related to the absence of R-EPS within the mixture, leading to a subsequent increase in density.
Comparing mixtures M2, M3, and M4, in which the fine fraction has been completely replaced with R-EPS, it can be observed that specimen M4 has the lowest thermal conductivity value. This data is likely related to the most mixed particle size distribution of R-EPS used in this specimen.

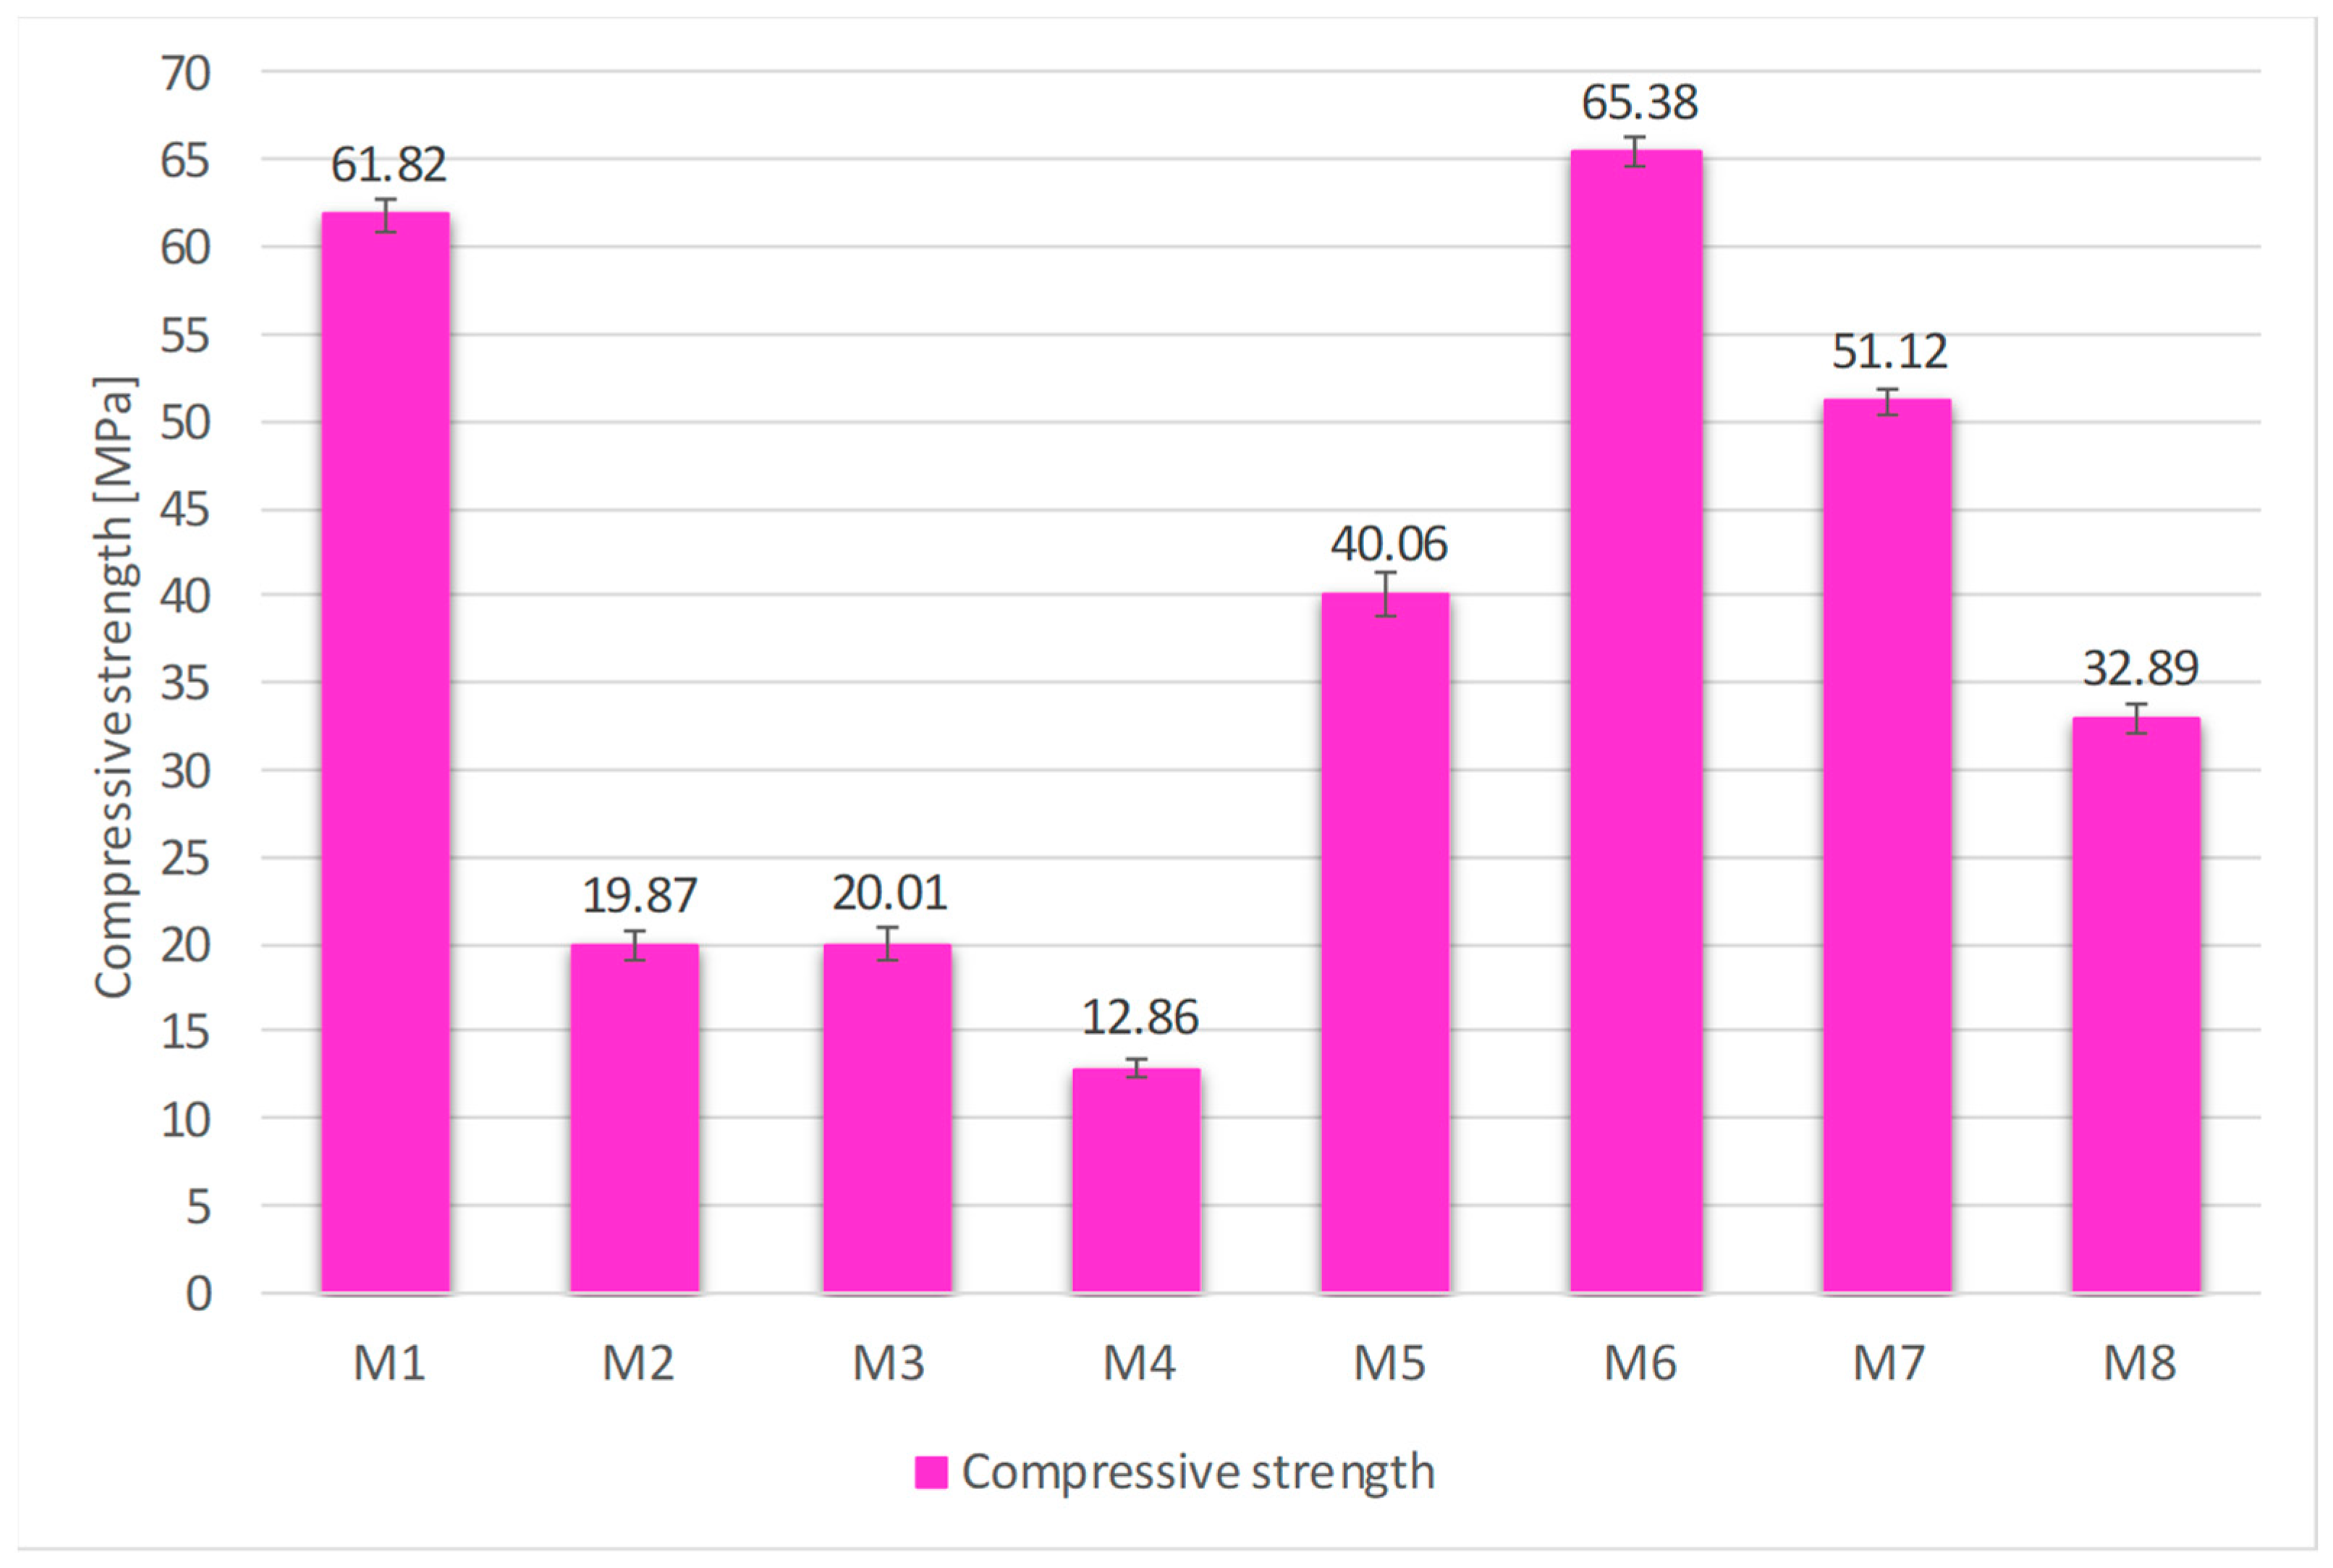
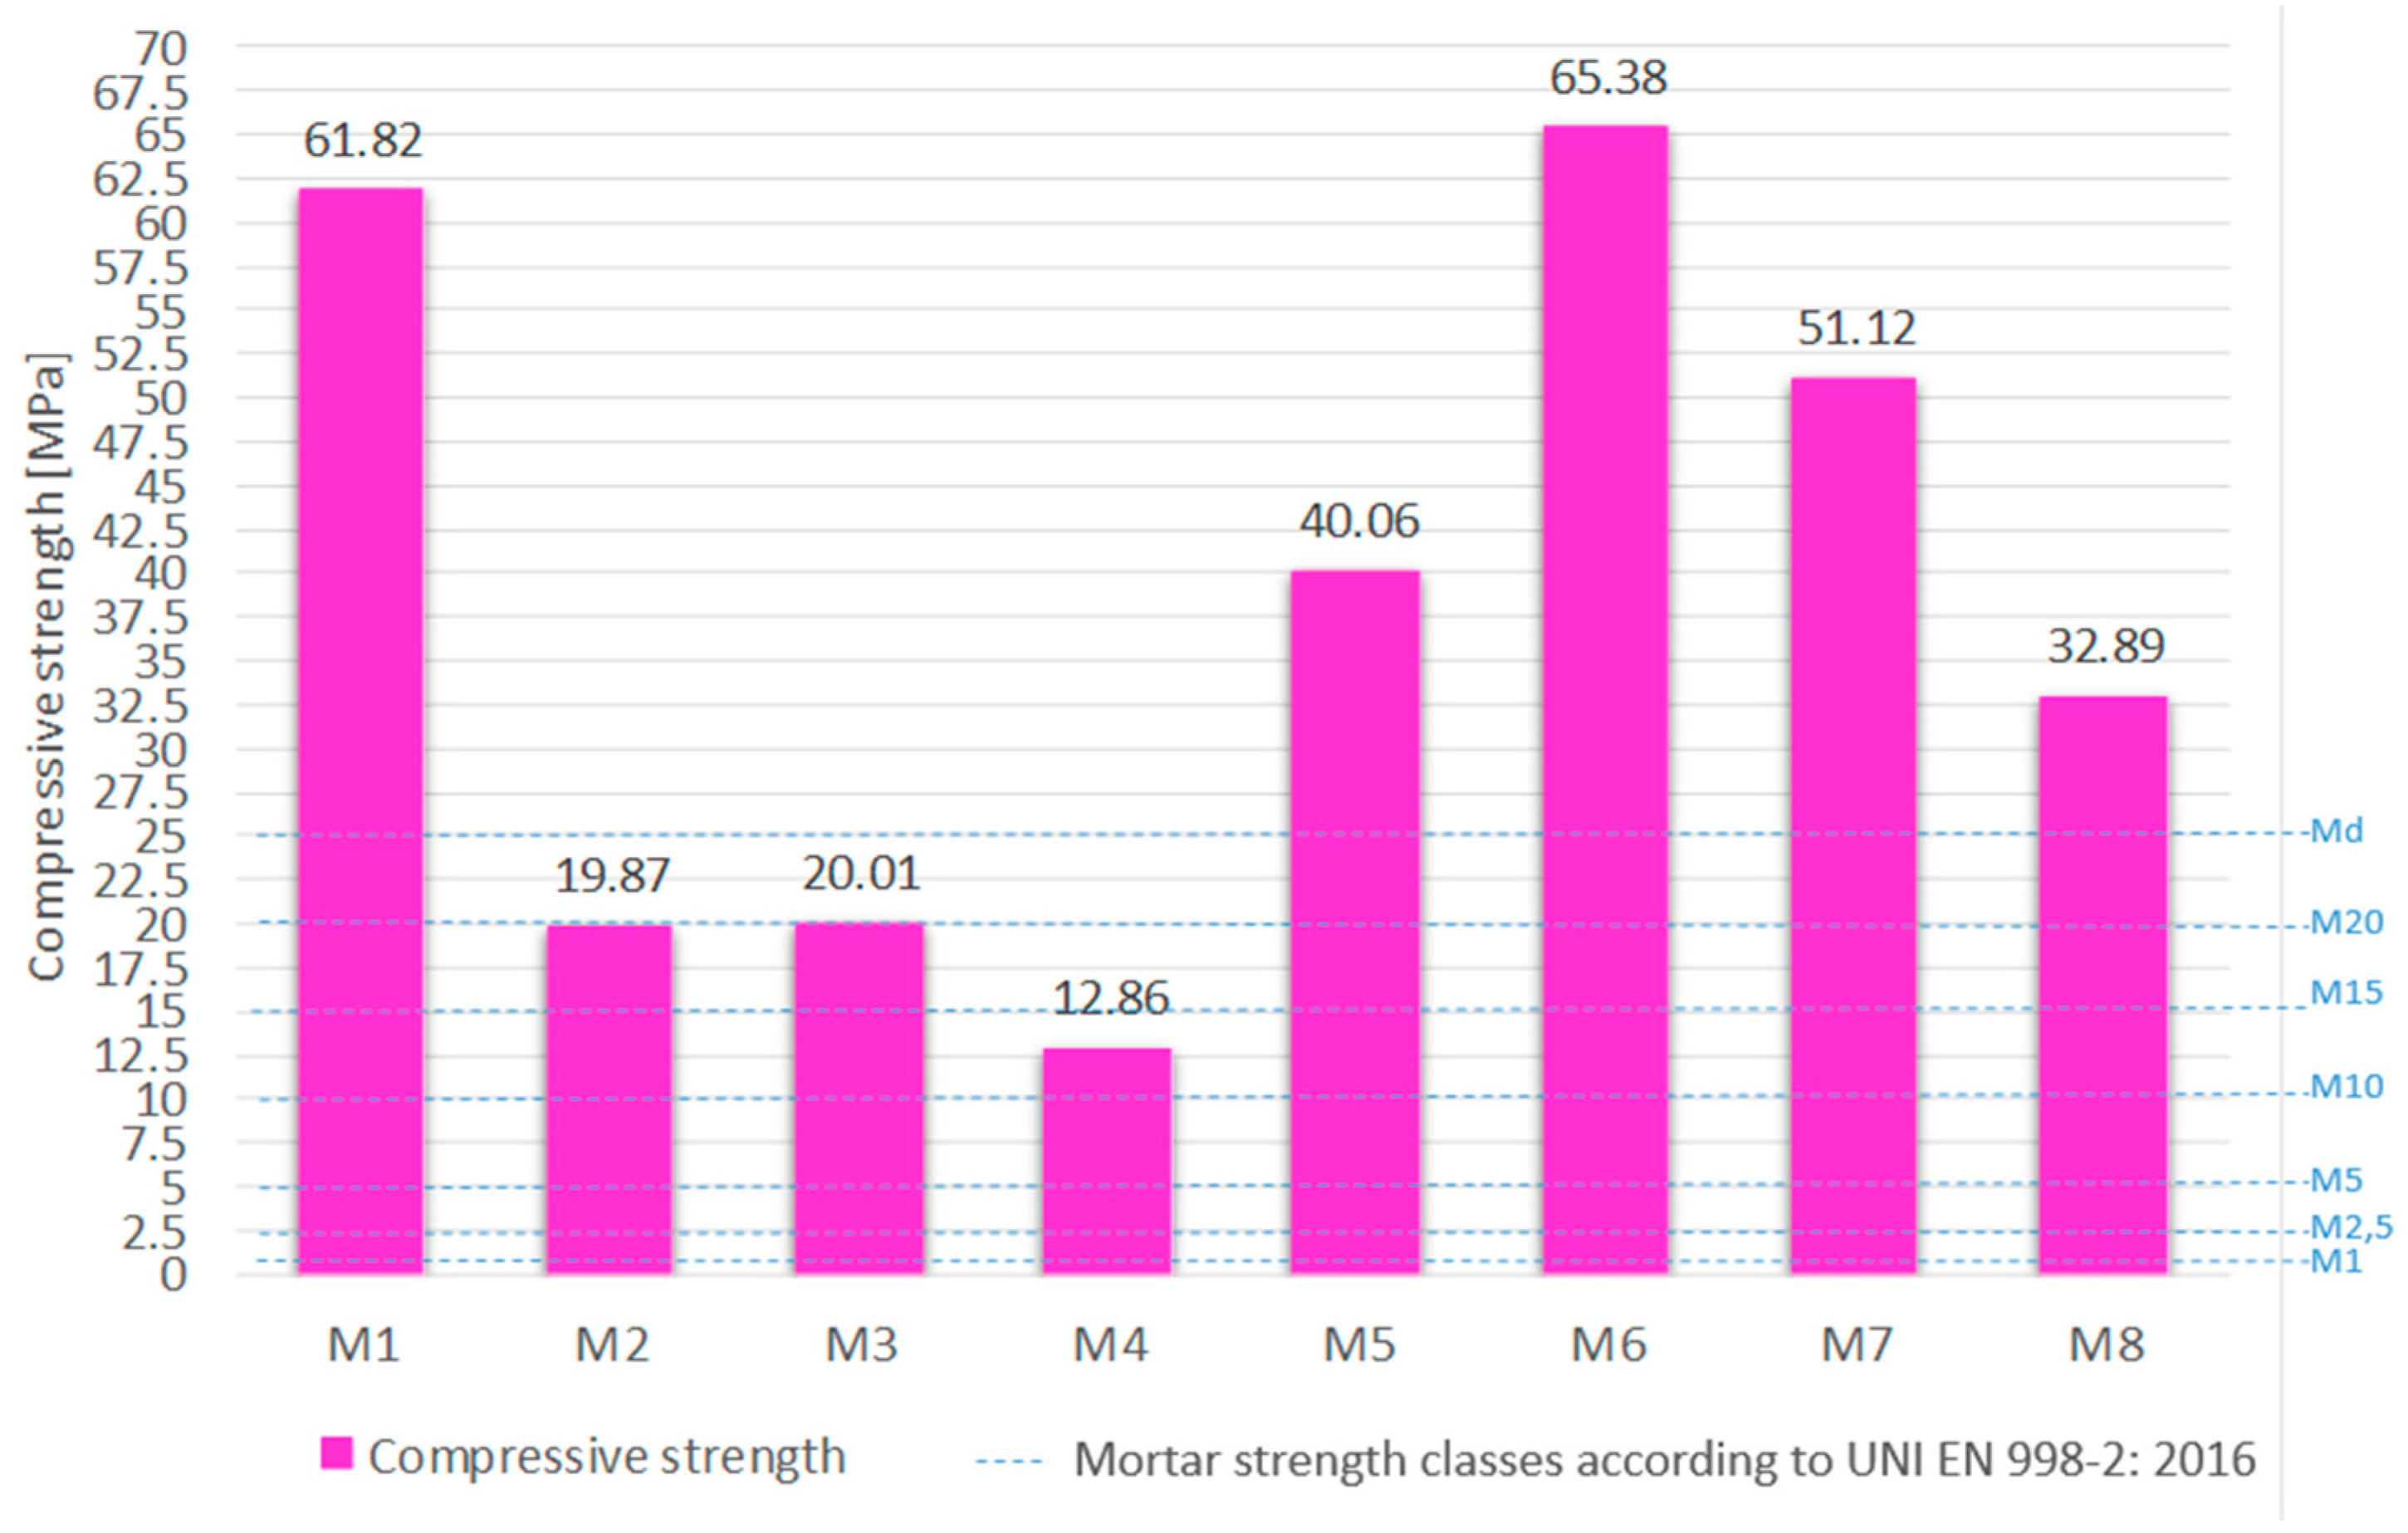
3.1.3. Compressive Strength Tests

With reference to the results of the compression tests, it is observed that the maximum achieved value, 65.38 MPa, results from specimen M6, made with graded sand, slightly higher than the strength of the reference mortar M1 (61.82 MPa). This can be justified by the presence, in sample M6, of sand with a larger particle size (2–4 mm and 4–6 mm) compared to normal mortar (fine grains of 2 mm). The lowest compressive strength value (12.86 MPa) results from specimen M4, containing only expanded polystyrene: the presence of this material as an aggregate, in fact, causes a reduction, due to its hypothesized particle sizes and high porosity, in the mechanical performance of the mortars in which it is incorporated. This is further confirmed for specimens M5, M7, and M8, where the different combination of aggregates, sand, and EPS, provides better mechanical strength values compared to specimens M2, M3, and M4, containing only expanded polystyrene (Figure 12).
The one-way ANOVA tests were performed for each tested mix on each investigated property. The results, consistent across all tests, led to rejecting the null hypothesis H0, which posits that the means are different due to natural statistical fluctuation rather than actual differences. Therefore, the tests confirm the initial hypothesis that variations in the mixture composition result in variations in the measured properties. The results of the ANOVA for some of the investigated properties are reported (Table 9 and Table 10).
As for the formulation of mortars, the experimental results reveal that all specimens exhibit a much more fluid behavior compared to the reference sample due to the absence of fine fraction (Ø < 1 mm), which contributes to aggregative phenomena. From the compression tests, it was observed that the highest values of mechanical strength were obtained from the reference sample and the sample with only sand, while conglomerates based on only polystyrene, a porous material, proved to be the most fragile. A compromise can be achieved in the case of mortars where both lightweight and traditional aggregates are present, with results not too different from standardized mortar.
The trend of thermal tests aligns with what was obtained from the perspective of mechanical strengths, meaning that the sample with the highest thermal conductivity is the reference specimen, while the lowest values were obtained in the case of complete sand replacement with EPS. Intermediate values were obtained with mixed aggregates, where the contribution of sand is observed for mechanical strengths, while the lightweight and thermal insulation properties are due to polystyrene. A particular result is the high insulation performance provided by sample M6 (containing only sand) compared to the reference, considering that its strengths are also higher. This result is due to a decrease in density, with a consequent increase in internal porosity, which is compensated by the presence of aggregates with larger dimensions than normal mortar.
Based on the compression strength values, a comparison was made with the classification of masonry mortars according to UNI EN 998-2:2016 [74], as outlined in Figure 13. The graph shows that all designed mortars, even those with no sand content, can be used as masonry mortars, falling within the various classes identified by the regulations.

3.2. About Concrete

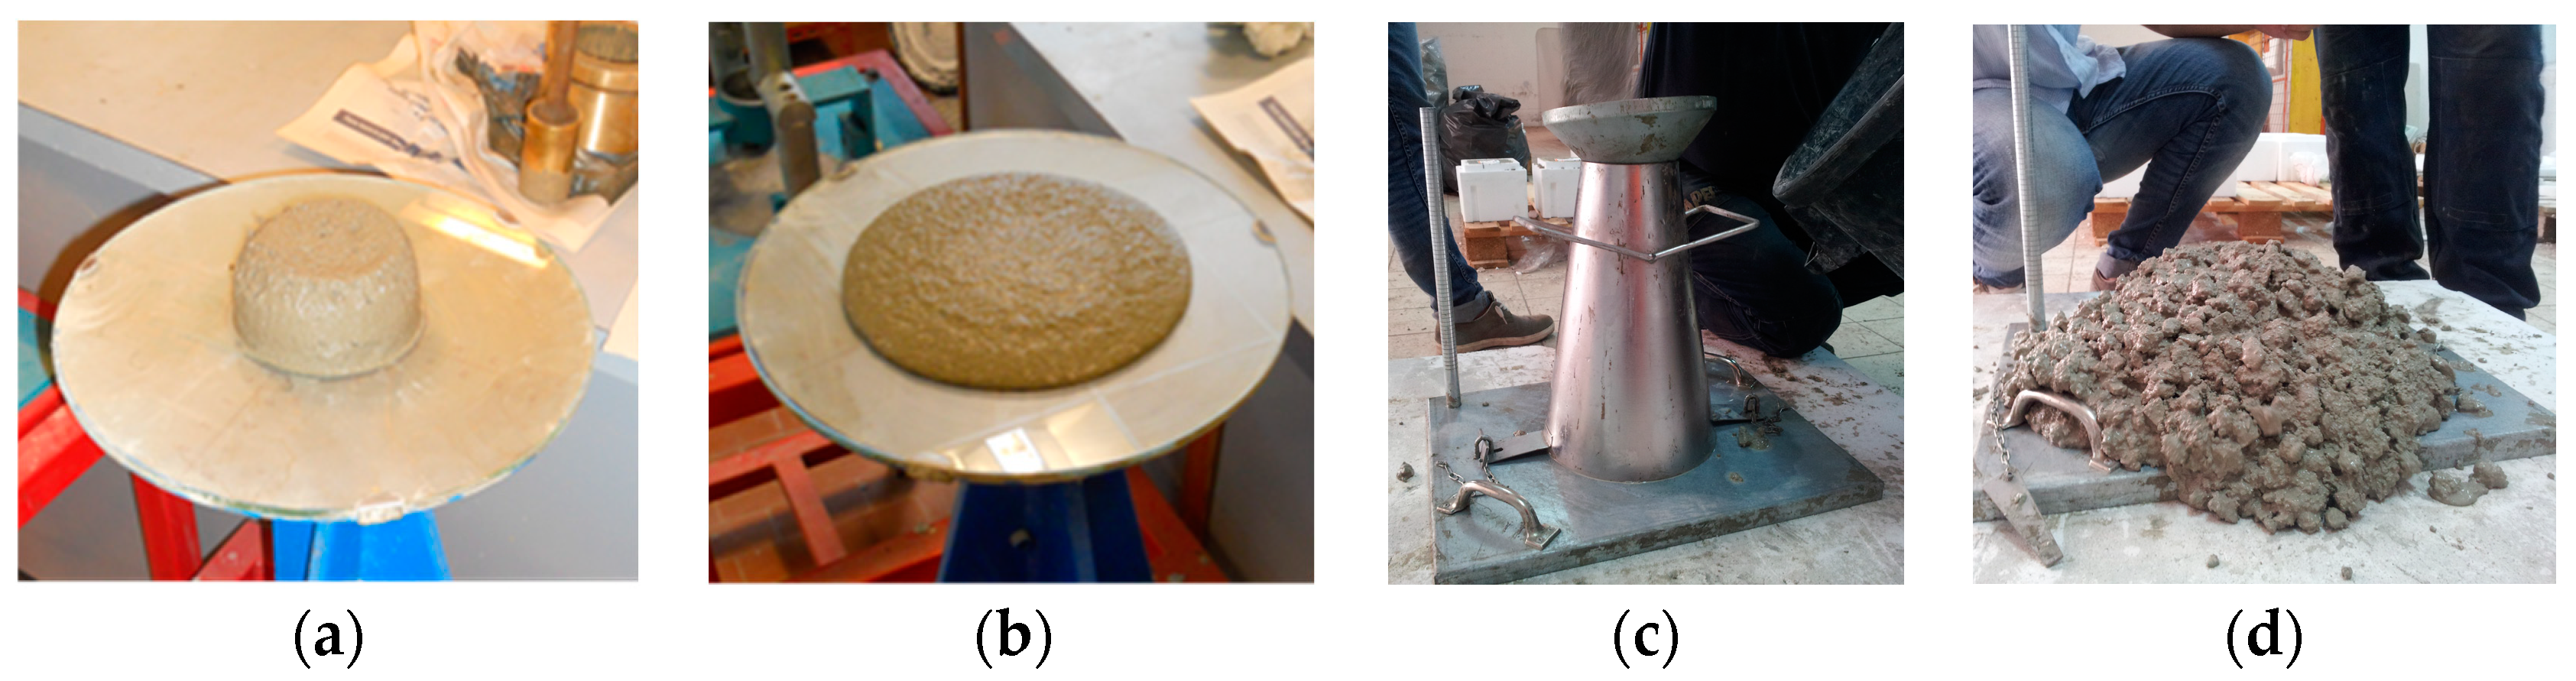
3.2.1. Concrete Workability

The workability of the mixtures is tested by evaluating their consistency class. The mixtures were prepared in the laboratory, at T = 23.9 °C and RH = 78%. Each mixture was treated with a superplasticizer additive at different percentages, depending on the workability requirements (Figure 14).
For all the mixtures, workability was optimized to achieve a consistency class of S5, specifically, a superfluid consistency with a slump (S) greater than or equal to 220 mm [75]. A superplasticizing additive for high-strength concrete was employed, and the standard quantity calculated for each mixture was 0.91% by weight of the cement. Additionally, a range (0.3–2.17%) was determined within which to operate, ensuring optimal workability conditions for the envisaged mixtures.
All mixtures, except for S6, exhibited a very good slump in the Abrams cone test (Figure 15 and Figure 16).
For mixture S6, it was observed that, despite using the maximum quantity of superplasticizer additive, it resulted in a very dry consistency, with portions of the mix remaining unmixed. The sticky consistency and lack of fluidity in the mixture also resulted in no slump in the flow test.
This result was replicated across all three tests conducted on the same mixture.
For mixture S4, despite having a good slump, a similar situation is encountered, namely, a pasty mix with lower workability compared to the other mixtures, despite the addition of the entire additive (Figure 17).

3.2.2. Thermo–Hygrometric Tests

Below are the results of the tests for density, thermal diffusivity (Figure 18), volumetric heat capacity (Figure 19), and conductivity (Figure 20) of the concrete mixtures.
For mixtures with partial replacements of the entire aggregate, it is evident that the best thermal properties are achieved with mixture S4, where sand is completely replaced by R-EPS. In this case, the conductivity is 25.42%, compared to the conductivity of the reference mixture. Similarly, in mixtures that involve the replacement of parts of the sand granulometric mix with R-EPS, the best thermal performance is observed with specimens S8 (1.15 W/mK), S9 (1.28 W/mK), and S10 (1.02 W/mK), which are the mixtures with a higher presence of EPS. In these cases, the conductivities are, respectively, 64.97%, 72.32%, and 57.63%, compared to the conductivity of the reference mixture (Figure 20).
Figure 21 shows how thermal conductivity decreases with an increasing % of R-EPS content. Here, the thermal conductivity values range from 1.77 W/mK for S7, corresponding to 100% replacement compared to the reference sample S0, to 0.45 W/mK for S4, corresponding to 25% compared to S0.

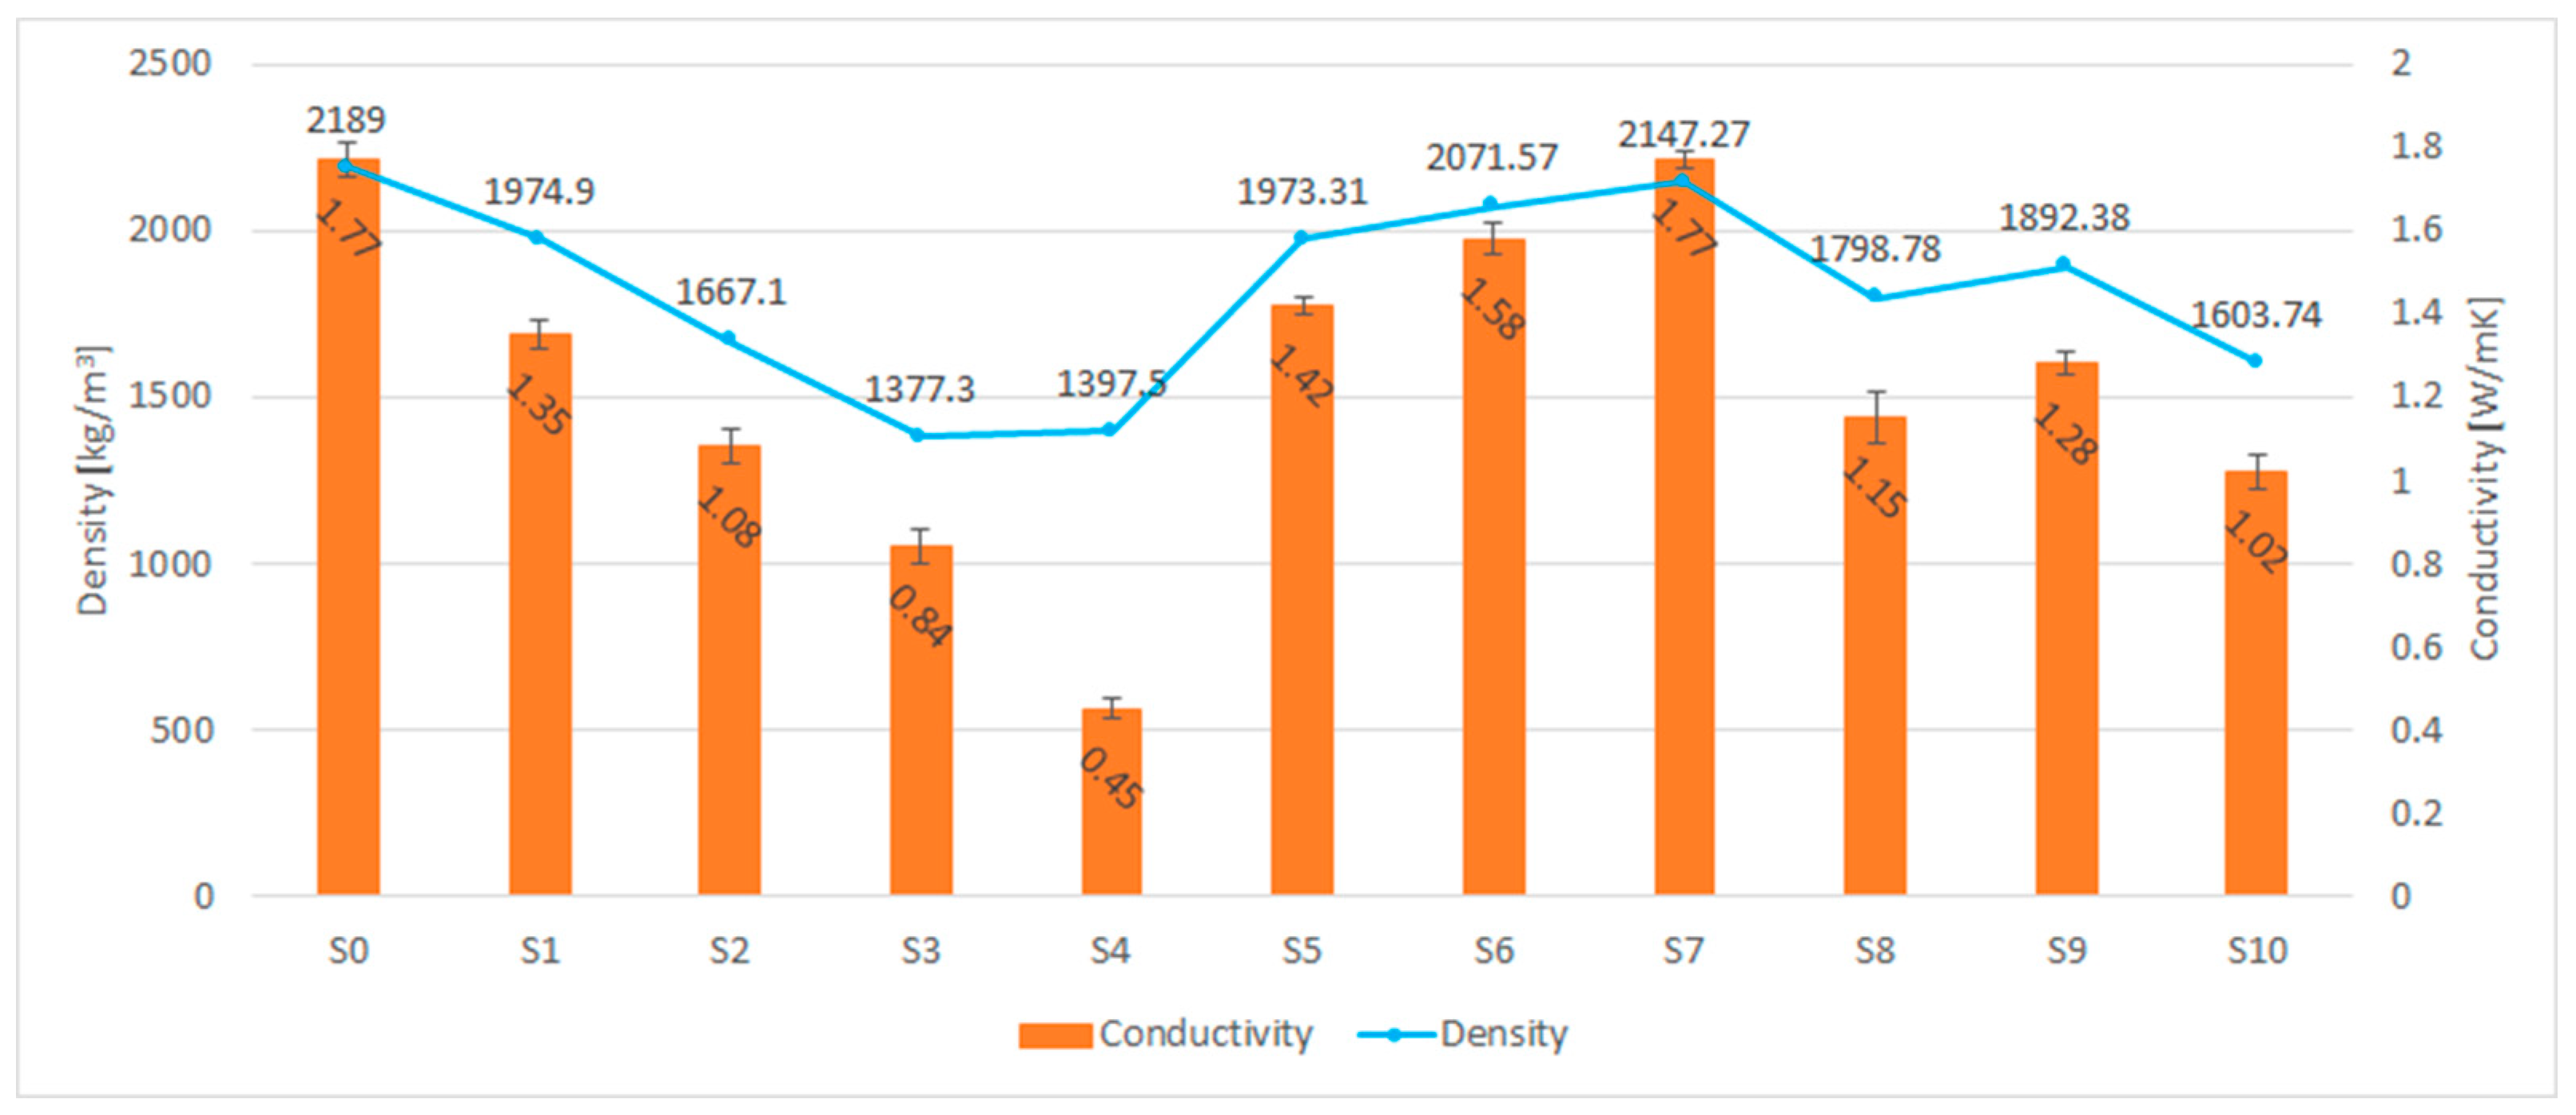
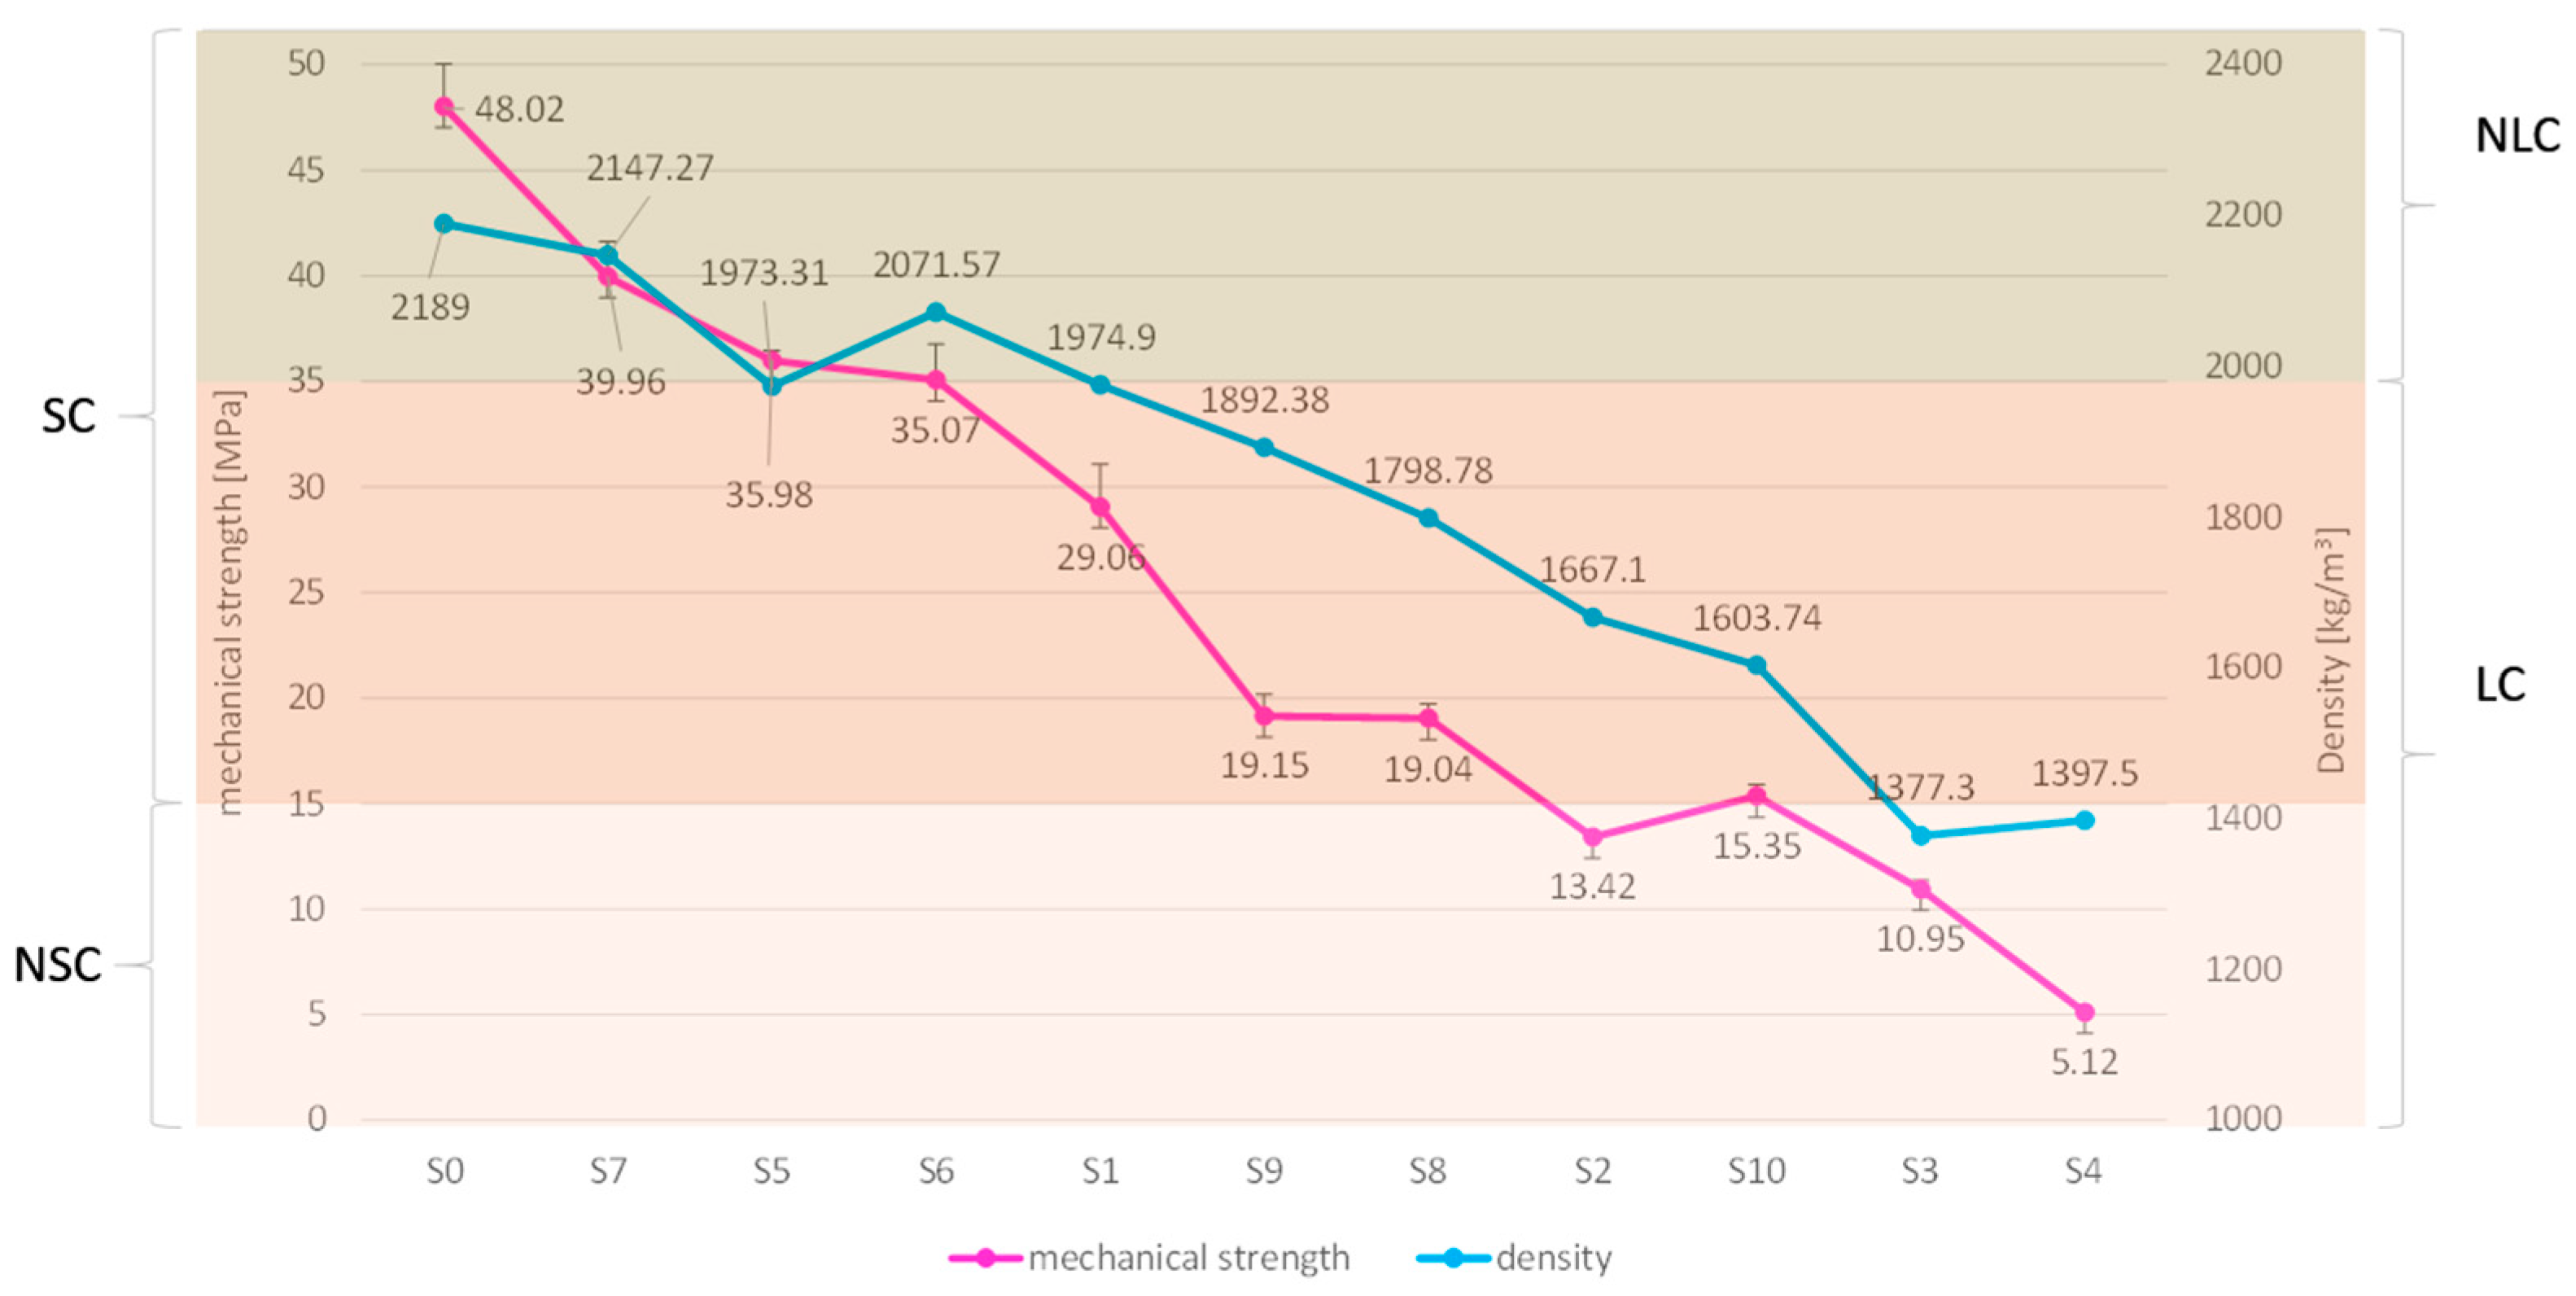
3.2.3. Compressive Strength Tests

In Table 11, the results of the compressive strength tests are summarized. The results obtained for three samples of each mixture (R1, R2, R3), the average (Rm), and the standard deviation (σ) are reported.
The sample S4, where the sand is entirely replaced by R-EPS, has the lowest strength value (5.12 MPa). Similarly, among the mixtures involving the replacement of parts of the sand granulometric mix with R-EPS, sample S10, which replaces all three identified parts of the mix, has the lowest mechanical strength (15.35 MPa), although higher than sample S4 due to the presence of a certain amount of sand.
From the comparison between the achieved mechanical performances and the content of R-EPS in the mixture (Figure 22), it is evident that the compressive strength of the specimens decreases with the increasing content of R-EPS in the mix.
In analogy to what was done for the mortars, an ANOVA test was also conducted for the concrete. In this case as well, the results confirm that the differences in means are not due to natural statistical fluctuation but because, as the composition of the mixture varies, the measured quantities also vary (Table 12 and Table 13).
With regard to the formulation of concretes, it is highlighted that for all mixtures, except for S6, it was possible to achieve the S5 consistency class, according to UNI EN 206:2021 [75]. Thermo–hygrometric tests generally showed (Figure 18) that the decrease in density, generated by the use of R-EPS (Figure 18) replacing sand, corresponds to a significant improvement in the thermal properties of concretes, caused by the increase in air voids within the base mixture.
Based on the compression strength and density values, a comparison was made with the classification of concretes from UNI EN 206:2021 and NTC2018 [76], as outlined in Figure 23.
This allowed the evaluation of which mixtures can be considered lightweight concretes (LC) (800 kg/m3 ≤ ρ ≤ 2000 kg/m3) and non-lightweight concretes (NLC) (ρ > 2000 kg/m3), as well as structural concretes (SC) (Rck,cube ≥ 15 MPa) and non-structural concretes (NSC) (Rck,cube < 15 MPa).
Out of the eleven samples, three do not fall into the lightweight concrete category, including the reference concrete (S0, S6, S7). Among the lightweight concrete samples, four are suitable for structural purposes (S1, S5, S8, S9), while the remaining four (S2, S3, S4, S10) are suitable for non-structural purposes (Figure 24).
Furthermore, it is observed that the volumetric percentage replacement of sand with R-EPS for the entire grain size distribution (S1, S2, S3, S4), although more advantageous in terms of preparation time and resources for operators, leads to a decrease in density and mechanical properties, making the mixes lightweight and non-structural, except for S1, which has the lowest percentage (25%) of replacement. Finally, for the qualification of the achieved performances, the values obtained were compared with those required by the Italian Technical Standards for Constructions for structural lightweight concrete and relative Circular [77].
In particular, in the Technical Standards for Constructions, with reference to the design specifications for seismic actions, paragraph 7.4.2.1 states that the use of concretes lower than C20/25 is not allowed. Mechanical resistance must be associated with appropriate considerations regarding the density of lightweight concrete products defined in paragraph C4.1.12 “lightweight aggregate concrete” of the Circular. In conclusion, concretes suitable for use in seismic applications must simultaneously satisfy the following performances:
  • Rck > 25 MPa;
  • 1400 < ρ ≤ 2000.
In relation to these regulatory constraints, it is found that, among all the composites, two in particular, S5 and S1, are suitable for use in seismic applications. Moreover, the two concrete samples are also suitable for structural uses, as required by paragraph 4.1.12 (Lightweight aggregate concrete) and Table 4. 1. II of the Technical Standards for Constructions, as they have a strength higher than the minimum required (20 MPa).
The results obtained are of particular interest when compared to the performances achieved for other concretes with a similar content of R-EPS in the mix, such as S7 and S6. For them, the replacement of sand with recycled lightweight aggregate involved different grain size fractions and, therefore, different weights. In the S5 mix, in fact, the replacement of the portion of sand with a grain size between 1 and 2 mm (about 18% of the entire granulometric range) allowed, on the one hand, for the reduction of the density of the starting concrete and on the other hand, for the preservation of good mechanical strength characteristics.
In Figure 25, it can be observed that among the lightweight mixes for structural use, mixes S9 and S8 exhibit the best thermal characteristics (1.28 W/m; 1.15 W/mK), while among the lightweight mixes for non-structural use, S3 and S4 show the best thermal characteristics (0.84 W/m; 0.45 W/mK).

4. Conclusions

In this study, the possibility of producing lightweight mortars and concretes with improved thermal performance by introducing R-EPS into the mix as a substitute for aggregate in various proportions and approaches was investigated. After the preparation of the mixtures, analyses were conducted to verify their fluidity, density, thermal, and mechanical characteristics. Based on the objectives of this experimental study, the main conclusions are summarized below:
  • All designed mortars exhibit compressive strength higher than the minimum specified by regulations. Therefore, all designed mortars, even those with no sand content, can be used as masonry mortars.
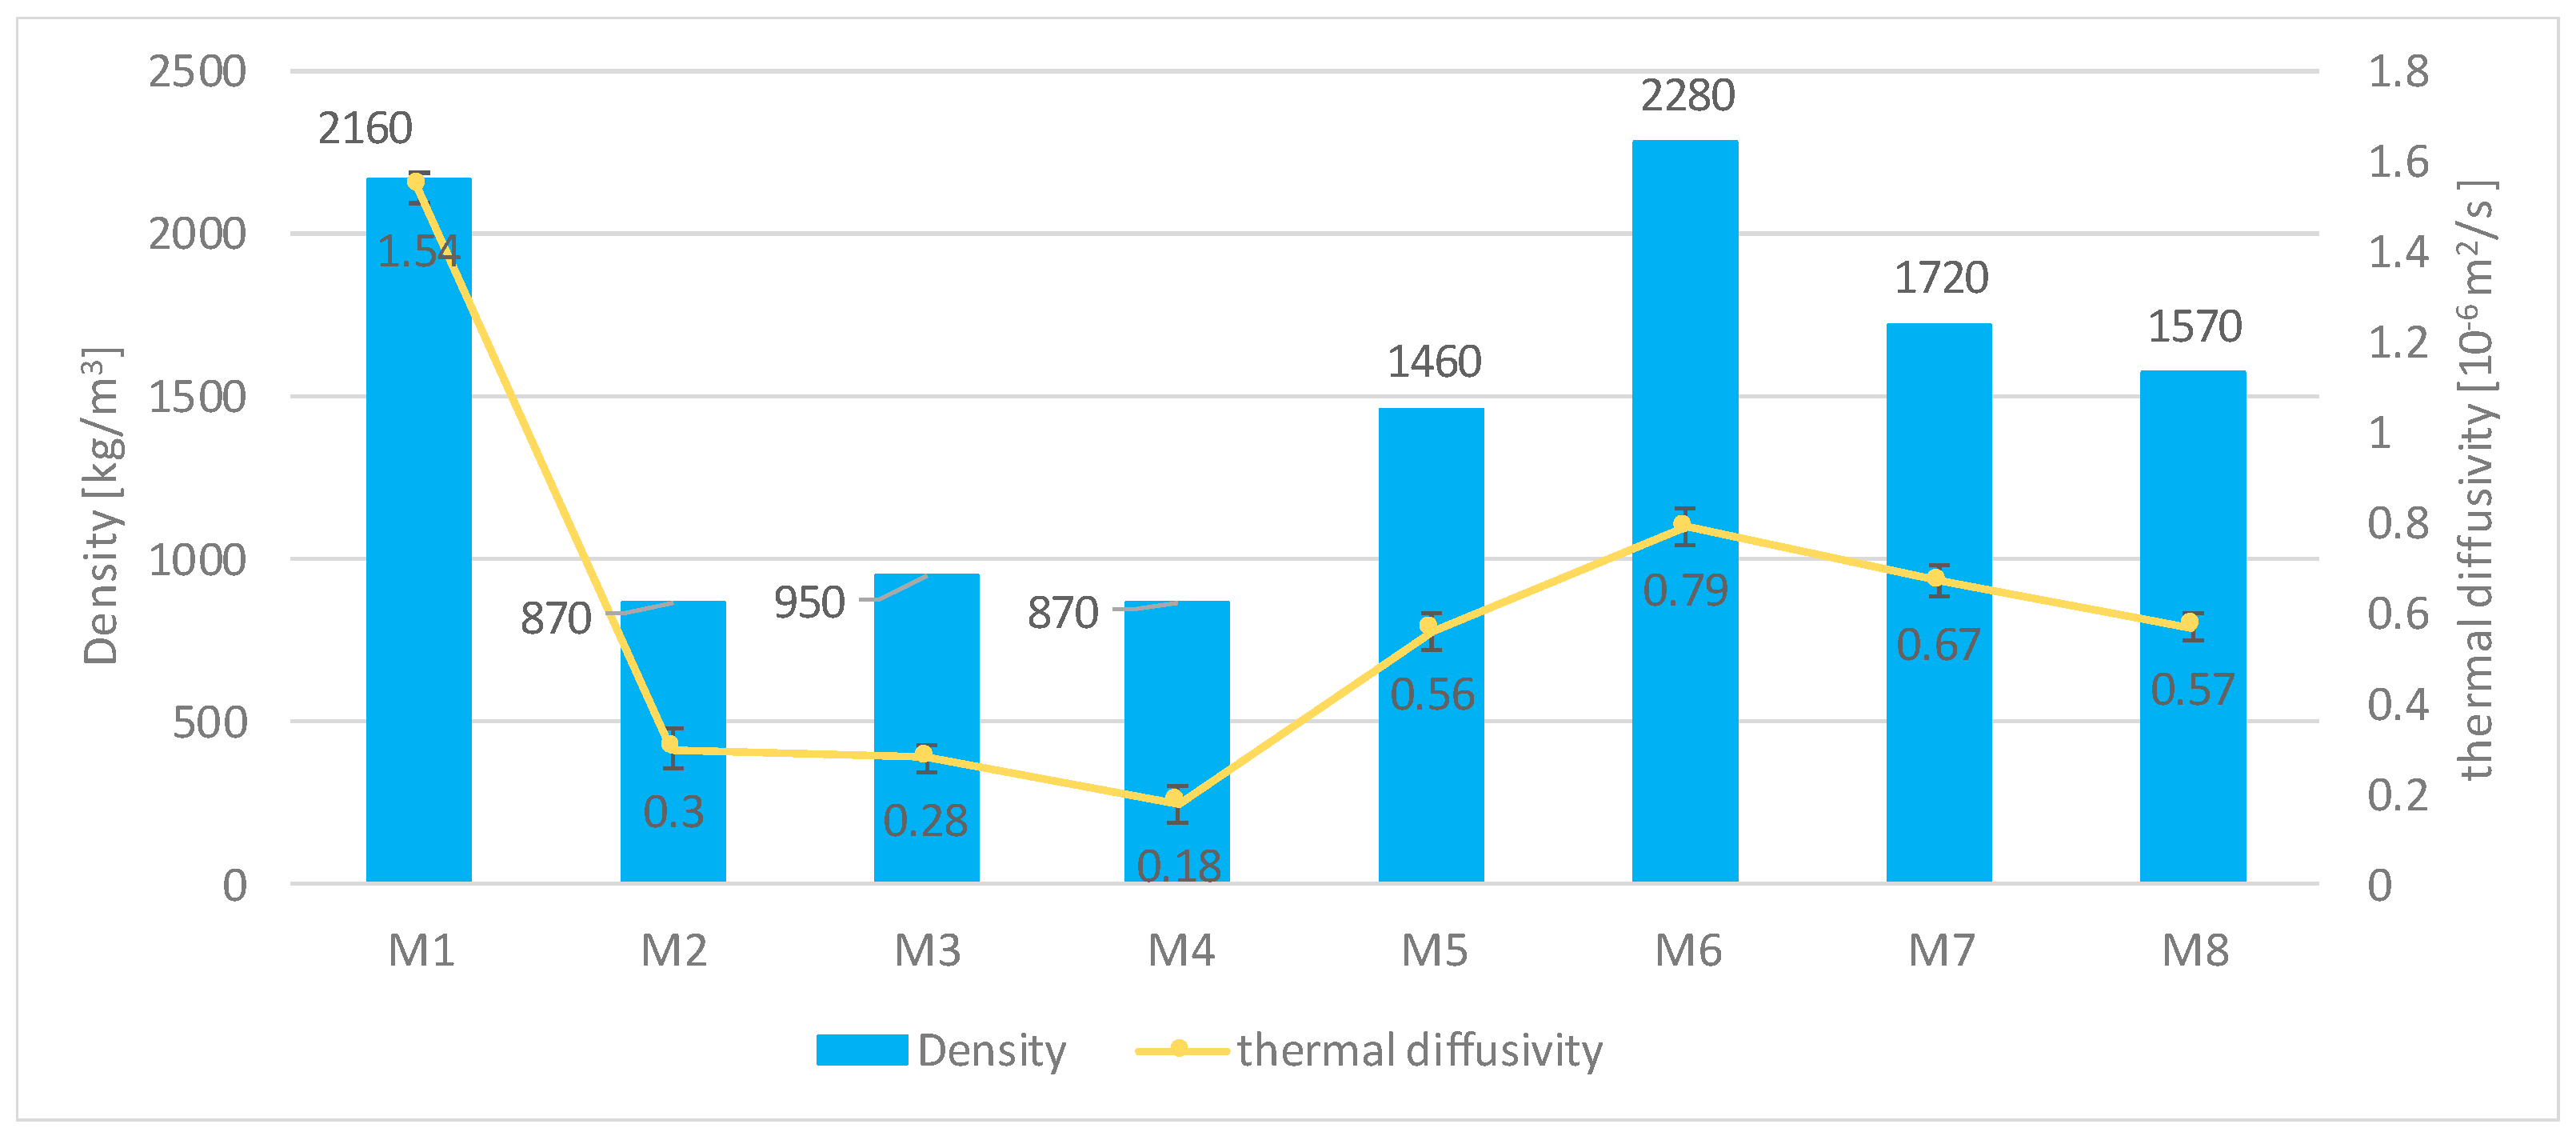
  • All mortars show an improvement in thermal characteristics ranging from 49.28% (M6) for mixtures where there is no sand replacement but only an improvement in its granulometric range, up to an improvement of 89.49% (M4) for mixtures where the replacement is complete across all granulometric ranges.
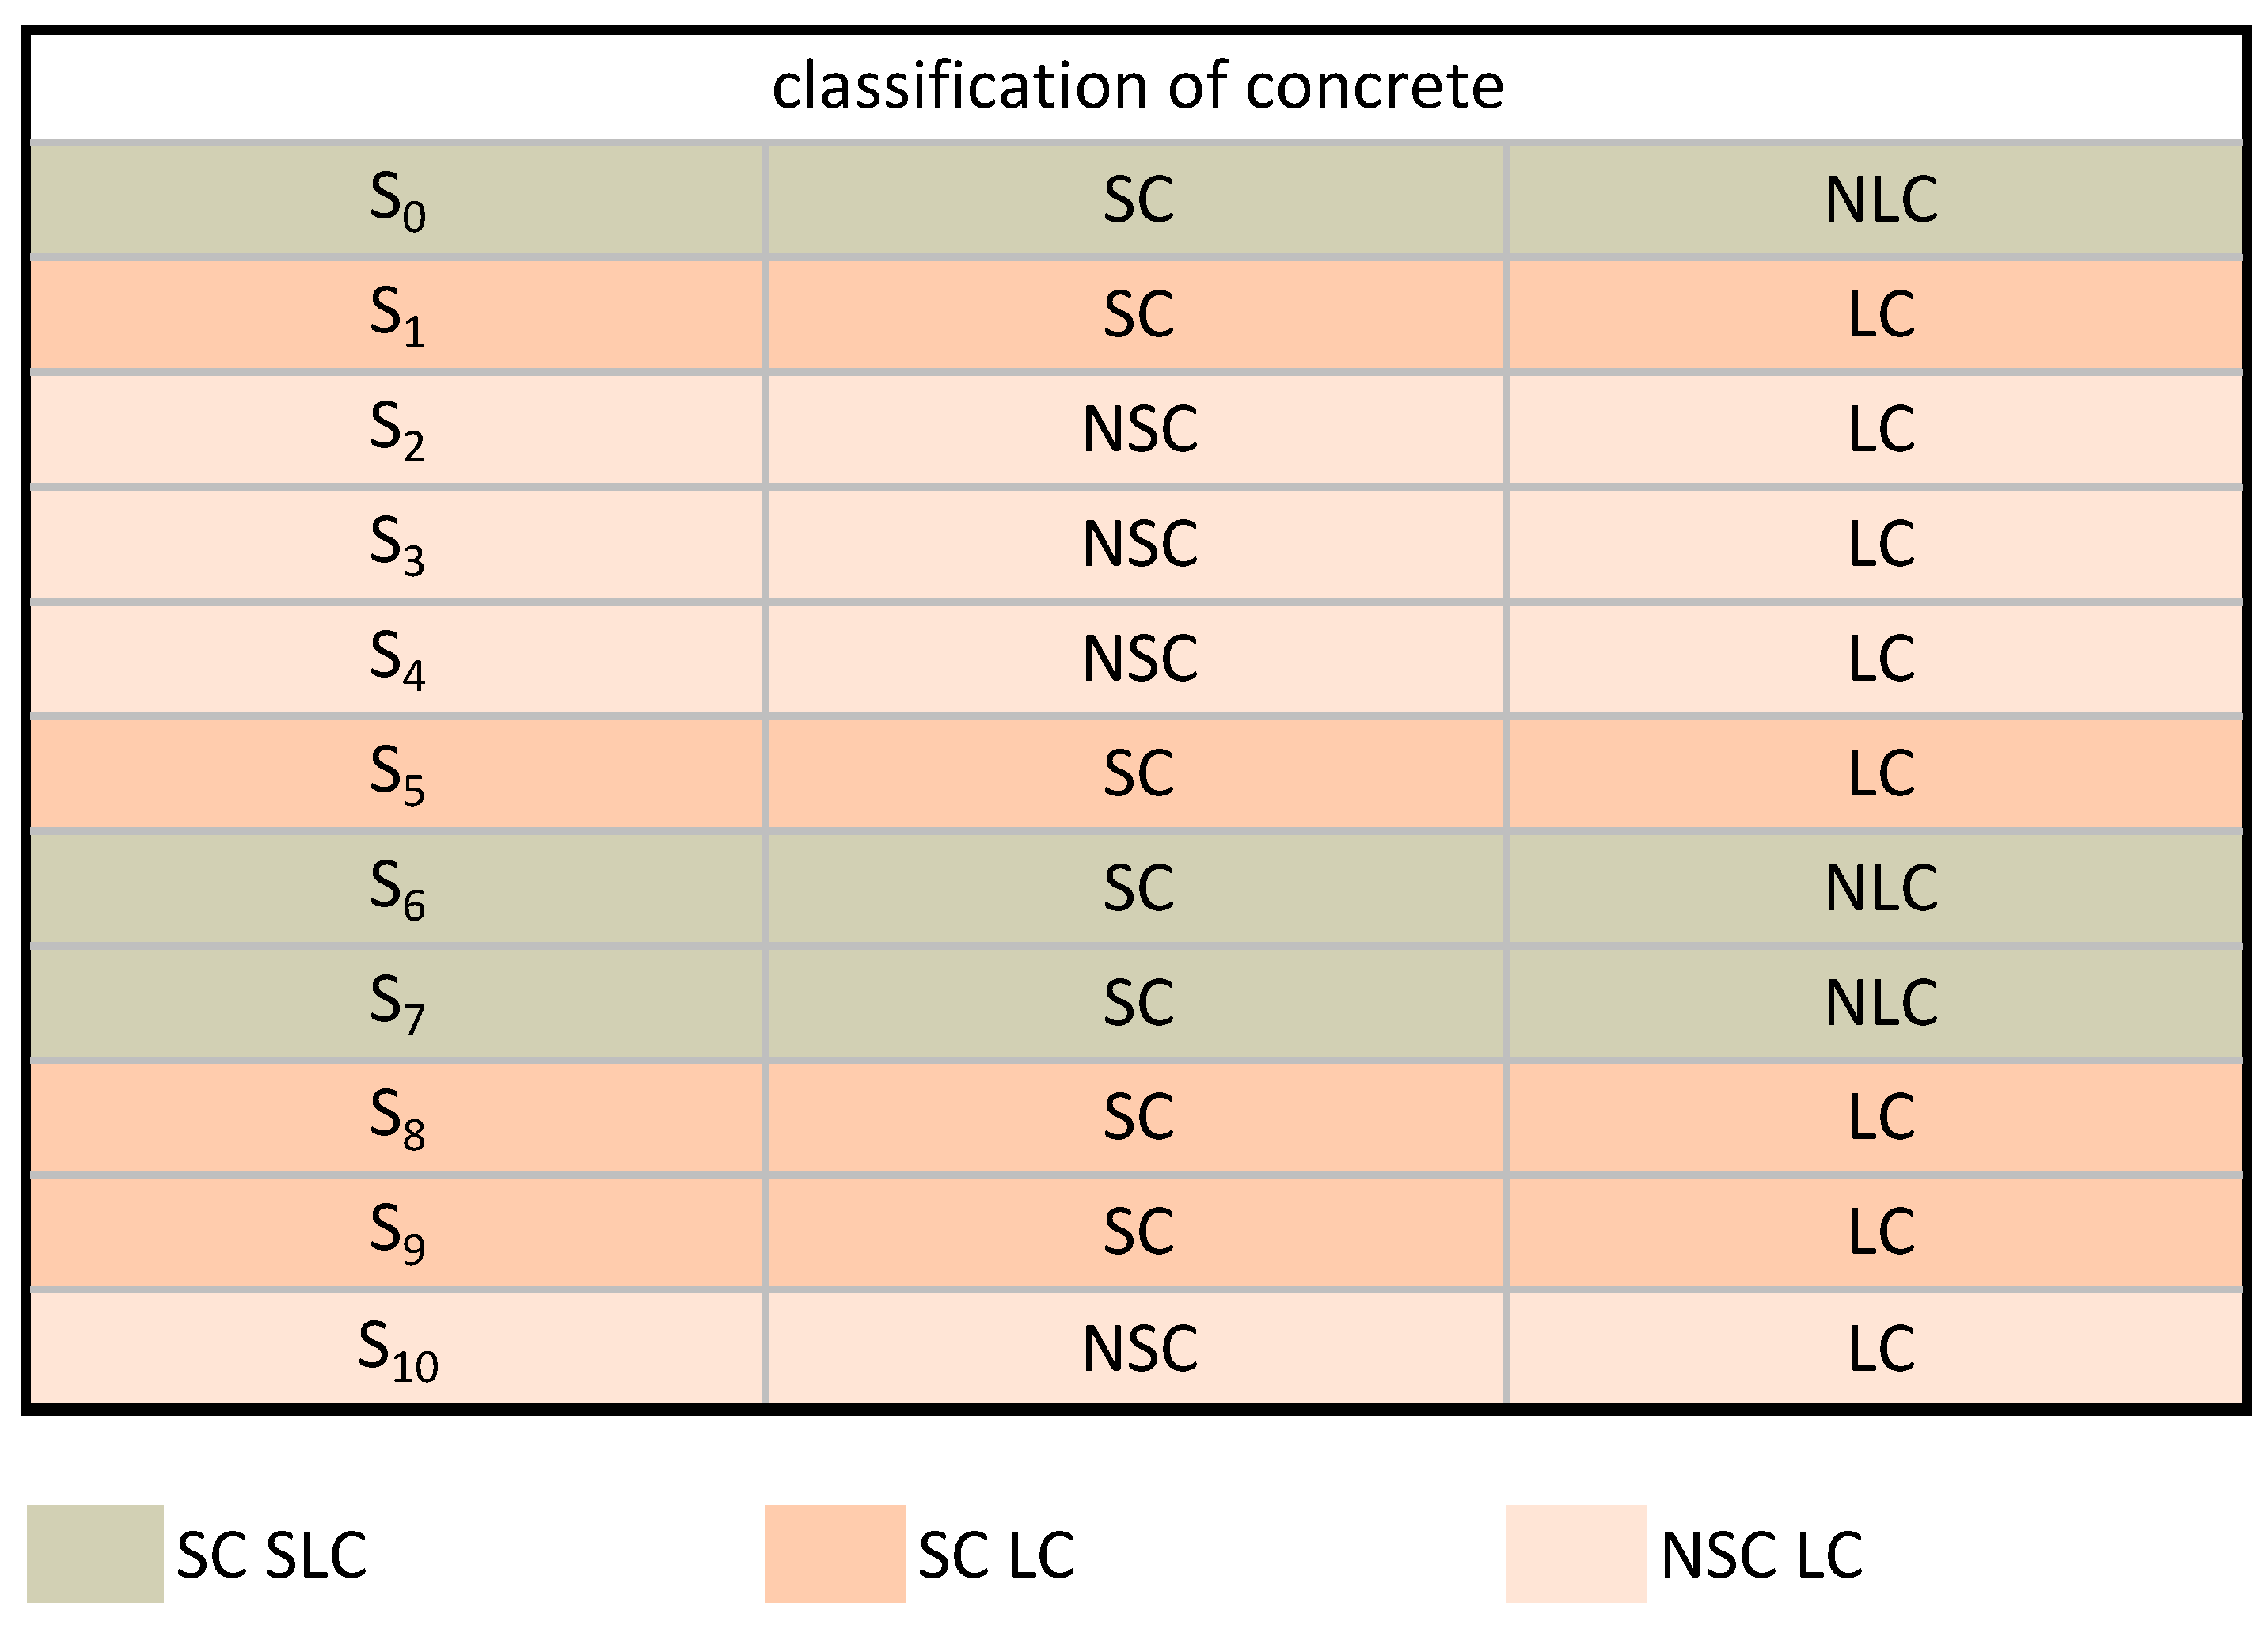
  • All designed concretes have strengths that are appreciable and compatible with the regulations. Therefore, all of them, each in relation to their specific characteristics, can be used as construction concretes, either structural (S0, S6, S7), lightweight structural (S1, S5, S8, S9), or non-structural (S2, S3, S4, S10).
  • All concretes show an improvement in thermal characteristics in relation to the quantity of introduced R-EPS.
  • Among structural concretes, improvements in terms of conductivity, compared to the reference mix, can be observed up to 27.68% (S8), where 40.2% of sand is replaced with R-EPS.
  • Among non-structural lightweight concretes, improvements in terms of conductivity, compared to the reference mix, can be observed up to 74.58% (S4), where 100% of sand is replaced with R-EPS.
These results have proven to be extremely interesting, as they provide a comprehensive overview of the potential of the concretes both in terms of mechanical strength and thermal insulation. Therefore, based on the obtained performances, it will be possible to choose the product that best suits the required characteristics.

5. Patents

Italian patent N. 0001429017 registered on 30 June 2017.

Author Contributions

Conceptualization, A.S. and F.F.; methodology, A.S.; testing procedure, A.S.; discussion of results, A.S.; validation, A.S. and F.F.; writing—original draft preparation, A.S.; writing—review and editing, A.S.; supervision, F.F.; funding acquisition, F.F. All authors have read and agreed to the published version of the manuscript.

Funding

This research was partially funded by the Apulian Region (Italy) under the funding framework POC PUGLIA FESR-FSE 2014/2020 RIPARTI.

Institutional Review Board Statement

Not applicable.

Informed Consent Statement

Not applicable.

Data Availability Statement

Data are contained within the article.

Acknowledgments

The authors would like to acknowledge Ferramati International S.r.l. for supporting the production and testing of the specimens, as well as Pietro Stefanizzi, Andrea Petrella, and Alessandra Pierucci for collaborating in the manufacturing and testing of the specimens.

Conflicts of Interest

The authors declare no conflicts of interest.

References

  1. Sengupta, A.; Gupta, N.K. MWCNTs based sorbents for nuclear waste management: A review. J. Environ. Chem. Eng. 2017, 5, 5099–5114. [Google Scholar] [CrossRef]
  2. Asefi, H.; Lim, S. A novel multi-dimensional modeling approach to integrated municipal solid waste management. J. Clean. Prod. 2017, 166, 1131–1143. [Google Scholar] [CrossRef]
  3. Li, M.; Liu, J.; Han, W. Recycling and management of waste lead-acid batteries: Amini-review. Waste Manag. Res. 2016, 34, 298–306. [Google Scholar] [CrossRef]
  4. Wu, H.; Wang, J.; Duan, H.; Ouyang, L.; Huang, W.; Zuo, J. An innovative approach to managing demolition waste via GIS (geographic information system): A case study in Shenzhen city, China. J. Clean. Prod. 2016, 112, 494–503. [Google Scholar] [CrossRef]
  5. Yuriz, Y.; Ismail, T.N.H.T.; Hassan, N.N.M. An overview of waste materials for sustainable road construction. Int. J. Sustain. Constr. Eng. Technol. 2020, 11, 215–229. [Google Scholar]
  6. Vieira, C.S.; Pereira, P.M.; Lopes, M.D.L. Recycled Construction and Demolition Wastes as filling material for geosynthetic reinforced structures. Interface properties. J. Clean. Prod. 2016, 124, 299–311. [Google Scholar] [CrossRef]
  7. Seco, A.; Omer, J.; Marcelino, S.; Espuelas, S.; Prieto, E. Sustainable unfired bricks manufacturing from construction and demolition wastes. Constr. Build. Mater. 2018, 167, 154–165. [Google Scholar] [CrossRef]
  8. Bassani, M.; Tefa, L.; Russo, A.; Palmero, P. Alkali-activation of recycled construction and demolition waste aggregate with no added binder. Constr. Build. Mater. 2019, 205, 398–413. [Google Scholar] [CrossRef]
  9. Gedik, A. A review on the evaluation of the potential utilization of construction and demolition waste in hot mix asphalt pavements. Resources. Conserv. Recycl. 2020, 161, 104956. [Google Scholar] [CrossRef]
  10. Contreras-Llanes, M.; Romero, M.; Gázquez, M.J.; Bolívar, J.P. Recycled aggregates from construction and demolition waste in the manufacture of urban pavements. Materials 2021, 14, 6605. [Google Scholar] [CrossRef] [PubMed]
  11. Ali, H.A.; Zhang, B.; Xiao, C.; Zhao, B.; Xuan, D.; Poon, C.S. Valorization of fine recycled C&D aggregate and incinerator bottom ash for the preparation of controlled low-strength material (CLSM). Clean. Waste Syst. 2022, 3, 100061. [Google Scholar]
  12. Hidalgo, C.; Carvajal, G.; Hincapie, A.; Muñoz, F.; Hernández, M. Ground Improvement by Construction and Demolition Waste (CDW) Soil Mixture Replacement. Buildings 2023, 13, 779. [Google Scholar] [CrossRef]
  13. Liu, G.; Luo, X.; Zhang, Y.; Li, H. Predicting fatigue damage growth in cement-treated base layer built with construction and demolition waste. Constr. Build. Mater. 2023, 406, 133371. [Google Scholar] [CrossRef]
  14. European Commission. Available online: https://single-market-economy.ec.europa.eu/industry/sustainability/buildings-and-construction_en (accessed on 8 January 2024).
  15. Zhai, W.; Ding, J.; An, X.; Wang, Z. An optimization model of sand and gravel mining quantity considering healthy ecosystem in 447 Yangtze River, China. J. Clean. Prod. 2020, 242, 118385. [Google Scholar] [CrossRef]
  16. Miller, S.A.; Moore, F.C. Climate and health damages from global concrete production. Nat. Clim. Chang. 2020, 10, 439–443. [Google Scholar] [CrossRef]
  17. Shi, C.; Jiménez, A.F.; Palomo, A. New cement for the 21st century: The pursuit of an alternative to Portland cement. Cem. Concr. Res. 2011, 41, 750–763. [Google Scholar] [CrossRef]
  18. Van Deventer, J.S.; Provis, J.L.; Duxson, P. Technical and commercial progress in the adoption of geopolymer cement. Miner. Eng. 2012, 29, 89–104. [Google Scholar] [CrossRef]
  19. Assi, L.N.; Carter, K.; Deaver, E.; Ziehl, P. Review of availability of source materials for geopolymer/sustainable concrete. J. Clean. Prod. 2020, 263, 121477. [Google Scholar] [CrossRef]
  20. Zaragoza-Benzal, A.; Ferrández, D.; Atanes-Sánchez, E.; Morón, C. New lightened plaster material with dissolved recycled expanded polystyrene and end-of-life tyres fibers for building prefabricated industry. Case Stud. Constr. Mater. 2023, 18, e02178. [Google Scholar]
  21. Rocha-Santos, T.; Duarte, A.C. A critical overview of the analytical approaches to the occurrence, the fate and the behavior of microplastics in the environment. TrAC Trends Anal. Chem. 2015, 65, 47–53. [Google Scholar] [CrossRef]
  22. Lithner, D.; Larsson, Å.; Dave, G. Environmental and health hazard ranking and assessment of plastic polymers based on chemical composition. Sci. Total Environ. 2011, 409, 3309–3324. [Google Scholar] [CrossRef]
  23. Singh, N.; Hui, D.; Singh, R.; Ahuja, I.P.S.; Feo, L.; Fraternali, F. Recycling of plastic solid waste: A state of art review and future applications. Compos. Part B Eng. 2017, 115, 409–422. [Google Scholar] [CrossRef]
  24. Lopez, G.; Artetxe, M.; Amutio, M.; Alvarez, J.; Bilbao, J.; Olazar, M. Recent advances in the gasification of waste plastics: A critical overview. Renew. Sustain. Energy Rev. 2018, 82, 576–596. [Google Scholar] [CrossRef]
  25. Maharana, T.; Negi, Y.S.; Mohanty, B. Review article: Recycling of polystyrene. Polym. Plast. Technol. Eng. 2007, 46, 729–736. [Google Scholar] [CrossRef]
  26. Cao, X.; Dai, X.; Liu, J. Building energy-consumption status worldwide and the state-of-the-art technologies for zero-energy buildings during the past decade. Energy Build. 2016, 128, 198–213. [Google Scholar] [CrossRef]
  27. Campagna, L.M.; Fiorito, F. On the Impact of Climate Change on Building Energy Consumptions: A Meta-Analysis. Energies 2022, 15, 354. [Google Scholar] [CrossRef]
  28. Lanjewar, B.A.; Chippagiri, R.; Dakwale, V.A.; Ralegaonkar, R.V. Development of bio-based blended ash and fly ash-based alkali-activated concrete. Mag. Concr. Res. 2023, 75, 1202–1211. [Google Scholar] [CrossRef]
  29. Marathe, S.; Shetty, T.S.; Mithun, B.M.; Ranjith, A. Strength and durability studies on air cured alkali activated pavement quality concrete mixes incorporating recycled aggregates. Case Stud. Constr. Mater. 2021, 15, e00732. [Google Scholar] [CrossRef]
  30. Jain, M.S. A mini review on generation, handling, and initiatives to tackle construction and demolition waste in India. Environ. Technol. Innov. 2021, 22, 101490. [Google Scholar] [CrossRef]
  31. Das, S.K.; Shrivastava, S. A study on the viability of fly ash and construction and demolition waste as geopolymerized masonry mortar and their comparative analysis. Mater. Today Proc. 2020, 32, 574–583. [Google Scholar] [CrossRef]
  32. da Silva, R.S.; de Brito, J.; de Andrade, J.J. Synergic effect of recycled aggregate, fly ash, and hydrated lime in concrete production. J. Build. Eng. 2023, 70, 106370. [Google Scholar] [CrossRef]
  33. Khajuria, A.; Sharma, P. Use of plastic aggregates in concrete. Int. J. Innov. Technol. Explor. Eng. 2019, 9, 4406–4412. [Google Scholar] [CrossRef]
  34. Premalatha, J.; Srinivasan, R. Properties of concrete with waste glass powder (GP) as fine aggregate replacement. Int. J. Recent Technol. Eng. 2019, 8, 2308–2314. [Google Scholar]
  35. Mavroulidou, M.; Feruku, B.; Boulouki, G. Properties of structural concrete with high-strength cement mixes containing waste paper sludge ash. J. Mater. Cycles Waste Manag. 2022, 24, 1317–1332. [Google Scholar] [CrossRef]
  36. Mwandira, W.; Mavroulidou, M.; Gunn, M.; Garelick, H.; Purchase, D. The Potential Use of Food Waste in Biocementation Process for Eco-Efficient Construction Materials. In Food Waste Valorisation: Food, Feed, Fertiliser, Fuel and Value-Added Products; Wong, M.H., Purchase, D., Dickinson, N., Eds.; World Scientific: London, UK, 2023; pp. 397–417. [Google Scholar]
  37. Mavroulidou, M.; Sanam, I.; Mengasini, L. Mechanical and durability performance of alkali-activated slag cement concretes with carbonate and silicate activators. Sustain. Chem. Pharm. 2023, 31, 100896. [Google Scholar] [CrossRef]
  38. Šantek Bajto, J.; Štirmer, N.; Cerkovíc, S.; Carevíc, I.; Kostaníc Juríc, K. Pilot Scale Production of Precast Concrete Elements with Wood Biomass Ash. Materials 2021, 14, 6578. [Google Scholar] [CrossRef]
  39. Amaral, R.C.; Rohden, A.B.; Garcez, M.R.; de Andrade, J.J. Reuse of wood ash from biomass combustion in non-structural concrete: Mechanical properties, durability, and eco-efficiency. J. Mater. Cycles Waste Manag. 2022, 24, 2439–2454. [Google Scholar] [CrossRef]
  40. Rodriguez, C.; Miñano, I.; Parra, C.; Pujante, P.; Benito, F. Properties of Precast Concrete Using Food Industry-Filtered Recycled Diatoms. Sustainability 2021, 13, 3137. [Google Scholar] [CrossRef]
  41. de Andrade, J.J.O.; Possan, E.; Wenzel, C.M.; da Silva, S.R. Feasibility of using calcined water treatment sludge in rendering mortars: A technical and sustainable approach. Sustainability 2019, 11, 3576. [Google Scholar] [CrossRef]
  42. Possan, E.; Ramirez, K.G.; de Oliveira Andrade, J.J.; Sandoval, G.F.B. Concrete with Wet and Calcined Water Treatment Plant Waste: Macro and Micro Scale Analysis. Waste Biomass Valorization 2023, 1–13. [Google Scholar] [CrossRef]
  43. Hamada, H.M.; Shi, J.; Abed, F.; Humada, A.M.; Majdi, A. Recycling solid waste to produce eco-friendly foamed concrete: A comprehensive review of approaches. J. Environ. Chem. Eng. 2023, 11, 111353. [Google Scholar] [CrossRef]
  44. Petrella, A.; Di Mundo, R.; Notarnicola, M. Recycled Expanded Polystyrene as Lightweight Aggregate for Environmentally Sustainable Cement Conglomerates. Materials 2020, 13, 988. [Google Scholar] [CrossRef]
  45. Juraszek, J.; Walusiak, H. Properties of new construction material based on expanded polystyrene derived from recycling. In Proceedings of the International Multidisciplinary Scientific GeoConference Surveying Geology and Mining Ecology Management, SGEM, Vienna, Austria, 27–29 November 2017. [Google Scholar]
  46. Li, J.; Chen, W. Heat Transfer Dynamic Analyses for Recycled-Concrete Wall Combined with Expanded Polystyrene Template. Adv. Mater. Sci. Eng. 2018, 2018, 9692806. [Google Scholar] [CrossRef]
  47. Maaroufi, M.; Abahri, K.; Hachem, C.E.; Belarbi, R. Characterization of EPS lightweight concrete microstructure by X-ray tomography with consideration of thermal variations. Constr. Build. Mater. 2018, 178, 339–348. [Google Scholar] [CrossRef]
  48. Obaid, H.A.; Hilal, A.A. Effect of Expanded Polystyrene Foam Aggregate on Strength and Shrinkage Characteristics of Foamed Concrete. Civ. Eng. Archit. 2022, 10, 1788–1797. [Google Scholar] [CrossRef]
  49. Acevedo-Sánchez, C.D.; Villaquirán-Caicedo, M.A.; Marmolejo-Rebellón, L.F. Recycling of eps foam and demolition wastes in the preparation of ecofriendly render mortars with thermal-acoustic insulation properties. Reciclado de espuma de EPS y residuos de construcción y demolición en la preparación de morteros de revestimiento eco-amigables con propiedades termo-acústicas. Mater. Constr. 2023, 73, 4248. [Google Scholar]
  50. Herihiri, O.; Guettala, A.; Benabed, B. An investigation on the physical, mechanical and thermal properties of dune sand mortars lightened by expanded polystyrene beads (EPS). Epa. J. Silic. Based Compos. Mater. 2021, 73, 28–36. [Google Scholar] [CrossRef]
  51. Fard, P.M.; Alkhansari, M.G. Innovative fire and water insulation foam using recycled plastic bags and expanded polystyrene (EPS). Constr. Build. Mater. 2021, 305, 124785. [Google Scholar] [CrossRef]
  52. Prasittisopin, L.; Termkhajornkit, P.; Kim, Y.H. Review of concrete with expanded polystyrene (EPS): Performance and environmental aspects. J. Clean. Prod. 2022, 366, 132919. [Google Scholar] [CrossRef]
  53. Shi, J.; Liu, Y.; Liu, B.; Han, D. Temperature Effect on the Thermal Conductivity of Expanded Polystyrene Foamed Concrete: Experimental Investigation and Model Correction. Adv. Mater. Sci. Eng. 2019, 2019, 8292379. [Google Scholar] [CrossRef]
  54. Kim, S.; Lee, D.-E.; Kim, Y.; Kim, S. Development and Application of Precast Concrete DoubleWall System to Improve Productivity of Retaining Wall Construction. Sustainability 2020, 12, 345. [Google Scholar]
  55. Navarro-Rubio, J.; Pineda, P.; García-Martínez, A. Sustainability, prefabrication and building optimization under different durability and re-using scenarios: Potential of dry precast structural connections. Sustain. Cities Soc. 2020, 44, 614–628. [Google Scholar] [CrossRef]
  56. Dissanayake, D.M.K.W.; Jayasinghe, C.; Jayasinghe, M.T.R. A comparative embodied energy analysis of a house with recycled expanded polystyrene (EPS) based foam concrete wall panels. Energy Build. 2017, 135, 85–94. [Google Scholar] [CrossRef]
  57. Fernando, P.L.N.; Jayasinghe, M.T.R.; Jayasinghe, C. Structural feasibility of Expanded Polystyrene (EPS) based lightweight concrete sandwich wall panels. Constr. Build. Mater. 2017, 139, 45–51. [Google Scholar] [CrossRef]
  58. Awan, A.B.; Shaikh, F.U.A. Compressive behavior of precast concrete sandwich panels containing recycled tyre crumb rubber core. Struct. Concr. 2021, 22, 3602–3619. [Google Scholar] [CrossRef]
  59. Scioti, A.; De Fino, M.; Martiradonna, S.; Fatiguso, F. Construction Solutions and Materials to Optimize the Energy Performances of EPS-RC Precast Bearing Walls. Sustainability 2022, 14, 3558. [Google Scholar] [CrossRef]
  60. Assaad, J.J.; Mikhael, C.; Hanna, R. Recycling of waste expanded polystyrene concrete in lightweight sandwich panels and structural applications. Clean. Mater. 2022, 4, 100095. [Google Scholar] [CrossRef]
  61. UNI EN 197-1:2011; Cement. Part 1: Composition, Specification and Conformity Criteria for Common Cements. Italian Organization for Standardization (UNI). Available online: https://store.uni.com/uni-en-197-1-2011 (accessed on 27 December 2023).
  62. UNI EN 1008:2003; Mixing Water for Concrete. Specification for Sampling, Testing and Assessing the Suitability of Water, Including Water Recovered from Processes in the Concrete Industry, as Mixing Water for Concrete. Italian Organization for Standardization (UNI). Available online: https://store.uni.com/uni-en-1008-2003 (accessed on 27 December 2023).
  63. CEN EN 196-1; CEN Standard Sand According to EN 196-1. Available online: https://www.normensand.de/en/products/cen-standard-sand-en-196-1/ (accessed on 27 December 2023).
  64. UNI EN 12620:2008; Aggregates for Concrete. Italian Organization for Standardization (UNI). Available online: https://store.uni.com/uni-en-12620-2008 (accessed on 27 December 2023).
  65. UNI 10667-12:2021; Plastic Raw-Secondary Materials—Part 12: Expanded Polystyrene from Industrial Residues and/or Pre and/or Post-Consumer Materials, to Be Used for General Purpose—Requirements and Test Methods. Italian Organization for Standardization (UNI). Available online: https://store.uni.com/uni-10667-12-2021 (accessed on 27 December 2023).
  66. UNI EN 12390-2:2002; Testing Hardened Concrete. Making and Curing Specimens for Strength Tests. Italian Organization for Standardization (UNI). Available online: https://store.uni.com/uni-en-12390-2-2009 (accessed on 27 December 2023).
  67. UNI 7044: 1972; Determination of Consistency of Cement Mortars Using a Flow Table. Italian Organization for Standardization (UNI). Available online: https://store.uni.com/uni-7044-1972 (accessed on 27 December 2023).
  68. EN 12350-2:2019; Testing Fresh Concrete—Part 2: Slump Test. Italian Organization for Standardization (UNI). Available online: https://store.uni.com/en-12350-2-2019 (accessed on 27 December 2023).
  69. UNI EN 1015-19:2008; Methods of Test for Mortar for Masonry. Part 19: Determination of Water Vapour Permeability of Hardened Rendering and Plastering Mortars. Italian Organization for Standardization (UNI). Available online: https://store.uni.com/uni-en-1015-19-2008 (accessed on 27 December 2023).
  70. UNI EN 196-1: 2016; Methods of Testing Cement—Part 1: Determination of Strength. Italian Organization for Standardization (UNI). Available online: https://store.uni.com/en-196-1-2016 (accessed on 27 December 2023).
  71. UNI EN 12390-2: 2019; Testing Hardened Concrete—Part 2: Making and Curing Specimens for Strength Tests. Italian Organization for Standardization (UNI). Available online: https://store.uni.com/en-12390-2-2019 (accessed on 27 December 2023).
  72. UNI 12390-3:2019; Testing Hardened Concrete—Part 3: Compressive Strength of Test Specimens. Italian Organization for Standardization (UNI). Available online: https://store.uni.com/en-12390-3-2019 (accessed on 27 December 2023).
  73. UNI 12390-4:2019; Testing Hardened Concrete—Part 4: Compressive Strength—Specification for Testing Machines. Italian Organization for Standardization (UNI). Available online: https://store.uni.com/uni-en-12390-4-2019 (accessed on 27 December 2023).
  74. UNI EN 998-2:2016; Specification for Mortar for Masonry—Part 2: Masonry Mortar. Italian Organization for Standardization (UNI). Available online: https://store.uni.com/en-998-2-2016 (accessed on 27 December 2023).
  75. UNI EN 206:2021; Concrete—Specification, Performance, Production and Conformity. German Institute for Standardization: Berlin, Germany, 2017; Italian Organization for Standardization (UNI). Available online: https://store.uni.com/uni-en-206-2021 (accessed on 27 December 2023).
  76. NTC 2018; Italian Technical Normative for Construction. Available online: https://www.gazzettaufficiale.it/eli/gu/2018/02/20/42/so/8/sg/pdf (accessed on 27 December 2023).
  77. Circolare del 11/02/2019. Istruzioni per L’applicazione dell’«Aggiornamento delle “Norme tecniche per le costruzioni”» di cui al Decreto Ministeriale 17 Gennaio 2018. Available online: https://www.gazzettaufficiale.it/eli/id/2019/02/11/19A00855/sg (accessed on 27 December 2023).
Figure 1. Sample of R-EPS before (a) and after (b) the addition of the hydrophobic additive.
Applsci 14 01583 g001
Figure 2. Mixture and flow test of mortars M3 using a shaking table (a,b) and concretes S4, using the Abrams cone (c,d).
Applsci 14 01583 g002
Figure 3. Isomet 2104 (Applied Precision).
Applsci 14 01583 g003
Figure 4. Climatic chamber Perani AC520.
Applsci 14 01583 g004
Figure 5. Preparation of mortar specimens: conditioning.
Applsci 14 01583 g005
Figure 6. Preparation of concrete specimens, demolding, and conditioning in a tank.
Applsci 14 01583 g006
Figure 7. Compression test on concrete specimens.
Applsci 14 01583 g007
Figure 8. Mortar. Flow test results referring to the samples specified in Table 1.
Applsci 14 01583 g008
Figure 9. Mortar. Relationship between conductivity and density in the samples.
Applsci 14 01583 g009
Figure 10. Mortar. Relationship between thermal diffusivity and density in the samples.
Applsci 14 01583 g010
Figure 11. Mortar. Trend of vapor permeability with respect to the density of the samples.
Applsci 14 01583 g011
Figure 12. Mortar. Results of compressive strength tests on mortars.
Applsci 14 01583 g012
Figure 13. Trend of mechanical strength values with identification of the classification of masonry mortars according to UNI EN 998-2:2016.
Applsci 14 01583 g013
Figure 14. Concrete. Flow test results.
Applsci 14 01583 g014
Figure 15. Concrete. Flow test S0 (a), S1 (b), S2 (c), S3 (d), and S4 (e).
Applsci 14 01583 g015
Figure 16. Concrete. Flow test S5 (a), S6 (b), S7 (c), S8 (d), S9 (e), and S10 (f).
Applsci 14 01583 g016
Figure 17. Concrete. Flow test S4 (a,b) and S6 (c,d).
Applsci 14 01583 g017
Figure 18. Concrete. Variation of thermal diffusivity and conductivity.
Applsci 14 01583 g018
Figure 19. Concrete. Variation of volumetric heat capacity and conductivity.
Applsci 14 01583 g019
Figure 20. Concrete. Variation of conductivity and heat capacity.
Applsci 14 01583 g020
Figure 21. Concrete. Variation of conductivity in relation to the % of EPS.
Applsci 14 01583 g021
Figure 22. Concrete. Trend of mechanical strength values in relation to the content of R-EPS.
Applsci 14 01583 g022
Figure 23. Trend of mechanical strength values in relation to density with identification of concrete classifications.
Applsci 14 01583 g023
Figure 24. Concrete. Classification of mixes based on mechanical strength and density.
Applsci 14 01583 g024
Figure 25. Concrete. Classification of mixes based on the volume percentage of R-EPS and conductivity with indications of the classification obtained for each sample.
Applsci 14 01583 g025
Table 1. Mortar. Mix design specifications, with indications of particle sizes (Ø 1–2 mm, 2–4 mm, and 4–6 mm).
Samples
M1Reference mortar (UNI EN 196-1)
M2R-EPS (4–6) 100%
M3R-EPS (2–4) 50% R-EPS (4–6) 50%
M4R-EPS (1–2) 25%R-EPS (2–4) 25%R-EPS (4–6) 50%
M5SAND (1–2) 25%SAND (2–4) 25%R-EPS (4–6) 50%
M6SAND (1–2) 50%SAND (2–4) 25%SAND (4–6) 25%
M7SAND (1–2) 50%SAND (2–4) 25%R-EPS (4–6) 25%
M8SAND (1–2) 50%R-EPS(2–4) 25%R-EPS (4–6) 25%
Table 2. Mortar. Mix design specifications, with indications of the quantity of each material.
SamplesEPS (1–2)EPS (2–4)EPS (4–6)Sand (1–2)Sand (2–4)Sand (4–6)CementWaterDensty
[kg][kg][kg][kg][kg][kg][kg][kg][kg/m3]
M1 1.350.450.2251716.572
M2 0.0081 0.450.225579.057
M3 0.00610.0041 0.450.225580.773
M40.00610.00300.0041 0.450.225583.348
M5 0.00410.55800.6140 0.450.2251569.094
M6 1.11590.61400.49610.450.2252459.202
M7 0.00201.11590.6140 0.450.2252040.359
M8 0.00300.00201.1159 0.450.2251522.445
Table 3. Concrete. Granulometric analysis of sand and gravel.
Sieve DiameterSand 0/6 SGravel GMix of Aggregates MTheoretical Fuller Curve CDeviation M-C
[mm]%%%%%
2010092.296.9100−3.1
1610067.887.289.4−2.3
1410051.080.583.7−3.2
12.510038.475.479.1−3.6
1010012.965.270.7−5.5
81003.661.563.2−1.7
6.398.73.660.756.14.6
5.695.53.658.852.95.9
483.63.651.744.77.0
261.83.638.631.67.0
143.43.627.522.45.2
0.2525.43.616.711.25.5
0.06315.31.59.85.64.2
Table 4. Concrete. Granulometric analysis of recycled R-EPS, conducted on a total weight of 100 g.
Sieve DiameterRemainRemain% in Weight
[mm]g%%
8121212
4545454
2242424
1666
0.52.532.5
0.25111
0.1250.510.5
0.063000
Table 5. Concrete. Composition of the mixtures.
Specimen CodeEPSSAND
% volume% volume
S00100
S12575
S25050
S37525
S41000
S5V (1–2)V (0–1) V (2–8)
S6V (2–4)V (0–2) V (4–8)
S7V (4–8)V (0–4)
S8V (1–4)V (0–1) V (4–8)
S9V (2–8)V (0–2)
S10V (1–8)V (0–1)
Table 6. Concrete. Mix design specifications, with indications of the quantity of each material.
SamplesEPS
(0–1)
EPS
(1–2)
EPS
(2–4)
EPS
(4–6)
EPS
(6–8)
Sand (0–1)Sand (1–2)Sand (2–4)Sand (4–6)Sand (6–8)GravelCementWaterAdditiveDensity
[kg][kg][kg][kg][kg][kg][kg][kg][kg][kg][kg][kg][kg][kg][kg/m3]
S0 6.4914.3071.6520.9150.02662267.500
S10.029 4.3071.6520.9150.02301172.399
S20.0074.8684.3071.6520.9150.02101993.725
S30.0143.2454.3071.6520.9150.01141719.949
S40.0221.6234.3071.6520.9150.03581449.174
S5 0.013 2.817 1.4150.9800.0844.3071.6520.9150.03582067.306
S6 0.007 2.8171.194 0.9800.0844.3071.6520.9150.03582028.900
S7 0.0042.8171.1941.415 4.3071.6520.9150.03582087.858
S8 0.0130.007 1.194 0.9800.0844.3071.6520.9150.03091828.706
S9 0.0070.0042.8171.194 4.3071.6520.9150.02861849.258
S10 0.0130.0070.0042.817 4.3071.6520.9150.02641649.064
Table 7. Thermal properties of mortars.
Specimen CodeD 1TC 1TD 1VHC 1
[kg/m3][W/mK][10−6 m2/s][106 J/m3K]
M121602.761.541.80
M28700.480.301.63
M39500.460.281.61
M48700.290.181.58
M514600.980.561.78
M622801.400.791.79
M717201.220.671.82
M815700.940.571.65
1 D = density; TC = thermal conductivity; TD = thermal diffusivity; VHC = volumetric heat capacity.
Table 8. Hygrothermal properties of mortars.
Specimen CodeD 1WVP 1WVRF 1
[kg/m3][10−12 kg/(msPa)][-]
M121601.17164.3
M28703.7152.1
M39504.2345.6
M48702.7071.6
M514603.0064.4
M622800.89216.4
M717203.7950.9
M815703.3457.7
1 D = density; WVP = water vapor permeability; WVRF = water vapor resistance factor.
Table 9. Mortars. ANOVA test for thermal conductivity.
Source of VariationSS 1Df 1MS 1Fp-ValueF Crit
Between groups0.2050570.02929329.384684285.53907 × 10−82.657197
Within groups0.01595160.000997
Total0.22123
1 SS = sum of squares; Df = degree of freedom; MS = mean square.
Table 10. Mortars. ANOVA test for compressive strength.
Source of VariationSS 1Df 1MS 1Fp-ValueF Crit
Between groups8411.7171201.673235.87536096.25658 × 10−152.657197
Within groups81.5124165.094525
Total8493.22323
1 SS = sum of squares; Df = degree of freedom; MS = mean square.
Table 11. Results of compressive strength tests on concrete.
Specimen CodeR1 1R2 1R3 1Rm 1σ
[MPa][MPa][MPa][MPa][MPa]
S050.4244.8648.7748.022.019
S131.2828.1127.8129.071.360
S213.2513.5813.4213.420.117
S311.5910.4310.8410.950.416
S45.274.915.185.120.132
S536.7335.5135.735.980.464
S632.7337.5334.9735.081.698
S741.137.2741.4939.951.649
S818.2120.1318.7819.040.697
S918.5520.8218.0819.151.036
S1016.2414.8514.9515.350.548
1 R1, R2, R3 = compressive strength of the samples; Rm = average compressive strength; σ = standard deviation.
Table 12. Cements. ANOVA test for thermal conductivity.
Source of VariationSS 1Df 1MS 1Fp-ValueF Crit
Between groups4.767764100.476776218.52251.26919 × 10−192.296696
Within groups0.048220.002182
Total4.81576432
1 SS = sum of squares; Df = degree of freedom; MS = mean square.
Table 13. Cements. ANOVA test for compressive strength.
Source of VariationSS 1Df 1MS 1Fp-ValueF Crit
Between groups5640.79710564.0797224.67659.38832 × 10−202.296696
Within groups55.23387222.51063
Total5696.03132
1 SS = sum of squares; Df = degree of freedom; MS = mean square.
Disclaimer/Publisher’s Note: The statements, opinions and data contained in all publications are solely those of the individual author(s) and contributor(s) and not of MDPI and/or the editor(s). MDPI and/or the editor(s) disclaim responsibility for any injury to people or property resulting from any ideas, methods, instructions or products referred to in the content.

