Article

Mechanical Properties of Rock Specimens Containing Pre-Existing Cracks with Different Dip Angles Based on Energy Theory and Cohesive Element Method

1
School of Civil and Resource Engineering, University of Science and Technology Beijing, Beijing 100083, China
2
Institute of Architectural Civil Engineering, Langfang Normal University, Langfang 065000, China
3
Research Institute of Petroleum Exploration and Development, PetroChina, Beijing 100083, China
4
China Petroleum Pipeline Engineering Corporation, Langfang 065000, China
*
Author to whom correspondence should be addressed.
Appl. Sci. 2024, 14(4), 1484; https://doi.org/10.3390/app14041484
Submission received: 1 December 2023 / Revised: 23 January 2024 / Accepted: 9 February 2024 / Published: 12 February 2024
(This article belongs to the Special Issue Rock Mass Characterization: Failure and Mechanical Behavior)

Abstract

:
To investigate the influence of the crack dip angle on the strength of rock specimens, uniaxial compression tests were conducted on granite specimens containing pre-existing cracks. The strain energy evolution during the loading process was analyzed, and the loading-induced cracking process was simulated using the cohesive element method. Both the experimental and numerical results indicate that cracks significantly impact the plastic-yielding stage of the stress–strain curve more than the initial and elastic deformation stages. When the crack dip angle is less than 45°, the stress concentration near the crack is significant, which is an important factor affecting the strength and elastic strain energy distribution of rock specimens. When the crack dip angle is greater than 45°, the degree of stress concentration decreases, and the uniformity of the elastic strain energy distribution and the possibility of crack bifurcation increase. Combining the energy theory with the cohesive element method helps comprehensively understand the initiation, propagation, and coalescence of microcracks near pre-existing crack tips. These research results can provide a reference for geotechnical engineering design and structural stability assessment.

1. Introduction

Rocks with existing cracks are prevalent in natural formations and are encountered in various engineering applications, such as tunneling, mining, and the construction of underground structures [1,2]. The presence of cracks influences the overall strength, deformability, and failure mechanisms of rock masses [3,4,5]. The exploration of the fracture behavior and mechanical response of cracked rock masses not only holds significance for understanding the structural integrity and stability of geological formations, but also plays a pivotal role in enhancing the safety and efficiency of engineering projects.
By subjecting rock specimens to controlled laboratory tests, researchers gain valuable insights into the fundamental properties governing the strength, deformability, and failure mechanisms of cracked rocks. Mohammadi and Pietruszczak [6] focused on the analysis of the damage process of rocks that contain some pre-existing fractures. Yuan et al. [7] investigated the impact of the crack dip angle on the mechanical properties and failure modes of pre-cracked red sandstone in underground engineering, revealing a five-stage stress–strain curve and an increase in peak strength with the crack dip angle. Sun et al. [8] conducted uniaxial compression and acoustic emission tests on sandstones with different joint dip angles, revealing a shift in the failure mechanism from tensile to shear with a critical angle of 45°. Peng et al. [9] studied the influence of crack dip angles on the energy characteristics of sandstones, showing that larger crack dip angles correspond to a higher energy storage but lower energy dissipation in rocks, explaining the enhanced bearing capacity with larger crack dip angles from an energy perspective. Pan et al. [10] and Liu et al. [11] explored the effect of crack dip angles on the mechanical properties and fracture evolution mechanism of granite under uniaxial and triaxial compression, revealing weakened brittle and enhanced plastic characteristics with varying dip angles, impacting compressive strength, elastic modulus, and failure modes. These studies not only enhance the understanding of the mechanical properties of fractured rocks, but also provide a theoretical basis for geotechnical engineering, structural design, and geological hazard assessments.
By combining laboratory experiments with advanced numerical modeling techniques, researchers have conducted in-depth research on microcrack initiation, propagation, and coalescence at the tip of joints, seeking to obtain the basic mechanical response and fracture characteristics of cracked rocks under different loading conditions. In terms of numerical simulation methods, cracked rock simulation is mainly achieved through the extended finite element method (XFEM) [12,13], the discrete element method (DEM) [14,15], the phase-field method [16,17], the finite-discrete element method (FDEM) [18,19], and the peridynamics (PD) [20]. Compared with laboratory tests, numerical simulations can provide information on the stress distribution evolution and microcrack propagation path during the rock fracture process [21,22,23,24].
This study analyzed the deformation and mechanical characteristics of granite specimens containing pre-existing cracks during loading through uniaxial compression tests and numerical simulations. The numerical simulation was based on the cohesive element method, which uses one or more cohesive elements to model crack behavior. These elements introduce a physical parameter known as “cohesive” or “adhesive strength” near the crack surfaces. These cohesive forces simulate the interaction between materials along the crack or contact interface, allowing for the precise representation of crack initiation, propagation, and closure in numerical simulations. Based on the energy theory and cohesive element method, discussions are presented here on how the dip angle of cracks affects the uniaxial compression strength, stress concentration, and elastic strain energy evolution of cracked granite specimens.

2. Theory and Methods

2.1. Uniaxial Compression Test

The rock specimens used in this study were granite processed into standard cylindrical specimens with a height of 100 mm and a diameter of 50 mm. Generally, using rectangular specimens to study the fracture behavior of rock specimens is a typical practice in fracture mechanics, which allows for cracks to be simplified into two-dimensional planes for analysis. However, the most used method in geological and geotechnical engineering research involves drilling cylindrical rock cores to obtain specimens representative of underground conditions. This study aimed to investigate the effect of cracks on the overall mechanical properties of rock specimens. Using cylindrical specimens makes getting typical stress–strain curves and relevant mechanical parameters easier, providing valuable insights into fracture mechanics. Additionally, conducting tests with cylindrical specimens aligns with the testing standards recommended by the International Society for Rock Mechanics, contributing to ensuring the consistency and comparability of experimental results.
The pre-existing cracks were fabricated using the ultra-high-pressure CNC waterjet cutting method. The pre-existing cracks were located at the center of the specimen, with a length of 10 mm and a width of 1 mm, inclined at a dip angle α with the horizontal plane. The α values were 15°, 30°, 45°, 60°, 75°, and 90°, respectively. The schematic diagram of a pre-cracked specimen is shown in Figure 1. To determine the crack fracture behavior, using sharp crack tips is more in line with the recommended standard than using blunt crack tips. On the one hand, due to the strength of granite and the precision of the processing equipment, it was challenging for us to prepare granite specimens with sharp crack tips. On the other hand, the testing in this study aimed to investigate the influence of cracks on the macroscopic mechanical properties and fracture patterns of specimens without delving into the initiation and propagation behaviors of crack tips. Therefore, using blunt crack tips was suitable to achieve the objectives of this research.
The uniaxial compression test was conducted using the MTS 815 rock mechanics testing system, as shown in Figure 2. The initial and elastic stages of the compression test were controlled through axial loading, with a loading rate of 20 kN/min. When reaching the damage stage, it was switched to a radial displacement control, with a loading rate of 0.04 mm/min until the specimen ruptured.

2.2. Energy Theory

The total energy involved in the loading process of rock specimens is mainly generated by external forces and stored in the form of strain energy. The total energy within the specimen can be expressed as a field function, namely, the strain energy density, and can be divided into two categories: (1) the strain energy stored in the rock unit as a result of deformation as a continuous mechanical medium, referred to as elastic strain energy; (2) the strain energy consumed due to discontinuous displacements such as friction or the micro-slip of the mineral grains in the rock specimen, referred to as dissipation strain energy. The composition of strain energy density in the principal stress space can be represented as shown in Figure 3. The shaded area represents the elastic strain energy stored in the rock specimens, while the blank area represents the dissipation strain energy.
By applying the first law of thermodynamics within the closed system, we can obtain the following:
U = U e + U d
where U is the total strain energy density, U e is the elastic strain energy density, and U d is the dissipation strain energy density.
The strain energy in the principal stress space is defined as:
U = 0 ε i σ i d ε i
where σ i and ε i represent the stress and strain components in the principal stress direction, respectively.
The formula for calculating the elastic strain energy of a continuous medium is as follows:
U e = 1 2 σ i ε i
By substituting the generalized Hooke’s law into Equation (3), we obtain the following:
U e = 1 2 E 0 σ 1 2 + + σ 2 2 + σ 3 2 2 v σ 1 σ 2 + σ 1 σ 3 + σ 2 σ 3
where E 0 represents the initial elastic modulus, and v represents the Poisson’s ratio.
In uniaxial compression tests, σ 2 = σ 3 = 0 . Thus, the total elastic strain energy and the dissipation strain energy can be expressed as:
U e = 1 2 E 0 σ 1 2
U d = 0 ε 1 σ 1 d ε 1 1 2 E 0 σ 1 2

2.3. Cohesive Element Method

Since Hillerborg et al. [25] proposed the cohesive element method in 1976, it has gradually become one of the most widely used crack simulation methods. The cohesive element method simulates cracking by inserting cohesive elements between solid elements. Cohesive elements can effectively simulate the entire crack initiation, propagation, and failure process, thereby reflecting the failure process of quasi-brittle materials [26].
The failure mode of rock typically consists of three zones: the intact rock zone unaffected by cracks, the fracture process zone (FPZ), and the fully cracked zone, as shown in Figure 4. In cohesive elements, failure is manifested through the damage constitutive models. The commonly used constitutive forms of cohesive elements are linear, bilinear, and exponential, as shown in Figure 5. When the load σ m on a node is smaller than the tensile or shear strength σ 0 , the stiffness K p of the cohesive element node remains unchanged. When the load further increases and exceeds the strength σ 0 , damage begins to occur in the cohesive element, and the stiffness decreases in different forms, indicating different constitutive relationships. The damage D s is defined as:
D s = 1 K m K p
where K m represents the nodal stiffness at the nodal load of σ m .
For the linear damage constitutive model, D s can be expressed as the relative displacement of nodes through transformation:
D s = δ f δ m δ 0 δ m δ f δ 0
where δ f represents the maximum relative displacement that cohesive element nodes can undergo, and its value is determined by the area of the constitutive relationship curve, which represents the fracture energy (Gf). From Equation (8), it can be inferred that when δ m = δ 0 and D s = 0, the cohesive element shows no damage; when δ m = δ f and D s = 1, the cohesive element is completely damaged.
According to the definition of damage, the constitutive equation for cohesive elements can be written as follows:
σ = 1 D S K p δ
No cracks are generated in the intact rock state, and the constitutive model that represents this state corresponds to the δ m < δ 0 stage. The displacement δ m generated in this state is relatively small and can be considered as the absence of relative displacement between the unit nodes. As the crack further expands, the previously unaffected region enters the vicinity of the crack tip and undergoes plastic-yielding, referred to as the FPZ. The cohesive element simulates this process by incorporating damage treatment to the stiffness through the constitutive equation, and it starts to possess thickness in this state. As the load increases, energy accumulates until it reaches the fracture energy, at which point fracture occurs. The cohesive element has reached its maximum thickness and experiences failure at this stage.

3. Results and Discussion

3.1. Stress–Strain Curves

The stress–strain curves of cracked specimens with different crack dip angles under uniaxial compression tests are shown in Figure 6. The uniaxial compression of rocks typically undergoes initial compaction, elastic deformation, plastic-yielding, and brittle failure stages. The presence of pre-existing cracks leads to stress concentration, resulting in variations in the stress–strain curves of the rock specimens. The pre-existing cracks impact the plastic-yielding stage more than the initial and elastic deformation stages of the stress–strain curves. In the initial compaction and elastic deformation stages, the stress–strain curves of the cracked specimens with different crack dip angles are roughly similar. At these two stages, the rock has not yet formed new microcracks, and the influence of pre-existing cracks is limited to the crack tips, exerting little effect on the overall stress–strain curve and mechanical properties of the specimens.

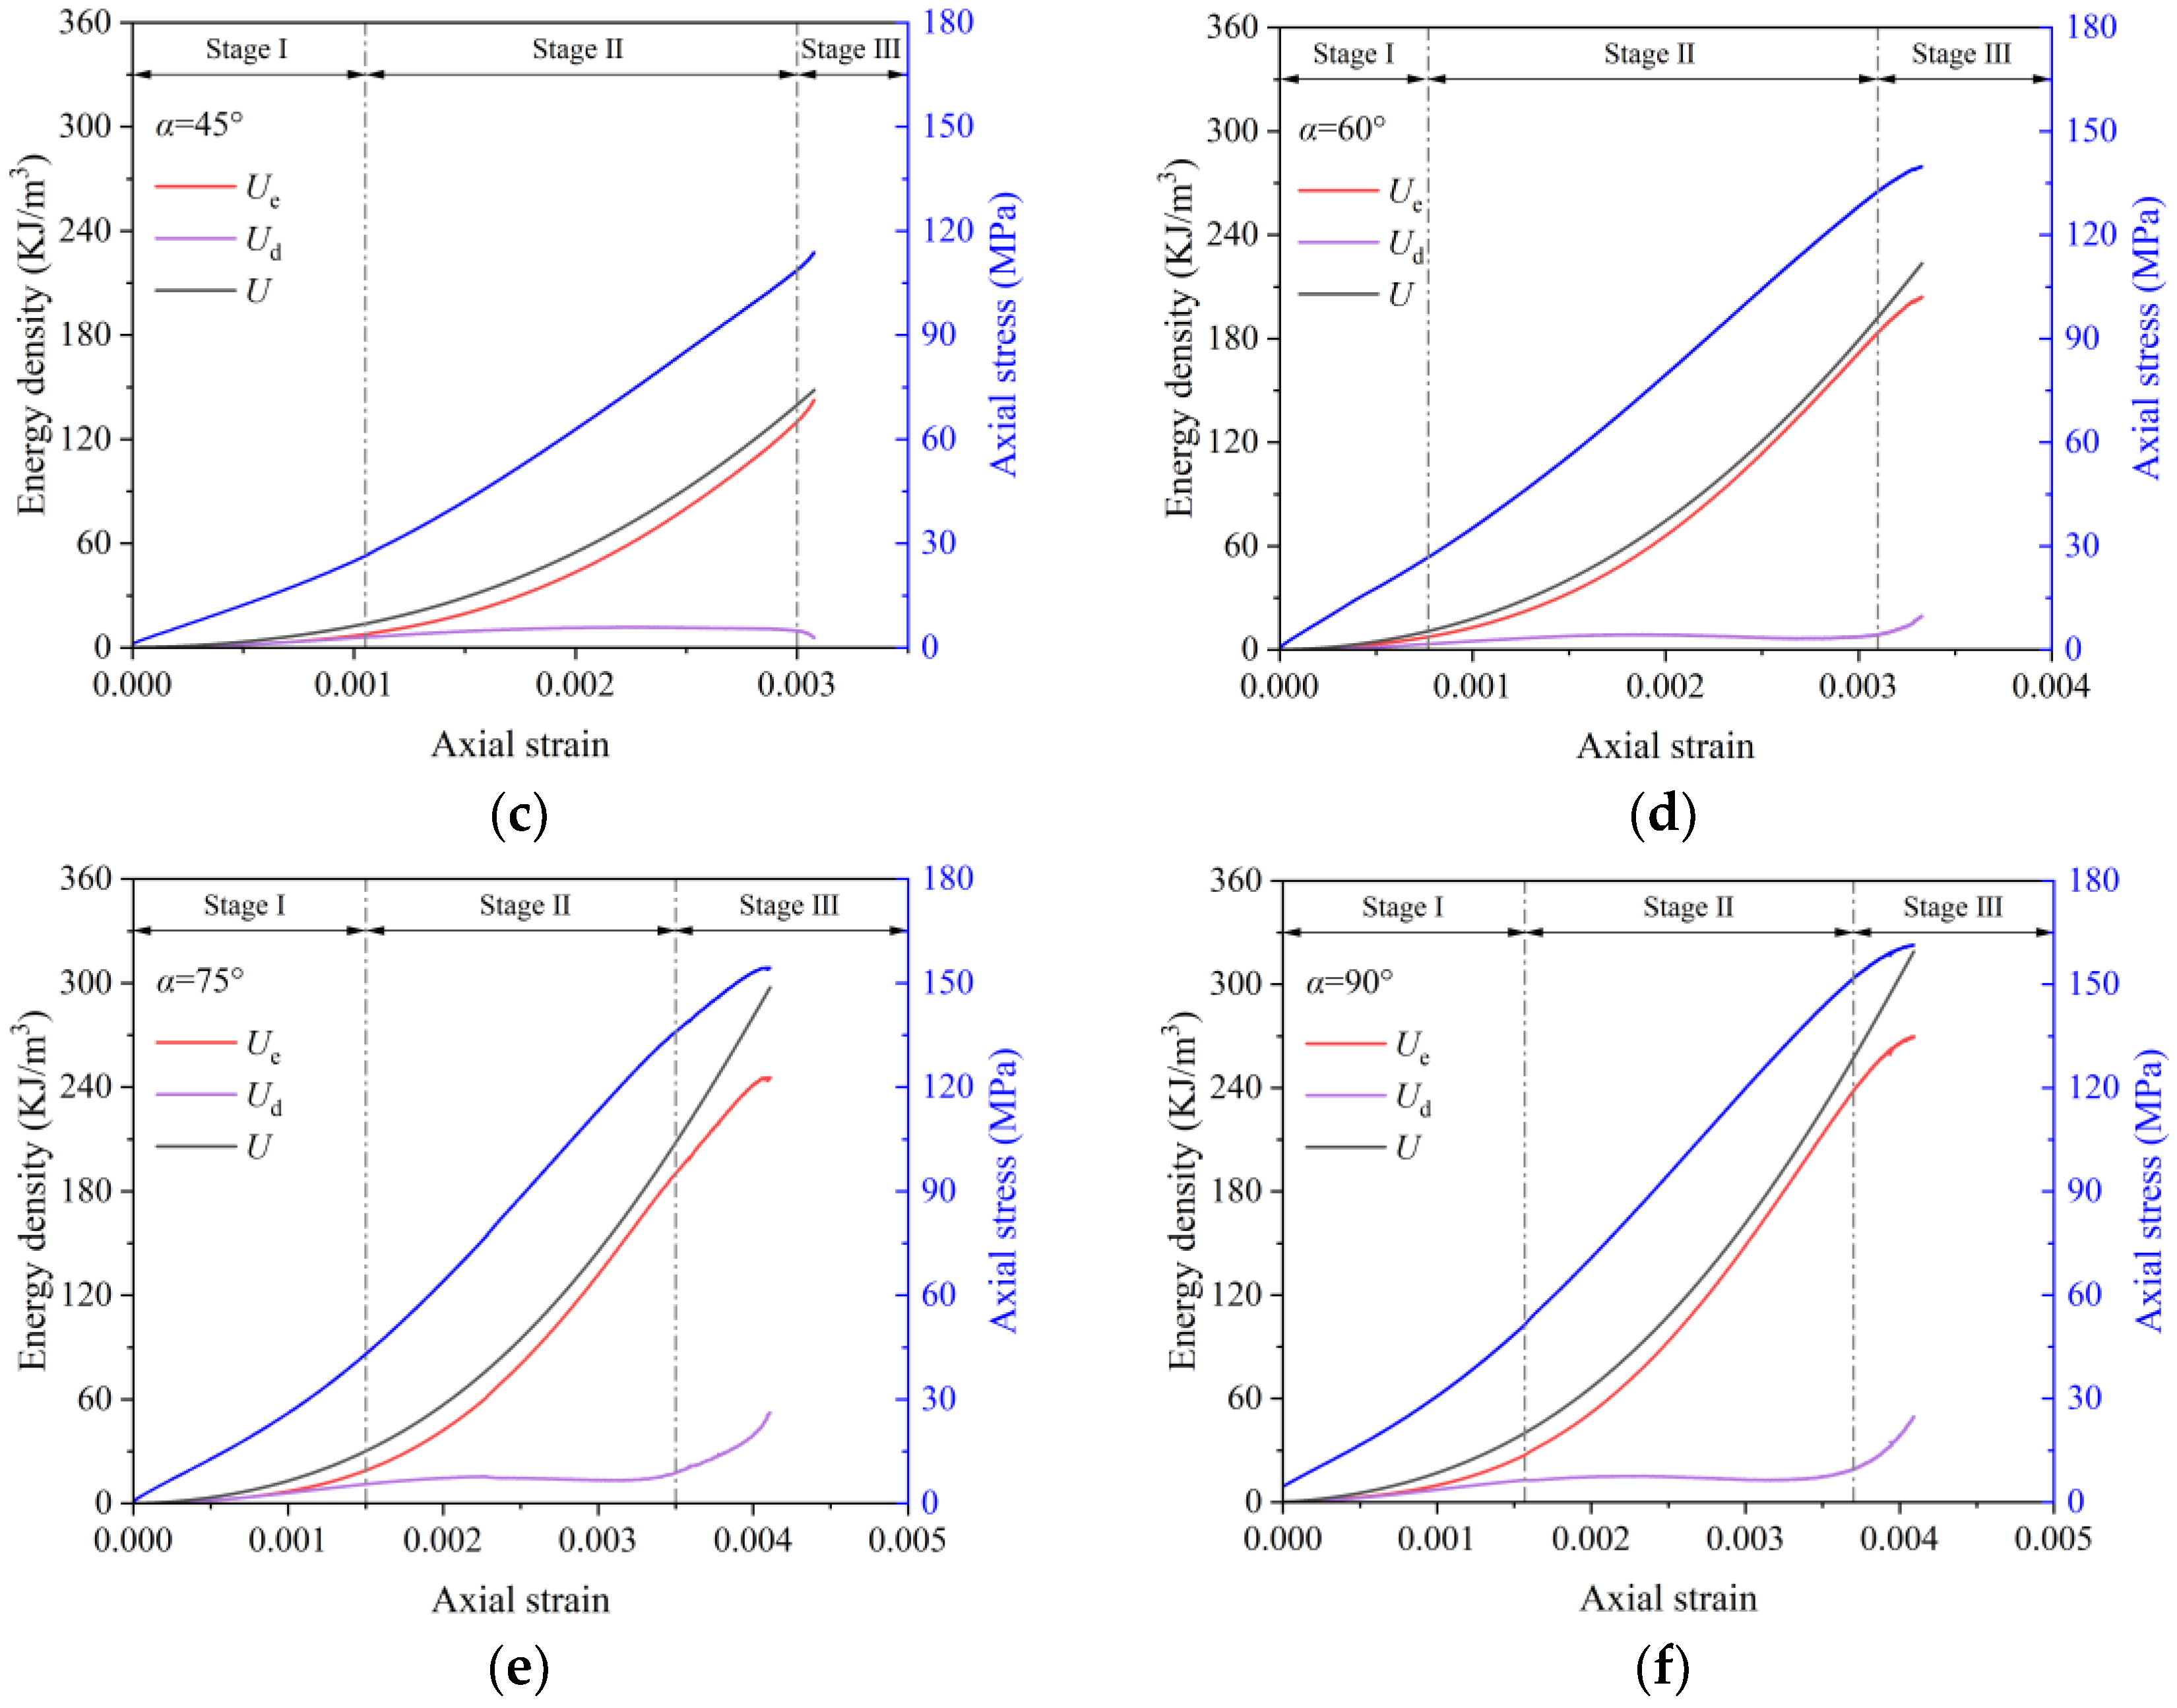
3.2. Energy Evolution Analysis

The strain energy variation of cracked specimens with different crack dip angles during loading is illustrated in Figure 7. In the initial compaction stage (stage Ⅰ), there are no apparent differences in the curves of the specimens, and both the elastic strain energy and the dissipation strain energy increase gradually with loading. The accumulation of elastic strain energy is caused by the elastic deformation of the specimen, while the generation of the dissipation strain energy is due to energy consumption during the compaction process. The energy required for the closure of microcracks or micropores increases with the increase in compaction degree. In the elastic stage (stage Ⅱ), the elastic strain energy increases linearly with axial strain, while the dissipation strain energy slightly decreases. At this stage, the microcracks are completely closed, thus reducing the dissipation strain energy. In the plastic-yielding stage (stage Ⅲ), the accumulation rate of elastic strain energy slows down, and the dissipation strain energy increases rapidly.

3.3. Effect of Crack Dip Angle on UCS and Energy Density

Figure 8 presents the energy density and UCS of the cracked specimens with different crack dip angles. As the crack dip angle increases from 15° to 45°, the UCS of the cracked specimens gradually decreases. The cracked specimen with a crack dip angle of 45° exhibits the lowest UCS, measuring only 113.44 MPa. When the crack dip angle exceeds 45°, the UCS of the cracked specimens increases with the increase in the crack dip angle. When the crack dip angle is 90°, the maximum UCS reaches 161.74 MPa. The cracked specimens can withstand greater loads when the UCS is higher, thus having a higher energy storage capacity. Therefore, the variation trend of the elastic strain energy density with the crack dip angle is the same as that of UCS.
Due to the influence of cracks, stress concentration mainly occurs near the tips of a pre-existing crack, which is also where new microcracks are generated. The influence of the pre-existing crack on the UCS is reflected in two ways: (1) the cracks with different dip angles result in varying degrees of stress concentration, leading to the generation of different numbers of microcracks; (2) the initiation and closure of microcracks affect the magnitude of dissipated strain energy, thereby altering the ability of the cracked specimen to accumulate elastic strain energy.

3.4. Numerical Simulation Results

To ensure that the FPZ can be simulated by cohesive elements and reduce grid dependency, the length of the cohesive elements should be smaller than the FPZ. The numerical specimen was refined near the pre-existing crack, and the size of the cohesive elements was set to 0.1 mm. Additionally, the grid was randomized to prevent the crack propagation direction from being influenced by the position of the cohesive elements. Fixing the boundary at the bottom of the specimen during modeling prevents horizontal or vertical displacement during compression loading. The sides of the numerical specimen were free surfaces. Free boundary conditions were applied to allow for the sides to expand freely without introducing additional constraints. The established numerical simulation model is shown in Figure 9.
In the simulation, displacement was applied to represent the loading conditions of the experiment. This was achieved by applying a displacement of 0.5 mm at the top of the specimen. It should be noted that in laboratory tests, the loading rate is controlled at 0.05 mm/min to ensure that the specimen is always under quasi-static loading conditions. In numerical simulation, the impact of dynamic loads caused by loading rate on the test results should also be minimized as much as possible. Therefore, this study set the loading time step to 5 × 10⁻⁶. The rationality of the numerical model was ensured by comparing the stress–strain curves obtained from numerical results with those obtained from experiments. The comparison results are shown in Figure 10.

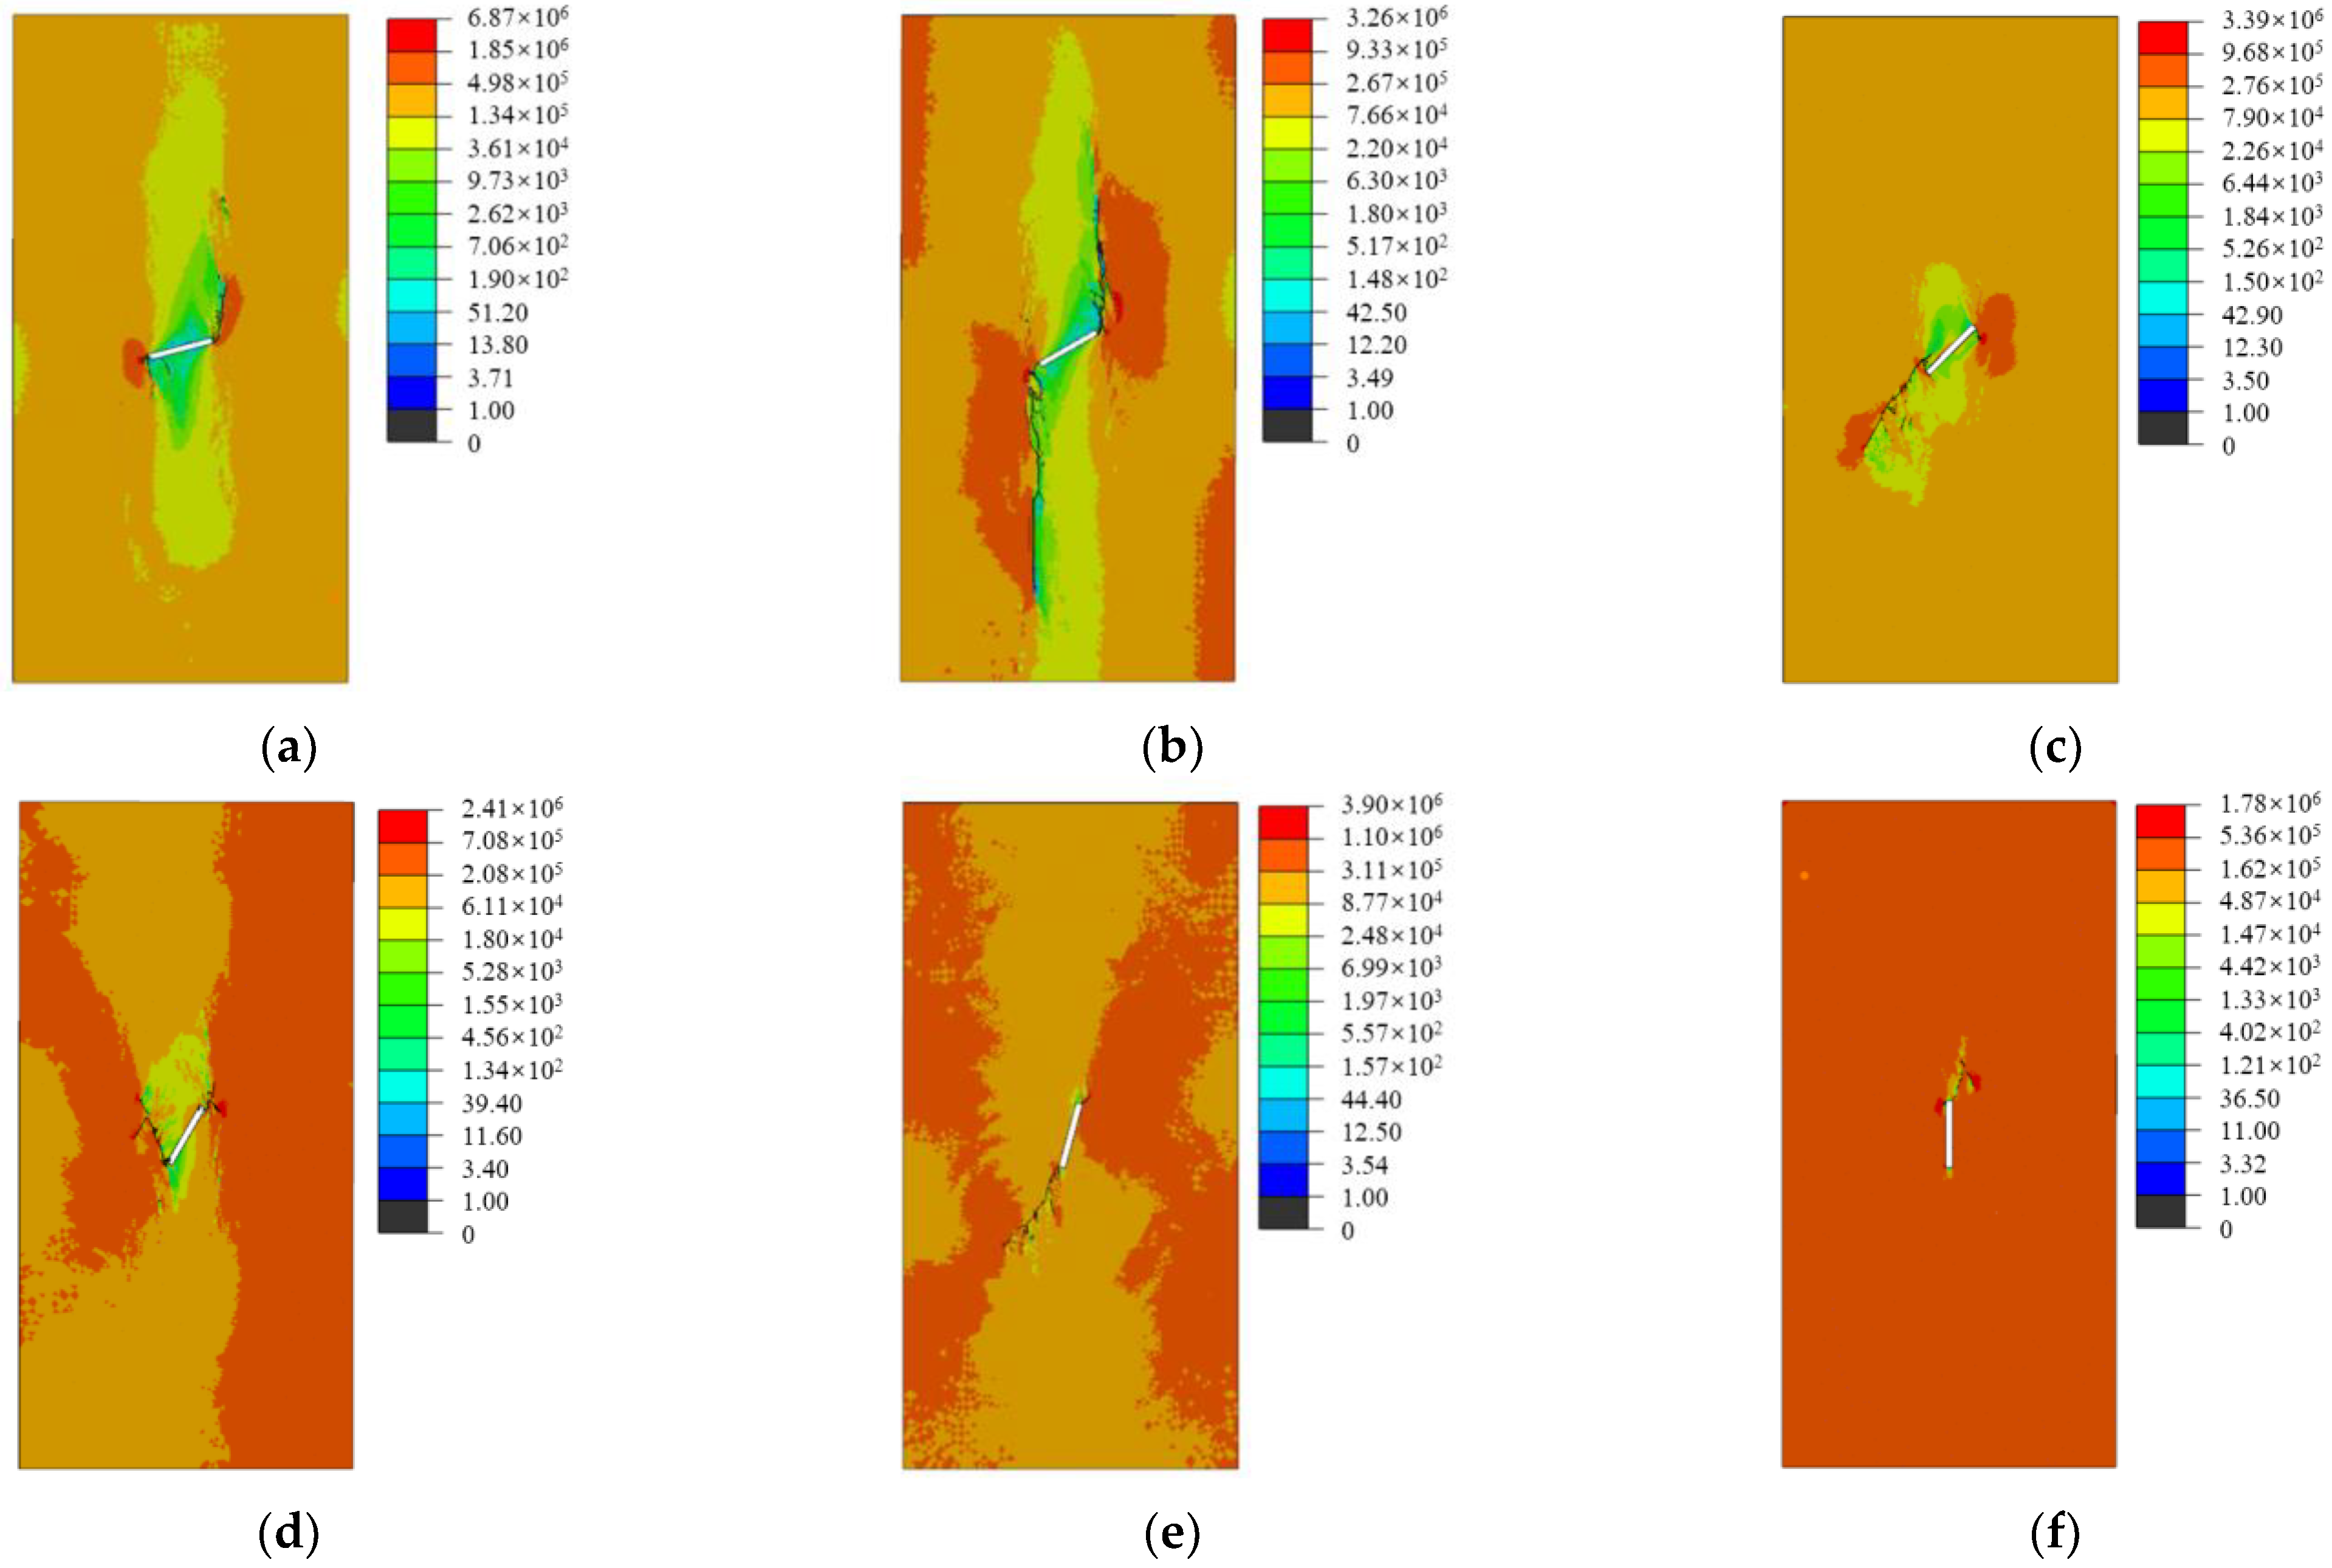
3.5. Failure Mode and Stress Concentration Factor

A comparison of the failure modes of the cracked specimens in the experiments and numerical simulations is shown in Figure 11. In general, the cracked specimens with different crack dip angles all exhibit specific characteristics of splitting failure, with a tendency for conjugate failure. When the crack dip angle is below 45°, the crack direction tends to be more vertical, and the splitting features are more prominent. In the failure stage, the cracked specimens with crack dip angles of 15° and 30° show a larger FPZ (red cracks) in the model, indicating that when the crack dip angle is smaller, the damaged area of the rock is larger. At the same time, due to the damaged state of these areas, their subsequent load-bearing capacity is significantly reduced, resulting in many splitting cracks caused by tensile loads induced by the Poisson effect. As the crack dip angle increases, the area of FPZ falls, and the crack propagation direction is no longer concentrated in the vertical direction. The rock strength is not limited by tensile strength, and the shear strength can be further exerted, leading to an increase in the overall strength of the specimen. More branching cracks appear at this point, and the cracks exhibit conjugate patterns, consistent with the characteristics of shear failure.
In studies focused on the macroscopic response of rock specimens, stress concentration factors provide insights into the localized stress amplification effects without delving into the detailed crack tip behavior. If the objective is to investigate crack initiation and propagation specifically, stress intensity factors may provide more detailed insights. The limitation of the stress concentration factors is that its calculation often relies on a linear elasticity assumption, which may not accurately represent the nonlinear behavior of rocks, especially in post-peak or post-failure conditions. To analyze the stress concentration in cracked specimens with different crack dip angles during loading, the stress concentration factors were calculated at 80% of the UCS. At this point, the loading-induced new microcracks have yet to develop extensively, allowing for an effective reflection of the stress concentration caused by pre-existing cracks. The maximum principal stress distribution at 80% of the UCS is shown in Figure 12. It should be noted that in Abaqus, the tensile stress direction is considered positive. Therefore, the maximum principal stress in uniaxial compression of the rock is the minimum principal stress in Abaqus. Additionally, in this model, the cohesive elements have a stress of 0 MPa when they fail, and a few cohesive elements fail at 80% of the UCS, resulting in a stress of 0 MPa. The calculation results of maximum principal stresses and stress concentration factors are shown in Table 1.
The calculation results indicate that under uniaxial compression conditions, the stress concentration is related to the pre-existing crack, and the stress concentration factor decreases with the increase in the crack dip angles. When the crack dip angle is 15°, the stress concentration factor is 5.91, dramatically decreasing to only 1.78 when the crack dip angle is 90°. These calculation results also support the previous analysis of the overall strength and failure modes of the cracked specimens, namely, the smaller the crack dip angle, the higher the stress concentration near the pre-existing crack, making it more prone to plastic-yielding during loading. The opposite holds for the cracked specimens with larger crack dip angles.
The distribution of the elastic strain energy density at UCS is shown in Figure 13. The influence of the pre-existing crack on energy distribution is mainly reflected in the crack tip and near the crack surface. Due to stress concentration, there is always a small range of strain energy storage at the crack tip. The energy distribution near the crack surface is less, indicating that the crack surface lacks constraint, and energy can be transferred to the interior of the pre-existing crack through displacement in the rock and released, thus being unable to accumulate. These energy distributions are related to stress concentration, and the elastic strain energy in the focused area reaches the fracture energy earlier, making it more prone to failure. When the crack dip angle is larger, the stress concentration factor decreases, and the energy distribution becomes more uniform. In this case, the crack propagation direction is also more likely to bifurcate.

4. Conclusions

The stress–strain curves, strain energy evolution, and stress concentration of cracked granite specimens under uniaxial compression were studied, and the following conclusions were drawn:
(1)
In the initial compaction and elastic deformation stages, the stress–strain curves of the cracked specimens with different crack dip angles are roughly similar. The pre-existing cracks impact the damage stage more than the initial and elastic deformation stages.
(2)
The UCS of the cracked rock specimens is affected by the dip angle of pre-existing cracks. As the crack dip angle increases, the UCS first decreases and then increases. The cracked rock specimens with a crack dip angle of 45° may be more prone to failure under loading.
(3)
The stress concentration coefficient decreases with the increase in the crack dip angles. The smaller the crack dip angle, the higher the stress concentration near the pre-existing crack, making it more prone to plastic-yielding under uniaxial compression.
(4)
The influence of pre-existing cracks on the elastic strain energy distribution is evident, with stress concentration at the crack tip and limited energy storage near the crack surface, highlighting the role of elastic strain energy accumulation in early crack initiation.

Author Contributions

Conceptualization, L.T. and Z.F.; methodology, L.T. and Z.W.; software, Z.F.; validation, L.T., Z.F. and B.L.; formal analysis, Z.F., Z.W. and B.L.; investigation, Z.W. and B.L.; resources, L.T. and J.Z.; writing—original draft preparation, L.T., Z.F. and J.Z.; writing—review and editing, L.T. and J.P.; supervision, J.P.; project administration, L.T.; funding acquisition, L.T. and J.Z. All authors have read and agreed to the published version of the manuscript.

Funding

This research was funded by the Hebei Province Social Science Fund Project (No. HB22YS010), the Research Start-up Fund for Doctoral (Postdoctoral) Programs at Langfang Normal University (No. XBQ202113), and the Natural Science Foundation of Hebei Province of China (No. A2021408004).

Institutional Review Board Statement

Not applicable.

Informed Consent Statement

Not applicable.

Data Availability Statement

Data will be made available on request.

Conflicts of Interest

The authors declare no conflicts of interest.

References

  1. Milne, D.; Hadjigeorgiou, J.; Pakalnis, R. Rock mass characterization for underground hard rock mines. Tunn. Undergr. Space Technol. 1998, 13, 383–391. [Google Scholar] [CrossRef]
  2. Regassa, B.; Xu, N.; Mei, G. An equivalent discontinuous modeling method of jointed rock masses for DEM simulation of mining-induced rock movements. Int. J. Rock Mech. Min. Sci. 2018, 108, 1–14. [Google Scholar] [CrossRef]
  3. Yang, G.; Leung, A.K.; Xu, N.; Zhang, K.; Gao, K. Three-dimensional physical and numerical modelling of fracturing and deformation behaviour of mining-induced rock slopes. Appl. Sci. 2019, 9, 1360. [Google Scholar] [CrossRef]
  4. Guo, Q.; Hong, W.; Xi, X.; Pan, J.; Zhang, Y.; Wang, S. Effect of heterogeneity on the failure of rock with an initial crack under uniaxial compressions: A numerical study. Lithosphere 2022, 2022, 6518010. [Google Scholar] [CrossRef]
  5. Pan, J.L.; Cai, M.F.; Li, P.; Guo, Q.F. A damage constitutive model of rock-like materials containing a single crack under the action of chemical corrosion and uniaxial compression. J. Cent. South Univ. 2022, 29, 486–498. [Google Scholar] [CrossRef]
  6. Mohammadi, H.; Pietruszczak, S. Description of damage process in fractured rocks. Int. J. Rock Mech. Min. Sci. 2019, 113, 295–302. [Google Scholar] [CrossRef]
  7. Yuan, Y.; Fu, J.; Wang, X.; Shang, X. Experimental study on mechanical properties of prefabricated single-cracked red sandstone under uniaxial compression. Adv. Civ. Eng. 2020, 2020, 8845368. [Google Scholar] [CrossRef]
  8. Sun, B.; Yang, H.; Zeng, S.; Luo, Y. Damage constitutive and failure prediction of artificial single-joint sandstone based on acoustic emission. Geotech. Geol. Eng. 2022, 40, 5577–5591. [Google Scholar] [CrossRef]
  9. Peng, K.; Wang, Y.; Zou, Q.; Liu, Z.; Mou, J. Effect of crack angles on energy characteristics of sandstones under a complex stress path. Eng. Fract. Mech. 2019, 218, 106577. [Google Scholar] [CrossRef]
  10. Pan, J.; Wu, X.; Guo, Q.; Xi, X.; Cai, M. Uniaxial experimental study of the deformation behavior and energy evolution of conjugate jointed rock based on AE and DIC methods. Adv. Civ. Eng. 2020, 2020, 8850250. [Google Scholar] [CrossRef]
  11. Liu, X.; Wang, G.; Song, L.; Hu, R.; Ma, X.; Ou, X.; Zhong, S. Study on the influence of fracture dip angle on mechanical and acoustic emission characteristics of deep granite. Nat. Hazards 2023, 118, 95–116. [Google Scholar] [CrossRef]
  12. Wang, H. Numerical modeling of non-planar hydraulic fracture propagation in brittle and ductile rocks using XFEM with cohesive zone method. J. Pet. Sci. Eng. 2015, 135, 127–140. [Google Scholar] [CrossRef]
  13. Deb, D.; Das, K.C. Enriched finite element procedures for analyzing decoupled bolts installed in rock mass. Int. J. Numer. Anal. Methods Geomech. 2011, 35, 1636–1655. [Google Scholar] [CrossRef]
  14. Scholtès, L.; Donzé, F.V. A DEM model for soft and hard rocks: Role of grain interlocking on strength. J. Mech. Phys. Solids 2013, 61, 352–369. [Google Scholar] [CrossRef]
  15. Scholtès, L.U.C.; Donzé, F.V. Modelling progressive failure in fractured rock masses using a 3D discrete element method. Int. J. Rock Mech. Min. Sci. 2012, 52, 18–30. [Google Scholar] [CrossRef]
  16. Li, Y.; Yu, T.; Natarajan, S. An adaptive isogeometric phase-field method for brittle fracture in rock-like materials. Eng. Fract. Mech. 2022, 263, 108298. [Google Scholar] [CrossRef]
  17. Xu, B.; Xu, T.; Xue, Y.; Heap, M.J.; Ranjith, P.G.; Wasantha, P.L.P.; Li, Z. Phase-field modeling of crack growth and interaction in rock. Geomech. Geophys. Geo-Energy Geo-Resour. 2022, 8, 180. [Google Scholar] [CrossRef]
  18. Ma, G.; Zhou, W.; Regueiro, R.A.; Wang, Q.; Chang, X. Modeling the fragmentation of rock grains using computed tomography and combined FDEM. Powder Technol. 2017, 308, 388–397. [Google Scholar] [CrossRef]
  19. Han, H.; Fukuda, D.; Liu, H.; Salmi, E.F.; Sellers, E.; Liu, T.; Chan, A. FDEM simulation of rock damage evolution induced by contour blasting in the bench of tunnel at deep depth. Tunn. Undergr. Space Technol. 2020, 103, 103495. [Google Scholar] [CrossRef]
  20. Gao, C.; Zhou, Z.; Li, Z.; Li, L.; Cheng, S. Peridynamics simulation of surrounding rock damage characteristics during tunnel excavation. Tunn. Undergr. Space Technol. 2020, 97, 103289. [Google Scholar] [CrossRef]
  21. Mohammadnejad, M.; Liu, H.; Chan, A.; Dehkhoda, S.; Fukuda, D. An overview on advances in computational fracture mechanics of rock. Geosyst. Eng. 2021, 24, 206–229. [Google Scholar] [CrossRef]
  22. Tang, C.A.; Kaiser, P.K. Numerical simulation of cumulative damage and seismic energy release during brittle rock failure—Part I: Fundamentals. Int. J. Rock Mech. Min. Sci. 1998, 35, 113–121. [Google Scholar] [CrossRef]
  23. Pan, J.; Zhang, Y.; Li, P.; Wu, X.; Xi, X. Mechanical properties and thermo-chemical damage constitutive model of granite subjected to thermal and chemical treatments under uniaxial compression. Constr. Build. Mater. 2023, 390, 131755. [Google Scholar] [CrossRef]
  24. Luo, T.; Chen, S.; Li, B. Experimental Investigation on the Destruction Features and Acoustic Characteristics of a Brittle Rock Sample Containing Both 2D and 3D Preset Flaws. Appl. Sci. 2023, 13, 12705. [Google Scholar] [CrossRef]
  25. Hillerborg, A.; Modéer, M.; Petersson, P.E. Analysis of crack formation and crack growth in concrete by means of fracture mechanics and finite elements. Cem. Concr. Res. 1976, 6, 773–781. [Google Scholar] [CrossRef]
  26. Deng, P.; Liu, Q.; Huang, X.; Liu, Q.; Ma, H.; Li, W. Acquisition of normal contact stiffness and its influence on rock crack propagation for the combined finite-discrete element method (FDEM). Eng. Fract. Mech. 2021, 242, 107459. [Google Scholar] [CrossRef]
Figure 1. Schematic diagram of cracked granite specimen.
Applsci 14 01484 g001
Figure 2. MTS 815 rock mechanics testing system.
Applsci 14 01484 g002
Figure 3. Relationship between the components of strain energy.
Applsci 14 01484 g003
Figure 4. Fracture process zone (FPZ).
Applsci 14 01484 g004
Figure 5. Constitutive equation for cohesive elements.
Applsci 14 01484 g005
Figure 6. Stress–strain curves of cracked specimens with different crack dip angles.
Applsci 14 01484 g006
Figure 7. Energy evolution of cracked specimens with different crack dip angles. (a) α = 15°; (b) α = 30°; (c) α = 45°; (d) α = 60°; (e) α = 75°; (f) α = 90°.
Applsci 14 01484 g007aApplsci 14 01484 g007b
Figure 8. Variation of energy density and UCS with crack dip angles.
Applsci 14 01484 g008
Figure 9. Numerical simulation model.
Applsci 14 01484 g009
Figure 10. Numerical simulation and experimental stress–strain curve. (a) α = 15°; (b) α = 30°; (c) α = 45°; (d) α = 60°; (e) α = 75°; (f) α = 90°.
Applsci 14 01484 g010
Figure 11. Failure mode of cracked specimens in experiments and simulations. (a) α = 15°; (b) α = 30°; (c) α = 45°; (d) α = 60°; (e) α = 75°; (f) α = 90°.
Applsci 14 01484 g011
Figure 12. Maximum principal stress distribution at 80% of UCS. (a) α = 15°; (b) α = 30°; (c) α = 45°; (d) α = 60°; (e) α = 75°; (f) α = 90°.
Applsci 14 01484 g012
Figure 13. Distribution of elastic strain energy density at UCS. (a) α = 15°; (b) α = 30°; (c) α = 45°; (d) α = 60°; (e) α = 75°; (f) α = 90°.
Applsci 14 01484 g013
Table 1. Calculation results of maximum principal stresses and stress concentration factors.
Crack Dip Angle (°)The Nominal Maximum Principal Stress (MPa)The Actual Maximum Principal Stress (MPa)Stress Concentration Factor
1597.1573.85.91
3099.1492.54.97
4592.7447.24.82
60114.1456.14.00
75126.9435.33.43
90136.8243.21.78
Disclaimer/Publisher’s Note: The statements, opinions and data contained in all publications are solely those of the individual author(s) and contributor(s) and not of MDPI and/or the editor(s). MDPI and/or the editor(s) disclaim responsibility for any injury to people or property resulting from any ideas, methods, instructions or products referred to in the content.

