Article

The Effects of Parameter Settings on Triggering Time and Climb Rate during Lean-Premixed Combustion Thermoacoustic Oscillations

1
College of Energy and Power Engineering, Nanjing Institute of Technology, Nanjing 211167, China
2
MayAir Technology (China) Co., Ltd., Nanjing 211167, China
*
Authors to whom correspondence should be addressed.
Appl. Sci. 2024, 14(2), 806; https://doi.org/10.3390/app14020806
Submission received: 28 November 2023 / Revised: 6 January 2024 / Accepted: 13 January 2024 / Published: 17 January 2024

Abstract

:
This study theoretically explored the effects of parameter settings on thermoacoustic oscillations with a low-order model. Three factors were explored—combustor length, inlet gas temperature and thermal power. The research findings indicate that optimizing the parameter settings can yield better thermoacoustic oscillation suppression results. The sound pressure amplitude decreased from 3.2 × 10⁵ Pa to 2.1 × 10⁵ Pa as the combustor length increased from 1.2 m to 6.0 m. The triggering time increased from 0.32 s to 0.91 s when the combustion chamber length increased. The climb rate declined from 23.38 × 10⁵ Pa/s to 3.75 × 10⁵ Pa/s when the combustor length was elongated. The sound pressure amplitude decreased from 3.44 × 10⁵ Pa to 2.4 × 10⁵ Pa as the gas temperature rose from 0 to 100 °C. The triggering time and climb rate variation tendency were similar when the gas temperature increased—both declined as the gas temperature rose. The sound pressure amplitude experienced a slight fluctuation when the thermal power rose. However, the triggering time decreased from 0.26 s to 0.043 s when the thermal power improved. The climb rate increased from 18.72 × 10⁵ Pa/s to 27.65 × 10⁵ Pa/s when the thermal power rose. The oscillation frequency presented was completely different in three cases that had different wavelengths and oscillation intensities. The triggering time and climb rate fluctuated extensively in varying conditions, and the above two factors were interrelated and contradictory to each other when thermoacoustic oscillation was excited. This study explored parameters’ effects on triggering time and climb rate, thereby providing references for constructing a model-based control system for thermoacoustic oscillation feedback control.

1. Introduction

Unsteady thermoacoustic oscillations, also referred to as combustion instability, have emerged as a common problem in modern gas turbine burners and have hindered the development of lean-premixed combustors [1]. Their oscillation amplitude can reach sufficiently high levels to interfere with gas turbine operations and, in some extreme cases, can lead to the failure of a combustion system due to excessive structural vibrations. With the extensive use of lean-premixed combustors in the modern gas turbine industry, the suppression of thermoacoustic oscillations is always crucial for the progression of gas turbine developments. Thus, understanding how to predict and control thermoacoustic oscillations has become important [2]. Mastering and controlling thermoacoustic oscillations has become crucial for future renewable energy power systems [3]. Generally, there are two ways to control thermoacoustic oscillations: active control and passive control [4,5,6]. Acoustic dampers are widely applied as a passive control tool to stabilize combustion systems. However, this method cannot respond to the dynamic changes of real operating conditions and tends to be effective only within certain narrow-range frequencies [7]. Compared with passive control approaches, active control, especially in the closed-loop-feedback form, is more flexible and has promotional prospects [8]. Therefore, active control technology is expected to more efficiently suppress thermoacoustic oscillations. This has become a current research hotspot.
Active control is generally based on feedback control technologies, either by modulating the acoustic field in the combustion chamber or modulating the unsteady heat-release rate of flames [9]. Currently, reduced-order models of thermoacoustic oscillations are mainly used to investigate the feedback control of combustion instability [10]. Li et al. [11] studied the feedback control of combustion instabilities with a low-order combustor model and revealed that the open-loop transfer function needed for controller design varies with the oscillation level. Gelbert et al. [12] explored the feedback control of unstable thermoacoustic modes in an annular Rijke tube; a thermoacoustic network model was constructed and used to derive low-order models for modal control of the system. Morgans et al. [13,14] proved that model-based control is a good method for studying thermoacoustic oscillations in combustion chambers. Different controllers were implemented in simulations using a low-order thermoacoustic model. Although active control, which is based on these models, has significant potential, under different working conditions, the triggering time and climb rate of thermoacoustic oscillations are different [15,16], which also leads to control system failure or poor control effectiveness. Therefore, it is necessary to further explore the triggering time and climb rate of thermoacoustic oscillations under different conditions. Accordingly, to develop a robust feedback control system based on low-order thermoacoustic oscillation models, exploring the influence of different combustor parameters on the triggering time and climb rate is crucial.
The triggering time and climb rate of combustion thermoacoustic oscillations are related to many parameters, and relevant scholars have conducted extensive research on this topic. Zhang et al. [17] studied the thermodynamic properties of a thermoacoustic swirl combustor and revealed that oscillation mode switching depends on the equivalence ratio and methane flow rate. Du et al. [18] investigated the effects of different heat source distributions on a Rijke tube; their experimental results show that optimum spacing exists to minimize the starting power of thermoacoustic oscillations and growth rates and maximize the sound pressure amplitude. Furthermore, it has also been proven that parameters such as the flame equivalence ratio and flow field play a major role in the excitation of thermoacoustic oscillations [19]. Zhao et al. [20] explored the effects of the flame equivalence ratio and fuel flow rate on nonlinear thermoacoustic instability in a swirl combustor, and mode switching between higher harmonic and fundamental oscillation was observed. It has also been found that the fuel type and air/fuel supply method affect the triggering and growth of thermoacoustic oscillations [21,22,23,24]. The influence of geometric parameters on thermoacoustic oscillations cannot be ignored. Jo et al. [25] evaluated the damping capacity according to geometrics and the number of resonators using a Rijke tube, and the decay time of thermoacoustic oscillations was measured to quantify the damping capability in the time domain. Therefore, by illuminating the influence of parameter settings on the triggering time and climb rate of thermoacoustic oscillations, combined with using low-order models to construct a model-based control system [26,27,28], a better design for active control systems for thermoacoustic oscillations can be achieved for real burners.
The analytical models that have been used by researchers to study the thermoacoustic oscillation phenomenon contain the G-equation method [29,30] or the n-τ model [31]. In this study, only linear acoustic vibrations were expected in the combustor chamber; the nonlinear effects were supposed to be related to the flame heat-release rate, which exhibited saturation characteristics. To predict limit cycle thermoacoustic oscillations, scholars establish the flame’s G-equation by linking the flame surface with flame heat release. The empirical approach is to use a parameter-dependent n-τ model. Therefore, this study intended to construct a low-order model of thermoacoustic oscillations with the n-τ model, aiming to explore the temporal signal characteristics of thermoacoustic oscillation under different key parameter settings. Through analyzing the differences in the triggering time and climb rate of thermoacoustic oscillations, this study will provide references to better construct a model-based control system for thermoacoustic oscillation feedback control.
In this work, the triggering times and climb rates of thermoacoustic oscillations are theoretically studied. In order to present the impact of changes in the combustion parameters, three main factors of the combustion system were researched—burner length, inlet air temperature and thermal power. Five burner lengths were measured in this study. The inlet air temperature for combustion ranged from 0 to 100 °C. The thermal power of the burner was also set to five different values. Under these parameters, the triggering times and climb rates of thermoacoustic oscillations were recorded and studied. A low-order model of thermoacoustic oscillation was constructed in MATLAB software 2021R1. This research aimed to reveal the parameter settings of a lean-premixed combustor to trigger and grow thermoacoustic oscillations to better achieve the feedback control effect of thermoacoustic oscillations in modern gas turbine engines. This study found that the triggering time and climb rate affect the safety of a combustion system; therefore, the present investigation examines the effect of different parameter settings on thermoacoustic oscillations to better understand the evolution properties of triggering time and climb rate. This study provides a theoretical basis for the prevention of combustion thermoacoustic oscillation. At the same time, it can also be seen that an incorrect burner parameter design will lead to difficulties in suppressing thermoacoustic oscillations.

2. Materials and Methods

2.1. Design of the Lean-Premixed Combustor

The theoretical low-order model in this research was conducted with a model lean-premixed combustor from our previous research [32,33]. Detailed geometrical characteristics and critical design parameters of the combustor are displayed in Figure 1. In Figure 1, τ denotes the time delay, the reflection coefficient for the chocked boundary condition is defined as R u and the reflection coefficient of the open-ended downstream is defined as R d . Acoustic waves in the combustion chamber are denoted as f and g , with p(t) representing the sound pressure signal. In this research, the mixture’s gas temperature was set as 0, 25, 50, 75 and 100 °C. The length of the whole burner was set as 1.2, 2.4, 3.6, 4.8 and 6.0 m. The thermal power of the combustor was set as 0.013, 0.026, 0.039, 0.052 and 0.065 kW. The geometrical parameters of the burner are presented in Table 1.

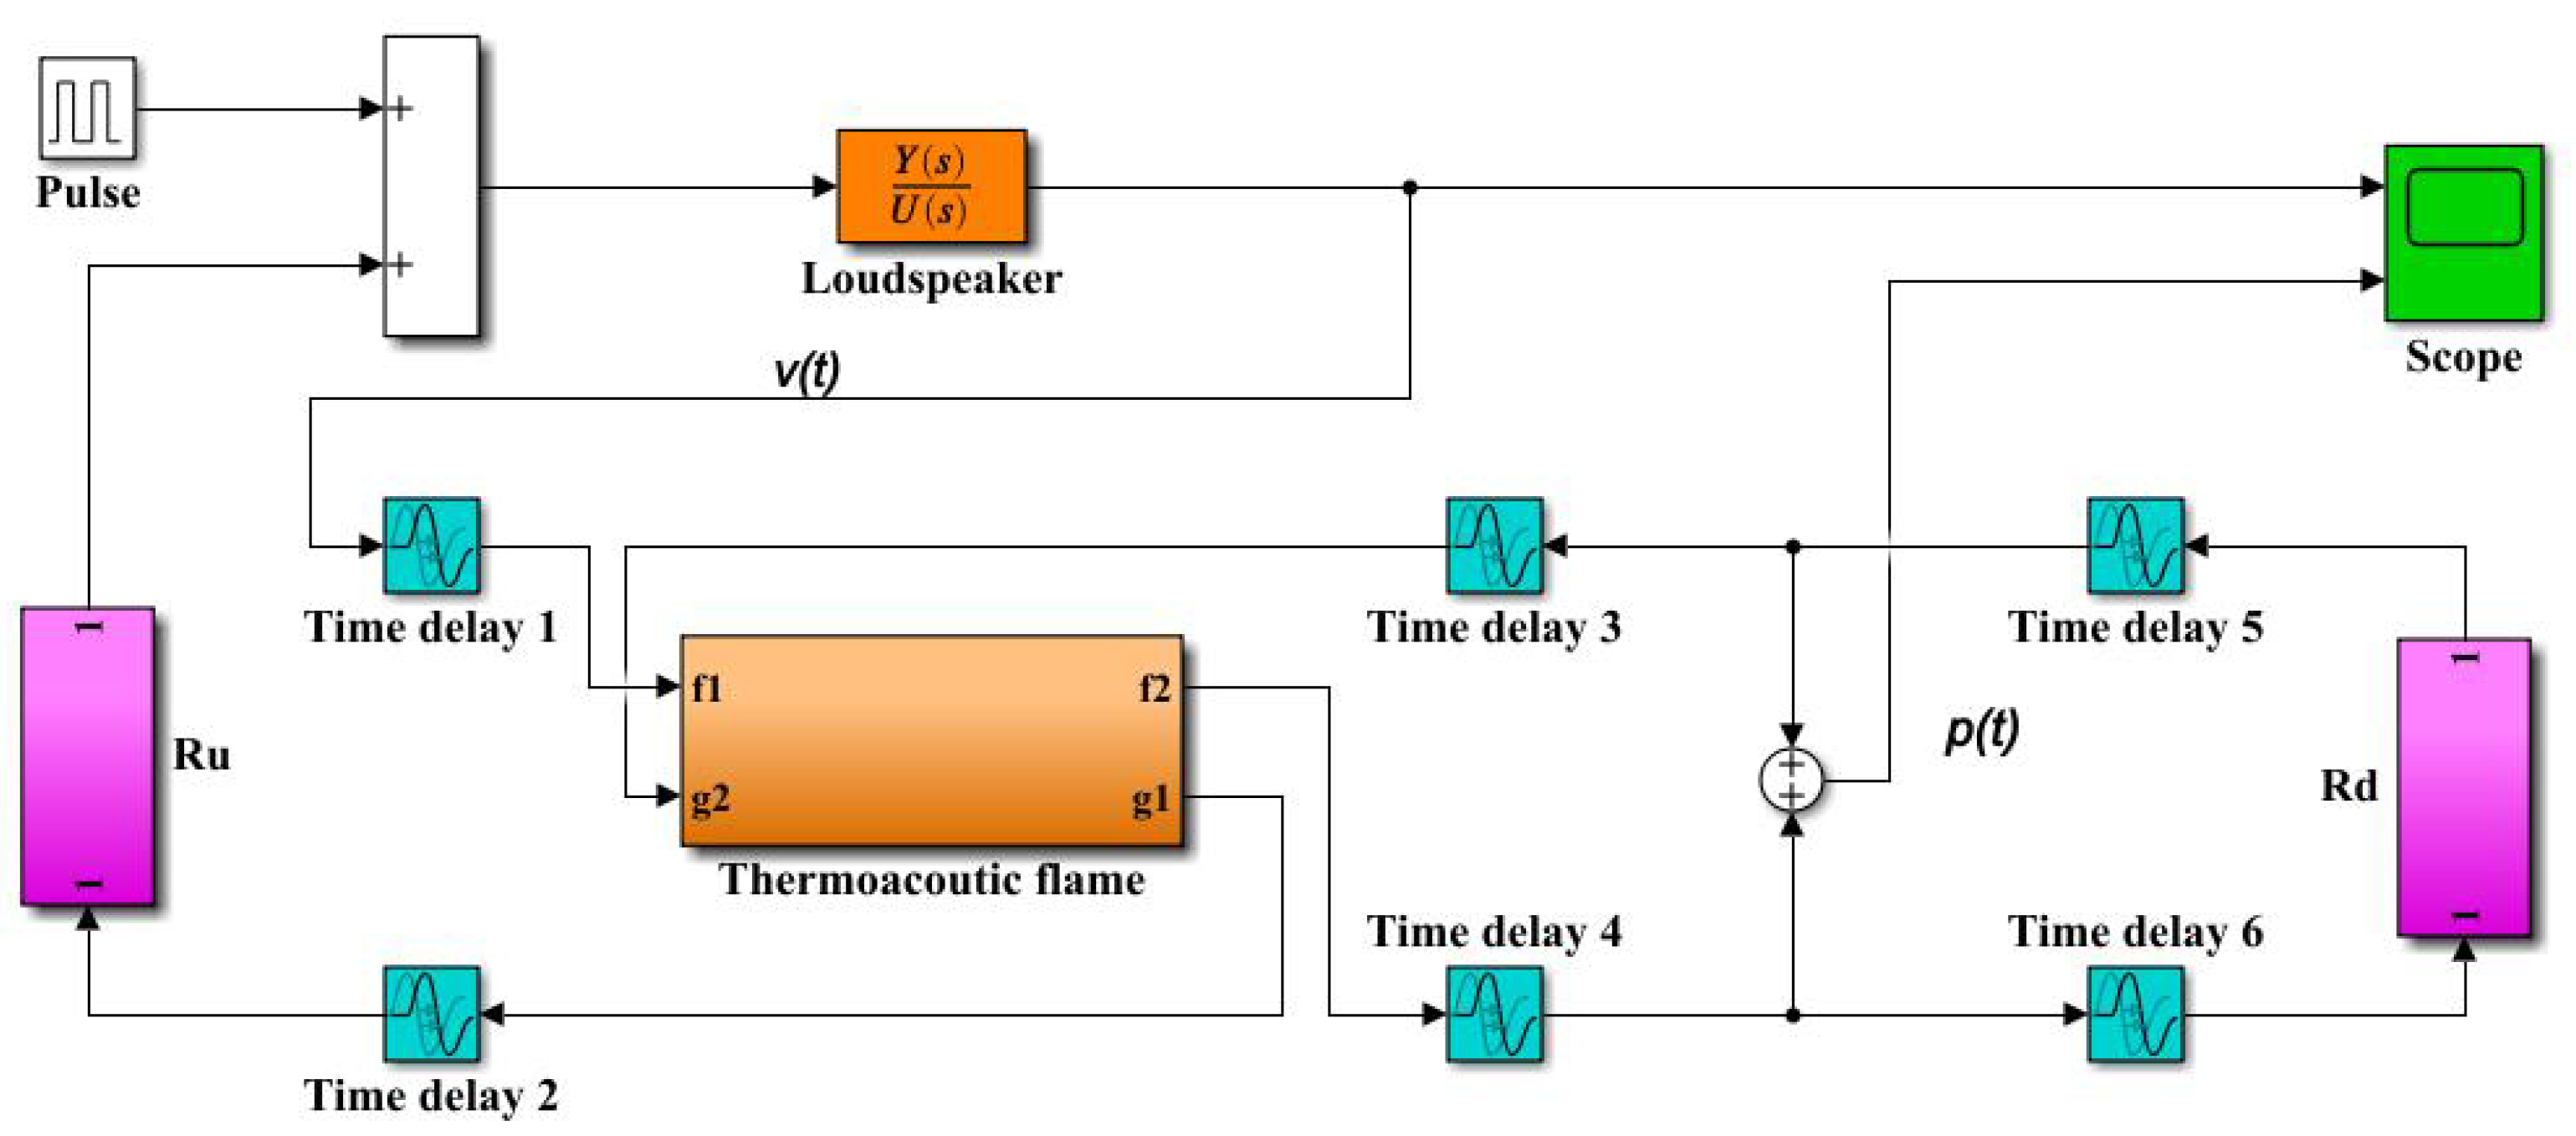
2.2. Low-Order Model of Thermoacoustic Oscillation

The self-excited frequency (264 Hz) was below the cut-off frequency (1501 Hz, 1.2 m); thus, the combustor can be treated as one-dimensional. Figure 1a presents the low-order thermoacoustic oscillation model of the lean-premixed gas turbine combustor. The low-order thermoacoustic oscillation model of the combustor was modeled with MATLAB Simulink software using the method proposed by Dowling [34] and Fabian [35], and the governing conservation equations of the wave equation are as follows:
p ( x , t ) = p ¯ + f t x c ¯ + u ¯ g t + x c ¯ u ¯
u ( x , t ) = u ¯ + 1 ρ c ¯ f t x c ¯ + u ¯ g t x c ¯ u ¯
In Equations (1) and (2), p(x,t) and u(x,t) denote the total pressure and velocity fluctuation, f(t) and g(t) denote traveling waves in the combustion chamber, p ¯ and u ¯ denote the average pressure and velocity value, c ¯ denotes the acoustic velocity in the combustion chamber and x denotes the relative position of traveling waves in the combustion chamber. The links between mean flow variables u and acoustic variables p can be described as in our previous research [33]:
p p O γ M ¯ u u
where gamma (γ) is the adiabatic exponent of gas and M ¯ stands for the mean Mach number. In Figure 1b, Ru is the reflection coefficient of the upstream part of the combustor, and Rd is the reflection coefficient of the downstream part of the combustor. P(t) is the sound pressure signal in the combustion chamber. The lean-premixed flame heat release transfer function was modeled as the n-τ equation, where n is the interaction index or combustion efficiency and τ is a time delay; the travel times of the acoustic waves f and g are denoted as time delays τ i = x i / c   ( i =1, 2, …,6); and x i   denotes the travelling distance of the acoustic waves. These considerations lead to the following transfer function:
q s = k f 1 + T f s e s τ f u 1 s
In Equation (4), k f is the static gain, T f is the time constant of the low pass element, τ f is the travel dead time and u1 is the acoustic velocity upstream of the flame. In this paper, parameters for modeling are summarized in Table 2. The equivalence ratio of the propane flame was maintained at 1.0, and air for combustion was 0.105 MPa with a relative humidity of 50%. The lower heat value of propane is 46.56 kJ/kg, and the heat capacity of air is 1.009 kJ/(kg K). As displayed in Figure 2, the low-order model was implemented in MATLAB. A linear flame transfer function was used, and the n- τ model was filtered by a first-order filter to capture the flame response [36,37].
H s = ω c ω c + s a f e τ f s
where a f is the gain and τ f indicates the time delay. ω c = 2 π f c denotes the cut-off frequency of the filter. The reflection coefficient R u for the chocked boundary condition is defined as 0.95. The reflection coefficients of the open-ended downstream are sensitive to geometric dimensions and sound speed. We defined the reflection coefficient of the open-ended downstream, R d , as Equation (6) [38]:
R d = l d 2 16 c 2 1 + 0.3 l d c / l d 2 16 c 2 + 1 + 0.3 l d c

3. Results

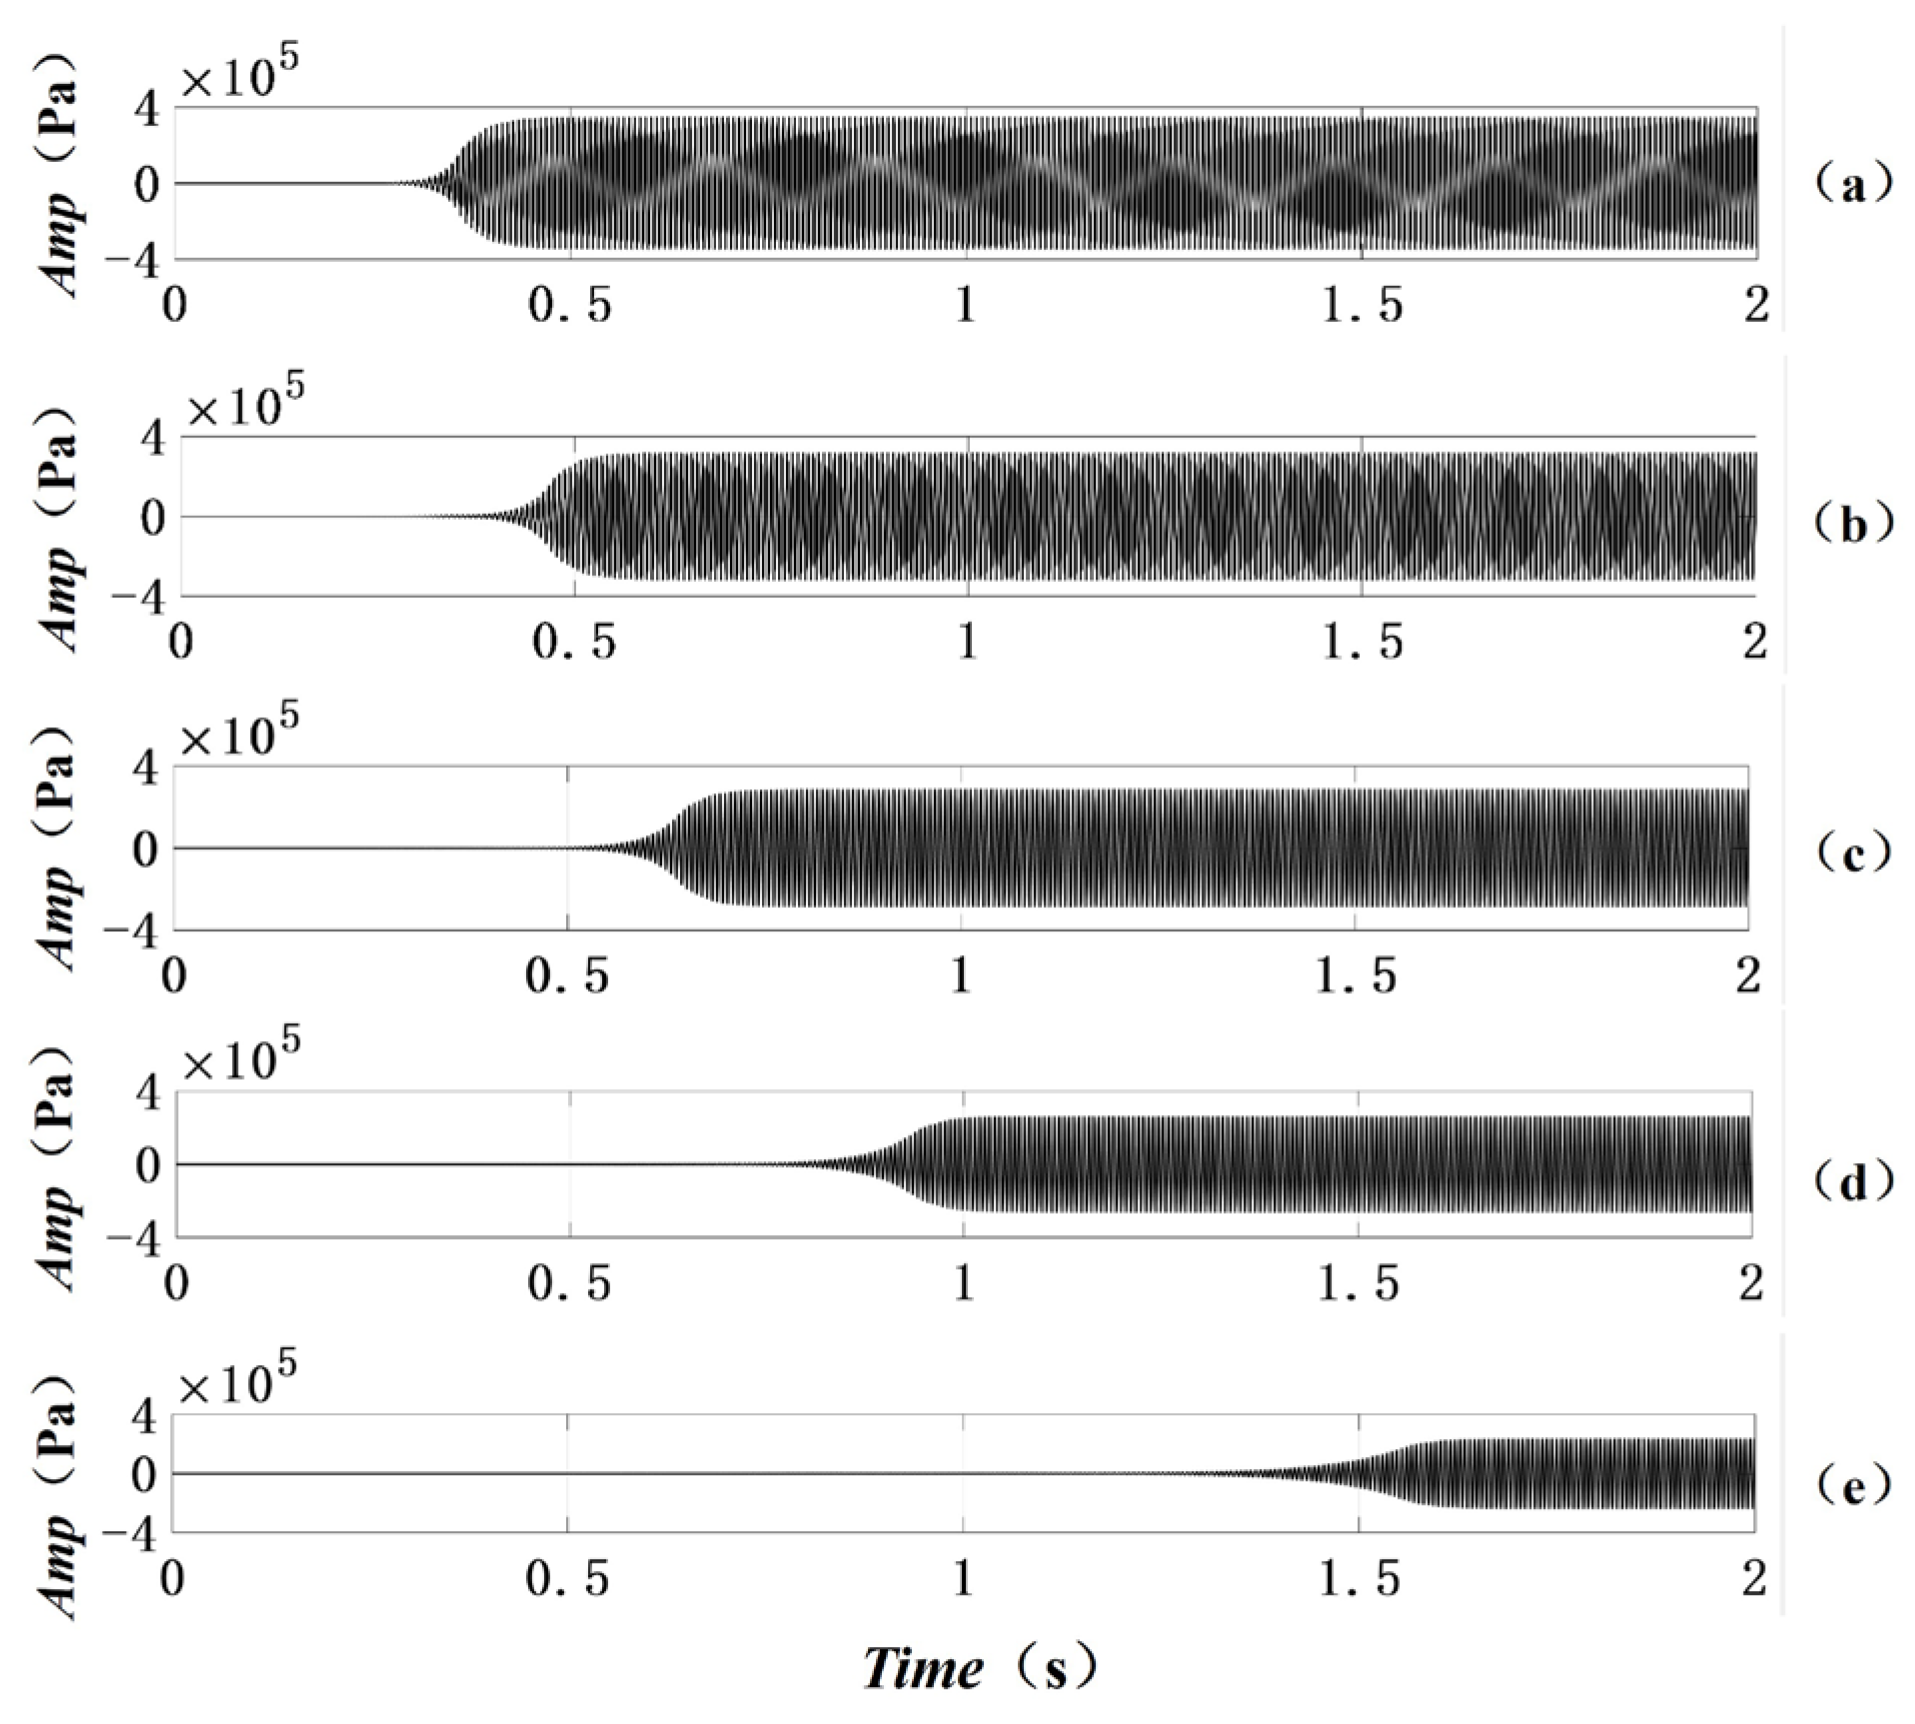
3.1. Effects of the Combustor Length

Figure 3a–e show the variation tendency of the sound pressure amplitude in a combustion chamber. When the combustor length ranges from 1.2 to 6.0 m, the upstream part of the combustor remains constant at 0.55 m. It can be inferred from Figure 3 that the sound pressure amplitude gradually declines as the length of the combustor reduces. The oscillation curve becomes sparse, which denotes that the oscillation frequency also experienced a gradually decreasing trend. The triggering time of thermoacoustic oscillations varies significantly while the combustor length changes. In Figure 3a, at the length of 1.2 m, thermoacoustic oscillation emerges within 0.5 s; however, at the length of 6.0 m, Figure 3e shows that oscillation emerges after 1 s. Both sound pressure amplitude and oscillation frequency decline as the length grows, accompanied by the gradually increasing trigger time. Figure 3 also indicates that there is a significant difference in the climb rate during the excitation processes.
The main reason for the sound pressure amplitude decreasing can be attributed to the variation in sound wavelengths. At the same time, there is a significant change in the length of the sound waves. In Figure 3, as the chamber length rises, the oscillation frequency gradually declines. This is because, as the length of the combustion chamber increases, the oscillation period of thermoacoustic oscillations is also extended. According to the equation for the difference between the oscillation period and frequency, f = 1/T, it can be seen that the increase in the oscillation period will lead to a decrease in oscillation frequency. In the sound wavelength calculation equation, λ = v/f, v denotes the acoustic velocity and f denotes the oscillation frequency. The equation indicated that the sound wavelength λ increased as the oscillation frequency f declined. As the sound wavelength λ increased, the relative location where high amplitude oscillations are easily triggered also changed. Then, the intensity of thermoacoustic oscillation decreased.
The detailed values of sound pressure amplitude and triggering time under different combustor lengths are displayed in Figure 4. As the combustor length increased from 1.2 m to 6.0 m, the thermoacoustic oscillation triggering time increased from 0.32 s to 0.91 s, while the sound pressure amplitude decreased from 3.2 × 10⁵ Pa to 2.1 × 10⁵ Pa. The sound pressure amplitude experienced a rapid descent, while the chamber length rose from 1.2 m to 2.4 m. However, the downward trend slowed down when the chamber length rose from 2.4 m to 6.0 m. The change trend of the triggering time curve was relatively consistent as the chamber length rose. The reason why the triggering time changed is closely related to the increase in the acoustic wave oscillation frequency; as f = 1/T, the oscillation period increased. Due to the extension of the oscillation period and chamber length, the coupling process between the sound waves and flame was extended. As a result, the triggering time of oscillation was prolonged.
To accurately evaluate the impact of parameter settings on the triggering of thermoacoustic oscillations, we introduced the climb rate as an indicator of thermoacoustic oscillations. This method is similar to that in our previous research on calculating the decay time of thermoacoustic oscillations [32]. Figure 5 shows the calculation process of the climb rate,   C = P m a x P m a x / e τ , where C denotes the thermoacoustic oscillation climb rate, P m a x denotes the maximum value of the sound pressure amplitude, P m a x / e denotes the maximum value of the sound pressure amplitude, e is the natural constant and equals 2.71828 in this research and τ is the climbing time in which P m a x / e climbs to P m a x . The unit for the thermoacoustic oscillation climb rate is 105 Pa/s.
Figure 6 shows the climb rate of thermoacoustic oscillation as the combustor length increased from 1.2 m to 6.0 m. Consistent with the amplitude variation trend of thermoacoustic oscillation, the climb rate dropped from 23.38 × 10⁵ Pa/s to 3.75 × 10⁵ Pa/s as the combustor length rose. This means that the geometric structure of the combustor was closely related to the excitation speed of the thermoacoustic oscillations. It is important to understand how to effectively control the acceleration rate during the thermoacoustic oscillation excitation process. This is related to whether the active controller can quickly suppress the thermoacoustic oscillation that occurs in gas turbine combustion chambers. As shown by the results in Figure 6, a reasonable combustor length design can not only meet the combustion heat volume but can also slow down the excitation speed of thermoacoustic oscillation.

3.2. Effects of the Gas Temperature

Figure 7a–e show the variation tendency of sound pressure amplitude in the combustion chamber while the gas temperature ranged from 0 to 100 °C. This study selected five gas temperatures, each increasing by 25 °C. In this part, the combustor length and thermal power remain constant. It can be inferred from Figure 7 that the sound pressure amplitude gradually declined as the gas temperature increased from o to 100 °C. Different from the changes in combustor length shown in Figure 4, the oscillation curve showed a linear change. The trend of oscillation frequency change is also different from that in Figure 4; the oscillation frequency experienced a slowly increasing trend as the gas temperature rose. The triggering time of thermoacoustic oscillation varied obviously when the inlet gas temperature changed. In Figure 7a, at the temperature point of 0 °C, thermoacoustic oscillation emerged within 0.3 s; however, at the temperature point of 100 °C, Figure 7e illustrates that thermoacoustic oscillation emerged after 1.1 s.
The detailed values of the sound pressure amplitude and triggering time under different gas temperatures are displayed in Figure 8. It can be seen that the amplitude of thermoacoustic oscillation decreased but the triggering time was prolonged. As the inlet premixed gas temperature increased from 0 to 100 °C, the thermoacoustic oscillation triggering time increased from 0.26 s to 1.13 s, while the sound pressure amplitude decreased from 3.44 × 10⁵ Pa to 2.4 × 10⁵ Pa. The sound pressure amplitude experienced a linear descent while the gas temperature increased from 0 to 100 °C. This is because the triggering of thermoacoustic oscillations is related to the Rayleigh criterion. The oscillation frequency f slowly improved as the inlet gas temperature increased, and the phase difference between the flame heat-release rate and sound wave changed to Δp = ωt + φ, where ω denotes the circular frequency, and the relationship is ω = 2πf. The symbol φ stands for the initial phase value. As the thermoacoustic oscillation frequency f gradually increases, the circular frequency ω also starts to rise; this leads to an increase in the phase difference, causing a decrease in the oscillation amplitude.
Figure 9 shows the climb rate of thermoacoustic oscillations as the gas temperature increased from 0 to 100 °C. Consistent with the amplitude variation trend of thermoacoustic oscillation, the climb rate dropped from 24.01 × 10⁵ Pa/s to 11.06 × 10⁵ Pa/s as the temperature rose. This means that the thermodynamic characteristics of the working fluid at the burner inlet were closely related to the excitation speed of thermoacoustic oscillations. Compared with the results in Figure 8, where, as the temperature increased, the slope of the curve for the triggering time of the thermoacoustic oscillation increased, the climb rate in Figure 9 declined. For lean-premixed combustors, the duration of the thermoacoustic oscillation triggering time and the climb rate are contradictory indexes. Therefore, it is necessary to optimize the parameter settings to obtain a reasonable thermoacoustic oscillation triggering time and climb rate, thereby improving the stability and safety of the system [39]. The decrease in the climb rate of thermoacoustic oscillations is related to the decrease in local temperature differences in the combustion chamber.

3.3. Effects of Thermal Power

Figure 10a–e show the sound pressure amplitude in the combustion chamber. When the thermal power of the combustor ranged from 0.013 to 0.065 kW, the chamber length and inlet gas temperature of the combustor remained constant. In the beginning, it can be inferred from Figure 10 that the sound pressure amplitude gradually increased when the thermal bellows were 0.052 kW. However, the sound pressure amplitude gradually decreased when the thermal power reached 0.065 kW. Additionally, the sparsity of the oscillation curve remained almost unchanged, which denotes that the oscillation frequency maintained a relatively stable value. The triggering time of thermoacoustic oscillation varies significantly when thermal power changes. In Figure 10a, at the thermal power of 0.013 kW, thermoacoustic oscillation emerged within 0.3 s; however, at the thermal power of 0.065 kW, Figure 10e shows that thermoacoustic oscillation emerged within 0.05 s. Figure 10 also indicates that there was a remarkable difference in the climb rate during the thermoacoustic oscillation excitation processes. The reason why the thermoacoustic oscillation amplitude did not significantly increase may be related to the intake pressure and burner heat dissipation. After the increase in thermal power, the degree of heat dissipation of the combustor increases. The oscillation frequency is almost unchanged; this may be attributed to the slight change in the acoustic wavelength in the combustion chamber.
The detailed values of the sound pressure amplitude and triggering time under different thermal powers are displayed in Figure 11, and the triggering time is shortened. As the combustor thermal power increased from 0.013 to 0.065 kW, the thermoacoustic oscillation triggering time decreased from 0.26 s to 0.043 s. The triggering time of thermoacoustic oscillations is related to the Rayleigh criterion. The triggering time declined as thermal power increased, which caused the increase in the flame heat-release rate, leading to easier excitation of thermoacoustic oscillations. However, when the thermal power reached 0.052 kW, the decreasing trend of the thermoacoustic oscillation triggering time became slower. This may be because the heat dissipation effect of the combustor was greater than the influence of the flame heat-release rate. In this study, adiabatic effects were not considered; this may have resulted in a slight decrease in the thermoacoustic oscillation amplitude in the combustion chamber.
Figure 12 shows the climb rate of thermoacoustic oscillations as the thermal power of the combustor increased from 0.013 to 0.065 kW. Contrary to the trend of the changes in the excitation time of thermoacoustic oscillations, the climb rate rose from 18.72 × 10⁵ Pa/s to 27.65 × 10⁵ Pa/s as the thermal power rose. However, the trend of the curve changes in both indexes was relatively consistent, ranging from significant to slow changes. Comparing this discovery with the research results in Section 3.1 and Section 3.2, it can be found that it is crucial to reasonably set parameters for the effective active control of lean-premixed thermoacoustic oscillations. There are several areas that can be optimized to achieve the best thermoacoustic oscillation active control effect. If the amplitude, triggering time and climb rate of thermoacoustic oscillations are not well studied, the selected active controller may not meet specific oscillation conditions, leading to the failure of the control system and serious consequences.

4. Conclusions

We researched the suppression effects of thermoacoustic oscillation variation under different parameter settings, which brings significant challenges to the design of active control systems. In this study, the influence of three different types of parameters on lean-premixed combustion thermoacoustic oscillation was theoretically investigated. The effects among three parameters were investigated: the burner length, the inlet air temperature and the thermal power.
The research results indicate that an elongated combustor length or improved gas temperature could alleviate the oscillation intensity. However, improved thermal combustion power cannot effectively suppress thermoacoustic instability. The oscillation frequency not only fluctuated with the parameter settings but also altered the process of thermoacoustic coupling. Meanwhile, some unreasonable designs, such as excessively short burner designs, can lead to stronger thermoacoustic oscillations.
The triggering time and climb rate were key factors that must be considered when designing an active control system for thermoacoustic oscillations. The triggering time and climb rate fluctuated extensively among different conditions, and the above two factors are interrelated and contradictory to each other when a thermoacoustic oscillation is excited. It is necessary to optimize the triggering time and climb rate of thermoacoustic oscillations in future research to achieve better active control effects in gas turbine combustors. Based on the research results in this article, the design of active control systems for thermal acoustic oscillations can be improved. For thermal acoustic oscillations with short triggering times and fast climb rates, it is necessary to adopt active control algorithms with fast response actions and small delay times and to use high-frequency actuators as much as possible.

Author Contributions

Conceptualization, C.T.; data curation, L.Z. and J.Y.; formal analysis, S.L.; methodology, Y.W.; supervision, C.T. and R.S.; visualization, C.T.; writing—original draft, C.T. All authors have read and agreed to the published version of the manuscript.

Funding

This research was funded by the Natural Science Foundation of Jiangsu Province (No. BK20230699), the China Postdoctoral Science Foundation (No. 2023M731492), Scientific Research Start-up Foundation funding of High-level Introduction Talents of Nanjing Institute of Technology (No. YKJ202107) and the Natural Science Research Project in Colleges and Universities in Jiangsu Province of China (No. 23KJB470010).

Institutional Review Board Statement

Not applicable.

Informed Consent Statement

Not applicable.

Data Availability Statement

Data are contained within the article.

Acknowledgments

We thank Ling Chen in MayAir Technology (China) Co., Ltd., for her support of this study.

Conflicts of Interest

Chengfei Tao was employed by the company MayAir Technology (China) Co., Ltd. The remaining authors declare that the research was conducted in the absence of any commercial or financial relationships that could be construed as a potential conflict of interest.

References

  1. Huang, Y.; Yang, V. Dynamics and stability of lean-premixed swirl-stabilized combustion. Prog. Energy Combust. Sci. 2009, 35, 293–364. [Google Scholar] [CrossRef]
  2. Poinsot, T. Prediction and control of combustion instabilities in real engines. Proc. Combust. Inst. 2017, 36, 1–28. [Google Scholar] [CrossRef]
  3. Candel, S. Combustion dynamics and control: Progress and challenges. Proc. Combust. Inst. 2002, 29, 1–28. [Google Scholar] [CrossRef]
  4. Zhang, M.X.; Li, J.X.; Cheng, W.W. Active control of thermoacoustic instability using microsecond plasma discharge. J. Appl. Phys. 2020, 127, 033301. [Google Scholar] [CrossRef]
  5. Zhang, Y.M.; Huang, L.X. Electroacoustic control of Rijke tube instability. J. Sound Vib. 2017, 409, 131–144. [Google Scholar] [CrossRef]
  6. Guan, Y.; He, W.; Murugesan, M.; Li, Q.; Liu, P.J.; Li, L.K.B. Control of self-excited thermoacoustic oscillations using transient forcing, hysteresis and mode switching. Combust. Flame 2019, 202, 262–275. [Google Scholar] [CrossRef]
  7. Zhao, D.; Li, X.Y. A review of acoustic dampers applied to combustion chambers in aerospace industry. Prog. Aerosp. Sci. 2015, 74, 114–130. [Google Scholar] [CrossRef]
  8. Zhao, D. A review of active control approaches in stabilizing combustion systems in aerospace industry. Prog. Aerosp. Sci. 2018, 97, 35–60. [Google Scholar] [CrossRef]
  9. Rubio-Hervas, J.; Zhao, D.; Reyhanoglu, M. Nonlinear feedback control of self-sustained thermoacoustic oscillations. Aerosp. Sci. Technol. 2015, 41, 209–215. [Google Scholar] [CrossRef]
  10. Illingworth, S.J.; Morgans, A.S.; Rowley, C.W. Feedback control of flow resonances using balanced reduced-order models. J. Sound Vib. 2011, 330, 1567–1581. [Google Scholar] [CrossRef]
  11. Li, J.X.; Morgans, A.S. Feedback control of combustion instabilities from within limit cycle oscillations using H loop-shaping and the v-gap metric. Proc. R. Soc. A 2015, 472, 20150821. [Google Scholar] [CrossRef]
  12. Gelbert, G.; Moeck, J.P.; Paschereit, C.O.; King, R. Feedback control of unstable thermoacoustic modes in an annular Rijke tube. Control Eng. Pract. 2012, 20, 770–782. [Google Scholar] [CrossRef]
  13. Morgans, A.S.; Dowling, A.P. Model-based control of combustion instabilities. J. Sound Vib. 2007, 299, 261–282. [Google Scholar] [CrossRef]
  14. Morgans, A.S.; Stow, S.R. Model-based control of combustion instabilities in annular combustors. Combust. Flame 2007, 150, 380–399. [Google Scholar] [CrossRef]
  15. Zalluhoglu, U.; Kammer, A.S.; Olgac, N. Delayed feedback control laws for Rijke tube thermoacoustic instability, synthesis, and experimental validation. IEEE Trans. Control Syst. Technol. 2016, 24, 1861–1868. [Google Scholar] [CrossRef]
  16. Li, X.Y.; Zhao, D.; Yang, X.L.; Wang, S.H. Unity maximum transient energy growth of heat-driven acoustic oscillations. Energy. Convers. Manag. 2016, 116, 1–10. [Google Scholar] [CrossRef]
  17. Zhang, Z.G.; Zhao, D.; Ni, S.L.; Sun, Y.Z.; Wang, B.; Chen, Y.; Li, G.N.; Li, S. Experimental characterizing combustion emissions and thermodynamic properties of a thermoacoustic swirl combustor. Appl. Energy 2019, 235, 463–472. [Google Scholar] [CrossRef]
  18. Du, M.L.; Li, F.; Yang, L. Effects of different heat source distribution on a Rijke tube. Appl. Acoust. 2019, 146, 66–75. [Google Scholar] [CrossRef]
  19. Pires, J.M.; Fernandes, E.C. Combined effect of equivalence ratio and velocity gradients on flame stability and emission formation. Fuel 2018, 222, 800–809. [Google Scholar] [CrossRef]
  20. Zhao, H.; Li, G.N.; Zhao, D.; Zhang, Z.G.; Sun, D.K.; Yang, W.M.; Li, S.; Lu, Z.L.; Zheng, Y.Q. Experimental study of equivalence ratio and fuel flow rate effects on nonlinear thermoacoustic instability in a swirl combustor. Appl. Energy 2017, 208, 123–131. [Google Scholar] [CrossRef]
  21. Zhang, B.; Liu, H.; Liu, X.; Liu, H. Prediction Method of Swirling Flame Lean Blowout Based on Flame Image Morphological Features. Appl. Sci. 2023, 13, 3173. [Google Scholar] [CrossRef]
  22. Shchepakina, E.A.; Zubrilin, I.A.; Kuznetsov, A.Y.; Tsapenkov, K.D.; Antonov, D.V.; Strizhak, P.A.; Yakushkin, D.V.; Ulitichev, A.G.; Dolinskiy, V.A.; Hernandez Morales, M. Physical and Chemical Features of Hydrogen Combustion and Their Influence on the Characteristics of Gas Turbine Combustion Chambers. Appl. Sci. 2023, 13, 3754. [Google Scholar] [CrossRef]
  23. Pan, D.; Ji, C.; Zhu, T. Characterization of Nonlinear Responses of Non-Premixed Flames to Low-Frequency Acoustic Excitations. Appl. Sci. 2023, 13, 6237. [Google Scholar] [CrossRef]
  24. Du, Y.; Zhang, Y.; Li, X.; Zhang, J.; Da, Y.; Jia, Y.; Che, D. Self-Excited Thermoacoustic Instability Behavior of a Hedge Premixed Combustion System with an Asymmetric Air/Fuel Supply or Combustion Condition. Appl. Sci. 2023, 13, 11463. [Google Scholar] [CrossRef]
  25. Jo, S.; Choi, Y.; Kim, H.J. Evaluation of the damping capacity according to the geometric and the number of resonator with thermal environment using a Rijke tube. Aerosp. Sci. Technol. 2019, 88, 1–8. [Google Scholar] [CrossRef]
  26. Li, S.; Li, Q.T.; Tang, L.; Yang, B.; Fu, J.Q.; Clarke, C.A.; Jin, X.; Ji, C.Z.; Zhao, H. Theoretical and experimental demonstration of minimizing self-excited thermoacoustic oscillations by applying anti-sound technique. Appl. Energy 2016, 181, 399–407. [Google Scholar] [CrossRef]
  27. Li, X.Y.; Zhao, D.; Li, J.W.; Xu, Y.S. Experimental evaluation of anti-sound approach in damping self-sustained thermoacoustic oscillations. J. Appl. Phys. 2013, 114, 204903. [Google Scholar] [CrossRef]
  28. Yuan, X.C.; Glover, K. Model-based control of thermoacoustic instabilities in partially premixed lean combustion—A design case study. Int. J. Control 2013, 86, 2052–2066. [Google Scholar] [CrossRef]
  29. Dowling, A.P. A kinematic model of a ducted flame. J. Fluid Mech. 1999, 394, 51–72. [Google Scholar] [CrossRef]
  30. Semlitsch, B.; Orchini, A.; Dowling, A.P.; Juniper, M.P. G-equation modelling of thermoacoustic oscillations of partially premixed flames. Int. J. Spray Combust. 2017, 9, 260–276. [Google Scholar] [CrossRef]
  31. Hield, P.A.; Brear, M.J.; Jin, S.H. Thermoacoustic limit cycles in a premixed laboratory combustor with open and choked exits. Combust. Flame 2009, 256, 1683–1697. [Google Scholar] [CrossRef]
  32. Tao, C.F.; Zhou, H. Effects of different preheated CO2/O2 jet in cross-flow on combustion instability and emissions in a lean premixed combustor. J. Energy Inst. 2020, 93, 2334–2343. [Google Scholar] [CrossRef]
  33. Tao, C.F.; Zhou, H. Effects of different active control strategies on combustion instability decay time, actuator voltage, and damping ratio. J. Appl. Phys. 2020, 128, 054902. [Google Scholar] [CrossRef]
  34. Dowling, A.P. Nonlinear self-excited oscillations of a ducted flame. J. Fluid Mech. 1997, 346, 271–290. [Google Scholar] [CrossRef]
  35. Fabian, J.; Christopher, G.W.; Thomas, L.; Abel, D. Robust Output Model Predictive Control of an Unstable Rijke Tube. J. Combust. 2012, 2012, 927345. [Google Scholar]
  36. Dowling, A.P.; Morgans, A.S. Feedback control of combustion oscillations. Annu. Rev. Fluid Mech. 2005, 37, 151–182. [Google Scholar] [CrossRef]
  37. Li, J.X.; Yang, D.; Luzzato, C.; Morgans, A.S. Open Source Combustion Instability Low Order Simulator for Longitudinal Modes. 2014. Available online: http://www.oscilos.com/ (accessed on 5 September 2023).
  38. Jarmolowitz, F.; Abel, D. Modeling and model predictive control of a thermoacoustically unstable burner. IFAC Proc. 2010, 43, 68–73. [Google Scholar] [CrossRef]
  39. Wang, J.; Rubini, P.; Qin, Q. A Porous Media Model for the Numerical Simulation of Acoustic Attenuation by Perforated Liners in the Presence of Grazing Flows. Appl. Sci. 2021, 11, 4677. [Google Scholar] [CrossRef]
Figure 1. Low-order thermoacoustic oscillation model of the lean-premixed gas turbine combustor. (a) Time delay and reflection coefficient of the low-order model. (b) Acoustic waves in the open-ended combustion chamber.
Applsci 14 00806 g001
Figure 2. Low-order thermoacoustic oscillation model in MATLAB Simulink.
Applsci 14 00806 g002
Figure 3. Effects of different combustor lengths on the sound pressure amplitude in the combustion chamber; the combustor length ranged from 1.2 to 6.0 m. (a) 1.2 m length. (b) 2.4 m length. (c) 3.6 m length. (d) 4.8 m length. (e) 6.0 m length.
Applsci 14 00806 g003
Figure 4. Effects of different combustor lengths on the sound pressure amplitude and triggering time; the combustor length ranged from 1.2 to 6.0 m.
Applsci 14 00806 g004
Figure 5. Schematic diagram for calculating the climb rate of thermoacoustic oscillation in this research.
Applsci 14 00806 g005
Figure 6. Effects of different combustor lengths on the thermoacoustic oscillation climb rate; the combustor length ranged from 1.2 to 6.0 m.
Applsci 14 00806 g006
Figure 7. Effects of different gas temperatures on the sound pressure amplitude in the combustion chamber; the gas temperature ranged from 0 to 100 °C. (a) 0 °C. (b) 25 °C. (c) 50 °C. (d) 75 °C. (e) 100 °C.
Applsci 14 00806 g007
Figure 8. Effects of different gas temperatures on the sound pressure amplitude and triggering time; the gas temperature ranged from o to 100 °C.
Applsci 14 00806 g008
Figure 9. Effects of different gas temperatures on the thermoacoustic oscillation climb rate; the gas temperature ranged from 0 to 100 °C.
Applsci 14 00806 g009
Figure 10. Effects of different thermal powers on the sound pressure amplitude in the combustion chamber; the thermal power ranged from 0.013 to 0.065 kW. (a) 0.013 kW. (b) 0.026 kW. (c) 0.039 kW. (d) 0.052 kW. (e) 0.065 kW.
Applsci 14 00806 g010
Figure 11. Effects of thermal power on the sound pressure amplitude and triggering time; the thermal power ranged from 0.013 to 0.065 kW.
Applsci 14 00806 g011
Figure 12. Effects of different thermal powers on the thermoacoustic oscillation climb rate; the thermal power ranged from 0.013 to 0.065 kW.
Applsci 14 00806 g012
Table 1. Geometric parameters of the lean-premixed combustor.
Geometries of the Combustor
Burner inlet length (mm)550
Diameter (mm)114
Burner total length (mm)1200, 2400, 3600, 4800, 6000
Swirl section length (mm)150
Table 2. Parameter settings in this study.
ParametersValues
Fuel typePropane, gas purity: 99.995%
Thermal power (kW)0.013, 0.026, 0.039, 0.052, 0.065
Lower heat value for propane (kJ/kg)46.56
Equivalence ratio (Φ)0.90
Atmospheric pressure (MPa)0.105
Gas mixture temperature (°C)0, 25, 50, 75, 100
Burner lengths (mm)1.2, 2.4, 3.6, 4.8, 6.0
Disclaimer/Publisher’s Note: The statements, opinions and data contained in all publications are solely those of the individual author(s) and contributor(s) and not of MDPI and/or the editor(s). MDPI and/or the editor(s) disclaim responsibility for any injury to people or property resulting from any ideas, methods, instructions or products referred to in the content.

