Article

Influence of Deep Foundation Pit Excavation on Adjacent Pipelines: A Case Study in Nanjing, China

1
College of Civil Engineering, Tongji University, Shanghai 200092, China
2
The Third Construction Engineering Company Ltd. of China Construction Second Engineering Bureau, Beijing 100070, China
3
Key Laboratory of Urban Security and Disaster Engineering, Ministry of Education, Beijing University of Technology, Beijing 100124, China
4
China Construction Second Engineering Bureau Ltd., Beijing 100070, China
*
Author to whom correspondence should be addressed.
Appl. Sci. 2024, 14(2), 572; https://doi.org/10.3390/app14020572
Submission received: 6 December 2023 / Revised: 31 December 2023 / Accepted: 4 January 2024 / Published: 9 January 2024

Abstract

:
To investigate the pipeline deformation pattern caused by the excavation of deep foundation pits in composite soil–rock strata, a comprehensive study integrating on-site monitoring and numerical simulation was conducted. This study centered on a deep foundation excavation project in the soft soil in Nanjing’s floodplain region. The analyses of pipeline settlement and deformation were performed based on field-measured data. This study investigated the impact of excavation on the mechanical properties of the surrounding soil that resulted in the progressive deformation of adjacent pipelines. Furthermore, numerical simulations were conducted using Plaxis 3D CONNECT Edition v22 finite element analysis software. This study elucidated the influence of factors such as pipeline–pit distance and burial depth on pipeline deformation, conducting a quantitative analysis of their effects. The results indicated that deformation primarily occurs unevenly near pit corners and is less pronounced in soil–rock strata than in single-type soil layers. This study established correlations between pipeline displacements and various factors, offering valuable insights for future excavation projects conducted under similar conditions.

1. Introduction

In urban environments, the intricate network of underground pipelines, including utilities and communication lines, is significantly affected by any nearby deep foundation pit construction [1,2]. The excavation process can lead to pipeline stress, deformation, or damage, posing risks such as engineering infrastructure failures and road collapses. The extent of these impacts escalates with the increase in the size and depth of the excavation, highlighting the critical need for careful management and monitoring in such construction endeavors [3].
Internationally, scholars have addressed these challenges through various methodologies, including laboratory experiment, field monitoring, analytical, and numerical simulation approaches [4]. Yimsiri et al. [5] analyzed the interaction between soil and pipelines in sandy soil using centrifuge models and finite element methods. Istanbulluoglu et al. [6] investigated pipe–soil interactions using experimental and numerical methods. However, due to the limitations of experimental conditions and costs, laboratory research findings are limited. Finite element models can be used to simulate complex geological and engineering conditions, enabling detailed analysis of factors like excavation steps, pipeline depth, distance from the pit, and pit stiffness on pipeline deformation. Zhang et al. [7] developed a three-dimensional model of pipelines and pits to study deformation patterns under varying excavation parameters. Ye et al. [8] combined practical engineering cases with finite element simulations to optimize pit structures by analyzing the effects of pit excavation on adjacent subway tunnel deformation and internal tunnel forces. Jin et al. [9] used Plaxis finite element software to simulate the large-diameter pipeline displacement caused by pit excavation, examining the differences in horizontal and vertical displacements. Shi et al. [10] conducted parametric analyses on the impact of pit construction on nearby pipelines using finite element methods that considered the small strain stiffness characteristics of soil, and they segmented zones of pit excavation impact on nearby pipelines. Mohammed et al. [11] performed numerical analyses considering saturated and unsaturated soil excavation using an improved effective stress analysis method to study the force on and deformation of rigid and flexible pipelines. Their findings indicated reduced deformation and internal forces in pipelines during unsaturated soil excavation. Miliziano et al. [12] used Plaxis3D software to predict the impact of tunnel construction on historic buildings in Rome. A hardened soil model with small strain stiffness was used to model the behavior of the soil, and the results of the study provided useful insights into the behavior of soil tunnel construction systems. Song et al. [13] explored the effects of deep foundation excavation on neighboring oil pipelines through numerical simulations and field tests. The rule of the changes in the pipeline–soil gap was investigated. Finally, the effect of changes in the pipeline foundation and overlying soil layer on pipeline settlement was discussed. Additionally, scholars have monitored real-world excavation projects. Tan and Lu [14] analyzed the impact of circular pit and subway station pit excavations in soft-soil areas on adjacent shallow-buried underground pipelines, considering pipeline stiffness, relative position to the pit, and soil properties; they proposed deformation prediction formulas based on empirical data, highlighting the decisive role of the pipeline’s position relative to the pit. Jiang et al. [15,16] have developed a stress prediction model for pipelines under different operating pressures, influenced by nearby pit and tunnel explosion vibrations, which is useful for assessing pipeline safety during pit blasting operations. In theoretical analyses, pipeline deformation is often modeled using the elastic foundation beam model, with the Winkler foundation model being widely used. However, this model overlooks the continuity of foundation deformation, leading to improved dual-parameter models in many studies.
In the field of deep foundation pit engineering, most historical research has concentrated on singular soil or rock strata, leaving a gap in the understanding of the effects of excavations in complex strata, which include layers of both soil and rock. This study, focusing on a deep foundation pit project in Nanjing’s soft soil floodplain, aimed to fill this gap. By combining field monitoring data with advanced numerical simulations using Plaxis 3D, this research delved into the intricate dynamics of composite soil–rock strata and their influence on pipeline deformation. This study elucidates not only he deformation patterns of pipelines in proximity to deep foundation pits but also how variables such as the excavation depth and the burial depth of pipelines interplay in this context. The insights gained are pivotal for the design and execution of large-scale foundation pits in similar soft soil regions, offering a significant contribution to both theoretical understanding and practical application in geotechnical engineering.

2. Case Study

2.1. Site Investigation and Data Collection

This study was conducted in Jiangsu province, China. As shown in Figure 1, the project consists of two fifty-story office buildings plus a four-story basement. The foundation pit’s excavation depth is roughly 25.00 m, and the excavation area is around 117,000 m2. There are two buildings on the south and west sides of the foundation pit. The two buildings on the south side are 10-story frame structures with raft–pile foundations, where the pile diameter is 700 mm, and the pile length is 30 m. The two buildings on the west side are 15-story frame–shear wall structures with raft–pile foundations, where the pile diameter is 800 mm, and the pile length is 35 m. The minimum clear distance between the foundation pit and the buildings on the south and west sides is 41.6 m and 24.9 m, respectively. On the north side of the excavation, 140 m away from the edge of the excavation, is the Yangtze River. On the south side of the foundation pit, 8.7 m to 11 m away, there are gas pipelines and water pipelines, buried at depths of 5–6 m.

2.2. Geological Setting

Figure 2 shows the typical soil profile of the excavation depth. There are seven main soil layers. The soil of the excavation depth at the foundation site is mainly powdery clay and fine powdery sand from the surface to the planned depth: ① miscellaneous fill; ② plain fill; ③ silty powdery clay; ④ powdery fine sand; ⑤ fine–medium sand; ⑥ strongly weathered tuff; ⑦ medium weathered tuff. According to the indoor test results and survey experience, ③ silty powdery clay is a highly compressive soil with low bearing capacity, poor homogeneity, and high sensitivity, so is the main soil layer challenging the excavation. Representative parameters of different soil layers were obtained through laboratory tests and field measurements. The groundwater level at the site varies slightly depending on the weather and is between 1.2 and 1.7 m below the surface. For the foundation pit, layered dewatering and step-by-step excavation were adopted to control the groundwater level to 1–2 m below the excavation surface. A “two-in-one” underground diaphragm wall was set up around the supported excavation. As shown in Figure 2, the underground diaphragm wall + supports were the foundation pit enclosure. The underground diaphragm wall was 50 m deep and 1200 mm thick and was embedded in weathered rock formations. Reinforced concrete supports were placed 1.5 m, 7.0 m, 13.5 m, 18.5 m, and 25.0 m below the ground level to support the diaphragm wall. Supports for levels 1 to 4 had a cross-section of 1000 mm × 1000 mm. Steel lattice columns, 500 mm × 500 mm, were embedded into the column piles below to support the reinforced concrete supports.

3. Analysis of Measured Data

To ensure the safety of the underground pipelines during the excavation of the foundation pit, monitoring points were set up and monitored for two pipelines—a water supply pipeline and a gas pipeline—located on the south side of the pit. As illustrated in Figure 2, these monitoring points, named P1–9 and P10–18, were placed approximately 10 m apart. For ease of analysis, a rectangular coordinate system was established, with the central axis line in the direction of the south side of the pit as the x-axis and the edge of the west side of the pit as the y-axis. The horizontal distance of the pipeline settlement monitoring points from the west edge of the pit was represented by the x-coordinate. The final settlement data from all monitoring points, along with the monitoring data for the entire excavation process at characteristic points, were selected. These data were used to plot the time history curve of vertical displacement at characteristic points and a comparison chart of the final vertical displacement of the pipeline.
Figure 3 depicts the time history curves of the vertical displacement for characteristic points along two pipelines. The vertical displacement at these monitoring points generally showed a downward trend, as shown in the figure. Moreover, as the foundation pit excavation progressed, the amount of settlement gradually increased. The settlement amount increased as the monitoring points’ x-coordinates increased (i.e., as they became closer to the center of the pit), but the rate of increase diminished over time. Upon completion of the excavation, the maximum settlements of gas pipeline P1–8 (diameter φ = 1200 mm, wall thickness t = 5 mm) and water supply pipeline P9–16 (φ = 1000 mm, t = 5.25 mm) were 33.4 mm and 29.2 mm, respectively. The settlement of pipeline P1–8 exceeded the deformation warning threshold. A comparison of the settlement data at the same x-coordinates for both pipelines at identical time points revealed that the gas pipeline consistently experienced greater settlement than the water supply pipeline. This discrepancy was attributed to differences in the location, burial depth, and material properties of the pipelines.
The final settlement of the pipelines following the completion of the foundation pit excavation is illustrated in Figure 4. As can be seen from the figure, for the monitoring points with the same horizontal coordinates, the final settlement of the gas pipeline (P1–8) was larger than that of the water supply pipeline (P9–16), and the closer to the middle of the pit, the larger the difference, with a maximum difference of 9.6 mm. With the excavation of the pit, the pipeline experienced uneven settlement. After the pit excavation was completed, the pipeline finally was groove-shaped, with large settlement in the middle and small settlement at both ends. The difference in the settlement of the monitoring points in the range of 40–140 m in the horizontal coordinate was small, while the final difference in the settlement of the monitoring points in the range of 0–40 m was larger, which is consistent with the conclusions in the literature [17]. It can be seen that the largest uneven settlement occurred in the 20% of the excavation length at the end of the foundation pit. During the excavation process, pipelines located near the ends of the pit required special protection. Common protection methods included relocation, suspension, tying, and isolation. Typical cases of the impact of pit excavation on neighboring pipelines were selected [18,19], and the pipeline monitoring data from this project were compared and analyzed. In addition to the different strata of the pit, other factors such as pipe material, pipe depth, and pipe spacing from the pit were basically the same or similar in the three cases. In one study [18], the average pit excavation depth was 16 m; the soil to be excavated was a single stratum dominated by miscellaneous fill, vegetative fill, and pulverized clay; and the maximum settlement of a pipeline was 0.083% of the average value of the pit excavation depth. In another study [19], the average depth of pit excavation was 30.2 m; the soil to be excavated was a soft clay stratum consisting of fill, mud clay, and powdery clay; and the maximum settlement of the pipeline was 0.298% of the average depth of pit excavation. In this study, within the composite soil–rock strata, the maximum pipeline settlement was only 0.042% of the average excavation depth. This value is significantly lower than the maximum settlements in the other two cases, being only 50.6% of that in reference [18] and 14.1% of that in reference [19]. This indicates that compared to single-soil strata, relatively less settlement deformation occurs in adjacent pipelines when excavating foundation pits in composite soil–rock strata.

4. Numerical Simulations

4.1. Meshes and Boundary Conditions

Figure 5 demonstrates the use of the PlAXIS (Exton, PA, USA) finite element simulation program for studying the foundation pit excavation process [20]. The soil was modeled using the hardening soil small strain (HSS) model [21], with parameters established through laboratory tests (refer to Table 1 and Table 2). For the rock mass, the Mohr–Coulomb model was applied, and its material parameters are detailed in Table 3. The enclosure structure of the foundation pit was represented by a plate element structure. To simulate the interaction between the enclosure structure and the adjacent soil, positive and negative interfaces were created on both sides of the plate. The stiffness of the building’s upper floors and basement was simulated using single plates, with parameters derived based on the equivalent stiffness principle. Concrete supports were simulated using beam elements, with parameters defined based on actual dimensions and concrete grades, considering the effects of temperature, creep, and construction on the deformation of reinforced concrete structures, which could lead to cracking. The building’s superstructure was simplified into a three-dimensional frame structure. This structure comprised linear elastic beams and columns, simulated using beam elements with dimensions of 300 × 400 mm2 for beams and 350 × 350 mm2 for columns. The column pile in the foundation pit and the building’s pile foundation were modeled using embedded-pile elements.
In the numerical model, certain assumptions differed from the actual project conditions. The underground pipeline was assumed to have a density similar to that of the soil, regardless of the pressure within the pipeline and the effect of the fluid on it. It was treated as a line unit, without considering the cross-sectional size of the pipeline. The model adopted the actual parameters of the gas pipeline (diameter d = 1200 mm, wall thickness t = 5 mm) and the water supply line (d = 1000 mm, t = 5.5 mm). The distances between the pipeline and the foundation pit were set at 8 m and 10 m, respectively, with a burial depth of 5 m. The overall material parameters are presented in Table 4.
The boundary conditions of the model were set so that the upper part remained unconstrained, while constraints were applied to the other five surfaces. This approach minimized the influence of boundary conditions on the calculation results. The mesh size of the model, Le, was determined using the following formula:
L e = r e 20 × ( x max x min ) 2 + ( y max y min ) 2 + ( z max z min ) 2 .
where xmax, xmin, ymax, ymin, zmax, and zmin are the geometric model’s boundary dimensions. The relative element size coefficient, re, was 0.5. The finite element mesh’s basic soil element was a tetrahedron with ten nodes. There were 149,715 elements and 24,905 nodes in the finite element model.
For numerical modeling analysis, the construction steps of foundation pit excavation were transformed into numerical analysis steps. The project’s spatial location and the plan dimensions of the on-site pit were considered. Factors such as the impact of the surrounding buildings on pit excavation and the extent of ground settlement due to excavation were also taken into account. As a result, the influence area was determined to be five times the pit’s excavation depth. Consequently, the final dimensions of the model were set at 350 m in length, 300 m in width, and 70 m in depth.

4.2. Simulation Method

The simulation process followed the sequence of phases used in the field, accurately mirroring the effects of excavation on both the enclosure structure and the surrounding environment. This simulation was designed to match actual conditions closely. In line with the project’s real-world situation, fluid–solid coupling was considered. Before each excavation phase, a dewatering step was included. Dewatering was achieved by adjusting the liquid head. The simulated working conditions and their corresponding durations are detailed in Table 5.

4.3. Validation of Numerical Simulation against Measured Results

The ground movement caused by excavation has three-dimensional effects and is closely related to the distribution of the lateral deformation of the diaphragm wall. Figure 6 presents an example of the three-dimensional spatial distribution of ground settlement caused by excavation. It shows the maximum lateral displacement of the diaphragm wall and how it changes from the middle to the corner of the pit, illustrating a distinctive three-dimensional pit angle effect. This effect is critical in understanding the variation in surface settlement around the different sides of a foundation pit. The relationship between lateral wall deformation and surface settlement is also evident. The wall between the lateral displacement of the 30 mm wall was selected as the critical displacement interval. It can be seen that the critical interval of the wall is almost the same as the surface settlement interval on different sides of the pit wall. Regarding the lateral deformation of the wall, a gradual transition from the middle to the corner indicates a broader area of surface settlement, while a rapid change leads to a more localized subsidence. The figure thus provides crucial insights into the spatial dynamics of ground movement during excavation projects.
Figure 7 depicts the settlement distribution curve of the pipeline (P1–8, P9–16) along the parallel direction of the foundation pit’s retaining structure. When excavating to the bottom of the pit, the settlement curve of each pipeline shows a concave deformation mode, showing an approximately Gaussian distribution. It can be seen in the figure that the pipe settlement values obtained from numerical simulation tended to coincide with the measured values, which proves the rationality of the numerical simulation. Monitoring points P6–8 and P14–16 were close to the corner of the foundation pit, and the final settlement changes were not significant due to the influence of the pit corner effect. Monitoring points P1–5 and P9–13 are close to the middle of the pit, and the maximum settlement value of the pipeline was more than 30 mm in these locations due to the spatial effect. The settlement and curvature of pipeline in the middle of foundation pit were the largest. It is estimated that for cast iron pipes (P9–16), the maximum curvature was 4.8 × 10⁻⁴, and the maximum tensile stress was 28.8 MPa. Although this will not damage the strength of the pipe, too large an angle poses a greater threat by weaking the connections of the pipeline.
It can be seen that the distributions of pipeline subsidence and ground settlement are highly similar. The measured settlement values at the surface and pipeline settlement measuring points with similar plane positions were also close. This shows that the relationship between the settlement of the pipeline and the material and size of the pipeline is not strong but mainly depends on the distance between the pipeline and the foundation pit. This also shows that there is a good contrast between the pipeline and the ground settlement from another point of view. Using the spatial distribution law of the pipeline can further reveal the distribution of ground settlement over a large range, helping to overcome the shortcomings of most of the previous studies that focused on local ground settlement perpendicular to the retaining structure of the foundation pit. Combining these results with the specifics of this project, it can be found that the range of surface settlement influence caused by foundation pit excavation can extend beyond the edge of the retaining structure. Different from the concave deformation mode of pipeline settlement in the middle of the foundation pit, the pipeline settlement near the pit corner shows convex deformation.

4.4. Single-Factor Numerical Simulation Analysis

A single-factor numerical simulation was conducted focusing on three variables: depth of pit excavation, depth of pipeline burial, and the distance between the pipeline and the pit. Each factor was evaluated for five to six different levels. The water supply pipeline was analyzed as an example. The vertical and horizontal displacements of the pipelines served as assessment indicators, allowing for a comparative analysis of their impact on pipeline deformation. Based on the results of the numerical simulations, displacement curves of the pipelines were plotted, aligning with the coordinate axes established in Figure 1. Pipeline settlement was defined as negative, while heave was defined as positive. Horizontal displacement toward the inside of the pit was considered positive, and toward the outside was considered negative.

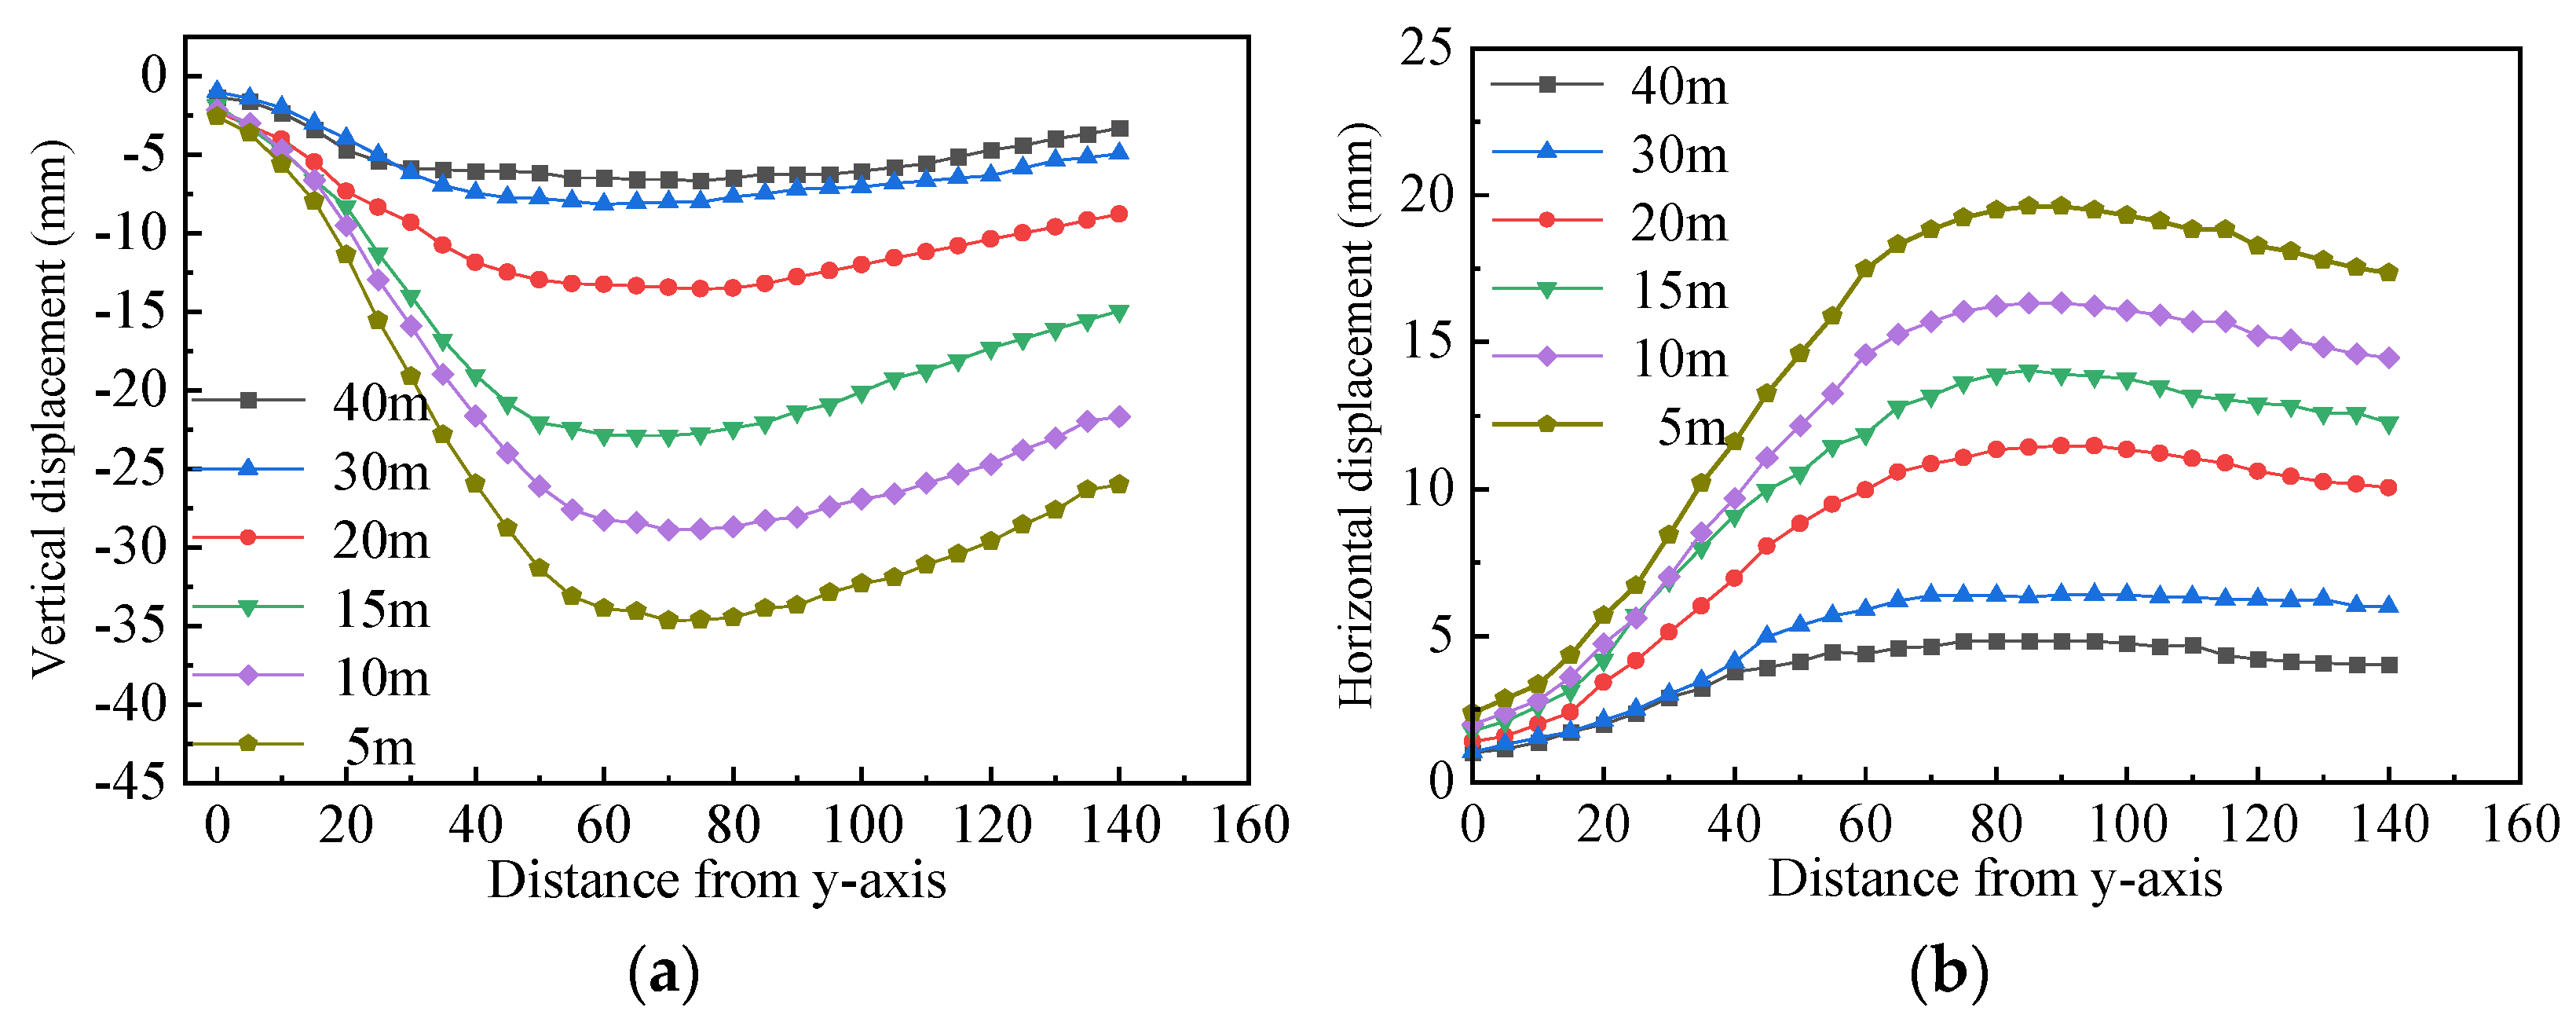
4.4.1. Depth of Pit Excavation

For the depth of the foundation pit excavation, five levels were set: 5, 10, 15, 20, and 25 m. Numerical simulations were performed for each condition to compare and analyze the vertical and horizontal displacements of the pipelines. As evident from Figure 8a, with increasing excavation depth, the pipeline settlement gradually increased. The vertical displacement of the pipeline within 0–60 m from the y-axis showed significant variation, leading to substantial uneven settlement. This could cause tearing or cracking in the pipelines, warranting special protection in this area, which aligns with the results obtained from the analysis of the actual data. Figure 8b shows that the pattern of change in the horizontal pipeline displacement was essentially consistent with the vertical displacement. Within 70–140 m from the y-axis, the horizontal displacement of the pipelines was relatively uniform. However, significant variation in horizontal displacement occurred near the pit corners. The combined effect of horizontal and vertical displacements could accelerate pipeline damage. Therefore, special protection should be applied to pipelines in these areas.

4.4.2. Distance between Pipeline and Pit

Based on the results of numerical simulation trials, it was determined that the impact of foundation pit excavation on surface settlement extended to about 40 m outside the pit. Considering the pipeline in this project was located 10 m from the pit, the distance between the pipeline and the pit was varied from 0.2 to 1.6 times the depth of pit excavation. Six levels were chosen for numerical simulation: 5, 10, 15, 20, 30, and 40 m.
Figure 9, which was derived from numerical simulation results, compares the vertical and horizontal displacements of the pipeline at different distances from the pit. From Figure 9a, it can be observed that when the distance between the pipeline and the pit exceeds 30 m, the magnitude of the vertical displacement of the pipeline remains relatively unchanged with increasing horizontal distance from the y-axis. This indicates minor uneven vertical displacement in this range, having minimal impact on pipeline deformation. However, when the distance is less than 30 m, a significant abrupt change in vertical displacement occurs near the end of the pit, leading to substantial uneven vertical displacement, potentially causing tearing or rupture of the pipeline. Figure 9b reveals that the pattern of change in the pipeline’s horizontal displacement is broadly consistent with its vertical displacement. Significant uneven displacement, impacting the pipeline’s integrity, can be observed when the distance between the pipeline and pit is less than 30 m. Therefore, when the distance between the pipeline and the pit is greater than 1.2 times the depth of the excavation, the uneven displacement of the pipeline is reduced, and the impact of pit excavation on the integrity of the pipeline is less significant.

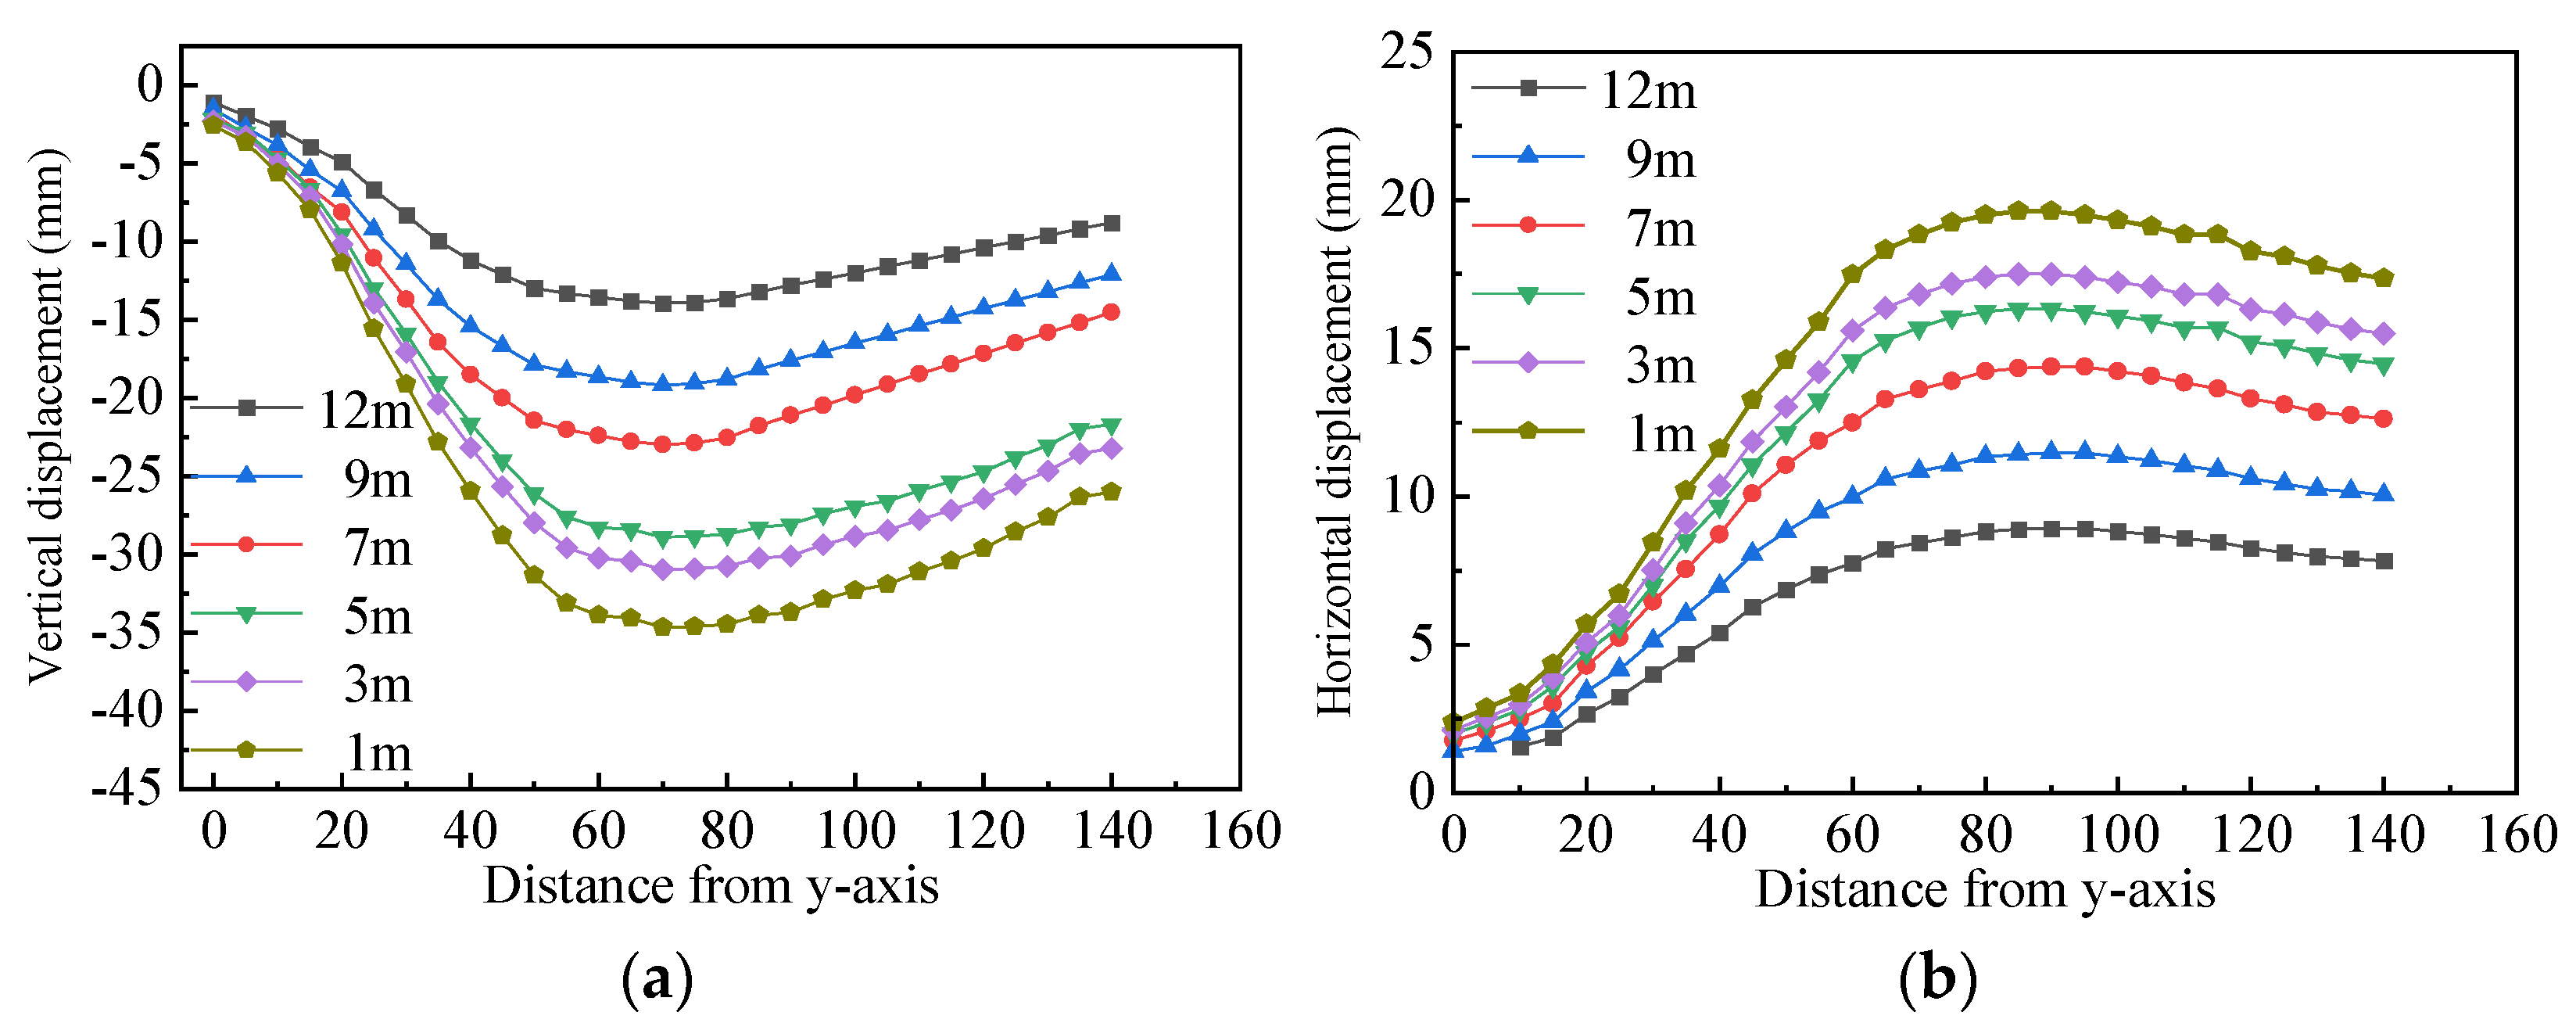
4.4.3. Depth of Buried Pipeline

Pipeline burial depth is one of the primary factors influencing pipeline deformation. In this project, the pipeline’s burial depth was set at 5 m. Numerical simulations were conducted for six scenarios with burial depths of 1, 3, 5, 7, 9, and 12 m. Figure 10, based on these simulation results, compares the vertical and horizontal displacements of the pipeline at different burial depths.
From Figure 10a, it is evident that uneven vertical displacement of the pipeline primarily occurs within 0–60 m of the pit ends. Furthermore, as the burial depth of the pipeline increases, the uneven vertical displacement gradually decreases. At a burial depth of 5 m, the pipeline’s maximum settlement reaches the warning level. Figure 10b shows that the pattern of the pipeline’s horizontal displacement is generally consistent with its vertical displacement. The greatest uneven horizontal displacement occurs at a burial depth of 1 m, particularly within 0–60 m of the pit ends. Therefore, to ensure the integrity of the pipeline and prevent damage due to uneven displacement, the burial depth of the pipeline should not be less than 5 m.

5. Parameter Analysis

To quantitatively analyze the impact of three factors—the distance between the pipeline and the foundation pit, the depth of pipeline burial, and the depth of pit excavation on pipeline deformation—a comparative study was conducted using the relative sensitivity analysis method [22]. The sensitivity coefficient ηSR is defined as the ratio of the change rate in the output results to the change rate in the input variables. The calculation formula for sensitivity ηSR is as follows:
η SR = [ f ( x LR ) f ( x ) f ( x ) ] [ x LR x x ]
In this formula, x and xLR represent the reference and various values of the input variable, respectively; f(x) and f(xLR) correspond to the output results for x and xLR.
The calculation formula for sensitivity ηSS is as follows:
η SS = η SR max ( x R ) min ( x R ) x
where max(xR) and min(xR) represent the maximum and minimum values of the parameter’s variation. By normalizing the magnitude of the changes, different sensitivity ratios can be dimensionless-weighed. Table 6 presents the sensitivities of each factor to pipeline displacement. The sensitivities to both vertical and horizontal displacements of the pipeline, in descending order, are the distance between the pipeline and pit, the depth of pipeline burial, and the depth of pit excavation. The impact of the distance between the pipeline and pit on vertical displacement is less than that on horizontal displacement. The influence of pipeline burial depth on vertical displacement is greater than on horizontal displacement. The effect of pit excavation depth is almost equal on both.
Therefore, it is evident that during excavation in composite soil–rock strata, the distance between the pipeline and the pit has the greatest impact on pipeline deformation, followed by pipeline burial depth, with the depth of pit excavation having a relatively weaker impact. In the pit design process, priority should be given to the horizontal distance between the pit and the pipeline, and the pipeline should be buried as deep as possible, considering construction costs.

6. Conclusions

This study investigated the impact of deep foundation pit excavation on neighboring pipelines in a floodplain area in Nanjing, China. In this study, the issue of long-term pipeline deformation due to deep foundation pit excavation was analyzed with a focus on its progression over time. It addressed how the excavation process influences the mechanical properties of the surrounding soil, resulting in the gradual deformation of nearby pipelines. This paper emphasized the need for continuous monitoring and evaluation of pipeline integrity over time, as immediate effects may be minimal, but long-term effects can be significant, potentially leading to pipeline damage or failure if not properly managed. The focus was on three main factors: the distance between the pipeline and the foundation pit, the pipeline burial depth, and the depth of pit excavation. Using relative sensitivity analysis, this research quantified the extent to which each factor influences pipeline deformation. The main conclusions can be drawn as follows:
(1)
After the completion of foundation pit excavation, the pipeline typically exhibited a concave shape, with greater settlement in the middle and lesser settlement at the ends. Uneven displacement of the pipeline primarily occurred within 1.6 times the excavation length near the pit corners. It is recommended that the pipelines near the pit corners be specially protected prior to excavation to prevent uneven settlement, which could lead to tearing or rupture of the pipelines.
(2)
With an increase in the depth of the pit excavation, both vertical and horizontal displacements of the pipeline increased, with a relatively larger increase occurring in vertical displacement. Compared to excavation in a single-soil layer, excavation in composite soil–rock strata showed a relatively smaller impact on the settlement deformation of adjacent pipelines.
(3)
As the distance between the pipeline and the pit increased, both vertical and horizontal displacements of the pipeline gradually decreased. When the distance between the pipeline and the pit was less than 1.2 times the depth of excavation, larger uneven displacements of the pipeline were observed. This calls for careful planning and monitoring of pipeline integrity in close proximity to excavation sites.
(4)
Both vertical and horizontal displacements of the pipeline decreased with an increase in the depth of pipeline burial. To prevent significant uneven displacement and potential damage to pipelines due to pit excavation, the burial depth of the pipelines should be no less than 5 m.
(5)
The analysis indicated that the distance between the pipeline and the pit is the most critical factor influencing deformation, followed by burial depth. This underscores the need for the strategic planning and placement of pipelines in relation to excavation activities.

Author Contributions

B.W.: investigation, writing—original draft, funding acquisition; C.G.: software, formal analysis; P.L.: funding acquisition, writing—review and editing; M.Y.: data curation; L.L.: visualization. All authors have read and agreed to the published version of the manuscript.

Funding

The authors gratefully acknowledge the financial support provided by Science and Technology Funding Scheme for Three Companies of China Construction Bureau II No. CSCEC2b3c-2021-K-65.

Institutional Review Board Statement

Not applicable.

Informed Consent Statement

Not applicable.

Data Availability Statement

The data presented in this study are available in this article.

Conflicts of Interest

Author Meng Yang was employed by The Third Construction Engineering Company Ltd. of China Construction Second Engineering Bureau. And author Liulian Li was employed by The China Construction Second Engineering Bureau Ltd. The remaining authors declare that the research was conducted in the absence of any commercial or financial relationships that could be construed as a potential conflict of interest.

References

  1. Ardakani, A.; Bayat, M.; Javanmard, M. Numerical modeling of soil nail walls considering Mohr Coulomb, hardening soil and hardening soil with small-strain stiffness effect models. Geomech. Eng. 2014, 6, 391–401. [Google Scholar] [CrossRef]
  2. Zhang, Y.W.; Weng, X.L.; Song, Z.P.; Sun, Y.F. Modeling of Loess Soaking Induced Impacts on a Metro Tunnel Using a Water Soaking System in Centrifuge. Geofluids 2019, 2019, 5487952. [Google Scholar] [CrossRef]
  3. Cheng, W.C.; Song, Z.P.; Tian, W.; Wang, Z.F. Shield tunnel uplift and deformation characterisation: A case study from Zhengzhou metro. Tunn. Undergr. Space Technol. 2018, 79, 83–95. [Google Scholar] [CrossRef]
  4. Peck, R.B. Deep excavations and tunneling in soft ground. In Proceedings of the 7th International Conference on Soil Mechanics and Foundation Engineering, Mexico City, Mexico, 25–29 August 1969; State of the Art Volume. pp. 225–290. [Google Scholar]
  5. Yimsiri, S.; Soga, K.; Yoshizaki, K.; Dasari, G.R.; O’Rourke, T.D. Lateral and upward soil-pipe interactions in sand for deep embedment conditions. J. Geotech. Geoenviron. Eng. 2004, 130, 830–842. [Google Scholar] [CrossRef]
  6. Calvetti, F.; Di Prisco, C.; Nova, R. Experimental and numerical analysis of soil-pipe interaction. J. Geotech. Geoenviron. Eng. 2004, 130, 1292–1299. [Google Scholar] [CrossRef]
  7. Zhang, J.; Xie, R.; Zhang, H. Mechanical Response Analysis of the Buried Pipeline Due to Adjacent Foundation Pit Excavation. Tunn. Undergr. Space Technol. 2018, 78, 135–145. [Google Scholar] [CrossRef]
  8. Ye, S.H.; Zhao, Z.F.; Wang, D.Q. Deformation analysis and safety assessment of existing metro tunnels affected by excavation of a foundation pit. Undergound Space 2021, 6, 421–431. [Google Scholar] [CrossRef]
  9. Jin, W.; Ke, L.; Hu, F.J.; Yang, K.F.; Xu, C.J. Influence of deep foundation pit excavation on adjacent large-diameter pipeline. Sci. Technol. Eng. 2020, 20, 790–796. (In Chinese) [Google Scholar] [CrossRef]
  10. Shi, Y.Z.; Ge, X.R.; Li, X.F.; Lin, S.Z. Numerical analysis of the influence of metro deep foundation pit construction on surrounding pipelines. J. Sun Yat-Sen Univ. (Nat. Sci. Ed.) 2017, 56, 83–93. [Google Scholar]
  11. Mohammed, A.K.; Sai, K.V.; Won, T.O. Numerical investigation of Soil–pipeline System Behavior Nearby Unsupported Excavation in Saturated and Unsaturated Glacial Till. Can. Geotech. J. 2019, 56, 69–88. [Google Scholar]
  12. Miliziano, S.; Caponi, S.; Carlaccini, D.; de Lillis, A. Prediction of tunnelling-induced effects on a historic building in Rome. Tunn. Undergr. Space Technol. 2021, 119, 104212. [Google Scholar] [CrossRef]
  13. Song, Z.; Wu, Y.; Zhang, Y.; Wang, K.; Tian, J.; Tian, X. Deformation Response of a Pipeline to Nearby Deep Foundation Pit Excavation: Numerical Simulations and Field Tests. Appl. Sci. 2023, 13, 6597. [Google Scholar] [CrossRef]
  14. Tan, Y.; Lu, Y. Responses of Shallowly Buried Pipelines to Adjacent Deep Excavations in Shanghai Soft Ground. J. Pipeline Syst. Eng. Pract. 2018, 9, 05018002. [Google Scholar] [CrossRef]
  15. Jiang, N.; Gao, T.; Zhou, C.; Luo, X. Effect of Excavation Blasting Vibration on Adjacent Buried Gas Pipeline in a Metro Tunnel. Tunn. Undergr. Space Technol. 2018, 81, 590–601. [Google Scholar] [CrossRef]
  16. Jiang, N.; Zhu, B.; He, X.; Zhou, C.; Luo, X.; Wu, T. Safety Assessment of Buried Pressurized Gas Pipelines Subject to Blasting Vibrations Induced by Metro Foundation Pit Excavation. Tunn. Underground Space Technol. 2020, 102, 103448. [Google Scholar] [CrossRef]
  17. Jiao, N.; Ding, J.W.; Ji, F.; Guo, K.; Liao, Z.S. Analysis on Influence of Deep Foundation Pit Excavation in Soil-Rock Composite Stratum on Deformation of Adjacent Pipelines. J. Southeast Univ. (Nat. Sci. Ed.) 2022, 52, 229–236. [Google Scholar] [CrossRef]
  18. Chen, Z.B. Monitoring and Numerical Analysis of Deformation of Complex Pipelines Adjacent to the Deep Foundation Pit Excavation of the Silihe Road Station of Hefei Metro. Master’s Thesis, Hefei University of Technology, Hefei, China, 2018. (In Chinese). [Google Scholar]
  19. Cheng, K.; Xu, R.; Ying, H.; Gan, X.; Zhang, L.; Liu, S. Observed performance of a 30.2 m deep-large basement excavation in Hangzhou soft clay. Tunn. Underground Space Technol. 2021, 111, 103872. [Google Scholar] [CrossRef]
  20. Brinkgreve, R.B.J.; Engin, E.; Swolfs, W.M. PLAXIS 3D 2013 User Manual; Plaxis B.V.: Delft, The Netherlands, 2013. [Google Scholar]
  21. Benz, T. Small-Strain Stiffness of Soils and its Numerical Consequences. Ph.D. Thesis, Universitat Stuttgart, Stuttgart, Germany, 2007. [Google Scholar]
  22. Shi, Y.Z.; Ge, X.R.; Li, X.F.; Lin, S.Z. Numerical Analysis of the Impact of Subway Deep Foundation Pit Construction on Surrounding Pipelines. Acta Sci. Nat. Univ. Sunyatseni 2017, 56, 84–91. [Google Scholar] [CrossRef]
Figure 1. Schematic layout of pipeline settlement monitoring points (unit: m).
Applsci 14 00572 g001
Figure 2. Typical cross-section of the excavation (Section B-B).
Applsci 14 00572 g002
Figure 3. Pipelines settlement versus time. (a) P1–8; (b) P9–16.
Applsci 14 00572 g003
Figure 4. Final settlement of pipelines after completion of pit excavation.
Applsci 14 00572 g004
Figure 5. Plan of the site and layout of the instruments (unit: m).
Applsci 14 00572 g005
Figure 6. Spatial distribution cloud map of ground settlement.
Applsci 14 00572 g006
Figure 7. Distribution of pipeline settlements parallel to the pit. δvm denotes the maximum settlement value of the pipeline; Hm denotes the excavation depth.
Applsci 14 00572 g007
Figure 8. Comparison of pipeline displacements for different pit excavation depths. (a) Vertical displacement; (b) horizontal displacement.
Applsci 14 00572 g008
Figure 9. Comparison of pipeline displacements for different pipeline-to-pit spacing. (a) Vertical displacement; (b) horizontal displacement.
Applsci 14 00572 g009
Figure 10. Comparison of pipeline displacements for different pipeline burial depths. (a) Vertical displacement; (b) horizontal displacement.
Applsci 14 00572 g010
Table 1. Constitutive parameters of HSS model.
ParameterDefinitionUnit
E 50 r e f Reference secant modulusMPa
E o e d r e f Reference tangent modulusMPa
E u r r e f Reference loading and unloading modulusMPa
mStiffness stress level related power exponent/
c Effective cohesionkPa
φ Effective internal friction angle°
ψ Dilatancy angle°
R f damage ratio/
ν urLoad–unload Poisson’s ratio/
G 0 r e f Initial shear modulus under reference confining pressureMPa
K 0 Static side pressure coefficient
γ 0.7 Shear strain threshold/
Table 2. Summary of parameters of HSS model.
Soil LayerC (kPa)φ (°)K0 ψ (°) P r e f
(kPa)
m v u r E 50 r e f
(MPa)
E u r r e f
(MPa)
E o e d r e f
(MPa)
R f G 0 r e f
(MPa)
γ 0.7
(10−4)
① Miscellaneous fill25.015.00.7401000.650.425.529.24.90.8428.11.5
② Plain fill27.320.50.6501000.750.396.132.05.60.7930.22.3
③ Silty powdery clay18.330.20.50.21000.640.333.837.53.50.9047.42.9
④ Powdery fine sand1.635.40.425.41000.560.308.942.86.90.6490.53.5
⑤ Fine medium sand0.833.30.463.31000.730.3212.656.210.70.72108.23.2
Table 3. Parameters of rock mass model.
Soil LayerOntogenetic RelationsThickness (m)Young’s Modulus, E (MPa)Unit Weight (kN·m−3)Cohesion, c (kPa)Friction Angle, φ (°)
⑥ Strongly weathered tuffMC2.135.021.043.035
⑦ Medium weathered tuffMC15,000.023.083.035
Table 4. Physical and mechanical parameters of enclosure structures, buildings, and pipelines.
Support ElementsCross-Section (mm)Unit Weight (kN·m−3)Elastic Modulus, E (GPa) Poisson’s Ratio
Diaphragm walls120026300.15
Inner support1000 × 100026300.15
Column pileR = 50024300.22
floor slab50026300.15
Superstructure beams and columns(300 × 400)
and
(350 × 350)
24300.22
Lower pile of building1000 × 100024300.22
Gas pipelineR = 600752060.2
Water supply pipelineR = 5009.50.80.4
Table 5. Key working conditions and construction periods.
StageSimulation StepConstruction SequenceConstruction Date
1Generate the initial stress field
2Create an adjacent building model
3Clear displacement; create the enclosure structure and column pilesConstruction of diaphragm walls and column piles2020.12.28–2021.3.14
4Dewatering to BGS 2.5 m (level 1), and excavating to BGS 1.5 mDewatering to BGS 2.5 m (level 1), and excavating to BGS 1.5 m2021.3.15–2021.3.27
5Activate the first level of horizontal support at BGS 1.5 mFirst floor support set up2021.3.31–2021.4.11
6Dewatering to BGS 8 m (level 2), and excavating to BGS 7 mDewatering to BGS 8 m (level 2), and excavating to BGS 7 m2021.4.22–2021.5.20
7Activate the second level of horizontal support at BGS 7 m2nd level support set up2021.5.22–2021.6.1
8Dewatering to BGS 14.5 m (level 3), and excavating to BGS 13.5 mDewatering to BGS 14.5 m (level 3), and excavating to BGS 13.5 m2021.6.2–2021.6.10
9Activate the third level support at BGS 13.5 m3rd-level support set up2021.6.11–2021.6.22
10Dewatering to BGS 19.5 m (level 4), and excavating to BGS 18.5 mDewatering to BGS 19.5 m (level 4), and excavating to BGS 18.5 m2021.6.25–2021.7.12
11Activate the fourth level support at BGS 18.5 m4th-level support set up2021.7.14–2021.7.25
12Dewatering to BGS 26 m (level 5), and excavating to BGS 25 mDewatering to BGS 26 m (level 5), and excavating to BGS 25 m2021.7.27–2021.8.16
13Activate the bottom platePouring bottom plate2021.8.16–2021.8.30
Table 6. Sensitivity of each factor to pipeline displacement.
Influencing FactorsVertical Displacement SensitivityHorizontal Displacement Sensitivity
Depth of pit excavation0.1980.156
Distance between pipeline and pit0.4550.655
Depth of buried pipeline0.4120.325
Disclaimer/Publisher’s Note: The statements, opinions and data contained in all publications are solely those of the individual author(s) and contributor(s) and not of MDPI and/or the editor(s). MDPI and/or the editor(s) disclaim responsibility for any injury to people or property resulting from any ideas, methods, instructions or products referred to in the content.

