Article

A Stacking Model-Based Classification Algorithm Is Used to Predict Social Phobia

1
School of Computer Science and Technology, Hainan University, Haikou 570228, China
2
Chengfeng College, Hainan University, Haikou 570228, China
3
Department of Computer Science, Kennesaw State University, Kennesaw, GA 30144, USA
*
Authors to whom correspondence should be addressed.
These authors contributed equally to this work as first author.
Appl. Sci. 2024, 14(1), 433; https://doi.org/10.3390/app14010433
Submission received: 20 August 2023 / Revised: 7 November 2023 / Accepted: 20 November 2023 / Published: 3 January 2024
(This article belongs to the Special Issue Recent Advances in Hybrid Artificial Intelligence)

Abstract

:
University students, as a special group, face multiple psychological pressures and challenges, making them susceptible to social anxiety disorder. However, there are currently no articles using machine learning algorithms to identify predictors of social anxiety disorder in university students. This study aims to use a stacked ensemble model to predict social anxiety disorder in university students and compare it with other machine learning models to demonstrate the effectiveness of the proposed model. AUC and F1 are used as classification evaluation metrics. The experimental results show that in this dataset, the model combining logistic regression, Naive Bayes, and KNN algorithms as the first layer and Naive Bayes as the second layer performs better than traditional machine learning algorithms. This provides a new approach to studying social anxiety disorder.

1. Introduction

In the Chinese classification system for mental disorders, social anxiety disorder falls under the category of neurosis. The Chinese Society of Psychiatry’s CCMD-3 defines anxiety disorders, including social anxiety disorder, as a type of neurosis characterized by extreme and irrational fear of external objects or environments [1]. Despite recognizing the irrationality of their fears, individuals with this disorder cannot avoid experiencing anxiety attacks, which are typically accompanied by noticeable anxiety and autonomic nervous system symptoms. Patients either make great efforts to avoid the objects or situations that trigger their fear or endure them with anxiety. The corresponding diagnostic criteria for social anxiety disorder describe symptoms such as a primary fear of social environments (such as eating or speaking in public, attending parties or meetings, or fear of making embarrassing gestures) and interpersonal interactions (such as interacting with others in public, avoiding eye contact, or fearing scrutiny when faced with a crowd).
In contrast, the American classification system DSM-IV places social anxiety disorder or social anxiety disorder under the umbrella of anxiety disorders. The DSM-IV characterizes social anxiety disorder as a persistent and excessive fear of one or more social or performance situations, where the individual is exposed to unfamiliar individuals or potential scrutiny. The individual fears acting in a way that may be embarrassing or humiliating and exhibits symptoms of anxiety. Currently, the specific causes of social anxiety disorder are unclear, but it is likely influenced by multiple factors such as genetics, environment, biology, and psychology.
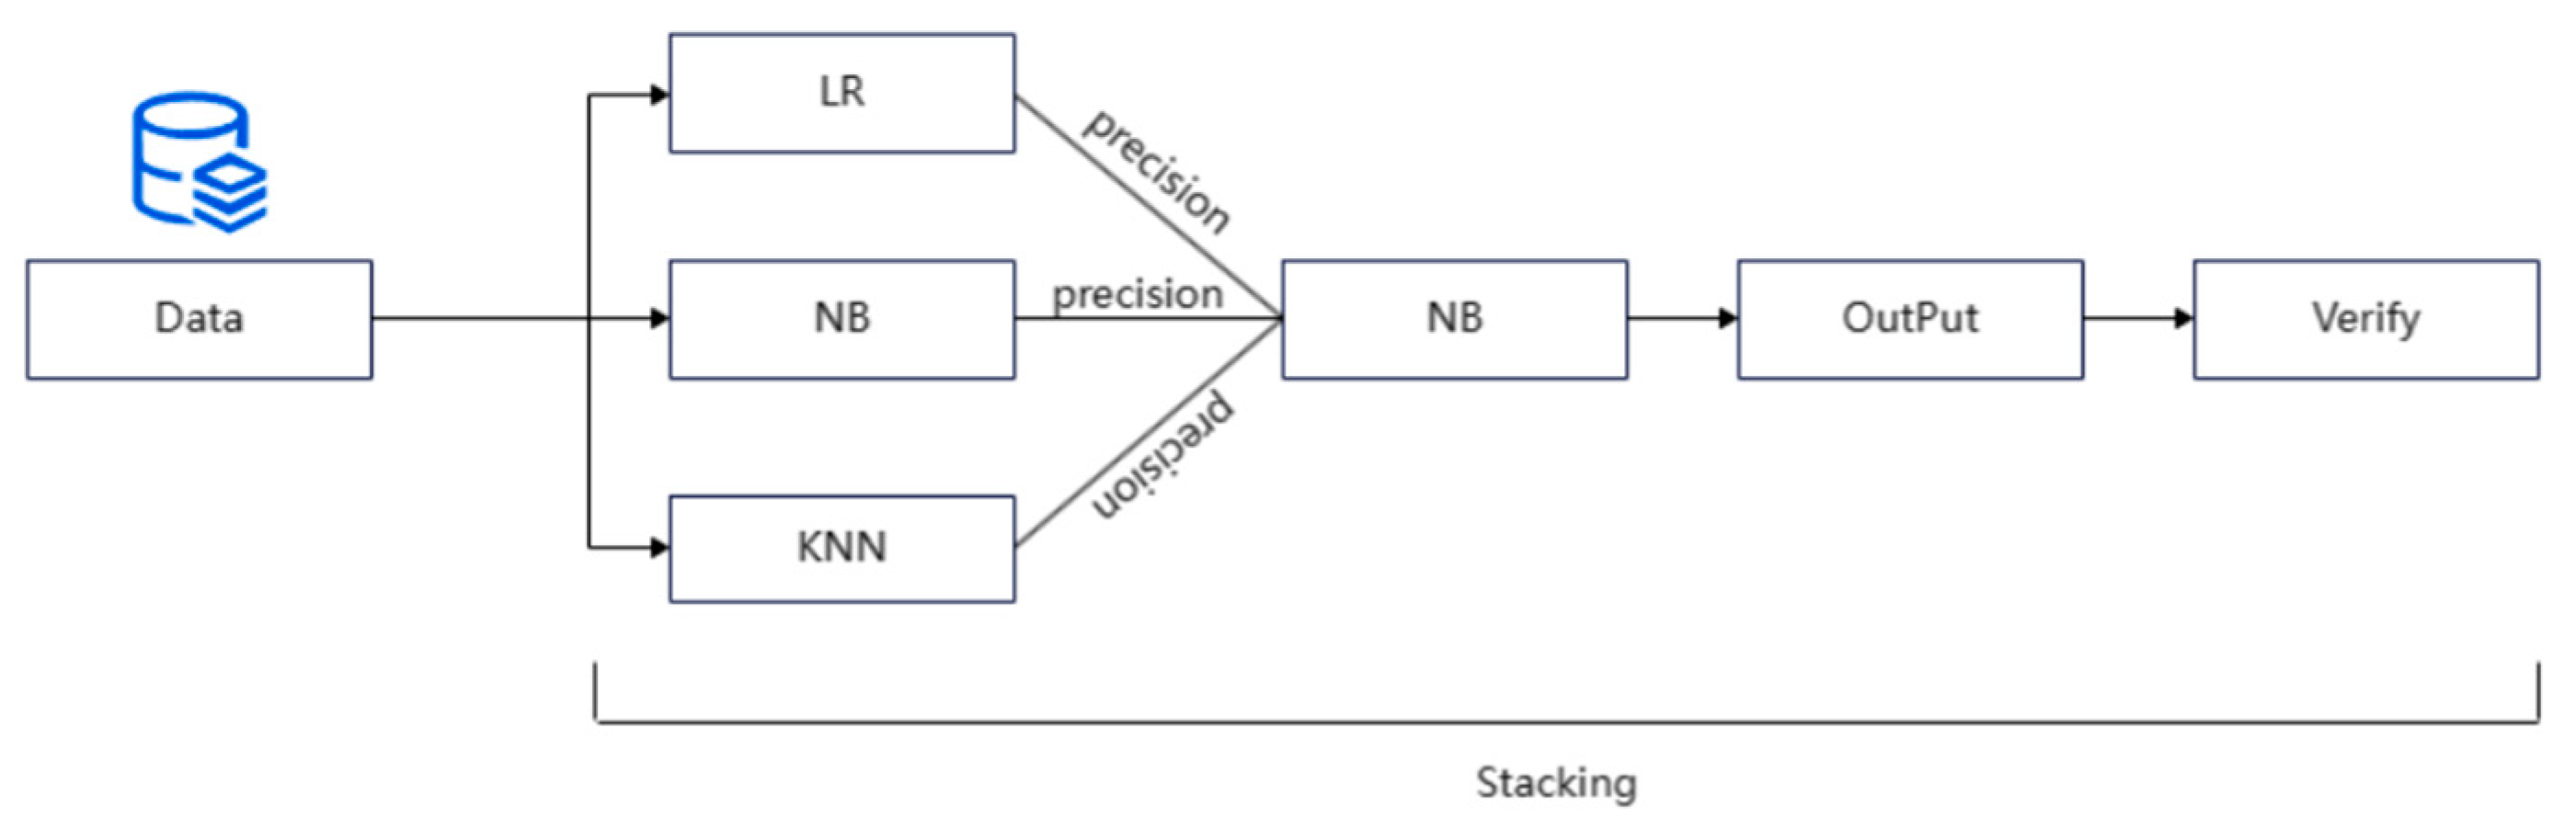
In this study, data were collected through questionnaire surveys to identify social anxiety disorder within a student population. Multiple mainstream machine learning algorithms were employed to find the most optimal algorithm for detection. Ultimately, a stacked model was built by combining logistic regression, Naive Bayes, and k-Nearest Neighbor (KNN) algorithms, which yielded better prediction results compared to individual algorithms. However, it is important to note that the subjective nature of data collected through questionnaire surveys presents limitations. Therefore, the authors suggest the establishment of a comprehensive information collection system in schools. Additionally, mainstream machine learning algorithms have their inherent limitations. Nevertheless, this study provides insights for seeking the most optimal algorithm for identifying social anxiety disorder.

2. Related Studies

The classification model for social anxiety disorder is a fundamental model that categorizes individuals into patients and non-patients, and the effectiveness of this classification is crucial for the subsequent treatment of social anxiety disorder. For example, Al-Ezzi et al. proposed the fusion of EEG with other techniques such as fMRI and magnetoencephalography (MEG) to improve effectiveness beyond the use of EEG alone, ultimately enhancing the selection process for treatment plans and exploring the potential of EEG measurements in early diagnosis and phenotypic examination of social anxiety disorder [2]. Boukhechba et al. used non-invasive mobile sensing technology to passively assess the level of social anxiety among college students and developed a social anxiety prediction model based on automatically generated Global Positioning System (GPS) data. They employed a neural network-based prediction approach to longitudinally track college students, extract daily activity features, and predict social anxiety symptoms [3]. Gong et al. proposed examining subtle behaviors of individuals with social anxiety during engagement in various forms of social interaction using smartphone sensors and how these behaviors vary with location changes. They found that individuals with higher (vs. lower) social anxiety symptoms exhibited more movement, as tracked by accelerometers, particularly in unfamiliar locations (i.e., not at home or work) [4]. There are also some deep learning-based models, such as those analyzing patient behavioral data in virtual reality (VR) environments, that can aid researchers in understanding patient fear responses and adjusting VR environments to better accommodate patient needs [5]. Wiederhold et al. mentioned that leveraging virtual reality in healthcare, using mobile VR technology to alleviate anxiety and pain, will gradually become a future trend in social anxiety disorder treatment [6].
Furthermore, researchers have proposed using thermography as a passive medium to analyze physiologically related signals associated with emotional states, avoiding the discomfort of attaching physiological signal sensors to the skin and providing more realistic experimental data and better experimental results [7]. Additionally, many applications of emotion recognition in human–computer interactions currently rely on visual information, typically based on facial expressions. However, the expression of emotional states through facial expressions is fundamentally a voluntary control process, and since humans have not yet learned to use this channel when interacting with robotic technologies, there is an urgent need to exploit channels of emotional information that humans cannot directly control. Researchers have proposed that emotion computation based on thermal infrared imaging may address this issue. This validated technology facilitates non-invasive monitoring of physiological parameters and can infer emotional states from them [8]. Moreover, Fathi et al. proposed a clinical decision support system for diagnosing social anxiety disorder, which is particularly suitable for SAD diagnosis [9].
Many algorithms and advanced technologies have also been applied to the treatment of social anxiety disorder, showing diverse trends. These include virtual reality therapy, cognitive behavioral therapy, and online therapy, among others. For example, virtual reality therapy utilizes virtual social environments created using virtual reality technology to gradually expose patients to social situations, thereby alleviating symptoms of social anxiety disorder [10]. In a study on cognitive behavioral therapy (CBT) and machine learning, researchers analyzed patient data from internet-based CBT (ICBT) using machine learning algorithms such as Support Vector Machine (SVM) and Random Forest to predict treatment response and outcomes [11]. Lin et al. studied the effects of cognitive behavioral group therapy (CBGT) on social anxiety patients’ emotion regulation self-efficacy and found that CBGT can improve social anxiety symptoms and enhance patients’ emotion regulation self-efficacy, making it an effective method for treating social anxiety [12]. Additionally, virtual reality technology, as an emerging comprehensive artificial intelligence technology, possesses important features such as multi-sensory perception, presence, interactivity, and autonomy, which can effectively address potential issues in exposure to real-life situations during cognitive behavioral therapy. Therefore, researchers have studied virtual reality exposure therapy (VRET) and found it to be an acceptable treatment for social anxiety disorder patients, with significant and lasting therapeutic effects. However, in long-term follow-ups, the efficacy of VRET may decrease compared to in vivo exposure [13].
In recent years, stacking ensemble learning models in machine learning have been applied to study student populations, providing insights for finding the optimal algorithm for predicting social anxiety disorder. For example, Yang et al. first applied the Jenks Natural Breaks algorithm for feature classification and then used the Apriori algorithm to analyze feature associations based on the classification results to discover behavior features that are correlated with students’ mental health status. They ultimately constructed a Particle Difference Neural Network (PDNN) model for predicting students’ mental health status. The proposed model outperformed traditional machine learning and deep learning models, converging quickly, and more accurately predicting students’ mental health status [14]. Similarly, Suri proposed a stacking fusion model based on Random Forest, logistic regression, and Adaboost, and designed and implemented a psychological crisis early warning system based on this model [15]. Additionally, Zhang et al. constructed a stacking ensemble learning model using multiple algorithms to predict student performance in blended learning. The model consists of polynomial Naive Bayes, AdaBoost, and Gradient Boosting as primary learners and logistic regression as the secondary learner, forming a two-layer fusion framework [16].
In this article, we will apply stacked machine learning models to the prediction of social phobia in student groups, and their advantages are very obvious. Firstly, they improve prediction accuracy: stacked ensemble learning models can combine multiple different prediction models (such as decision trees, support vector machines, etc.) to produce a stronger and more complex prediction model. In this way, we can take advantage of the advantages of each single model while avoiding its disadvantages, so as to improve the accuracy of social fear prediction of student groups. Secondly, the robustness is improved: stackable machine learning models can reduce the sensitivity of a single model to data noise or outliers. If there are some outliers or noises in the training data, these outliers or noises may have a negative impact on the training of a single model. However, in stack-integrated learning, each single model will produce a prediction result, which will be further integrated in the top-level model, thus reducing the impact of individual model outliers or noise. And using our model does not require too much data, so it can be applied in schools.
However, we still have some limitations that need to be further addressed, such as the limitations of data sources and samples and the lack of consideration of multidimensional factors, which will be the direction of our further research.

3. Materials and Methods

3.1. Data Collection and Processing

This study focused on undergraduate students and collected information through an online questionnaire survey. The Social Anxiety Assessment Scale in the Social Media Environment in the Chinese Cultural Context, proposed by Guizh Jia et al., was used as the measurement tool [17]. Jinjian Zhang et al. discussed the bidirectional relationship between social anxiety and internet addiction among college students [18], while Yaffe Yosi explored the link between parental indifference or excessive care and social anxiety [19]. The questionnaire included the test questions presented in Table 1:
We asked each participant to rate their behavior based on the questions we raised, with each question (except for question 8) having four scores representing four levels. The higher the score, the higher the level. Question 8 only has two options, yes or no, with a score of 1 for yes and 0 for no. The correspondence between degree and score is shown in Table 2 below.
Finally, we also asked participants to rate whether they had social anxiety disorder. The rating scale ranged from 0 (not having it) to 3 (definitely having it), with 0 and 1 indicating no social anxiety disorder, and 2 and 3 indicating the presence of social anxiety disorder. To encourage more students to participate in the survey, we offered small prizes to participants. After surveying for one month, we collected a total of 2231 data samples. However, to ensure the rigor of the experiment, we removed some missing data that could potentially interfere with the validity of the study. In the end, we obtained 2134 data samples.

3.2. Detection Method

For machine learning detection methods, we considered accuracy, precision, recall, AUC, and F1 score. Considering the uneven distribution of the data and the need to correctly predict all classification results, we ultimately chose F1 score, AUC, and accuracy as the criteria with which to evaluate the model’s accuracy. Furthermore, to assess the stability and generalizability of the model, we employed 10-fold cross-validation.
precision = TP/(TP + FP)
TP is the probability that the sample is positive and the result is positive. FP is the probability that the sample is positive and the result is negative.
recall = TP/(TP + FN)
TP is the probability that the sample is positive and the result is positive. FN is the probability that the sample is negative and the result is negative.
F1 = 2 × (precision × recall)/(precision + recall)
The precision is the accuracy rate, and recall is the recall rate.

3.3. Classification Algorithm

The machine learning classification algorithm uses Python as the programming language and is applied using the Python 3.10 version. The datasets are divided into a 4:1 ratio, representing the training set and the test set.
Naresh Kumar et al. compares the classification effects of Decision Tree algorithm, K-NNN algorithm, Naive Bayes algorithm, Random Forest Tree algorithm and Support Vector Machine algorithm [20]. Adrienne, G. et al. used support vector machine-radial basis function (SVMRBF), Random Forest (RF) and logistic regression (LR) algorithms for classification [21]. Yoonyoung used three algorithms, logistic regression, Random Forest and extreme gradient boosting for classification [22]. And since we only have more than 2000 pieces of data, we can’t use some algorithms of deep learning to train, and when we use machine learning algorithms, we don’t need too much data to obtain good results, so this paper intends to use logistic regression algorithm, Random Forest algorithm, k-Nearest Neighbor algorithm, Support Vector Machine algorithm and Naive Bayes algorithm for prediction.

3.3.1. Logistic Regression Algorithm

The logistic regression algorithm is a common classification algorithm, which can be used to solve binary or multi-classification problems. The logistic regression algorithm is a linear regression based on the addition of a Sigmoid function (nonlinear) mapping. The principle of the logistic regression algorithm is to map the output of linear regression to the probability space through the logarithmic probability function, thus achieving classification. Logistic regression solves the classification problem and outputs discrete values. The advantages of the logistic regression algorithm are simple, parallel, and interpretable, but the disadvantages are that it is easy to be affected by noise and outliers, and it cannot deal with nonlinear relations well.

3.3.2. Random Forest

The Random Forest algorithm is an integrated learning method based on the decision tree, belonging to the Bagging type. By combining multiple weak classifiers, the final result can be voted on or taken to an average, which makes the result of the overall model have high accuracy and generalization performance. The algorithm uses the self-help resampling technique to randomly sample from the training set to provide different datasets for each tree and improve the stability and accuracy of the model. At the same time, only some random features were selected for each node to split, enhancing the diversity and anti-overfitting ability of the model. In this algorithm, model errors and feature importance can be evaluated with out-of-pocket data without pruning, and validation sets or cross-validation steps are omitted.

3.3.3. K-Nearest Neighbor Algorithm

The K-Nearest Neighbor algorithm is an instance-based learning method. It calculates the distance between the input instance and each instance in the training set, and it then selects the nearest k instances and determines the category or output value of the input instances according to their category or output value. It is a lazy learning method. There is no explicit training process, and new samples are processed directly after receiving them. The K-Nearest Neighbor algorithm is a non-parametric method that does not need to assume data distribution or determine model parameters. The K-Nearest Neighbor algorithm is suitable for classification and regression problems.

3.3.4. Support Vector Machine Algorithm

The Support Vector Machine algorithm is a binary classification algorithm. Its basic model is to find a linear hyperplane with the largest interval in the feature space to divide different categories of data. The algorithm is a supervised learning method that requires labeled training data and can be used for classification and regression problems. It is a kind of generalized linear classifier, which can map linearly indivisible data to high dimensional space by kernel technique, to realize nonlinear classification.

3.3.5. Naive Bayes Algorithm

The Naive Bayes algorithm is a classification method based on the Bayes theorem and the independent assumption of characteristic conditions. It is a generative model that calculates a posteriori probability distribution by learning the joint probability distribution of training data and selects the category with the greatest posterior probability as the prediction result. It is a naive method. When assuming a given class, each feature is independent of each other, which greatly simplifies the computational complexity. The Naive Bayes algorithm is suitable for binary classification problems and multi-classification problems. The Naive Bayes algorithm can deal with discrete or continuous features. For continuous features, conditional probability can be estimated by using the probability density function. The comparison of various algorithms is shown in Table 3.

3.3.6. Stacking Algorithm

After comparing the stacking of various algorithms, we found that when the first layer is LR, NB and KNN, and the second layer is NB, the algorithm has the best effect. Moreover, we believe that since only a single algorithm is prone to overfitting and other problems, the advantages and disadvantages of each algorithm can be balanced by the stacking model. In addition, since the principles of LR, NB and KNN algorithms are different, the results obtained are less relevant, while NB algorithm is more effective in dealing with algorithms with low correlation, so the second layer uses NB algorithm for processing better. The flow chart of the algorithm is shown in Figure 1.

4. Results and Discussion

To obtain the best parameters faster, this study first uses a random search to find a rough range of parameters and uses an ergodic method to carry out a fine search. After parameter adjustment, the author uses the K-fold cross-validation method to compare the AUC and F1 of each algorithm.

4.1. Logistic Regression Algorithm

In the logistic regression algorithm, this study is based on penalty, solver, and C attributes. In this study, the penalty attribute is ‘l1’ and ‘l2’; the attribute of the solver is ‘liblinear’, ‘newton-cg’, ‘lbs’, ‘sag’, and ‘saga’; and the attribute C ranges from 0 to 100. Due to the random matching of the random search algorithm, to reduce the occurrence of accidental events, the n_iter attribute is set to 100, and 10 groups of experiments are conducted in this study, as shown in Table 3.
As can be seen from Table 3, for attribute C, we can see that C is between 0 and 10, so we conduct a traversal search with an interval of 0.01 between 0 and 10. For the penalty attribute and solver attribute, there are three sets of matching situations, namely ‘L2’ and ‘sag’, ‘L2’ and ‘liblinear’, and ‘L2’ and ‘newton-ton’. Therefore, three sets of experiments are designed in this study, and the experimental results are shown in Figure 2, Figure 3 and Figure 4.
According to the comparison of Figure 2, Figure 3 and Figure 4, it is not difficult to see that the images of Figure 3 and Figure 4 are the same. When attribute C is 0.22, the maximum value is taken, and both are greater than the maximum value of F1 in Figure 1. Therefore, we will take the penalty attribute value as L2. The value of the solver attribute is sag, and the value of the C attribute is 0.22.

4.2. Random Forest Arithmetic

In the Random Forest algorithm, the n_estimators and max_depth attributes are adjusted. In this study, the parameters are first adjusted via random search, where the values of n_estimators range from 1 to 300, and the max_depth attribute ranges from 1 to 8. Due to the randomness of the results of the random search, the authors conducted 10 experiments for the accuracy of the experiment, as shown in Table 4.
As can be seen from Table 4, the probability of max_depth being 7 is 70%, so we believe that 7 is the best max_depth attribute. Therefore, only the n_estimators are searched using traversal in this study. According to Table 4, we can also see that all n_estimators are in the range of 100 to 300, so we set the value range of n_estimators to be between 100 and 300 for a traversal search. The results are shown in Figure 5.
According to Figure 5, we can see that F1 has the largest value when the n_estimators attribute is 122. Therefore, in this experiment, we set the value of n_estimators as 122, and according to Table 4, the value of max_depth is 7.

4.3. K-Nearest Neighbor Algorithm

In the K-Nearest Neighbor algorithm, the parameter of n_neighbors and the algorithm are adjusted. In this study, parameter tuning is performed in a random search mode. The range of n_neighbors is from 1 to 300, and the value of the algorithm is ball_tree, kd_tree, and brute. Due to the randomness of the results of the random search, we conducted 10 experiments for the accuracy of the experiment. The results are shown in Table 5.
Table 5 shows that n_neighbors is between 1 and 50, and 80% of the algorithm is brute. Therefore, we set the algorithm to brute and iterate n_neighbors between 1 and 50. The results are shown in Figure 6.
According to Figure 6, when the n_neighbors attribute is 21, F1 reaches the maximum value. Therefore, in this experiment, we set the n_neighbors attribute to 21 and the algorithm attribute to brute according to Table 5.

4.4. Support Vector Machine Algorithm

In the Support Vector Machine algorithm, we adjust the C attribute and kernel attribute of the Support Vector Machine. Firstly, the parameter is adjusted via random search. The value of attribute C ranges from 1 to 100, and the value of the attribute kernel is linear, poly, rbf, and sigmoid. This study conducted 10 experiments using a random search, and the results are shown in Table 6.
According to Table 6, linear is the appropriate kernel attribute. As the value of attribute C cannot be judged according to Table 6, this study uses the method of traversal to add the value from 1 to 300 to calculate the value of F1, respectively, as shown in Figure 7.
As can be seen from Figure 7, as the value of attribute C increases, F1 first increases and then remains unchanged. Therefore, we take the value of attribute C, which first makes F1 no longer change, as 1.7. In addition, we can see from Table 6 that it is best when the kernel attribute is linear.

4.5. Naive Bayes Algorithm

Using the Naive Bayes algorithm, this study adjusts the prior attribute. To make the results more accurate, this study starts from 0 for the precedent condition that is not social phobia and gradually adds 0.0002 each time to 1 to calculate the value of F1 respectively, as shown in Figure 8.
From Figure 8, we can conclude that F1 has the largest value when the precedent condition attribute for non-social phobia is 0.4552. Therefore, in this experiment, we set the attribute value of the precedent condition, which is not social phobia, to 0.4552.

4.6. K-Fold Cross-Verification Method

To make a more obvious comparison between our proposed method and other algorithms, the K-fold cross-validation method was used in this study to conduct 10 experiments, and the ROC and F1 values obtained each time were recorded, respectively. Table 7 is the comparison of the F1 values of each algorithm, Table 8 is the comparison of the AUC values of each algorithm, and the results are as follows:
According to Table 7, we can see that the maximum F1 value of our proposed stacking algorithm, 0.8257, is greater than the maximum F1 value of other algorithms, and only three F1 values are less than 0.8, while the maximum three F1 values of other algorithms are greater than 0.8. Although the F1 values of a stacking algorithm are not completely exceeded by other algorithms such as the NB algorithm from the perspective of individual data, the effect of the stacking algorithm on that data is not very good probably because of the randomness of the data. On the whole, the effect of our stacking algorithm is higher than that of other algorithms under the index of F1. The overall results in Table 8 are similar to those in Table 7, so they are not repeat in this article.
To compare various algorithms more comprehensively, we calculated the average value of the F1 results of each algorithm after 10 cross-validations, as shown in Figure 9. It can be seen from Figure 9 that the average value of F1 in the stacking algorithm is higher than that in other algorithms.
Figure 10 shows us the average value of AUC results after 10 cross-validations of each algorithm. According to Figure 10, it can be concluded that the ROC curve of the stacking algorithm is significantly higher than that of other algorithms. This also indicates that the effect of our proposed stacking algorithm is better than other stacking algorithms.

5. Conclusions

At present, the research on social phobia mainly focuses on how to treat social phobia, and there are few studies on how to predict social phobia. Therefore, this paper uses the stacked model of machine learning to predict social phobia and compares it with some other machine learning methods. The results show that our proposed stacking model outperforms some other machine learning algorithms. However, the final results obtained in this paper are not very good. As far as the authors know, it may be due to the fact that the questions we raised cannot fully reflect social phobia; therefore, this is a limitation of this study. At the same time, we also hope that more researchers can go in this direction and propose more comprehensive questions to solve the diagnosis problem of social phobia.

Author Contributions

Conceptualization, C.L.; Methodology, C.L.; Validation, Z.C.; Investigation, B.X.; Resources, B.X.; Data curation, Z.C.; Writing—original draft, C.L.; Writing—review & editing, B.X., J.H. and X.X.; Supervision, X.H. and X.X.; Project administration, X.X. All authors have read and agreed to the published version of the manuscript.

Funding

This research received no external funding.

Institutional Review Board Statement

Not applicable.

Informed Consent Statement

Not applicable.

Data Availability Statement

The data presented in this study are available on request from the corresponding author. The data are not publicly available due to privacy.

Conflicts of Interest

The authors declare no conflict of interest.

References

  1. Social Phobia Review (one of)_Diagnosis (Sohu.com). Available online: https://www.sohu.com/a/441419648_651264 (accessed on 10 August 2023).
  2. Al-Ezzi, A.; Kamel, N.; Faye, I.; Gunaseli, E. Review of EEG, ERP, and brain connectivity estimators as predictive biomarkers of social anxiety disorder. Front. Psychol. 2020, 11, 730. [Google Scholar] [CrossRef] [PubMed]
  3. Boukhechba, M.; Chow, P.; Fua, K.; Teachman, B.; Barnes, L. Predicting Social Anxiety from Global Positioning System Traces of College Students: Feasibility Study. JMIR Ment. Health 2018, 5, e10101. [Google Scholar] [CrossRef] [PubMed]
  4. Gong, J.; Huang, Y.; Chow, P.I.; Fua, K.; Gerber, M.S.; Teachman, B.A.; Barnes, L.E. Understanding behavioral dynamics of social anxiety among college students through smartphone sensors. Inf. Fusion 2019, 49, 57–68. [Google Scholar] [CrossRef]
  5. Lin, Z.; Lin, H.; Lin, X.; Yang, T.; Wang, C.; Du, S.; Yang, C. Analysis of the correlation between social anxiety, fear negative evaluation, and facial expression recognition in patients with social phobia. Chin. J. Gen. Med. 2016, 14, 625–628. [Google Scholar]
  6. Wiederhold, B.K.; Miller, I.T.; Wiederhold, M.D. Using Virtual Reality to Mobilize Health Care Mobile Virtual Reality Technology for Attenuation of Anxiety and Pain. IEEE Consum. Electron. Mag. 2018, 7, 106–109. [Google Scholar] [CrossRef]
  7. Rusli, N.; Sidek, S.N.; Yusof, H.M.; Ishak, N.I.; Khalid, M.; Dzulkarnain, A.A.A. Implementation of Wavelet Analysis on Thermal Images for Affective States Recognition of Children with Autism Spectrum Disorder. IEEE Access 2020, 8, 120818–120834. [Google Scholar] [CrossRef]
  8. Filippini, C.; Perpetuini, D.; Cardone, D.; Chiarelli, A.M.; Merla, A. Thermal Infrared Imaging-Based Affective Computing and Its Application to Facilitate Human Robot Interaction: A Review. Appl. Sci. 2020, 10, 2924. [Google Scholar] [CrossRef]
  9. Sinaetal, F. Development and use of a clinical decision support system for the diagnosis of social anxiety disorder. Comput. Methods Programs Biomed. 2020, 190, 105354. [Google Scholar]
  10. Maples-Keller, J.L.; Bunnell, B.E.; Kim, S.J.; Rothbaum, B.O. The use of virtual reality technology in the treatment of anxiety and other psychiatric disorders. Harv. Rev. Psychiatry 2017, 25, 103–113. [Google Scholar] [CrossRef] [PubMed]
  11. Lenhard, F.; Sauer, S.; Andersson, E.; Månsson, K.N.; Mataix-Cols, D.; Rück, C.; Serlachius, E. Prediction of outcome in internet-delivered cognitive behaviour therapy for paediatric obsessive-compulsive disorder: A machine learning approach. Int. J. Methods Psychiatr. Res. 2018, 27, e1576. [Google Scholar] [CrossRef] [PubMed]
  12. Lin, Z.; Wang, C.; Lin, H.; Yang, C. The effect of cognitive behavioral group therapy on emotional regulation self-efficacy in patients with social anxiety disorder. Zhejiang Med. J. 2019, 41, 2546–2548. [Google Scholar]
  13. Horigome, T.; Kurokawa, S.; Sawada, K.; Kudo, S.; Shiga, K.; Mimura, M.; Kishimoto, T. Virtual reality exposure therapy for social anxiety disorder: A systematic review and meta-analysis. Psychol. Med. 2020, 50, 2487–2497. [Google Scholar] [CrossRef] [PubMed]
  14. Yang, H.; Yu, Z.; Di, X.; Liang, Z.; Zhang, X. Prediction of College Students’ Mental Health Status Based on Students’ Behavior Data. J. Jilin Univ. (Inf. Sci. Ed.) 2022, 40, 819–828. [Google Scholar]
  15. Su, L. Research and Application of College Students’ Psychological Crisis Early Warning System Based on Stacking Fusion Model. Master’s Thesis, Yunnan Normal University, Kunming, China, 2022. [Google Scholar] [CrossRef]
  16. Zhang, L.; Chen, Y.; Yuan, J.; Pei, Z.; Mei, P. Application of integrated learning model in the prediction of mixed grade classification. Appl. Comput. Syst. 2022, 31, 325–332. [Google Scholar]
  17. Jia, G.; Dai, H.; Chu, Y.; Wang, X.; Hao, Y.; Wang, S. Psychometric evaluation of the Chinese version of the social anxiety scale for social media users and cross-sectional investigation into this disorder among college students. Compr. Psychiatry 2022, 116, 152328. [Google Scholar] [CrossRef] [PubMed]
  18. Jaiswal, A.; Manchanda, S.; Gautam, V.; Goel, A.D.; Aneja, J.; Raghav, P.R. Burden of internet addiction, social anxiety and social phobia among University students, India. J. Fam. Med. Prim. Care 2020, 9, 3607. [Google Scholar]
  19. Yaffe, Y. Students’ recollections of parenting styles and impostor phenomenon: The mediating role of social anxiety. Personal. Individ. Differ. 2021, 172, 110598. [Google Scholar] [CrossRef]
  20. Naresh Kumar, T.; Raj Gaurang, T.; Deden, W.; Vinay, G.; Alok, M.; Ryan Adhitya, N. Machine Learning Based Evaluations of Stress, Depression, and Anxiety. In Proceedings of the 2022 International Conference Advancement in Data Science, E-Learning and Information Systems (ICADEIS), Istanbul, Turkey, 23–24 November 2022; pp. 1–5. [Google Scholar]
  21. Adrienne, G.; William, S.; Prabha, S.; Anurag, P.; Beatrix, K.; Katherine, N.; Helen, L. Machine Learning Prediction of Treatment Outcome in Late-Life Depression. Front. Psychiatry 2021, 12, 738494. [Google Scholar]
  22. Park, Y.; Hu, J.; Singh, M.; Sylla, I.; Dankwa-Mullan, I.; Koski, E.; Das, A.K. Comparison of Methods to Reduce Bias from Clinical Prediction Models of Postpartum Depression. JAMA Netw. Open 2021, 4, e213909. [Google Scholar] [CrossRef] [PubMed]
Figure 1. Stacking algorithm flow chart.
Applsci 14 00433 g001
Figure 2. C of the F1 curve when the penalty attribute is L2 and the solver attribute is liblinear.
Applsci 14 00433 g002
Figure 3. C of the F1 curve when the penalty attribute is L2 and the solver attribute is sag.
Applsci 14 00433 g003
Figure 4. C of the F1 curve when the penalty attribute is L2 and the solver attribute is newton-ton.
Applsci 14 00433 g004
Figure 5. n_estimators of F1 curve.
Applsci 14 00433 g005
Figure 6. n_neighbors of F1 curve.
Applsci 14 00433 g006
Figure 7. F1 curve of C attribute.
Applsci 14 00433 g007
Figure 8. F1 curve of precedent conditions.
Applsci 14 00433 g008
Figure 9. F1 of each algorithm.
Applsci 14 00433 g009
Figure 10. ROC curve of each algorithm.
Applsci 14 00433 g010
Table 1. Social phobia test questions for college students.
Serial NumberQuestion
1I was worried that people would find my behavior embarrassing.
2I’m worried that people won’t like what I’m sharing.
3I feel nervous when I have to talk to people about myself.
4I’m afraid I’ll leave a negative impression.
5I am prone to or have become addicted to the Internet.
6My parents don’t care about me, or they care about me very much
7My childhood was not happy.
8Whether they are only children or not
Table 2. Question rating table.
MarkDegree
0seldom
1sometimes
2often
3usually
Table 3. Penalty, solver, and C attribute search results table.
PenaltySolverC
L2sag2
L2sag1
L2liblinear6
L2liblinear2
L2sag3
L2newton-ton3
L2newton-ton1
L2sag1
L2liblinear2
L2liblinear6
Table 4. n_estimators and max_depth attribute search results table.
n_estimatorsmax_depth
1227
2617
2627
1637
1027
1456
1806
2756
2117
1377
Table 5. Attribute search results for n_neighbors and algorithm.
FrequencyN_neighborsAlgorithm
119brute
29brute
335brute
411brute
529kd_tree
631brute
721brute
817brute
927brute
1029kd_tree
Table 6. Attribute search result table of C and kernel.
FrequencyCKernel
0.785599.15linear
0.785162.36linear
0.785115.15linear
0.785552.68linear
0.785140.62linear
0.785530.88linear
0.785192.47linear
0.78520.81linear
0.785527.60linear
0.785594.43linear
Table 7. F1 value results obtained via each algorithm after 10 cross-validations of the test set.
12345678910
LR0.77050.78310.77200.77750.77060.75390.81900.80240.77550.7765
RF0.74780.77810.74430.81560.75290.76250.73560.75630.74930.7377
KNN0.76620.79110.76090.76610.74720.74640.76510.76190.71730.7817
SVM0.80230.73720.76510.78410.77510.76660.80330.79100.75370.8254
NB0.80410.75070.79480.81380.76000.79420.76610.82170.78060.7560
Stacking0.81820.81710.79040.78950.82570.81590.81380.80750.80630.7929
Table 8. AUC values obtained via each algorithm after 10 cross-validations based on the test set.
12345678910
LR0.80170.82190.81120.80100.81450.80320.84670.83520.81060.8131
RF0.79920.81090.78540.84240.79200.80090.77460.78870.78320.7701
KNN0.79750.81660.78920.80290.78040.78150.80920.79480.76660.8050
SVM0.82970.78250.81170.81630.80080.80490.82710.82010.78280.8427
NB0.83130.79690.82940.84380.78740.80930.81740.81830.81230.7914
Stacking0.84730.84710.83190.81350.85180.83030.85020.82770.82680.8343
Disclaimer/Publisher’s Note: The statements, opinions and data contained in all publications are solely those of the individual author(s) and contributor(s) and not of MDPI and/or the editor(s). MDPI and/or the editor(s) disclaim responsibility for any injury to people or property resulting from any ideas, methods, instructions or products referred to in the content.

