
Dynamic Evaluation of Sealing and Site Optimization for Underground Gas Storage in Depleted Gas Reserve: A Case Study

Abstract
:1. Introduction
2. Study Area and Geological Features
2.1. Geologic and Tectonic Characteristics of Depleted Gas Reservoirs
2.2. Reservoir Characterization of Depleted Gas Reservoirs
3. Materials and Methods
3.1. Static Triaxial Rock Mechanical Parameter Test
- (1)
- Preparation of rock core: For the Yingcheng formation and Denglouku formation, full-diameter rock core samples are extracted from 12 core wells according to different formations. Based on the rock core preparation device, each rock core sample is processed into three small cores with dimensions of 2.5 × 5.0 cm. The two ends of the small rock core are ground flat using a grinding machine.
- (2)
- Installation of rock core: The processed small rock core samples are placed into the cavity of the triaxial mechanical testing instrument. Rubber rings are used to seal the boundary of the hydraulic module to prevent the fluid used for applying stress from permeating into the small rock core, thus affecting the accuracy of the triaxial rock mechanics test data. During the installation of the pressure plate and related components of the press, it is considered that although the ground flat surfaces of the small rock core have high-precision smoothness, there are still some micro-scale unevenness on the pressure plate surface in contact with the small rock core. Therefore, rubber pads are added to the contact surface between the pressure plate and the small rock core to balance the test error caused by the unevenness due to the inclined contact surface of the small rock core.
- (3)
- Confining pressure loading: After the installation of the rock core, three small rock core samples are subjected to three-directional confining pressures of 20 MPa, 30 MPa, and 40 MPa, respectively. The initial confining pressure is set to a low value with a pre-set loading rate of 0.05 MPa/s. Then, the pore pressure in the rock is increased by 10 MPa at a rate of 0.2 MPa/s and kept constant. Subsequently, the confining pressure is further increased until the effective confining pressure reaches the set value. The triaxial mechanical testing instrument automatically records the shear stress, normal stress, and strain of the rock on the loaded surface area in the tangential and normal directions. The stress state that leads the rock to reach the shear limit is also recorded. Finally, the static shear strength, static elastic modulus, and static Poisson’s ratio are calculated using formulas.
3.2. Dynamic Acoustic Rock Mechanical Parameter Test
- (1)
- The preparation method of the rock core is consistent with static triaxial rock mechanical experiments.
- (2)
- Installation of rock core: Place the small rock core samples, which have been processed to the qualified size, into the rock ultrasonic parameter tester. When measuring the longitudinal wave velocity, vaseline is used as the coupling agent between the small rock core and the transducer, while when measuring the transverse wave velocity, the coupling agent between the small rock core and the transducer should be replaced with aluminum foil solid material to avoid errors caused by the rapid release of strain energy and the formation of stress waves. Apply a pressure of 0.05 MPa to fix the small rock core sample between the transducer and receiver.
- (3)
- Sonic wave testing: After the installation of the small rock core is completed, the sonic wave generator and oscilloscope are turned on. Considering the comparability of the results between static triaxial rock mechanics tests and dynamic sonic wave rock mechanics tests, the testing conditions for the small rock core sample are set to be consistent with the static triaxial rock mechanical test. The emission frequency of the transducer can be determined as:
3.3. Numerical Simulation Calculations
4. Results and Discussion
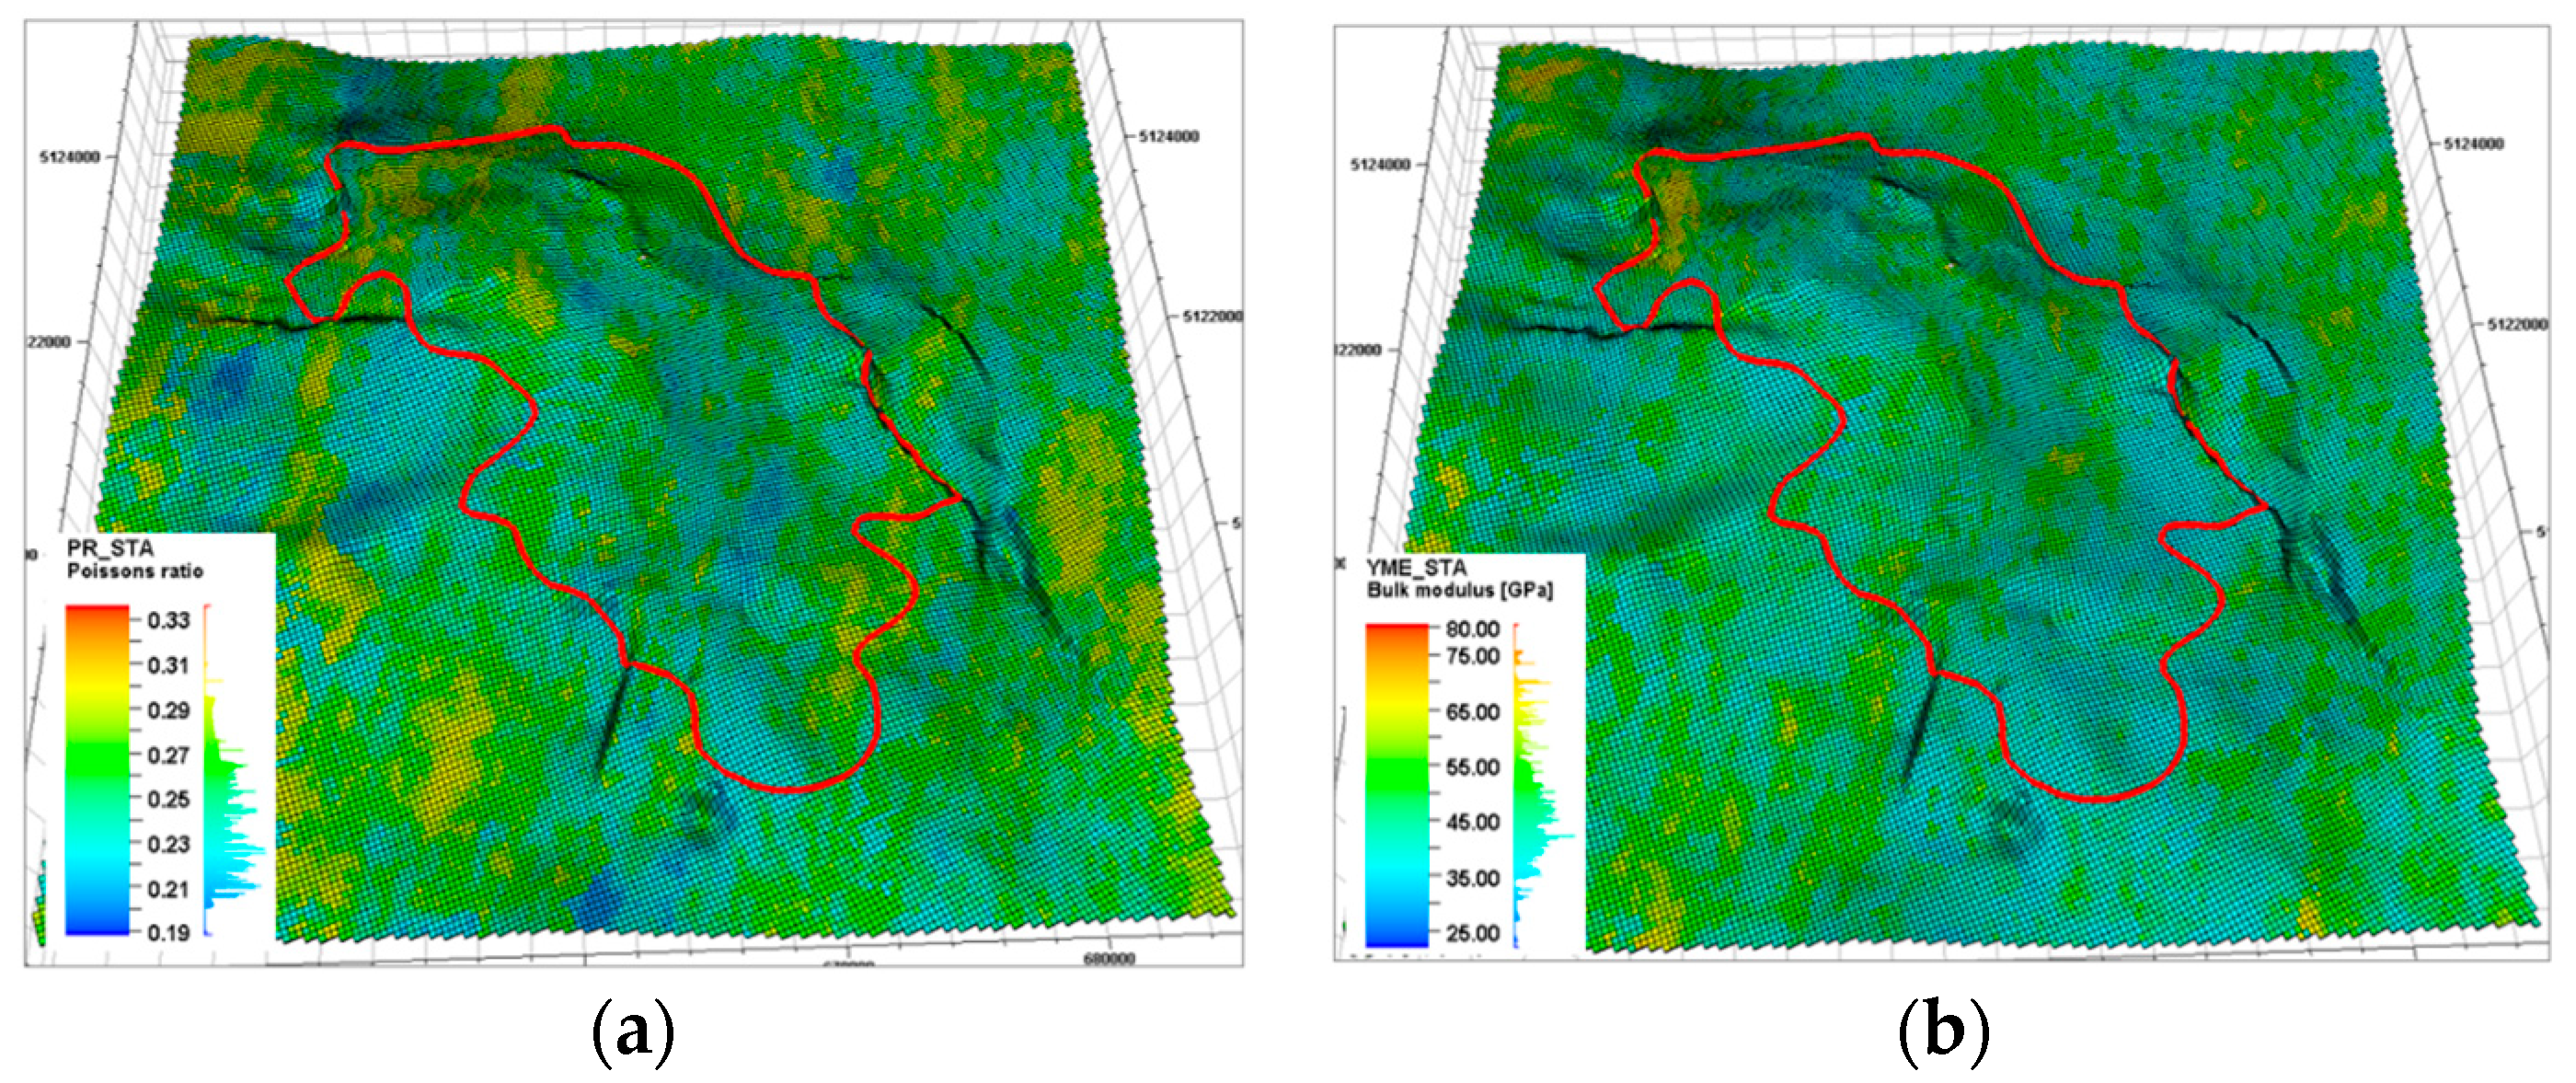
4.1. Analysis of Rock Mechanical Properties at Well Points
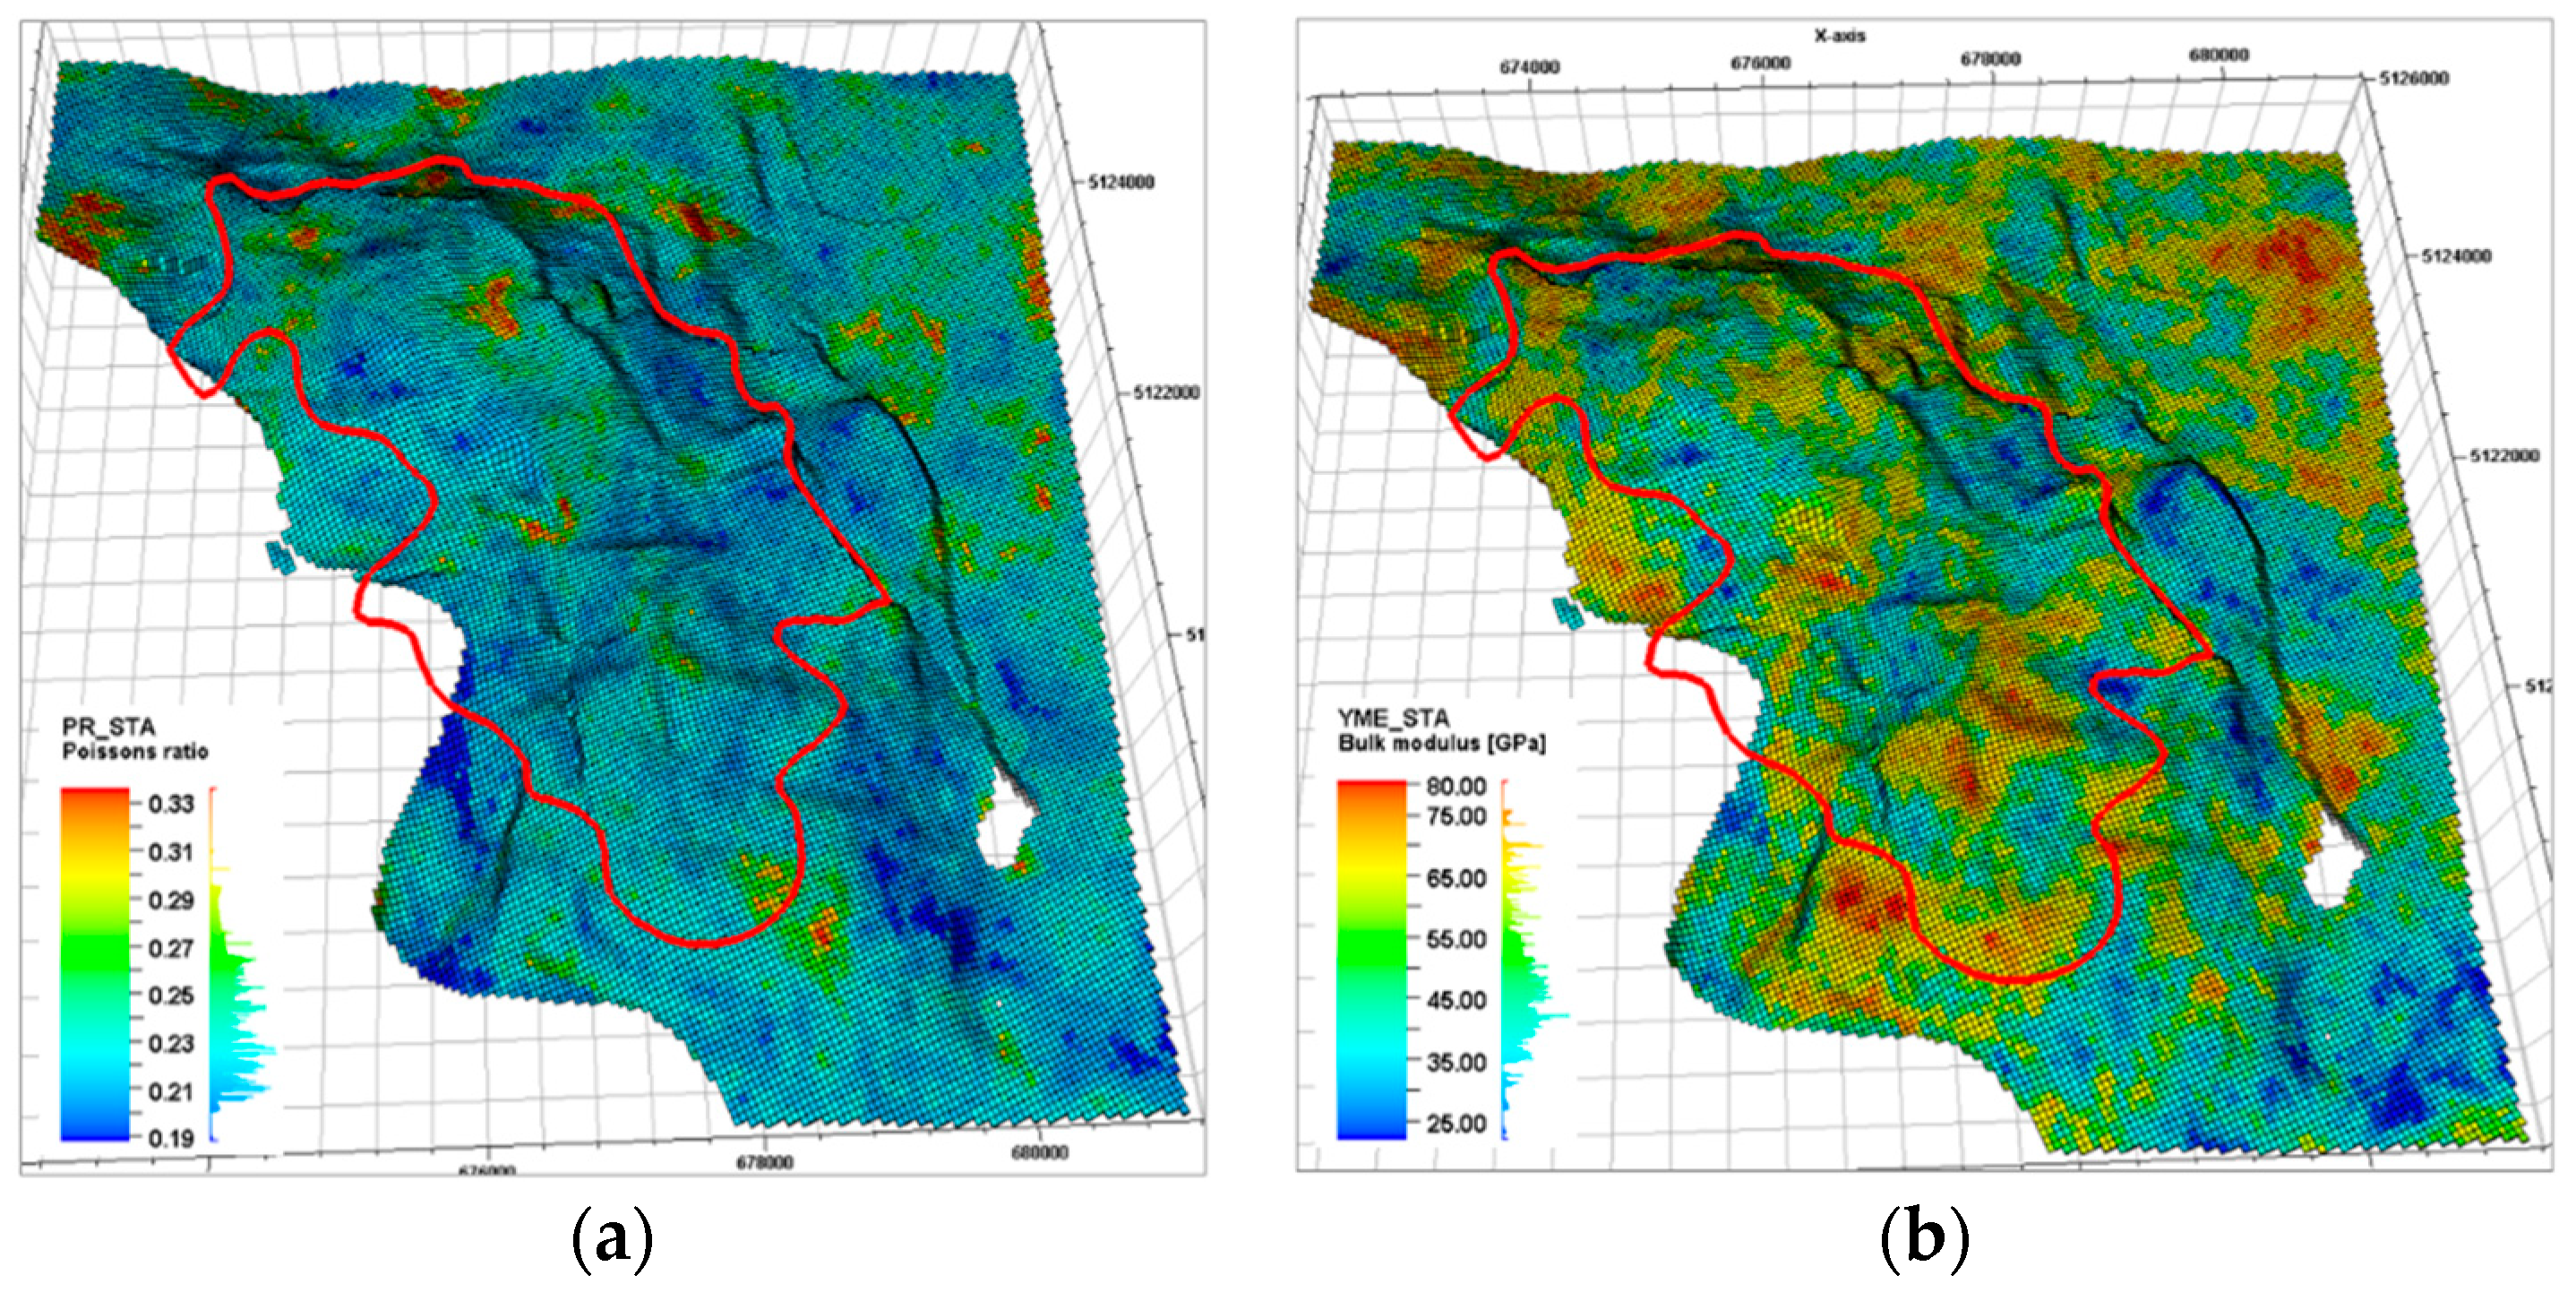
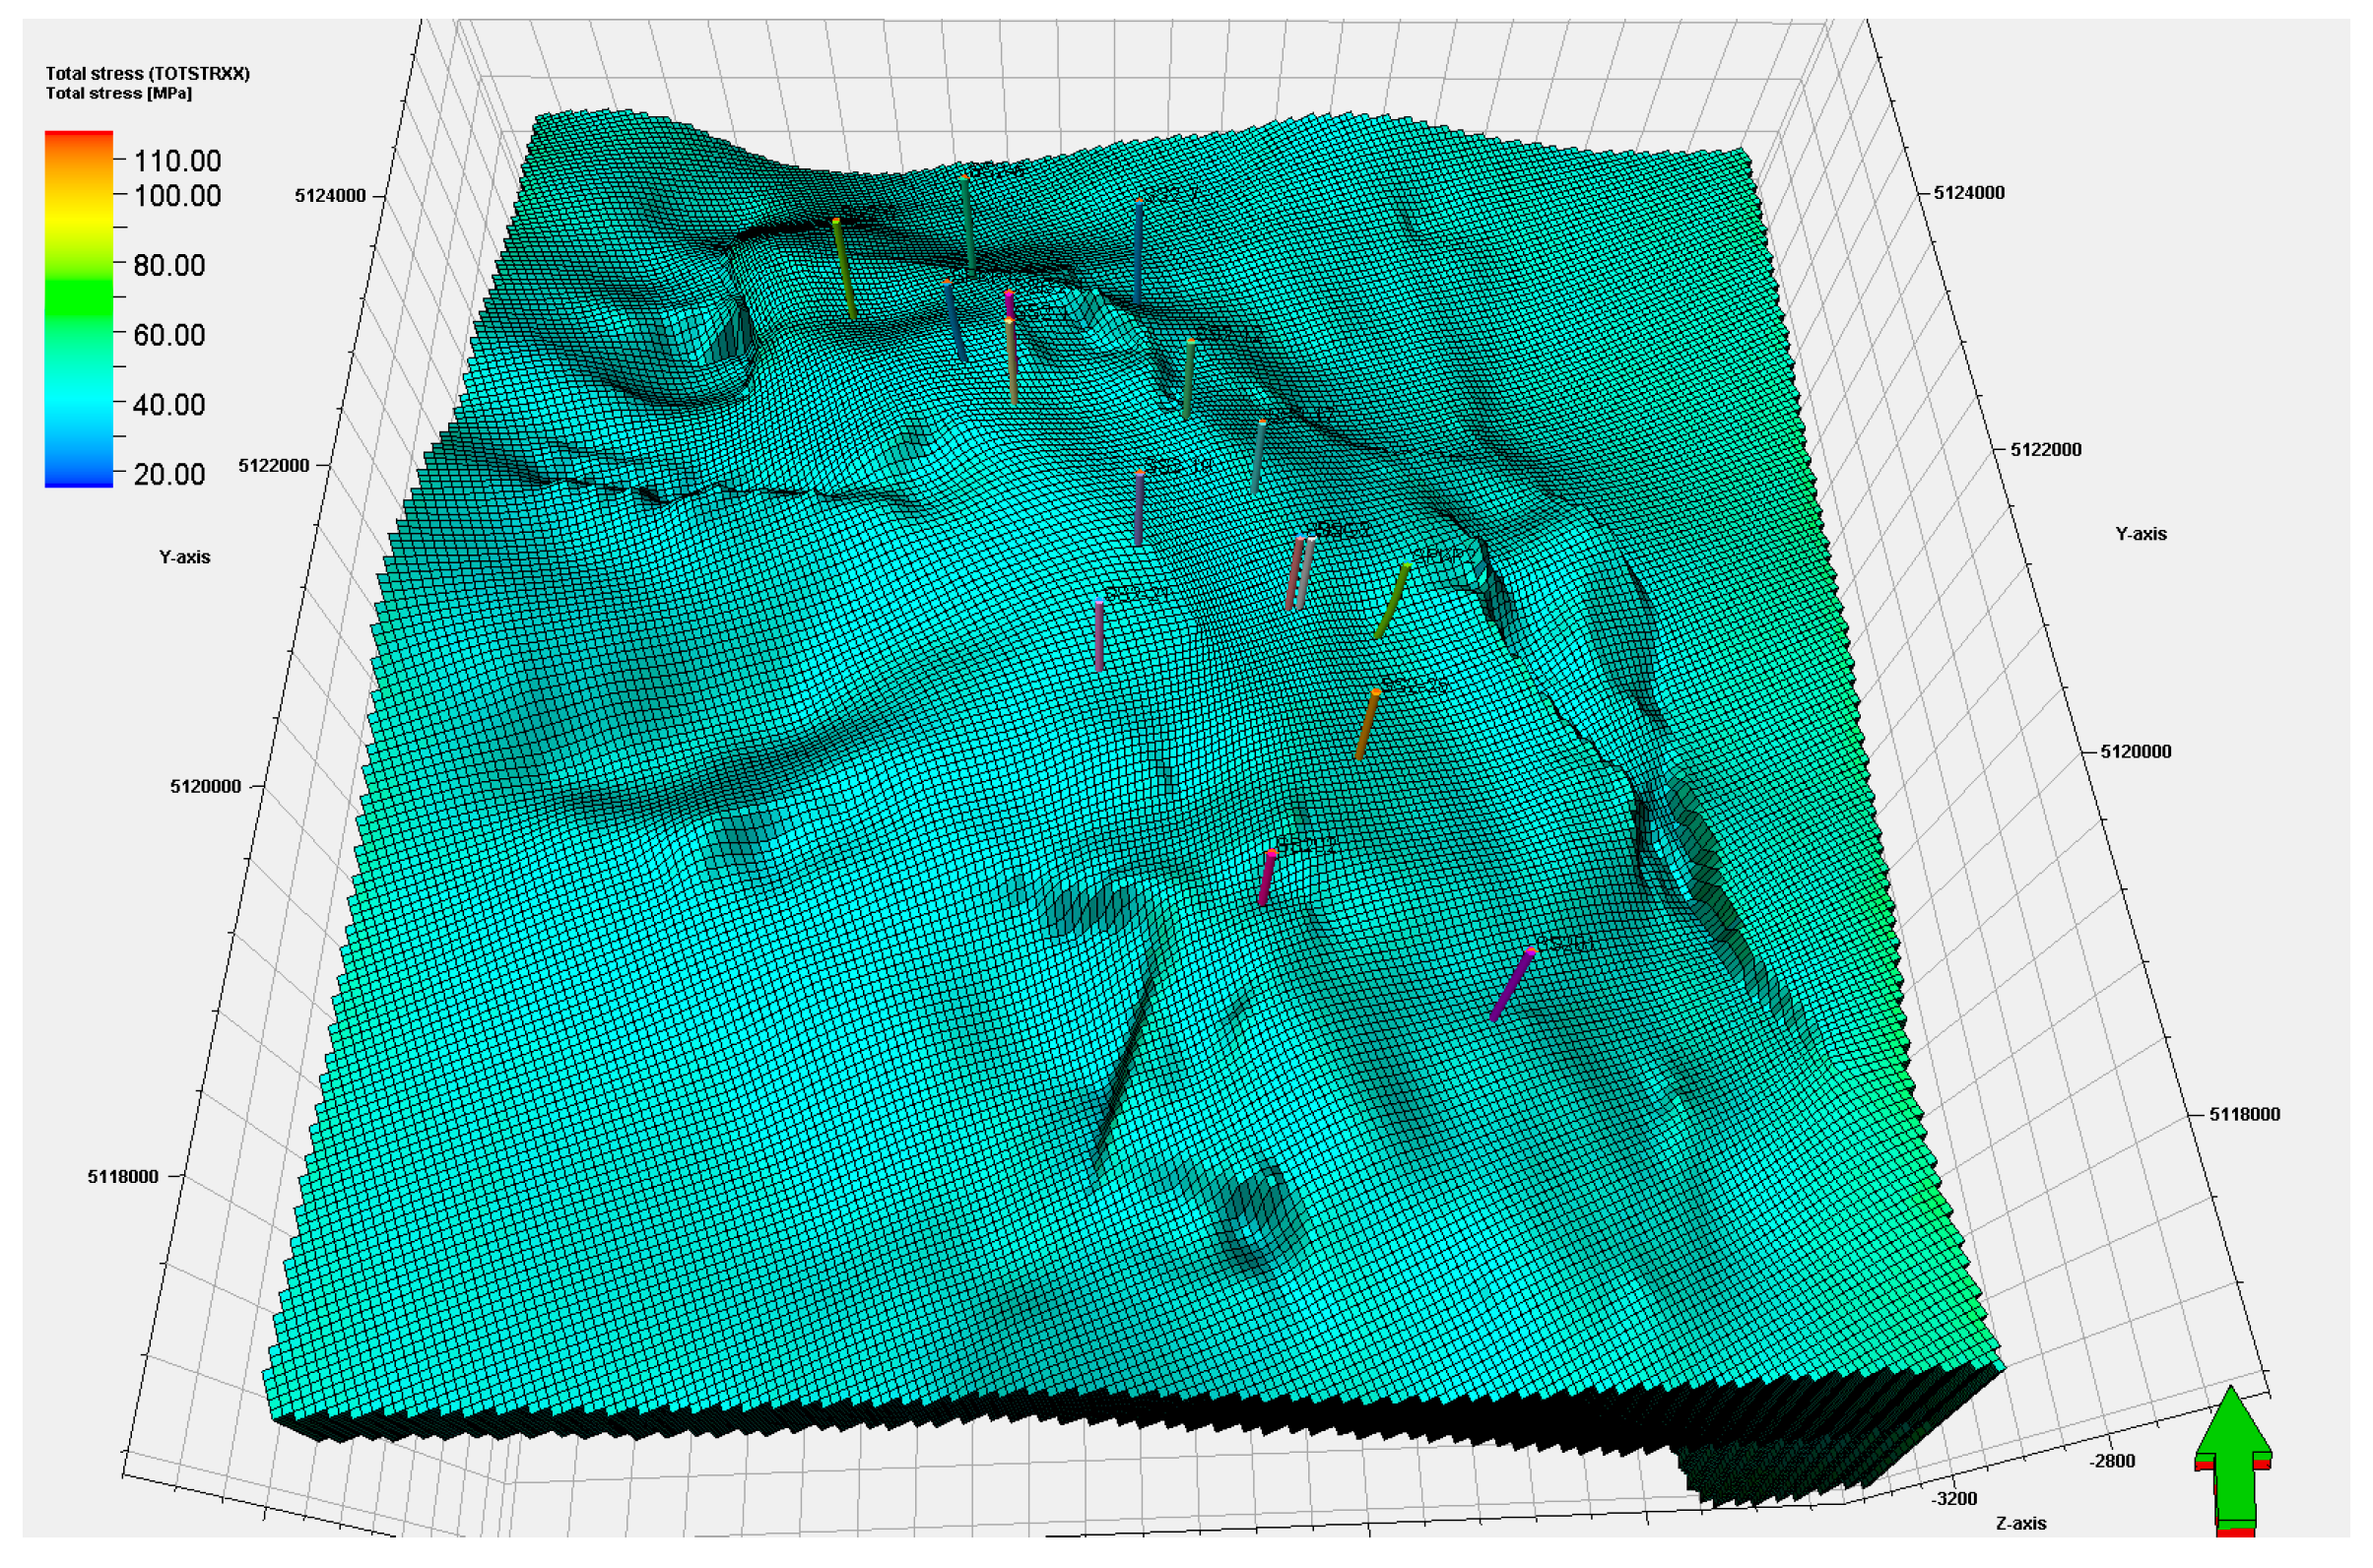
4.2. Description of 3D Stress Inversion before Reservoir Construction
4.3. Evaluation of the Trap Static Sealing Capacity
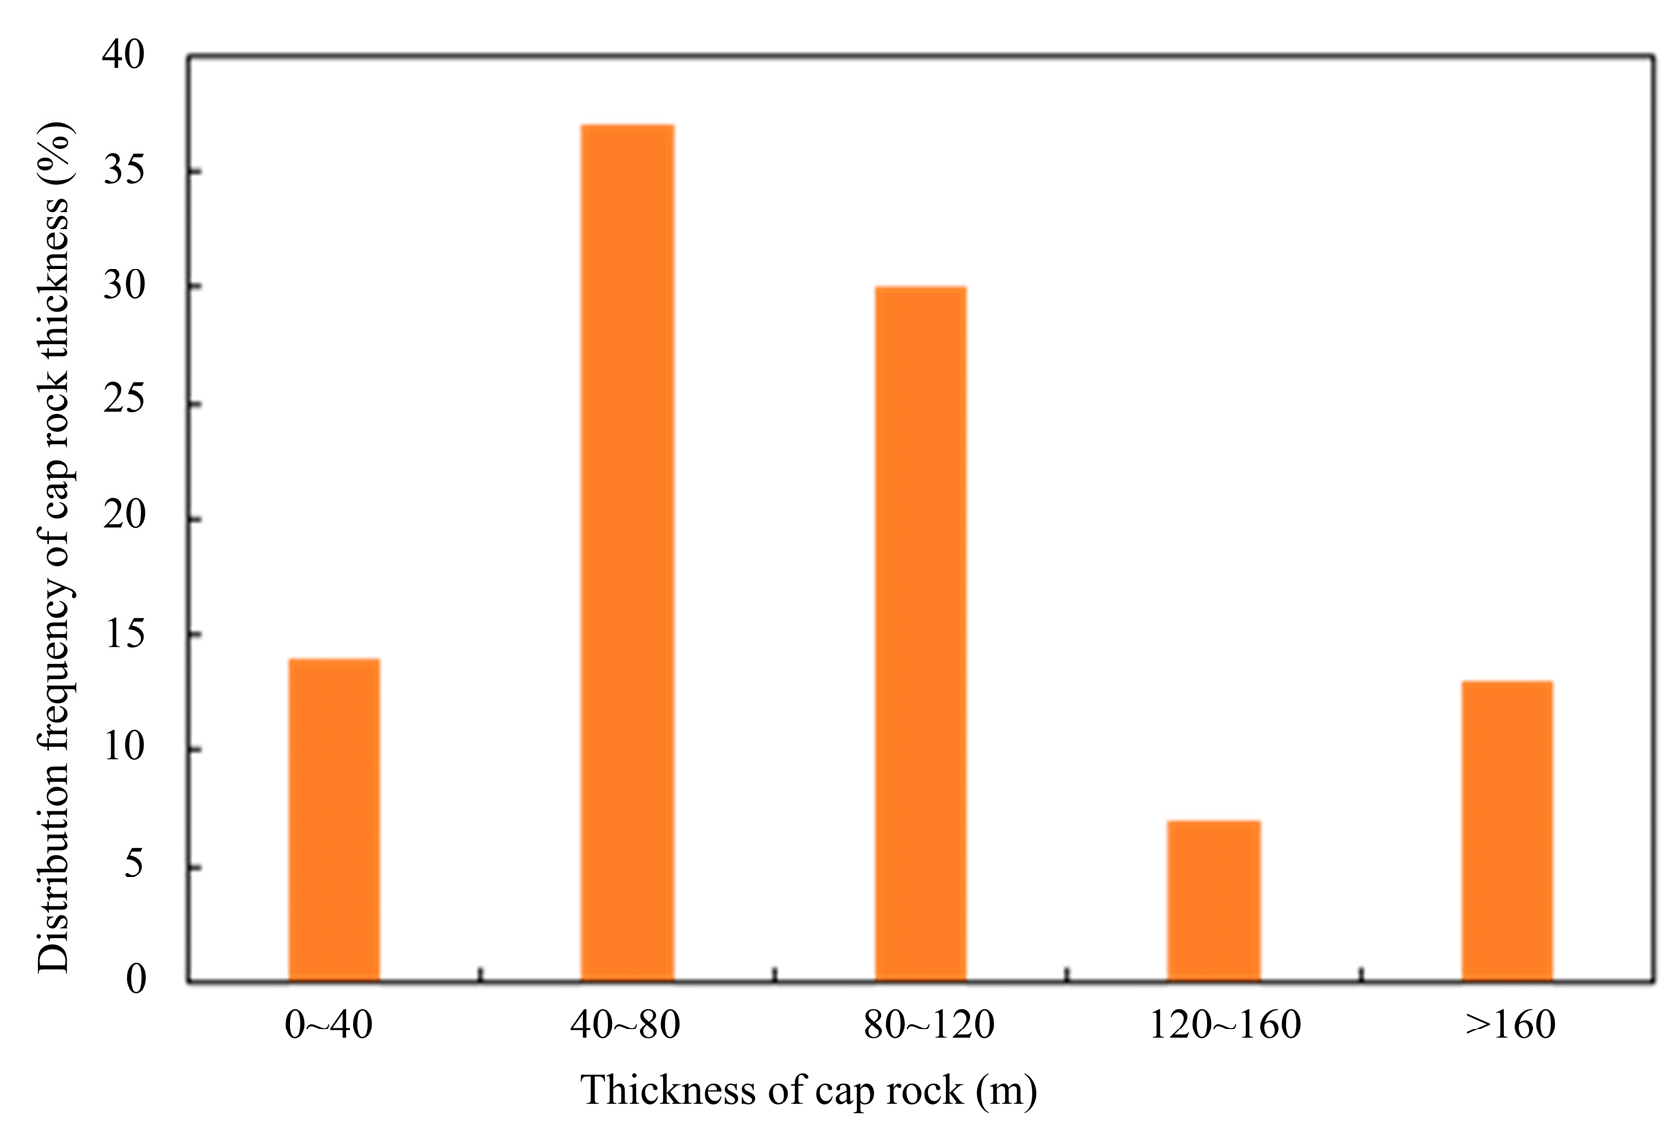
4.3.1. Evaluation of the Static Sealing Capacity of Cap Rock
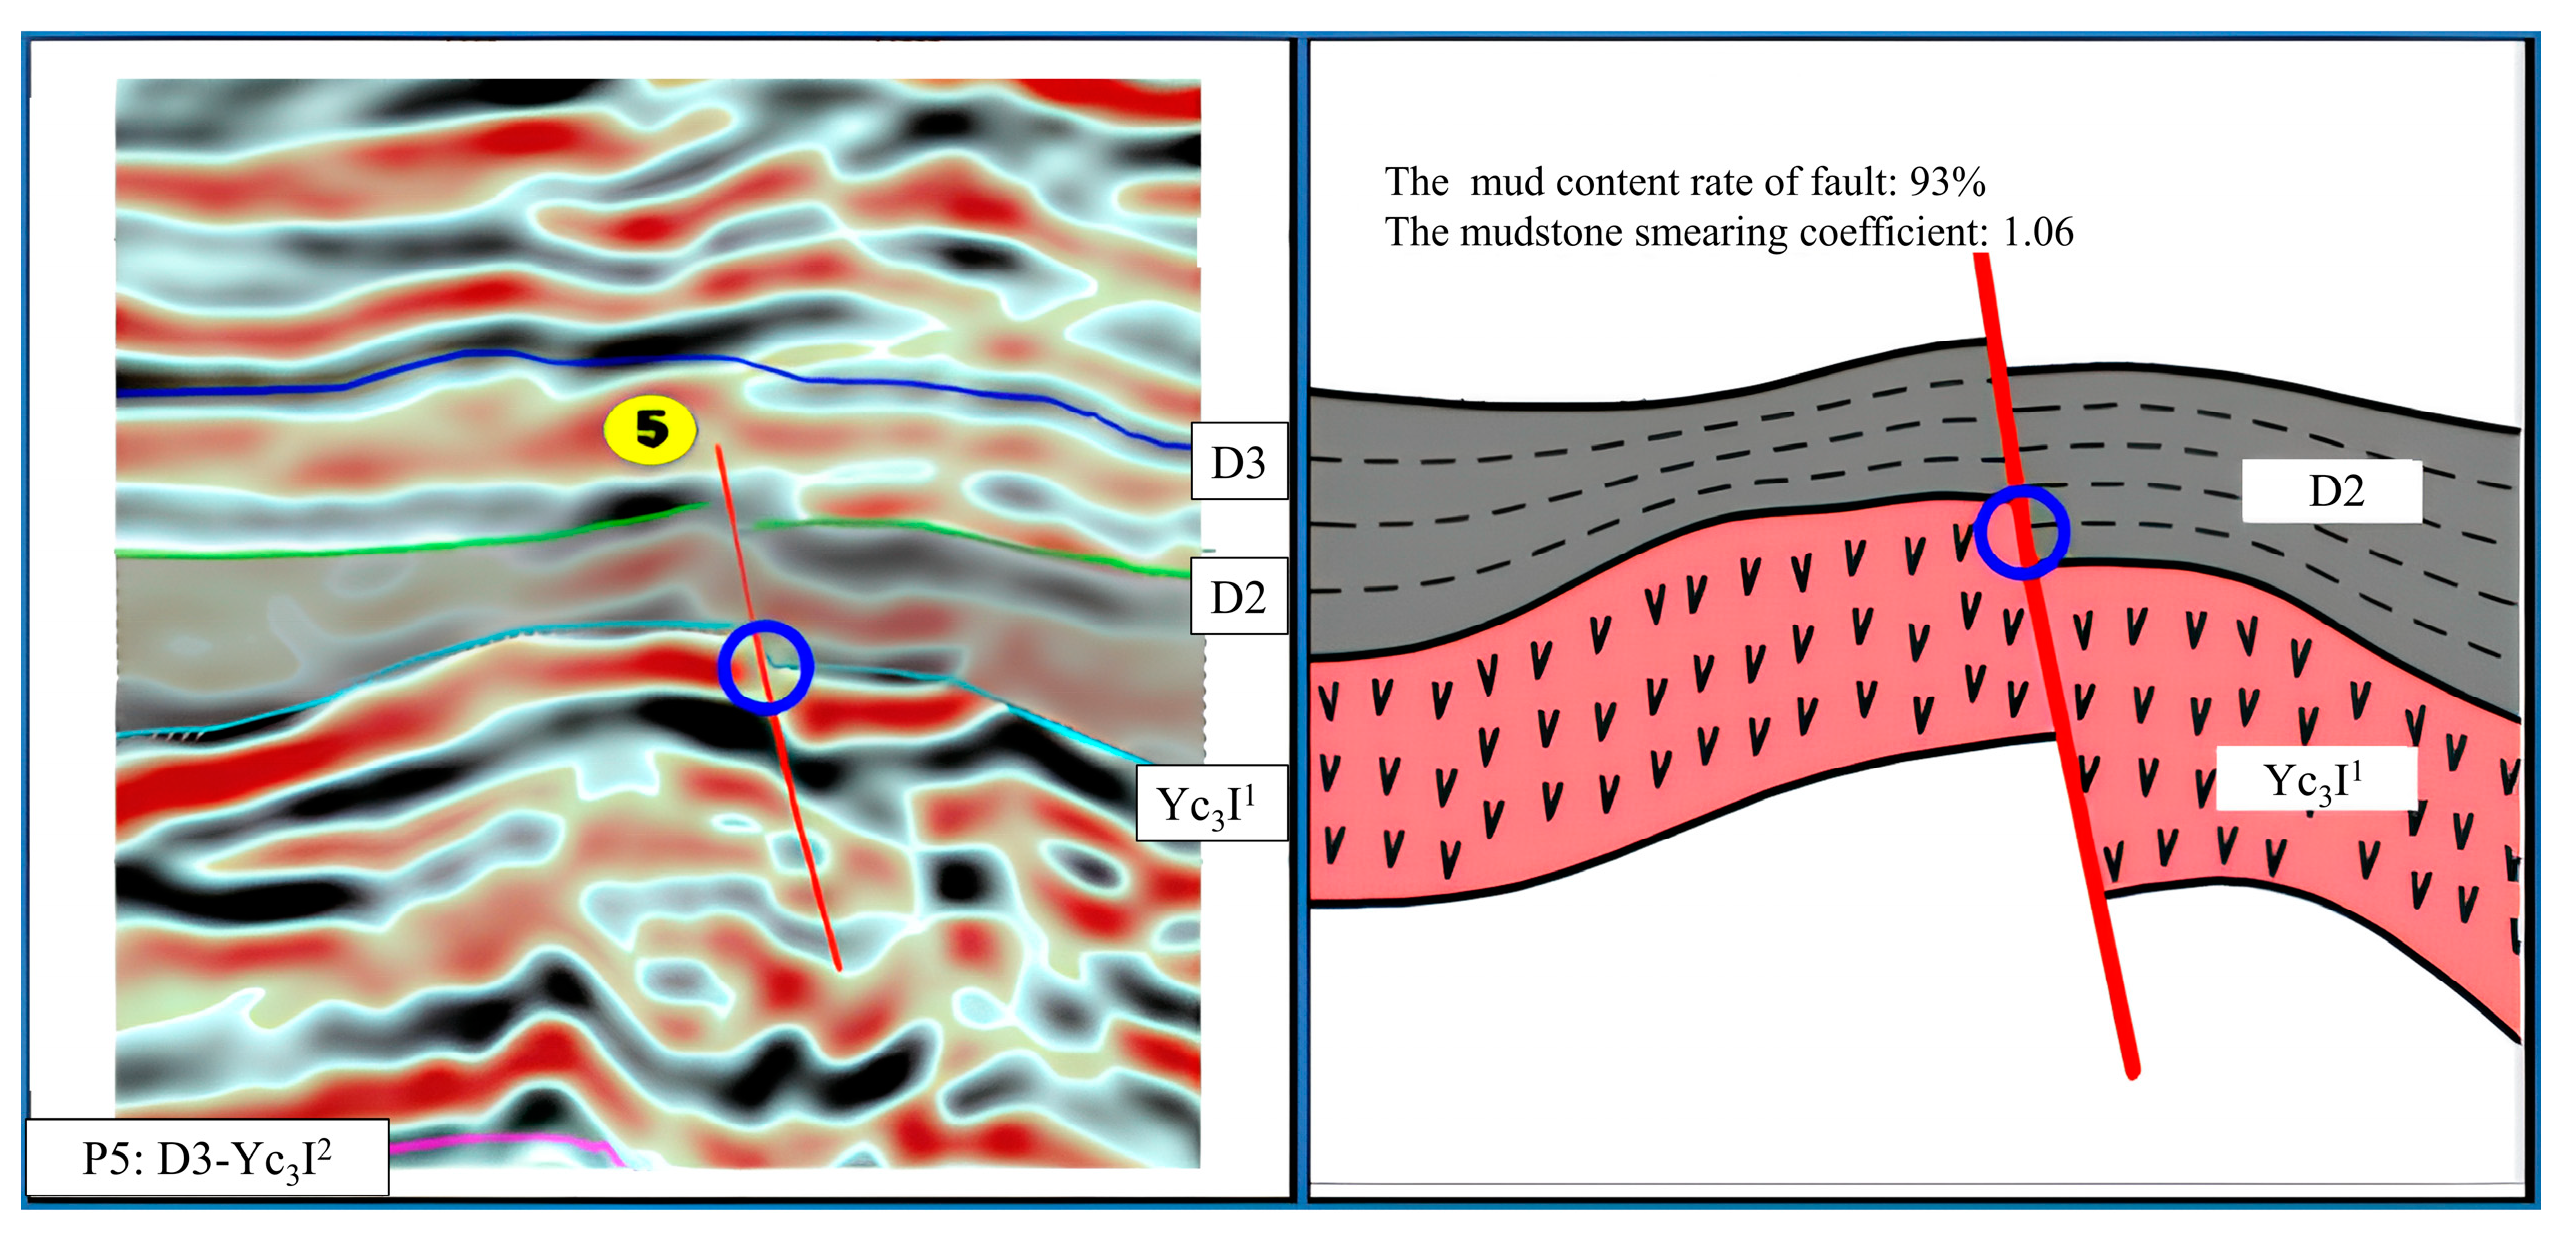
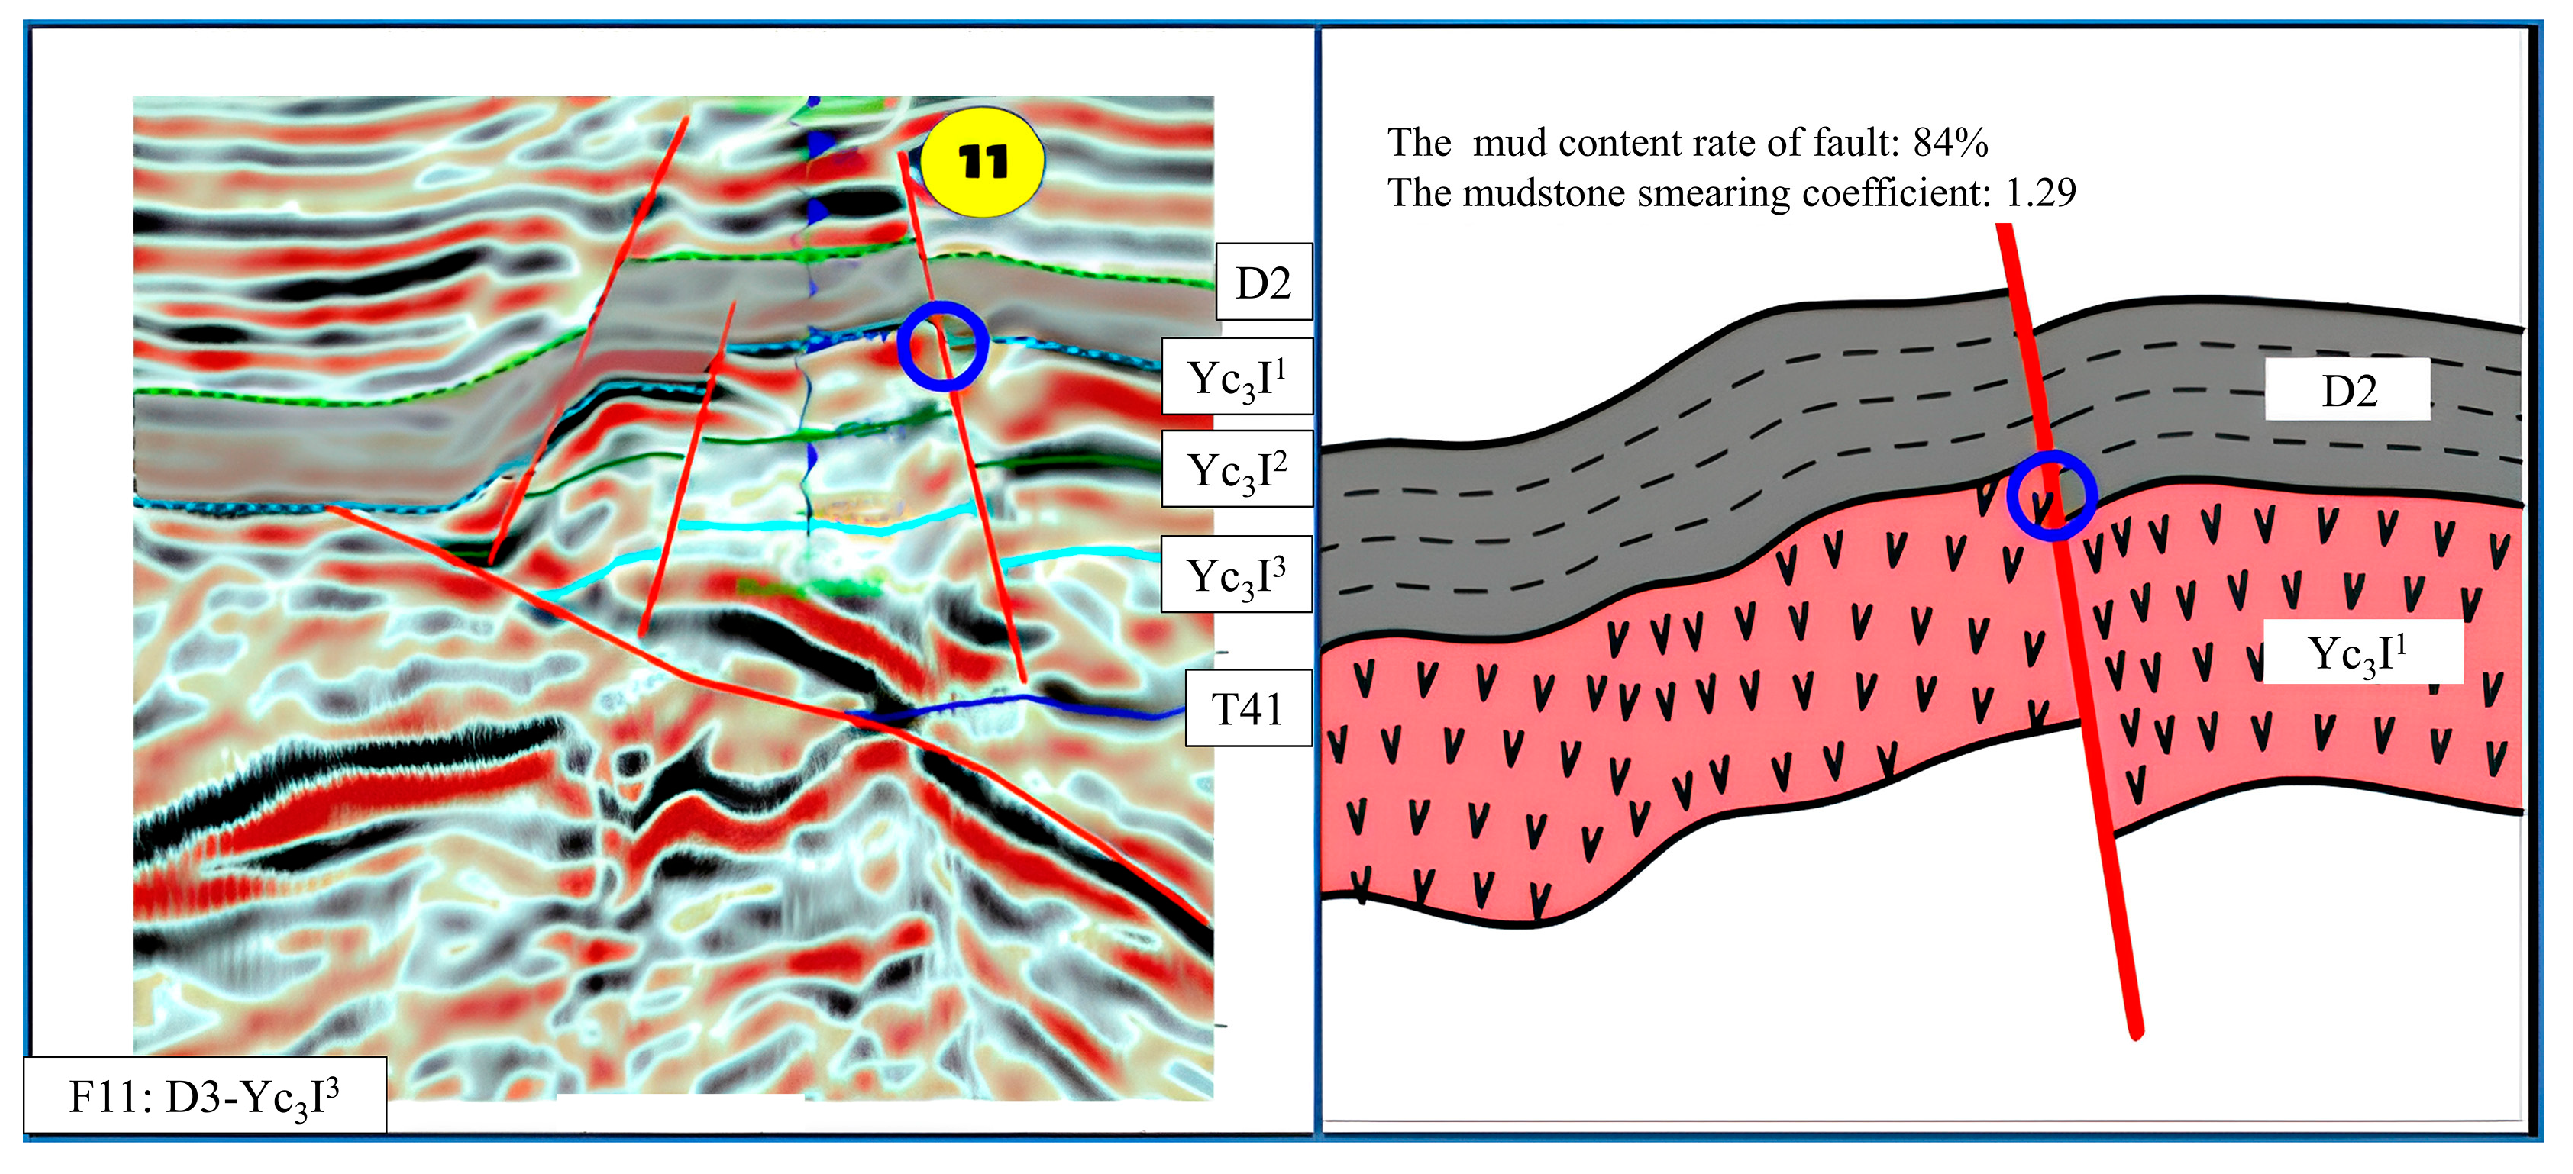
4.3.2. Evaluation of Static Sealing of Faults
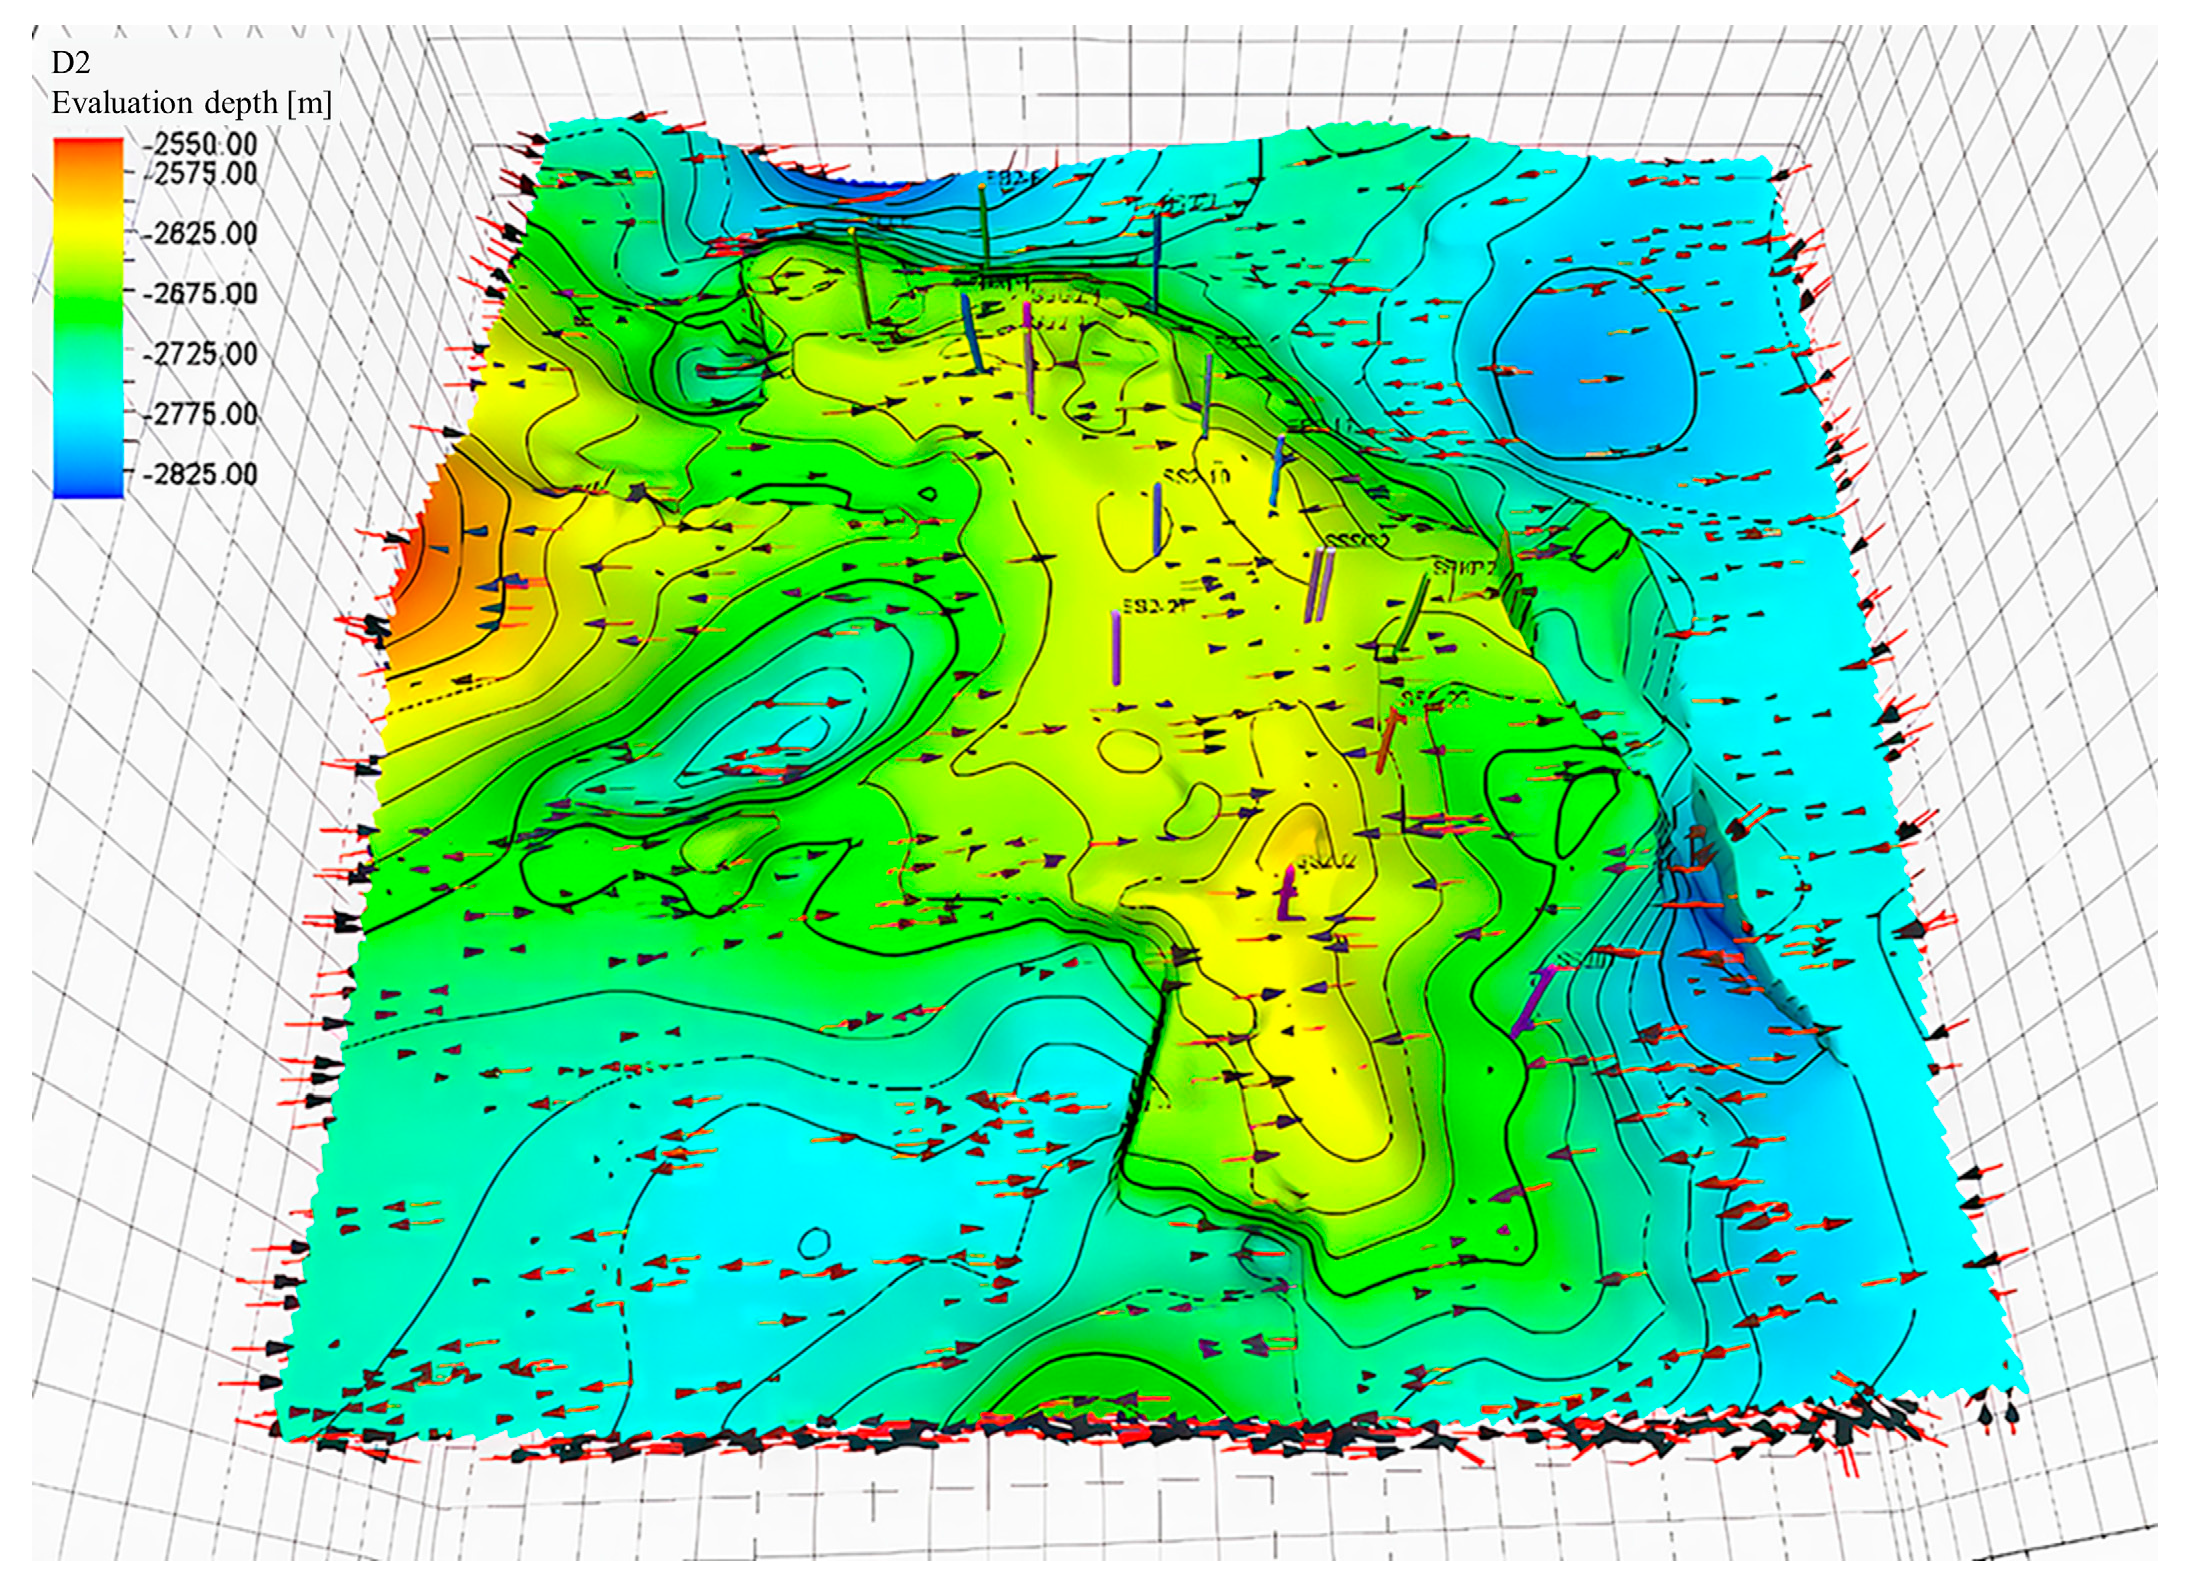
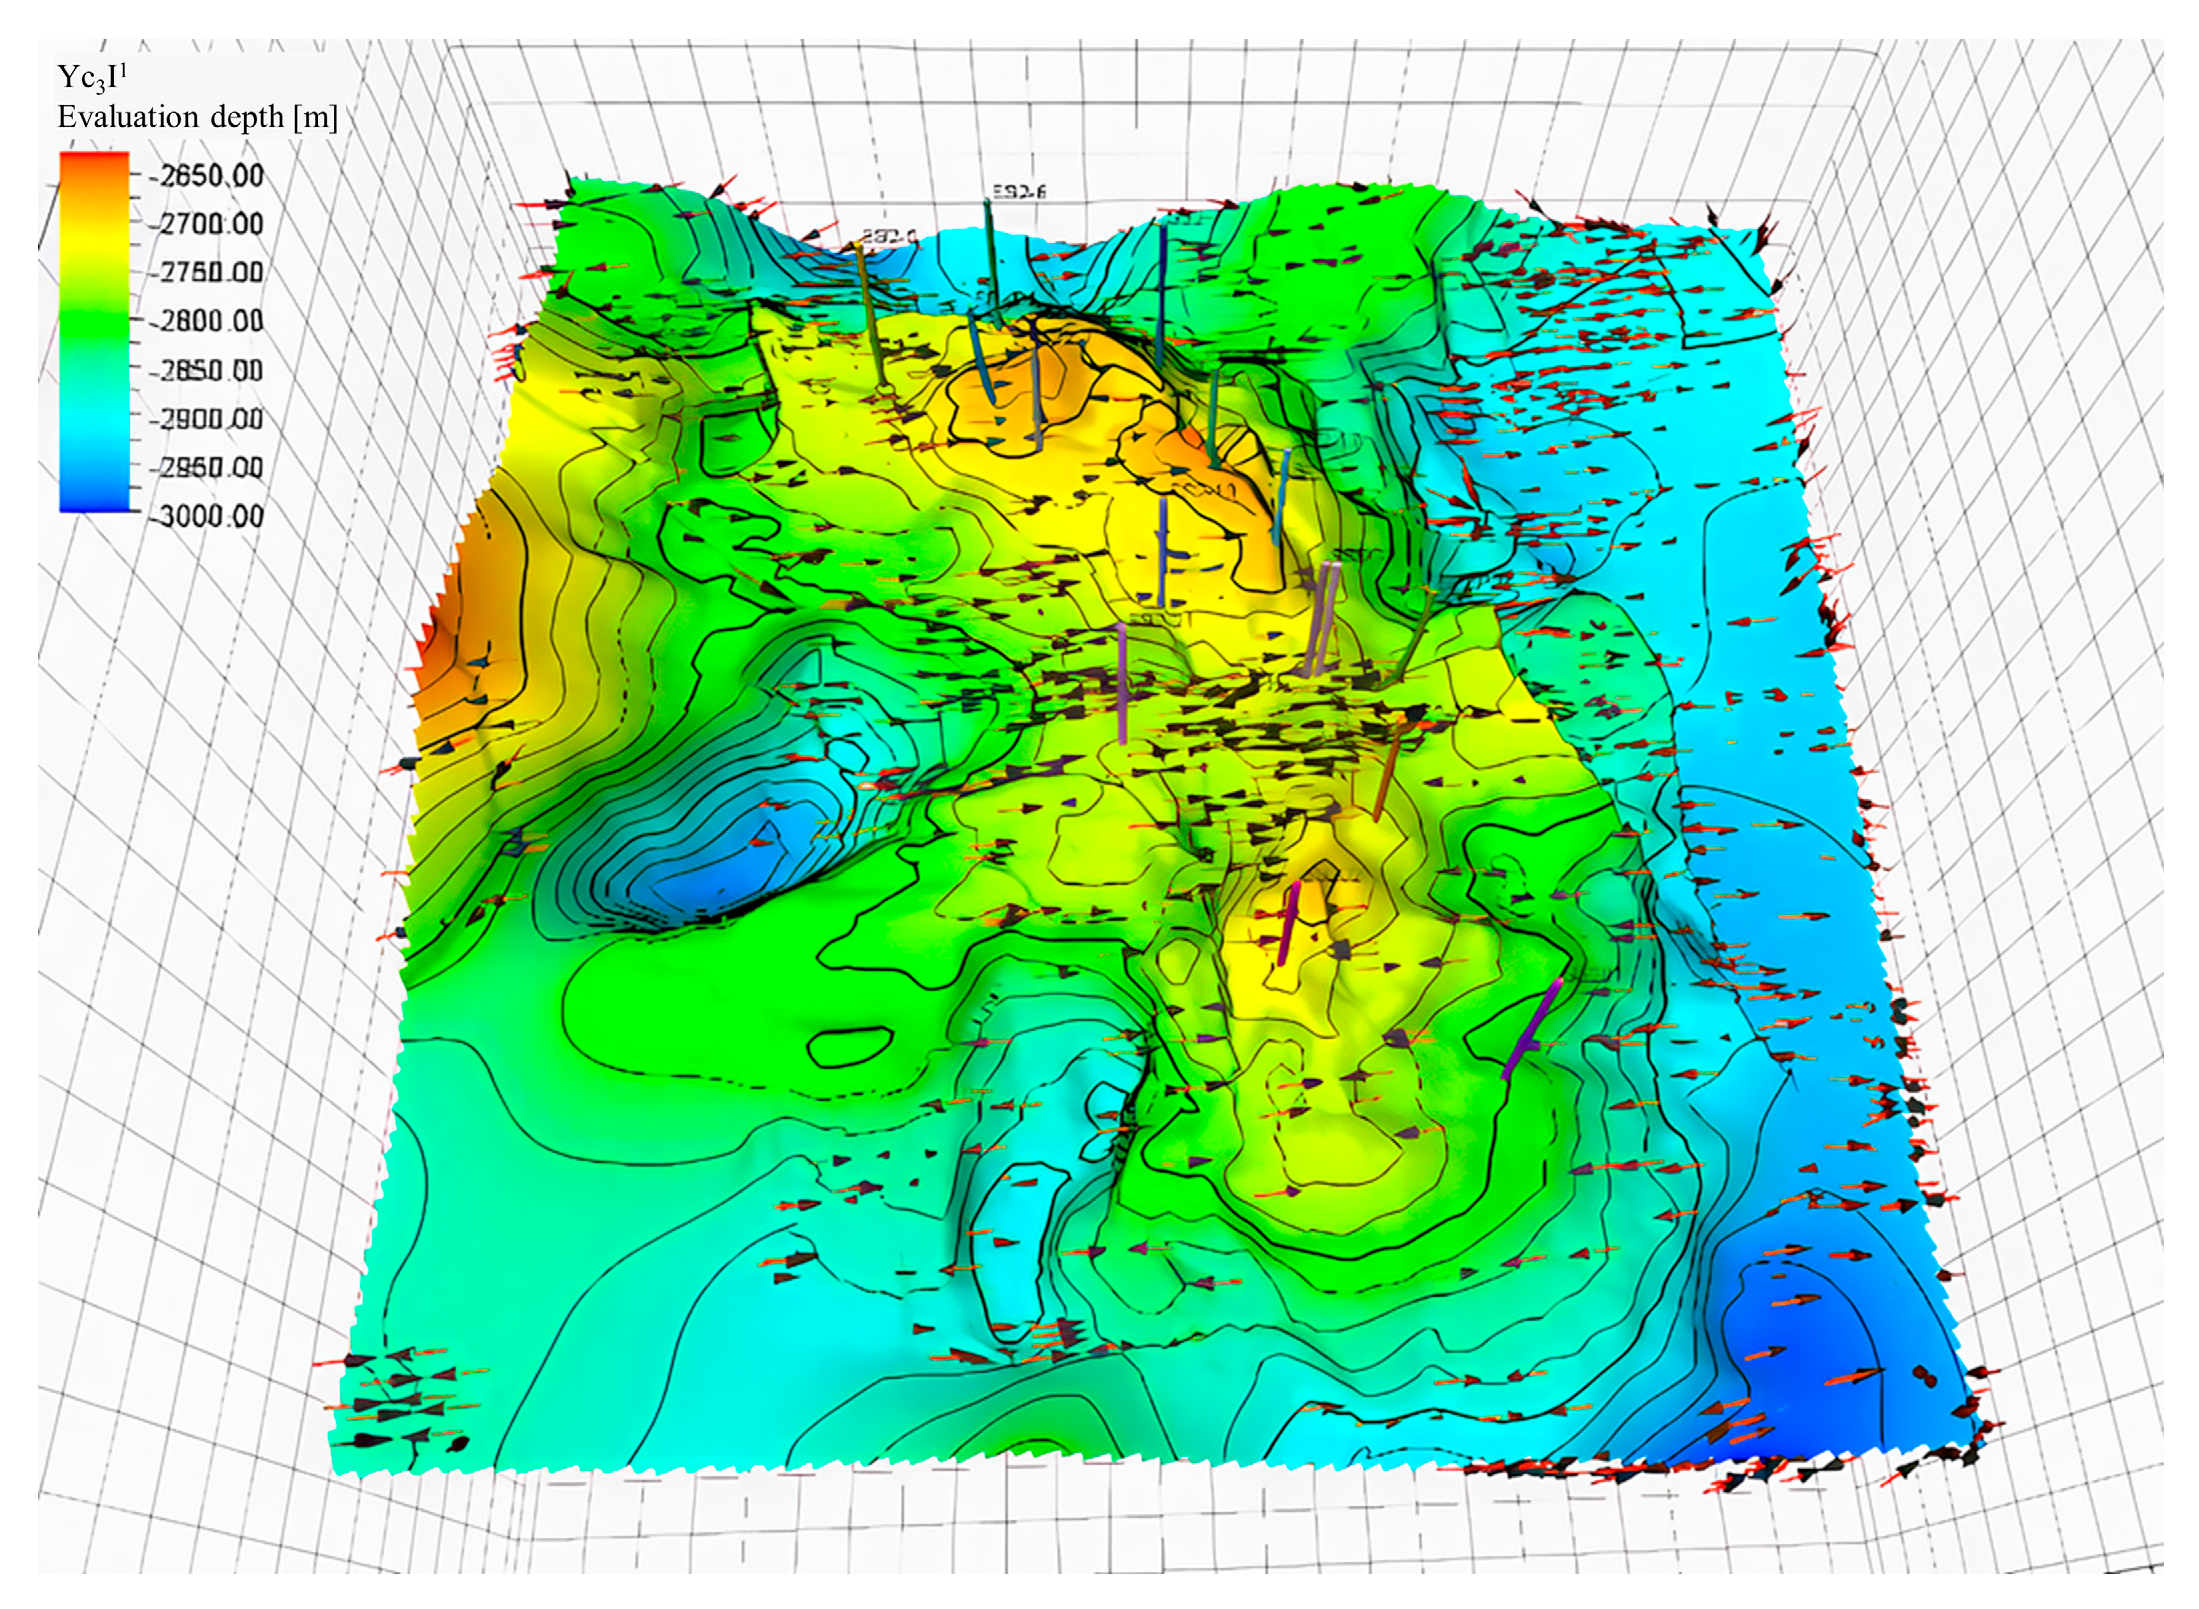
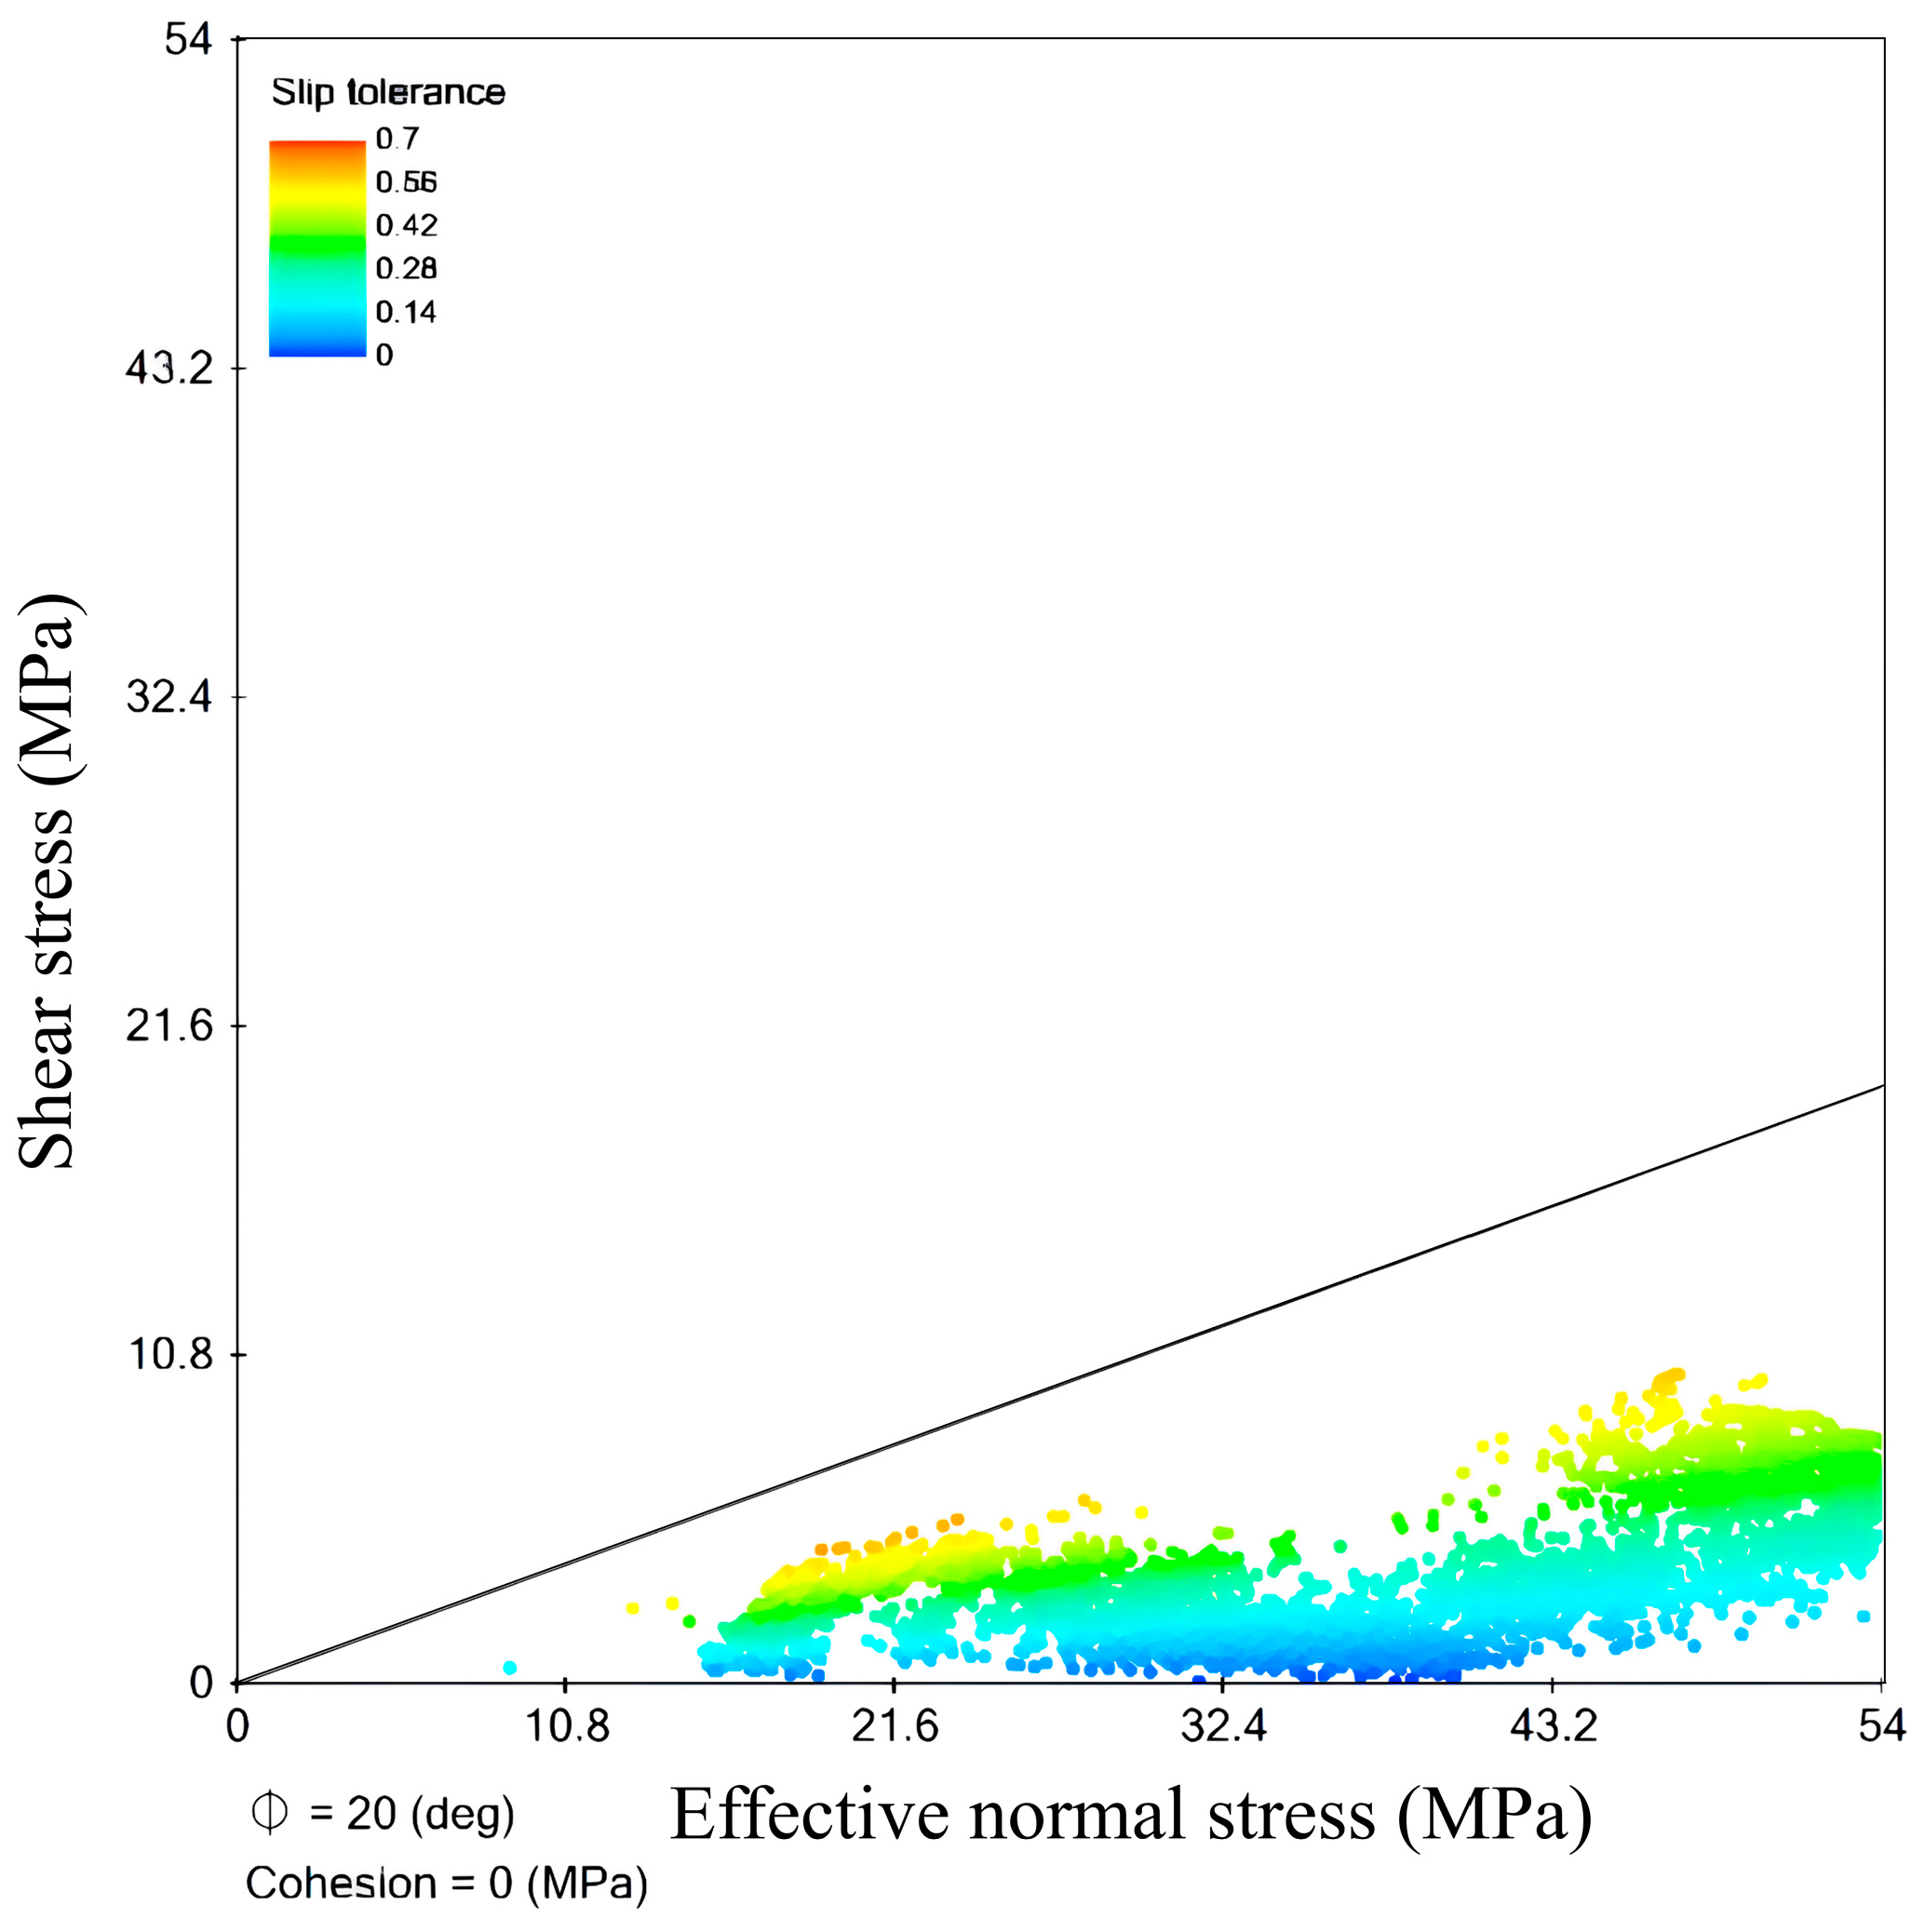
4.4. Evaluation of the Trap Dynamic Sealing Capacity
4.4.1. Evaluation of Dynamic Sealing of the Cap Rock
4.4.2. Evaluation of the Static Sealing Capacity of Cap Rock
5. Conclusions
Author Contributions
Funding
Institutional Review Board Statement
Informed Consent Statement
Data Availability Statement
Conflicts of Interest
References
- BP Statistical Review of World Energy. Available online: https://www.bp.com/en/global/corporate.html (accessed on 26 June 2022).
- Mountourakis, F.; Papazi, A.; Kotzabasis, K. The Microalga Chlorella vulgaris as a Natural Bioenergetic System for Effective CO2 Mitigation-New Perspectives against Global Warming. Symmetry 2021, 13, 997. [Google Scholar] [CrossRef]
- Liu, Y.; Xue, Y.K.; MacDonald, G.; Cox, P.; Zhang, Z.Q. Global vegetation variability and its response to elevated CO2, global warming, and climate variability—A study using the offline SSiB4/TRIFFID model and satellite data. Earth Syst. Dyn. 2019, 10, 9–29. [Google Scholar] [CrossRef]
- Kawahata, H.; Fujita, K.; Iguchi, A.; Inoue, M.; Iwasaki, S.; Kuroyanagi, A.; Maeda, A.; Manaka, T.; Moriya, K.; Takagi, H.; et al. Perspective on the response of marine calcifiers to global warming and ocean acidification-Behavior of corals and foraminifera in a high CO2 world “hot house”. Prog. Earth Planet. Sci. 2019, 6, 1–37. [Google Scholar] [CrossRef]
- Bastami, M.S.B.; Jones, D.L.; Chadwick, D.R. Reduction of Methane Emission during Slurry Storage by the Addition of Effective Microorganisms and Excessive Carbon Source from Brewing Sugar. J. Environ. Qual. 2016, 45, 2016–2022. [Google Scholar] [CrossRef] [PubMed]
- Wang, Q.Z.; Liu, S.X. How Do FDI and Technological Innovation Affect Carbon Emission Efficiency in China? Energies 2022, 15, 9209. [Google Scholar] [CrossRef]
- Ostergaard, P.A.; Duic, N.; Noorollahi, Y.; Kalogirou, S. Renewable energy for sustainable development. Renew. Energy 2022, 199, 1145–1152. [Google Scholar] [CrossRef]
- Shrestha, A.; Mustafa, A.A.; Htike, M.M.; You, V.; Kakinaka, M. Evolution of energy mix in emerging countries: Modern renewable energy, traditional renewable energy, and non-renewable energy. Renew. Energy 2022, 199, 419–432. [Google Scholar] [CrossRef]
- Ostergaard, P.A.; Duic, N.; Noorollahi, Y.; Kalogirou, S.A. Recent advances in renewable energy technology for the energy transition. Renew. Energy 2021, 179, 877–884. [Google Scholar] [CrossRef]
- Molíková, A.; Vítezová, M.; Vítez, T.; Buriánková, I.; Huber, H.; Dengler, L.; Hanisáková, N.; Onderka, V.; Urbanová, I. Underground gas storage as a promising natural methane bioreactor and reservoir? J. Energy Storage 2021, 47, 1036310. [Google Scholar] [CrossRef]
- Fu, Y. Reconstructing depleted fractured oil reservoirs into underground natural gas storages with the consideration of the effect of molecular diffusion and medium deformation on the dynamic performances. Arab. J. Geosci. 2020, 13, 122. [Google Scholar] [CrossRef]
- Liao, W.; Liu, G.L.; Chen, R.H.; Sun, J.C.; Zhang, S.J.; Wang, Y.S.; Liu, X.S. Evaluation on the dynamic sealing capacity of underground gas storages rebuilt from gas reservoirs: A case study of Xinjiang H underground gas storage. Nat. Gas Ind. B 2021, 8, 334–343. [Google Scholar] [CrossRef]
- Jin, Z.J.; Yuan, Y.S.; Sun, D.S.; Liu, Q.Y.; Li, S.J. Models for dynamic evaluation of mudstone/shale cap rocks and their applications in the Lower Paleozoic sequences, Sichuan Basin, SW China. Mar. Petrol. Geol. 2014, 49, 121–128. [Google Scholar] [CrossRef]
- Lamarche, J.; Lavenu, A.P.C.; Gauthier, B.D.M.; Guglielmi, Y.; Jayet, O. Relationships between fracture patterns, geodynamics and mechanical stratigraphy in Carbonates (South-East Basin, France). Tectonophysics 2012, 581, 231–245. [Google Scholar] [CrossRef]
- Ingram, G.M.; Urai, J.L.; Naylor, M.A. Sealing processes and top seal assessment. Nor. Pet. Soc. Spec. Publ. 1997, 7, 165–174. [Google Scholar] [CrossRef]
- Fu, X.F.; Wu, T.; Lv, Y.F.; Liu, S.B.; Tian, H.; Lu, M.X. Research status and development trend of the reservoir caprock sealing properties. Oil Gas Geol. 2018, 3, 454–471. [Google Scholar] [CrossRef]
- Bailey, W.R.; Underschultz, J.; Dewhurst, D.N.; Kovack, G.; Mildren, S.; Raven, M. Multi-disciplinary approach to fault and top seal appraisal; Pyrenees-Macedon oil and gas fields, Exmouth Sub-basin, Australian Northwest Shelf. Mar. Petrol. Geol. 2006, 23, 241–259. [Google Scholar] [CrossRef]
- Heath, J.E.; Dewers, T.A.; McPherson, B.J.O.L.; Nemer, M.B.; Kotula, P.G. Pore-lining phases and capillary breakthrough pressure of mudstone caprocks: Sealing efficiency of geologic CO2 storage sites. Int. J. Greenh. Gas Control 2012, 11, 204–220. [Google Scholar] [CrossRef]
- Armitage, P.J.; Faulkner, D.R.; Worden, R.H. Caprock corrosion. Nat. Geosci. 2013, 6, 79–80. [Google Scholar] [CrossRef]
- Ingram, G.M.; Urai, J.L. Top-seal leakage through faults and fractures: The role of mudrock properties. Geol. Soc. 1999, 158, 125–135. [Google Scholar] [CrossRef]
- Fu, X.F.; Jia, R.; Wang, H.X.; Wu, T.; Meng, L.D.; Sun, Y.H. Quantitative evaluation of fault-caprock sealing capacity: A case from Dabei-Kelasu structural belt in Kuqa Depression, Tarim Basin, NW China. Petrol. Explor. Dev. 2015, 3, 300–309. [Google Scholar] [CrossRef]
- Lin, J.P.; Jia, S.P.; Liu, T.H.; Yan, A.H.; Xi, Z.Q. Comprehensive Evaluation of Sealing Ability of Mudstone Cap Rock for Xing 9 Depleted Gas Reservoir in Reconstructing Underground Gas Storage. J. Rock Mech. Eng. 2015, 34, 4099–4107. [Google Scholar]
- Gong, L.; Gao, S.; Fu, X.F.; Chen, S.M.; Lyu, B.Y.; Yao, J.Q. Fracture characteristics and their effects on hydrocarbon migration and accumulation in tight volcanic reservoirs: A case study of the Xujiaweizi fault depression, Songliao Basin, China. Interpretation 2017, 4, SP57–SP70. [Google Scholar] [CrossRef]
- Feng, Z.H.; Yin, C.H.; Lu, J.M.; Zhu, Y.K. Formation and accumulation of tight sandy conglomerate gas: A case from the Lower Cretaceous Yingcheng Formation of Xujiaweizi fault depression, Songliao Basin. Petrol. Explor. Dev. 2013, 40, 696–703. [Google Scholar] [CrossRef]
- Lu, J.M.; Yang, L.; Zhu, Y.K.; Sun, L.D.; Lu, S.F.; Zhang, P.F.; Zou, N.W.; Lin, Z.Z. Pore Structure and Multifractal Characteristics of Overmature Continental Shale: A Case Study from the Xujiaweizi Fault Depression, Songliao Basin, China. Geofluids 2022, 2022, 3539482. [Google Scholar] [CrossRef]
- Zhang, E.H.; Jiang, C.J.; Zhang, Y.G.; Li, Z.A.; Feng, X.Y.; Wu, J. Study on the formation and evolution of deep structure of Xujiaweizi fault depression. Acta Petrol. Sin. 2010, 26, 149–157. [Google Scholar]
- Feng, Z.Q.; Jia, C.Z.; Xie, X.N.; Zhang, S.; Feng, Z.H.; Cross, T.A. Tectonostratigraphic units and stratigraphic sequences of the nonmarine Songliao basin, northeast China. Basin Res. 2010, 22, 79–95. [Google Scholar] [CrossRef]
- Meng, Q.A.; Li, C.B.; Bai, X.F.; Zhang, W.J.; Xue, T.; Peng, J.L.; Tang, Z.G. Petroleum exploration history and enlightenment in the northern Songliao basin. Xinjiang Pet. Geol. 2021, 42, 264–271. [Google Scholar]
- Cai, Z.R.; Huang, Q.T.; Xia, B.; Lu, B.F.; Liu, W.L.; Wan, Z.F. Development features of volcanic rocks of the Yingcheng Formation and their relationship with fault structure in the Xujiaweizi Fault Depression, Songliao Basin, China. Petrol. Sci. 2012, 9, 436–443. [Google Scholar] [CrossRef]
- He, C.Y.; Lin, Y.N.; Zhang, T.Z.; Ma, J.S.; Li, Y.F.; Cheng, J.J.; Zhang, Y.D. Study on the structural characteristics of the Yangdachengzi oil layer in the Quantou Formation, ZY block, central depression, Songliao Basin. Front. Earth Sci. 2023, 11, 251–296. [Google Scholar] [CrossRef]
- Zhang, S.C.; Zhang, B.; Wang, X.M.; Feng, Z.H.; He, H.; Wang, H.J.; Fu, X.L.; Liu, Y.K.; Yang, C.L. Gulong shale oil enrichment mechanism and orderly distribution of conventional-unconventional oils in the Cretaceous Qingshankou Formation, Songliao Basin, NE China. Petrol. Explor. Dev. 2023, 50, 1045–1059. [Google Scholar] [CrossRef]
- He, D.; Li, J.H.; Liu, S.J. Volcanic edifice types and eruption model of Yingcheng Formation, Lower Cretaceous, in Xujiaweizi fault depression, northern Songliao Basin. Acta Petrol. Sin. 2009, 25, 659–666. [Google Scholar]
- Liu, G.P.; Zeng, L.B.; Sun, G.Q.; Zu, K.W.; Qin, L.B.; Mao, Z.; Mehdi, O. Natural fractures in tight gas volcanic reservoirs and their influences on production in the Xujiaweizi depression, Songliao Basin, China. AAPG Bull. 2020, 104, 2099–2123. [Google Scholar] [CrossRef]
- Lyu, X.Y.; Yun, L.; Xu, J.G.; Liu, H.; Yu, X.N.; Peng, P.; Ouyang, M.K.; Luo, Y. Sealing capacity evolution of gypsum salt caprocks under multi-cycle alternating stress during operations of underground gas storage. J. Petrol. Sci. Eng. 2023, 220, 147–192. [Google Scholar] [CrossRef]
- Xue, T.; Liu, Y.X.; Yang, X.F.; Liu, J.Y. A study on the features of fractures in the volcanic reservoirs of Shengping gas field. Nat. Gas Ind. B 2009, 29, 12966. [Google Scholar] [CrossRef]
- Ma, X.; Zheng, D.; Shen, R.; Wang, C.; Luo, J.; Sun, J. Key technologies and practice for gas field storage facility construction of complex geological conditions in China. Petrol. Explor. Dev. 2018, 45, 489–499. [Google Scholar] [CrossRef]
- Castelletto, N.; Ferronato, M.; Gambolati, G.; Janna, C.; Marzorati, D.; Teatini, P. Can natural fluid pore pressure be safely exceeded in storing gas underground? Eng. Geol. 2013, 153, 35–44. [Google Scholar] [CrossRef]


| Stratigraphical Sequence | Typical Lithology | Top Surface Earthquake Reflection | Isotope Age and Paleomagnetic Polarity | ||
|---|---|---|---|---|---|
| K1 | Quantou K1q | Interbedded light gray sandstone with dark purple mudstone and sandy mudstone. | T2 | ||
| Denglouku K1d | Fourth | Interbedded light gray sandstone with dark purple mudstone and sandy mudstone. | T3 | Positive polarity predominates | |
| Third | Grey-white, light grey sandstone, pink sandstone, dark purple shale, and pink sandy shale interlayer. | T3-1 | |||
| Second | T3-2 | ||||
| Yingcheng K1y | Fourth | Tuffaceous coarse sandstone and mudstone | T4 | ||
| Third | Intermediate-acidic volcanic rocks and tuffaceous sandstone. Andesite and tuff are predominant. | 120~139.4 Ma negative polarity | |||
| Shahezi K1sh | Upper | Grey, grey-white, variegated conglomerate sandstone interbedded with dark purple mudstone or alternating with it, with coal seams. | T4-1 | 126.5~142.3 Ma | |
| Lower | |||||
| J2 | Huoshiling J2h | Intermediate acidic volcanic rocks interbedded with black mudstone. Andesite predominates. | T4-2 | 152~160 Ma Positive polarity | |
| Basement c-p | Slate, schist, granite, and granodiorite. | T5 | |||
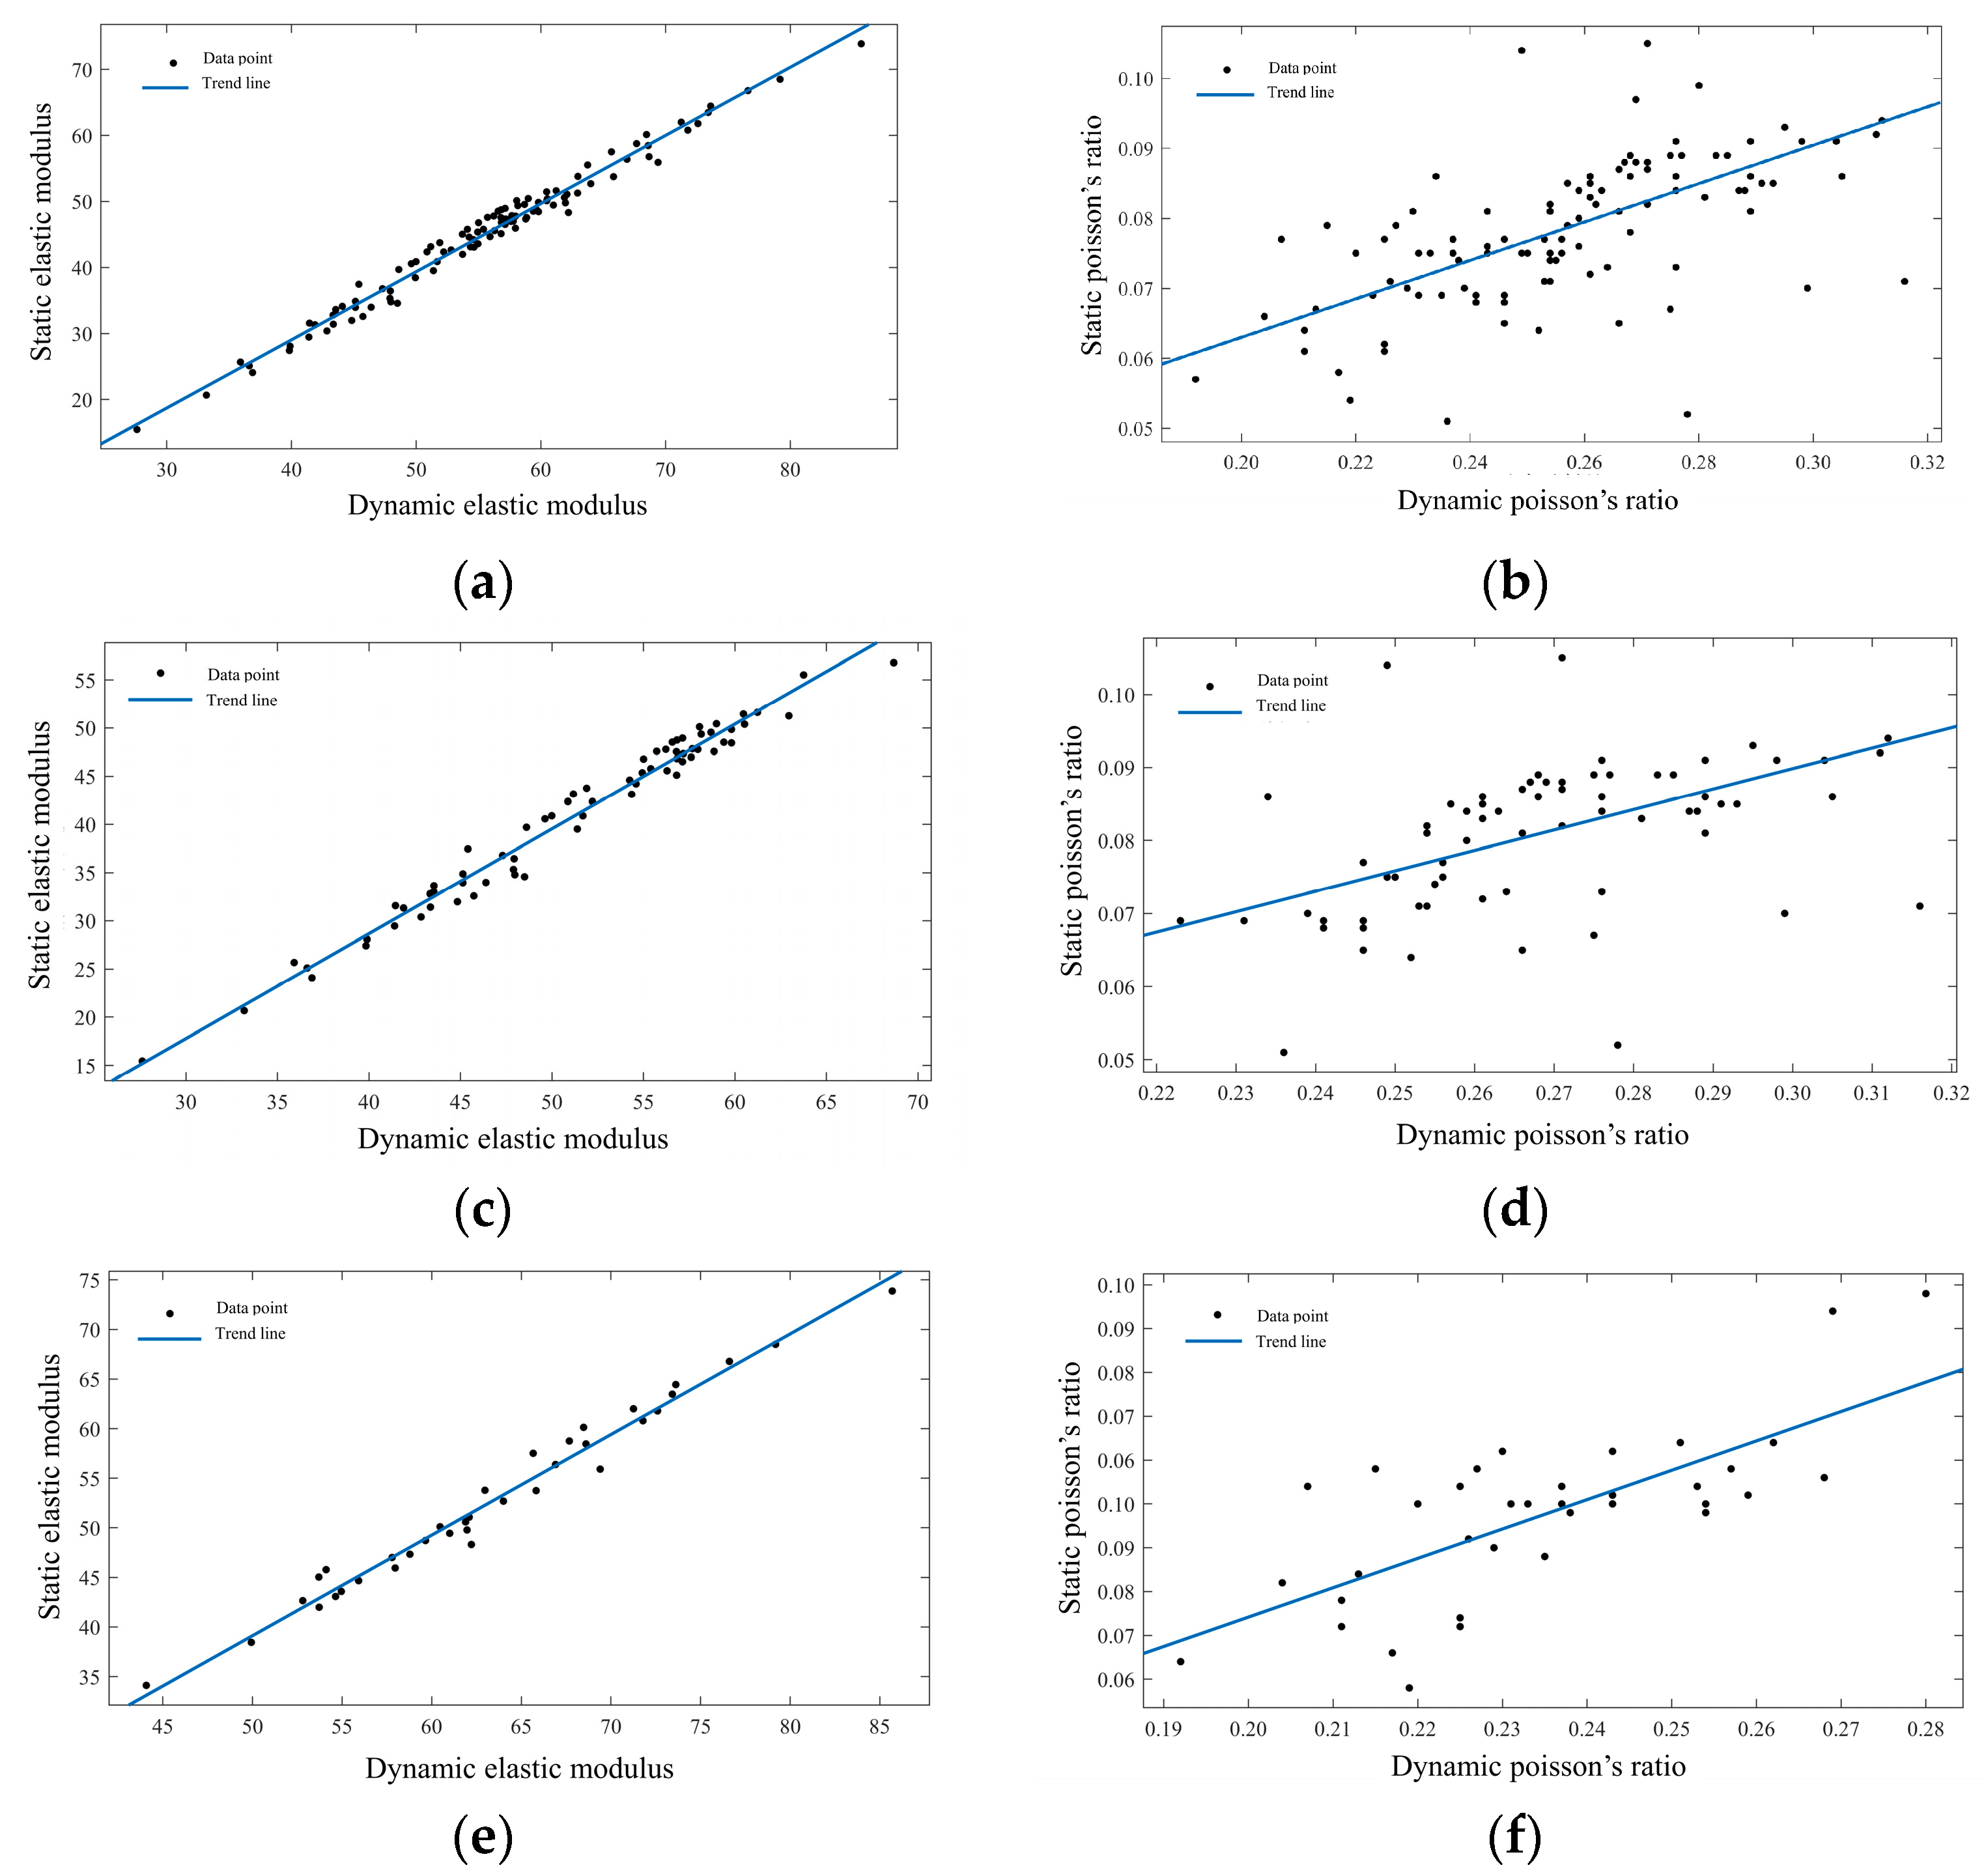
| Stratigraphy | Modulus of Elasticity Dynamic-static Transition Relationship | Poisson’s Rate Dynamic-Static Transition Relationship | ||
|---|---|---|---|---|
| Regression Equation | Correlation Coefficient | Regression Equation | Correlation Coefficient | |
| All stratigraphy | 0.9779 | 0.7631 | ||
| Sandstone, pink sandstone, and mudstone of the Denglouku formation | 0.9739 | 0.7751 | ||
| Volcanic rock of the Yingcheng formation | 0.9739 | 0.7779 | ||
| Well Number | Stratification | Lithology | Static Elastic Modulus (GPa) | Static Poisson’s Rate (Dimensionless) | ||||
|---|---|---|---|---|---|---|---|---|
| Minimum | Maximum | Average | Minimum | Maximum | Average | |||
| SPKP1 | D4 | sandstone, siltstone, mudstone | 13.692 | 54.724 | 37.248 | 0.038 | 0.129 | 0.086 |
| D3 | 21.982 | 68.110 | 44.757 | 0.049 | 0.107 | 0.081 | ||
| D2 | 26.662 | 66.868 | 47.544 | 0.025 | 0.118 | 0.079 | ||
| Yc3 | volcanic rock | 24.958 | 89.654 | 63.734 | 0.040 | 0.107 | 0.071 | |
| SPKP2 | D4 | sandstone, siltstone, mudstone | 18.683 | 50.501 | 34.473 | 0.068 | 0.136 | 0.092 |
| D3 | 23.680 | 59.303 | 43.860 | 0.041 | 0.106 | 0.082 | ||
| D2 | 33.445 | 54.074 | 45.030 | 0.065 | 0.098 | 0.084 | ||
| Yc3 | volcanic rock | 25.588 | 79.795 | 46.675 | 0.039 | 0.111 | 0.073 | |
| SS2-5 | D2 | sandstone, siltstone, mudstone | 22.907 | 58.537 | 44.624 | 0.055 | 0.099 | 0.083 |
| Yc3 | volcanic rock | 24.024 | 77.584 | 53.669 | 0.025 | 0.124 | 0.072 | |
| SS2-6 | D4 | sandstone, siltstone, mudstone | 19.775 | 59.224 | 36.501 | 0.043 | 0.131 | 0.089 |
| D3 | 22.268 | 62.511 | 42.077 | 0.041 | 0.129 | 0.084 | ||
| D2 | 19.915 | 68.658 | 45.816 | 0.034 | 0.130 | 0.084 | ||
| Yc3 | volcanic rock | 15.786 | 81.463 | 60.620 | 0.024 | 0.143 | 0.077 | |
| SS2-7 | D3 | sandstone, siltstone, mudstone | 30.234 | 60.386 | 43.782 | 0.066 | 0.106 | 0.085 |
| D2 | 20.893 | 65.850 | 44.535 | 0.059 | 0.117 | 0.084 | ||
| Yc3 | volcanic rock | 17.017 | 79.945 | 58.002 | 0.024 | 0.140 | 0.076 | |
| SS2-12 | D3 | sandstone, siltstone, mudstone | 23.639 | 55.439 | 41.990 | 0.061 | 0.111 | 0.081 |
| D2 | 25.728 | 65.654 | 46.740 | 0.059 | 0.104 | 0.083 | ||
| Yc3 | volcanic rock | 20.640 | 80.699 | 56.128 | 0.024 | 0.122 | 0.088 | |
| SS2-17 | D2 | sandstone, siltstone, mudstone | 31.085 | 64.533 | 48.266 | 0.065 | 0.099 | 0.084 |
| Yc3 | volcanic rock | 16.286 | 78.809 | 52.937 | 0.025 | 0.121 | 0.076 | |
| SS2-19 | D2 | sandstone, siltstone, mudstone | 40.686 | 66.290 | 52.410 | 0.058 | 0.094 | 0.081 |
| Yc3 | volcanic rock | 23.562 | 76.399 | 56.792 | 0.030 | 0.115 | 0.072 | |
| SS2-21 | D3 | sandstone, siltstone, mudstone | 25.663 | 50.391 | 39.496 | 0.069 | 0.112 | 0.089 |
| D2 | 30.892 | 62.837 | 47.871 | 0.044 | 0.107 | 0.083 | ||
| Yc4 | tuffaceous coarse sandstone | 33.549 | 66.811 | 48.563 | 0.027 | 0.089 | 0.071 | |
| Yc3 | volcanic rock | 31.879 | 76.338 | 54.384 | 0.048 | 0.115 | 0.072 | |
| SS2-25 | D2 | sandstone, siltstone, mudstone | 21.315 | 59.377 | 48.470 | 0.062 | 0.110 | 0.080 |
| Yc3 | volcanic rock | 27.908 | 78.402 | 59.877 | 0.053 | 0.108 | 0.073 | |
| SS202 | D4 | sandstone, siltstone, mudstone | 14.214 | 57.479 | 37.595 | 0.027 | 0.125 | 0.087 |
| D3 | 15.034 | 60.690 | 43.403 | 0.040 | 0.133 | 0.082 | ||
| D2 | 34.911 | 58.029 | 47.125 | 0.063 | 0.097 | 0.082 | ||
| Yc3 | volcanic rock | 53.389 | 80.319 | 71.835 | 0.062 | 0.083 | 0.070 | |
| SS203 | D2 | sandstone, siltstone, mudstone | 24.516 | 63.441 | 39.906 | 0.064 | 0.108 | 0.089 |
| Yc3 | volcanic rock | 16.763 | 118.232 | 60.072 | 0.024 | 0.138 | 0.073 | |
| Fault Name | Density (g/cm3) | Fault Depth (m) | Fault Thickness (m) | Clay Content | Vertical Throw (m) | Fault Dip Angle (°) | Fault Clay Content | Normal Stress on a Fault (MPa) | Displacement Pressure of the Rock inside the Fault (MPa) |
|---|---|---|---|---|---|---|---|---|---|
| F2 | 2.561 | 2818.2 | 58 | 0.45 | 31.11 | 71 | 0.84 | 33.03 | 5.13 |
| F5 | 2.573 | 2811.8 | 49.3 | 0.60 | 31.66 | 80 | 0.93 | 35.51 | 4.83 |
| F11 | 2.953 | 2809 | 39.4 | 0.55 | 25.86 | 68 | 0.84 | 45.09 | 4.86 |
| Fault | Adjacent Well | Dip Angle | Location | Current State | Maximum Formation Stress Modulus (SG) | Maximum Formation Stress (MPa) | Depth |
|---|---|---|---|---|---|---|---|
| F3 | SS2-7 | 58 | 65 | stable | 1.59 | 47.5 | 3050 |
| F7 | SS2-12 | 70 | 65 | stable | 1.50 | 43.4 | 2950 |
| F8 | SS2-17 | 86 | 336 | stable | 1.56 | 43.6 | 2850 |
| F17 | SS202 | 52 | 282 | stable | 1.78 | 50.6 | 2900 |
| F11 | SS202 | 68 | 90 | stable | 1.80 | 50.3 | 2850 |
| F22 | SS2-25 | 62 | 44 | stable | 1.54 | 45.3 | 3000 |
| F40 | SS2-25 | 60 | 60 | stable | 1.29 | 37.9 | 3000 |
| F259 | SS2-5 | 65 | 280 | stable | 1.35 | 40.4 | 3050 |
| F2 | SS2-7 | 71 | 150 | stable | 1.52 | 42.5 | 2850 |
| F329 | SS202 | 62 | 265 | stable | 1.78 | 49.7 | 2850 |
| F365 | SS2-19 | 58 | 242 | stable | 1.30 | 37.7 | 2900 |
| F383 | SS202 | 64 | 118 | stable | 1.73 | 49.2 | 2900 |
| F5 | SS2 | 80 | 340 | stable | 1.29 | 37.9 | 3000 |
Disclaimer/Publisher’s Note: The statements, opinions and data contained in all publications are solely those of the individual author(s) and contributor(s) and not of MDPI and/or the editor(s). MDPI and/or the editor(s) disclaim responsibility for any injury to people or property resulting from any ideas, methods, instructions or products referred to in the content. |
© 2023 by the authors. Licensee MDPI, Basel, Switzerland. This article is an open access article distributed under the terms and conditions of the Creative Commons Attribution (CC BY) license (https://creativecommons.org/licenses/by/4.0/).
Share and Cite
Zhuge, X.; Hong, J.; Wang, C.; Wang, J.; Xia, H. Dynamic Evaluation of Sealing and Site Optimization for Underground Gas Storage in Depleted Gas Reserve: A Case Study. Appl. Sci. 2024, 14, 298. https://doi.org/10.3390/app14010298
Zhuge X, Hong J, Wang C, Wang J, Xia H. Dynamic Evaluation of Sealing and Site Optimization for Underground Gas Storage in Depleted Gas Reserve: A Case Study. Applied Sciences. 2024; 14(1):298. https://doi.org/10.3390/app14010298
Chicago/Turabian StyleZhuge, Xianglong, Jiajun Hong, Cong Wang, Jianping Wang, and Huifen Xia. 2024. "Dynamic Evaluation of Sealing and Site Optimization for Underground Gas Storage in Depleted Gas Reserve: A Case Study" Applied Sciences 14, no. 1: 298. https://doi.org/10.3390/app14010298