Article

Similarity Model Test on Rainfall Scouring Mechanism of High-Speed Railway Subgrade Slope

1
Railway Engineering Research Institute, China Academy of Railway Sciences Corporation Limited, Beijing 100081, China
2
Beijing Tieke Special Engineering Technology Corporation Limited, Beijing 100081, China
3
State Key Laboratory of Intelligent Construction and Healthy Operation & Maintenance of Deep Underground Engineering, School of Mechanics and Civil Engineering, China University of Mining and Technology, Xuzhou 221116, China
*
Author to whom correspondence should be addressed.
Appl. Sci. 2024, 14(1), 244; https://doi.org/10.3390/app14010244
Submission received: 16 November 2023 / Revised: 14 December 2023 / Accepted: 18 December 2023 / Published: 27 December 2023
(This article belongs to the Special Issue Soft Soil Mechanics and Foundation Consolidation)

Abstract

:
The subgrade slope, when exposed to the natural environment for a long time, is easily affected by rainfall scouring, which leads to a large loss of filling materials and soil sliding, affecting the stability of the subgrade slope. In this paper, the model test of a high-speed railway subgrade slope under rainfall scouring was conducted to quantitatively study the occurrence and development process of subgrade slope erosion. Compared with the model test results and the theoretical results, the incipient flow velocity formula of coarse-grained soil was verified. Then, the curve of rainfall intensity varied with the incipient particle size under different rainfall intensities, slope gradients and soil particle grading conditions was analyzed. Results show that during rainfall scouring, the smaller the particle size, the earlier the scouring erosion occurs. In addition, the soil particles on the slope bottom were scoured more severely than those on the slope upper. With the increase in rainfall intensity, slope gradient, and the change in soil particle gradation (removing the minimum particle size), the incipient flow velocity of soil particles on the slope will be reduced. The curve of the rainfall intensity varied with the incipient particle size, which plays an early warning role in the analysis of slope erosion stability and reflects the particle size range of the scouring erosion incipient on the slope surface under different rainfall intensities, providing the basis for the analysis of slope erosion stability and the slope protection design of the high-speed railway subgrade slope.

1. Introduction

The high-speed railway subgrade slope is often exposed to the natural environment for a long time, and is prone to slope landslides and slope erosion under rainfall scouring. There are methods that can be used to evaluate failures on unstable slopes, by considering slope failure mechanisms due to rainfall [1]. Furthermore, the effect of erosion on unstable slopes along with failure mechanisms has been studied [2]. For all of this type of research and its applications, at present, the research on slope landslides induced by rainfall infiltration is relatively mature [3,4,5], clearly stipulated in the technical specification. The Chinese railway code puts forward the calculation method for the overall instability of the slope based on different failure modes, such as circular slip surface, plane slip surface, or broken line slip surface [6]. Additionally, the Japanese code puts forward the calculation method for slope shallow stability based on the reduction in the soil’s shear strength parameters [7]. There is little research on the mechanism instability of subgrade slopes induced by scouring erosion, in which qualitative analysis is common [8]. Guo [9] used empirical formulas to calculate the incipient velocity of slope erosion, but this was not verified by model tests, the reliability of which needs to be improved.
To study the mechanism and development process of slope erosion under rainfall, relevant scholars conducted rainfall scouring erosion model tests [10,11,12,13,14]. Based on the indoor model test, Hu et al. [15] divided the slope shape and the sediment content of the runoff into four erosion processes with significant characteristics, proving that with the increase in slope length or rainfall intensity, the runoff rate and erosion modulus increased linearly. The model test conducted for loess and other special soil slopes [16] provides a comprehensive summary of the evolution process of slope scouring erosion failure. The process begins with splash erosion, followed by sheet erosion, rill erosion, gully erosion, and then collapse. The process displays traction failure characteristics until the slope is destroyed. Artificial rainfall is frequently utilized in model tests [17], with a focus on local rainfall patterns. However, the impact of the lateral infiltration of rainwater and slope deformation in non-rainfall areas on rainfall areas creates a boundary constraint effect. This effect is an essential factor that needs to be considered during the implementation of artificial rainfall models. Kuang [18] analyzed the scouring erosion process and the influencing factors of railway subgrade slopes under natural rainfall in the field test. The results indicate that the runoff generation form of the railway slope is generally super seepage runoff, including the stages from the rainfall beginning to the initial runoff generation, and then to the stable state. The above artificial or natural rainfall experiments have been used to analyze the occurrence and development process of roadbed slope erosion, mainly based on qualitative description, with less quantitative analysis. In addition, combining indicators such as flow velocity, incipient particle size and scouring erosion amount is beneficial for revealing the scouring erosion mechanism and quantitatively characterizing the scouring erosion law for railway roadbed slopes [19]. Model tests are commonly used to study slope instability [17,20]. Due to the frequent use of artificial rainfall erosion in these experiments, which is often limited to the implementation of local rainfall patterns, there is a boundary constraint effect between the rainfall area and the non-rainfall area [21,22,23,24], manifested as the lateral infiltration of rainwater and the lag of slope deformation in the non-rainfall area on the rainfall area. A deep-buried isolation trench test method has been proposed to address these boundary effects [25,26,27].
In this study, indoor rainfall erosion model tests were conducted on railway roadbed slopes with different rainfall intensities, slope gradients, and soil particle sizes, clarifying the erosion mechanism of small particle sizes starting first and large particle sizes starting later on the slope surface. The erosion process on the slope was studied by analyzing factors such as the initial velocity and the amount of erosion. This analysis allowed us to quantify the process and validate the theoretical formula for the incipient velocity of soil particles on the slope. Additionally, this study revealed the impact of rainfall intensity, slope gradient, and soil particle size on slope scouring erosion. The relationship between rainfall intensity and particle size under different working conditions was verified, providing a basis for the analysis of slope scouring erosion stability and the slope protection design of the high-speed railway subgrade slope.

2. Materials and Methods

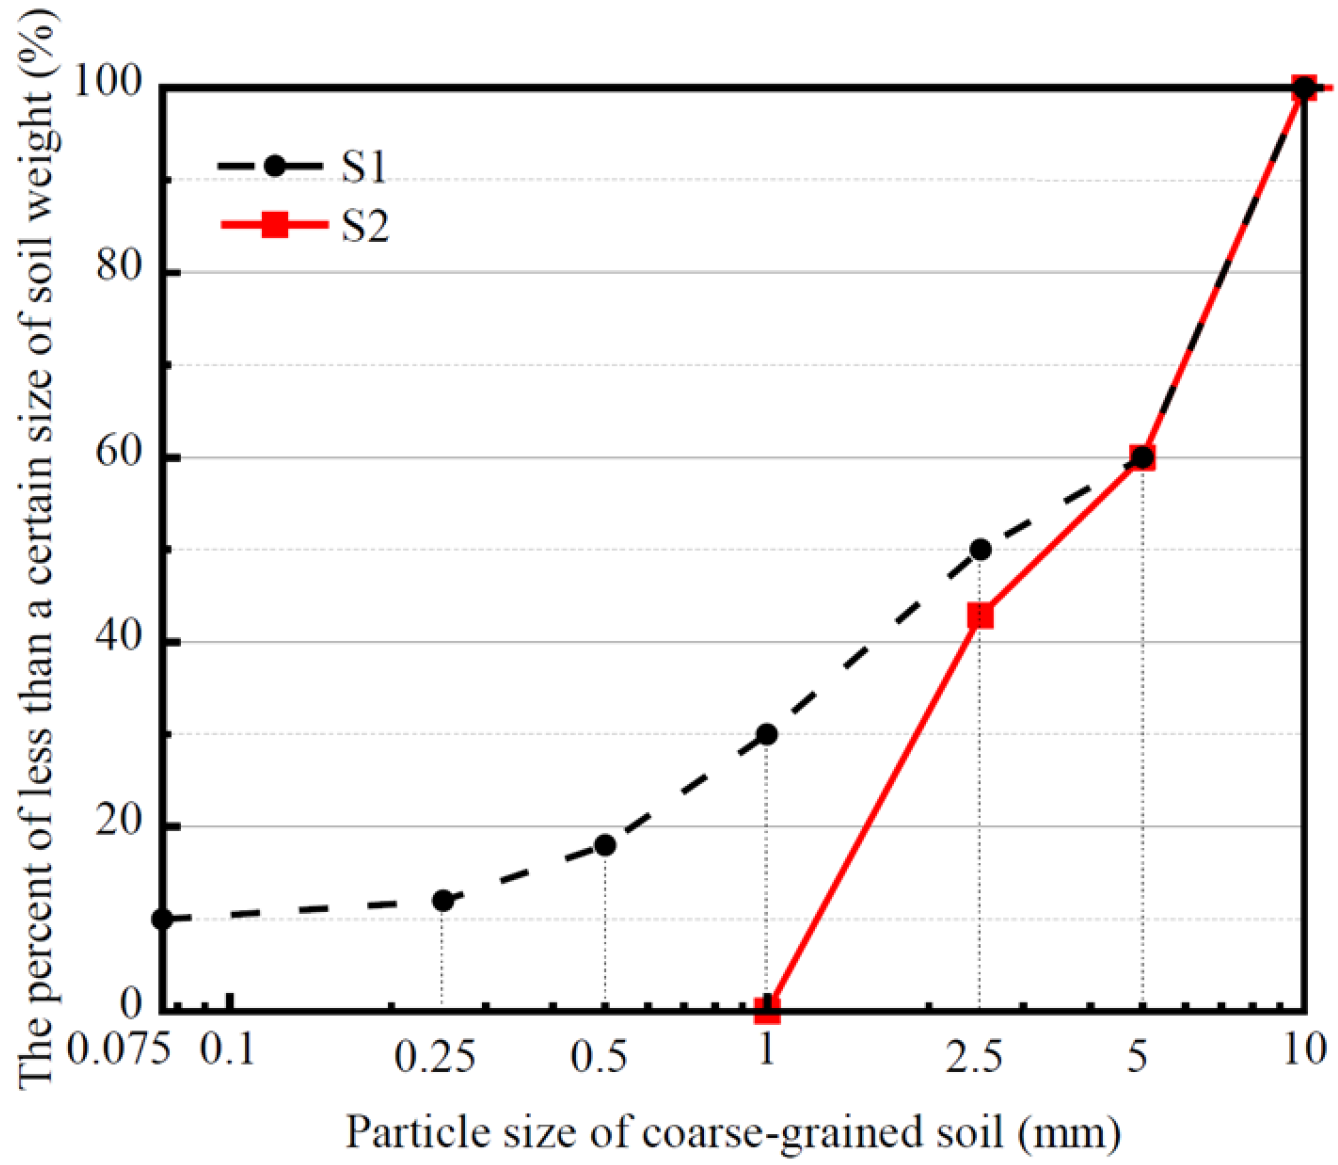
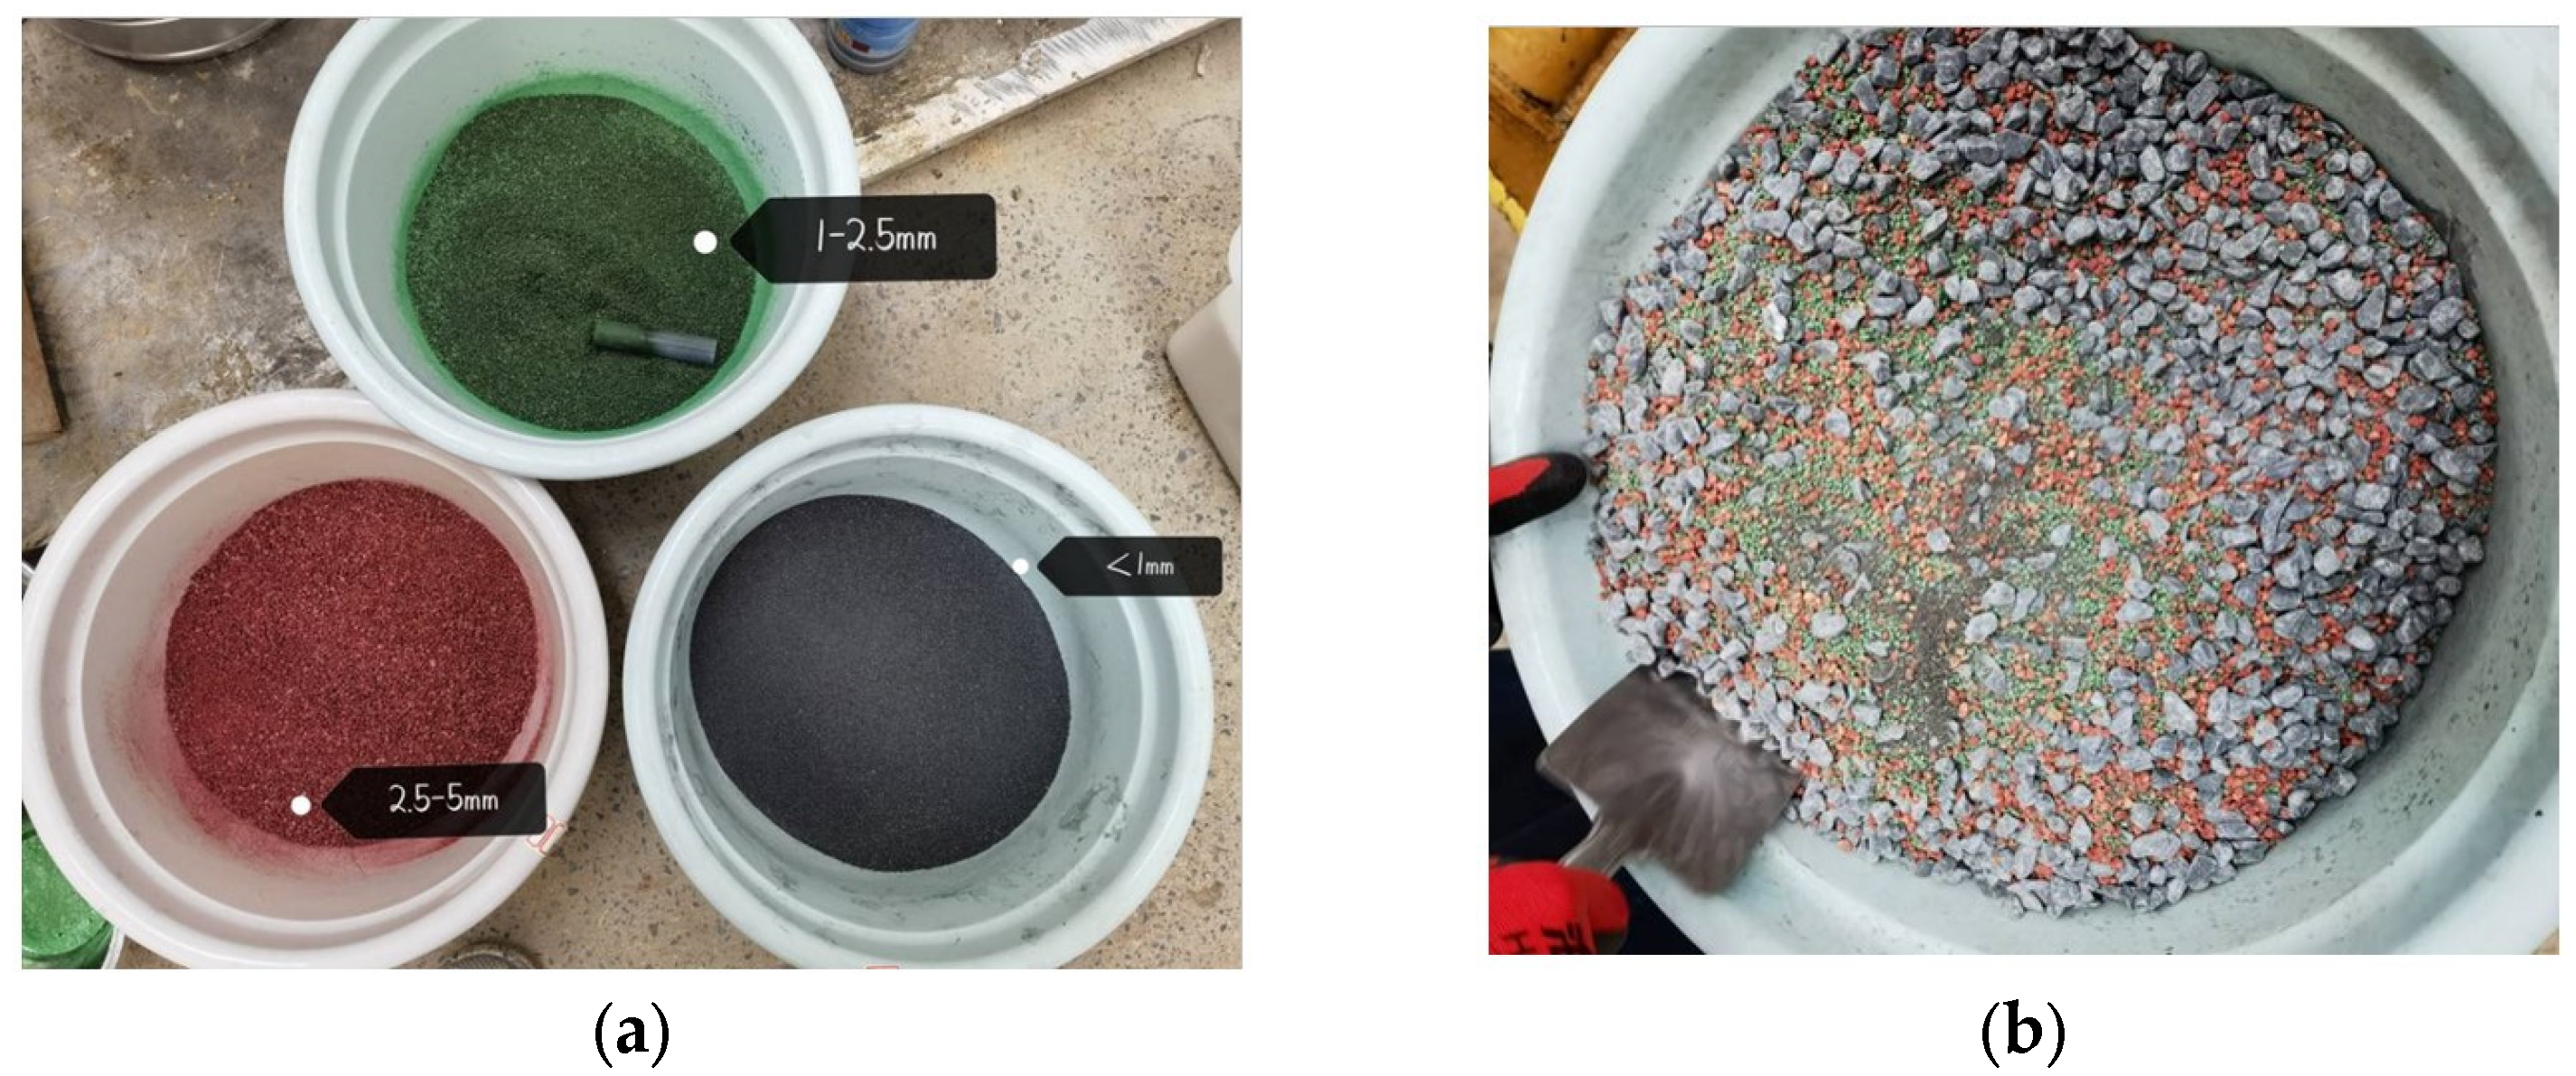
2.1. The Materials of the Model Test

The strongbox shown in Figure 1, used for the model test, has dimensions of 1800 mm × 800 mm × 1400 mm in length, width and height, respectively. Referring to the “Code for Design of Railway Earth Structure” (TB10001-2016) [6], grading curves of coarse-grained soil, used to study the impact of particles of less than 1 mm, are divided into two groups, S1 and S2, as shown in Figure 2. According to the grading characteristics of coarse-grained soil, model test fillers, which are screened and then grouped for dyeing treatment, are configured, as shown in Figure 3. The soil particle size groups 0.075–1 mm, 1–2.5 mm, 2.5–5 mm, and 5–10 mm were stained and labeled as R1, R2, R3, and R4 in black, green, red, and gray, respectively. The percentages of R1, R2, R3, and R4 consist with the grading curve in Figure 2.
The physical and mechanical properties of the soils for the model test are summarized in Table 1 [28]. According to similarity theory, the physical size of the subgrade slope is scaled to 1/5.
When rainfall converges on the subgrade slope for scouring erosion, the time required for the rainwater to flow from the top to the slope foot is relatively short, usually minutes. Thus, mm/min is utilized as the dimension. The electronic flow meter controls the artificial rainfall change between light rain, moderate rain, and rainstorm, with intensities of 0.5 mm/min, 1.0 mm/min, and 1.5 mm/min, respectively [9]. The groups for the model test are summarized in Table 2.

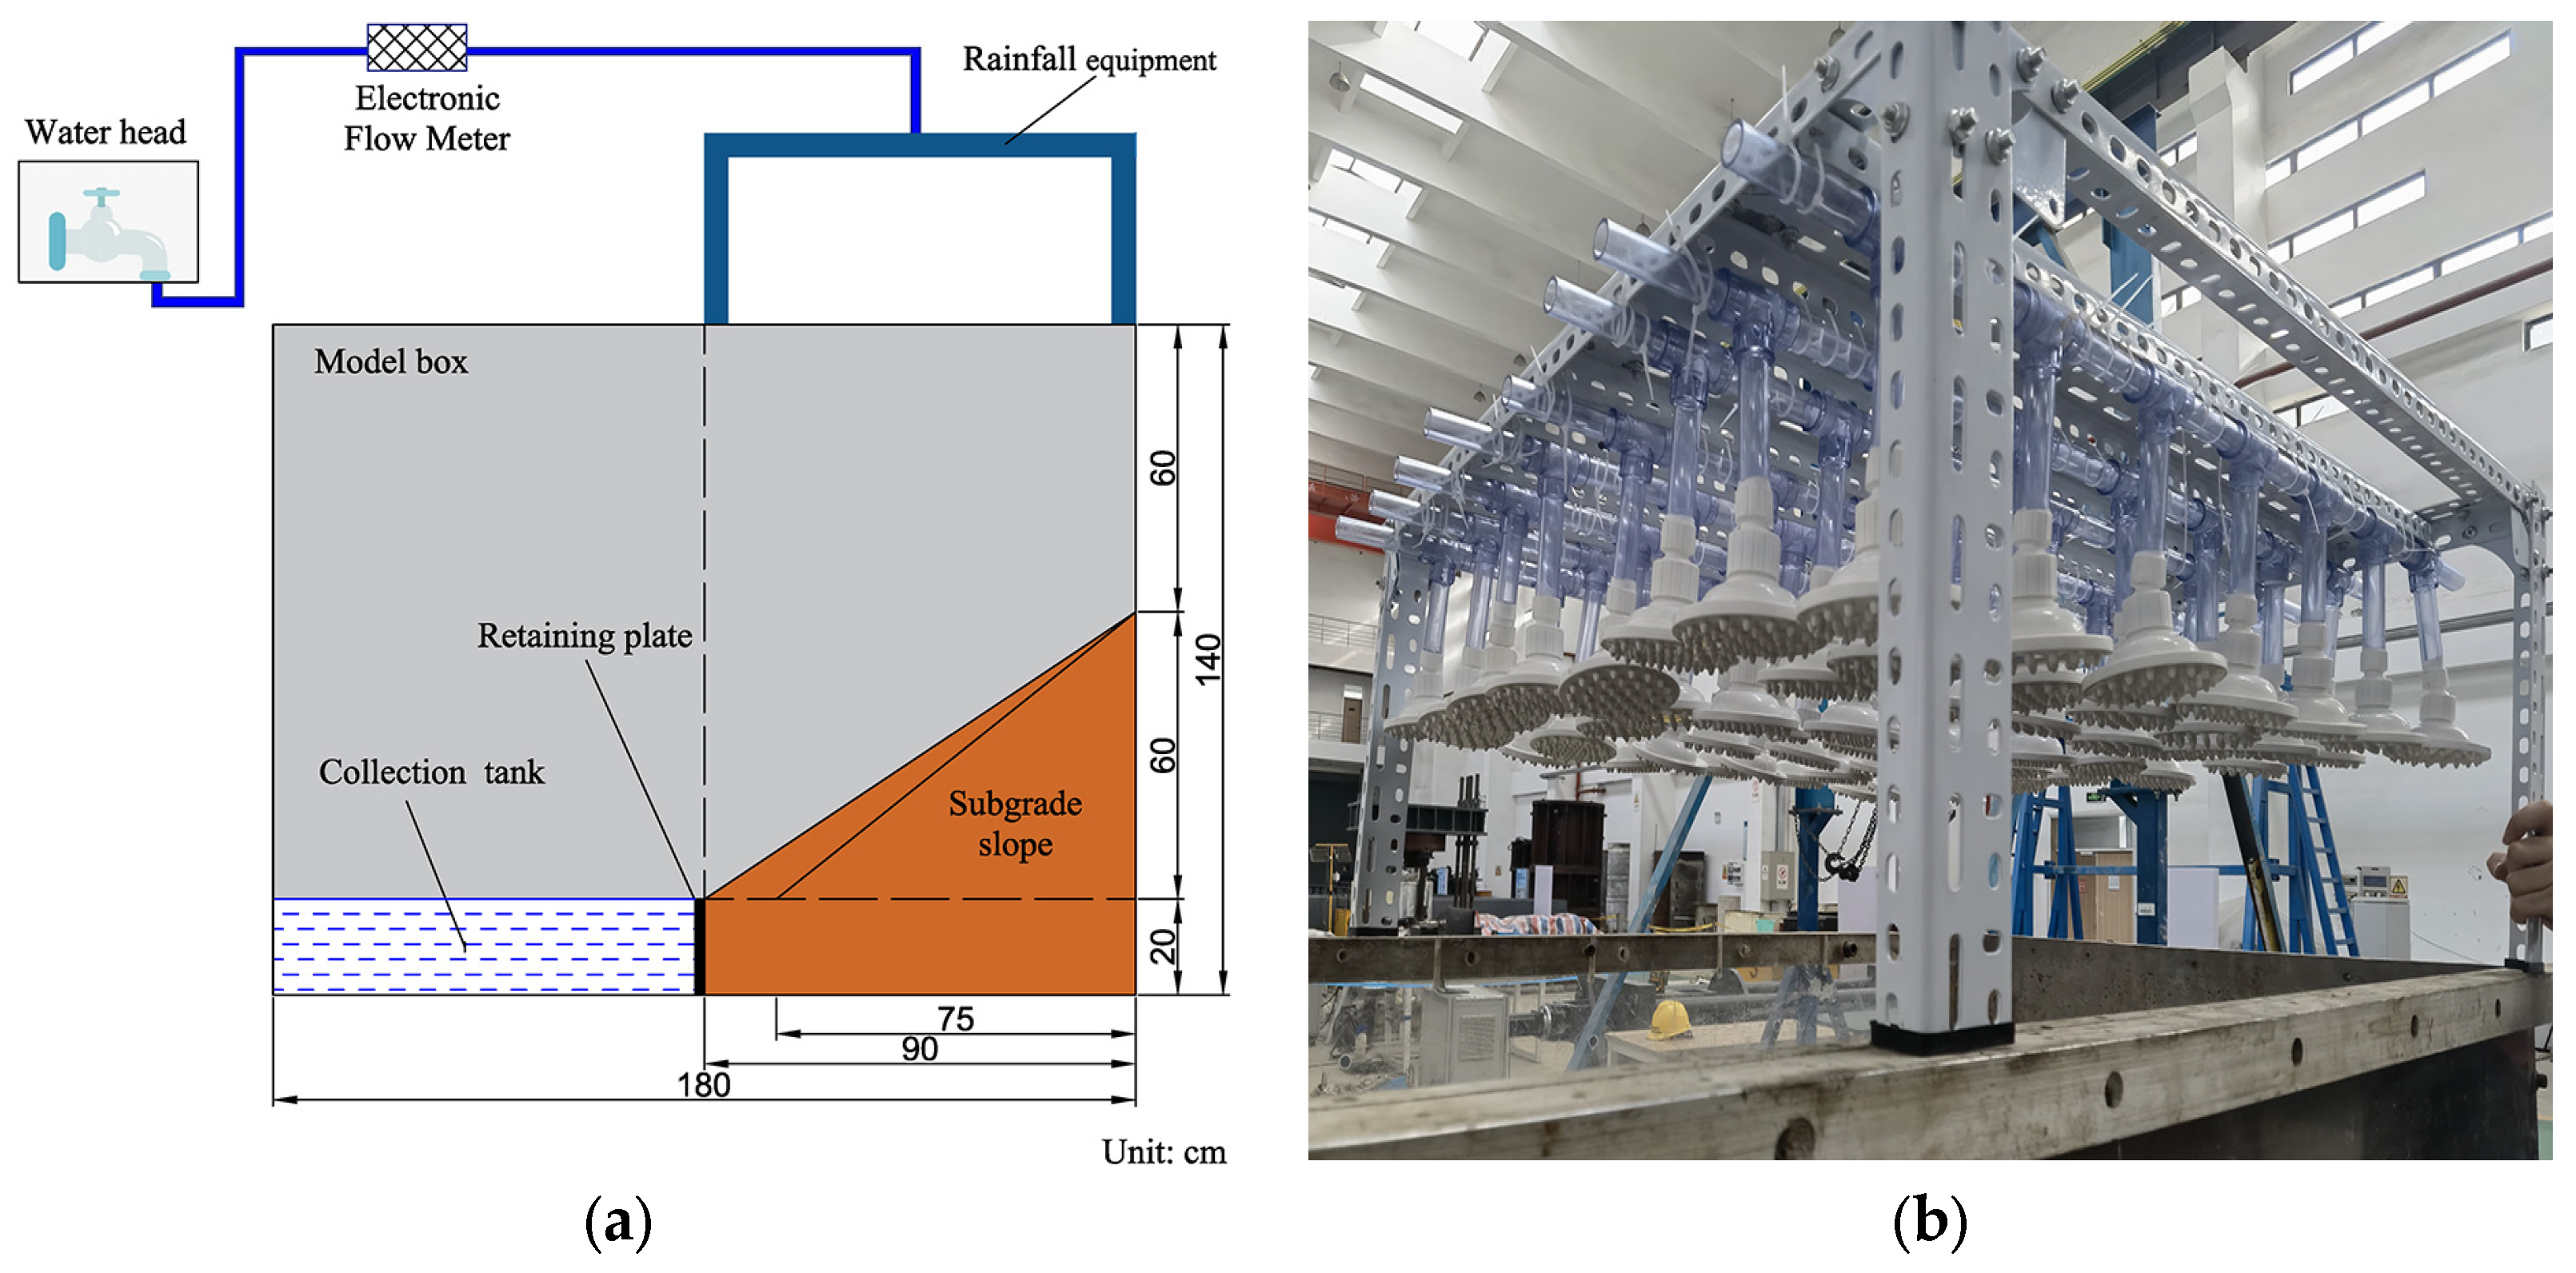
2.2. The Method of the Model Test

The slope-building process is made up of layer-by-layer slope building, slope cutting, compaction and laying a dyed layer, as shown in Figure 4. Please note that the prepared coarse-grained soil should be mixed according to the optimal moisture content needed to reach the optimal state, and then filled in layers of 10 cm in thickness into the model box. When filling in layers, we used a rammer to compact, with a compaction coefficient K of 0.95, to ensure that the compaction requirements for subgrade slope building were met. Finally, we compacted the dyeing layer to keep the thickness of 2 cm.
The procedures of the model test were as follows:
(1)
Debug the rainfall device to reach the target rainfall intensity;
(2)
Record the time of runoff generation with a stopwatch;
(3)
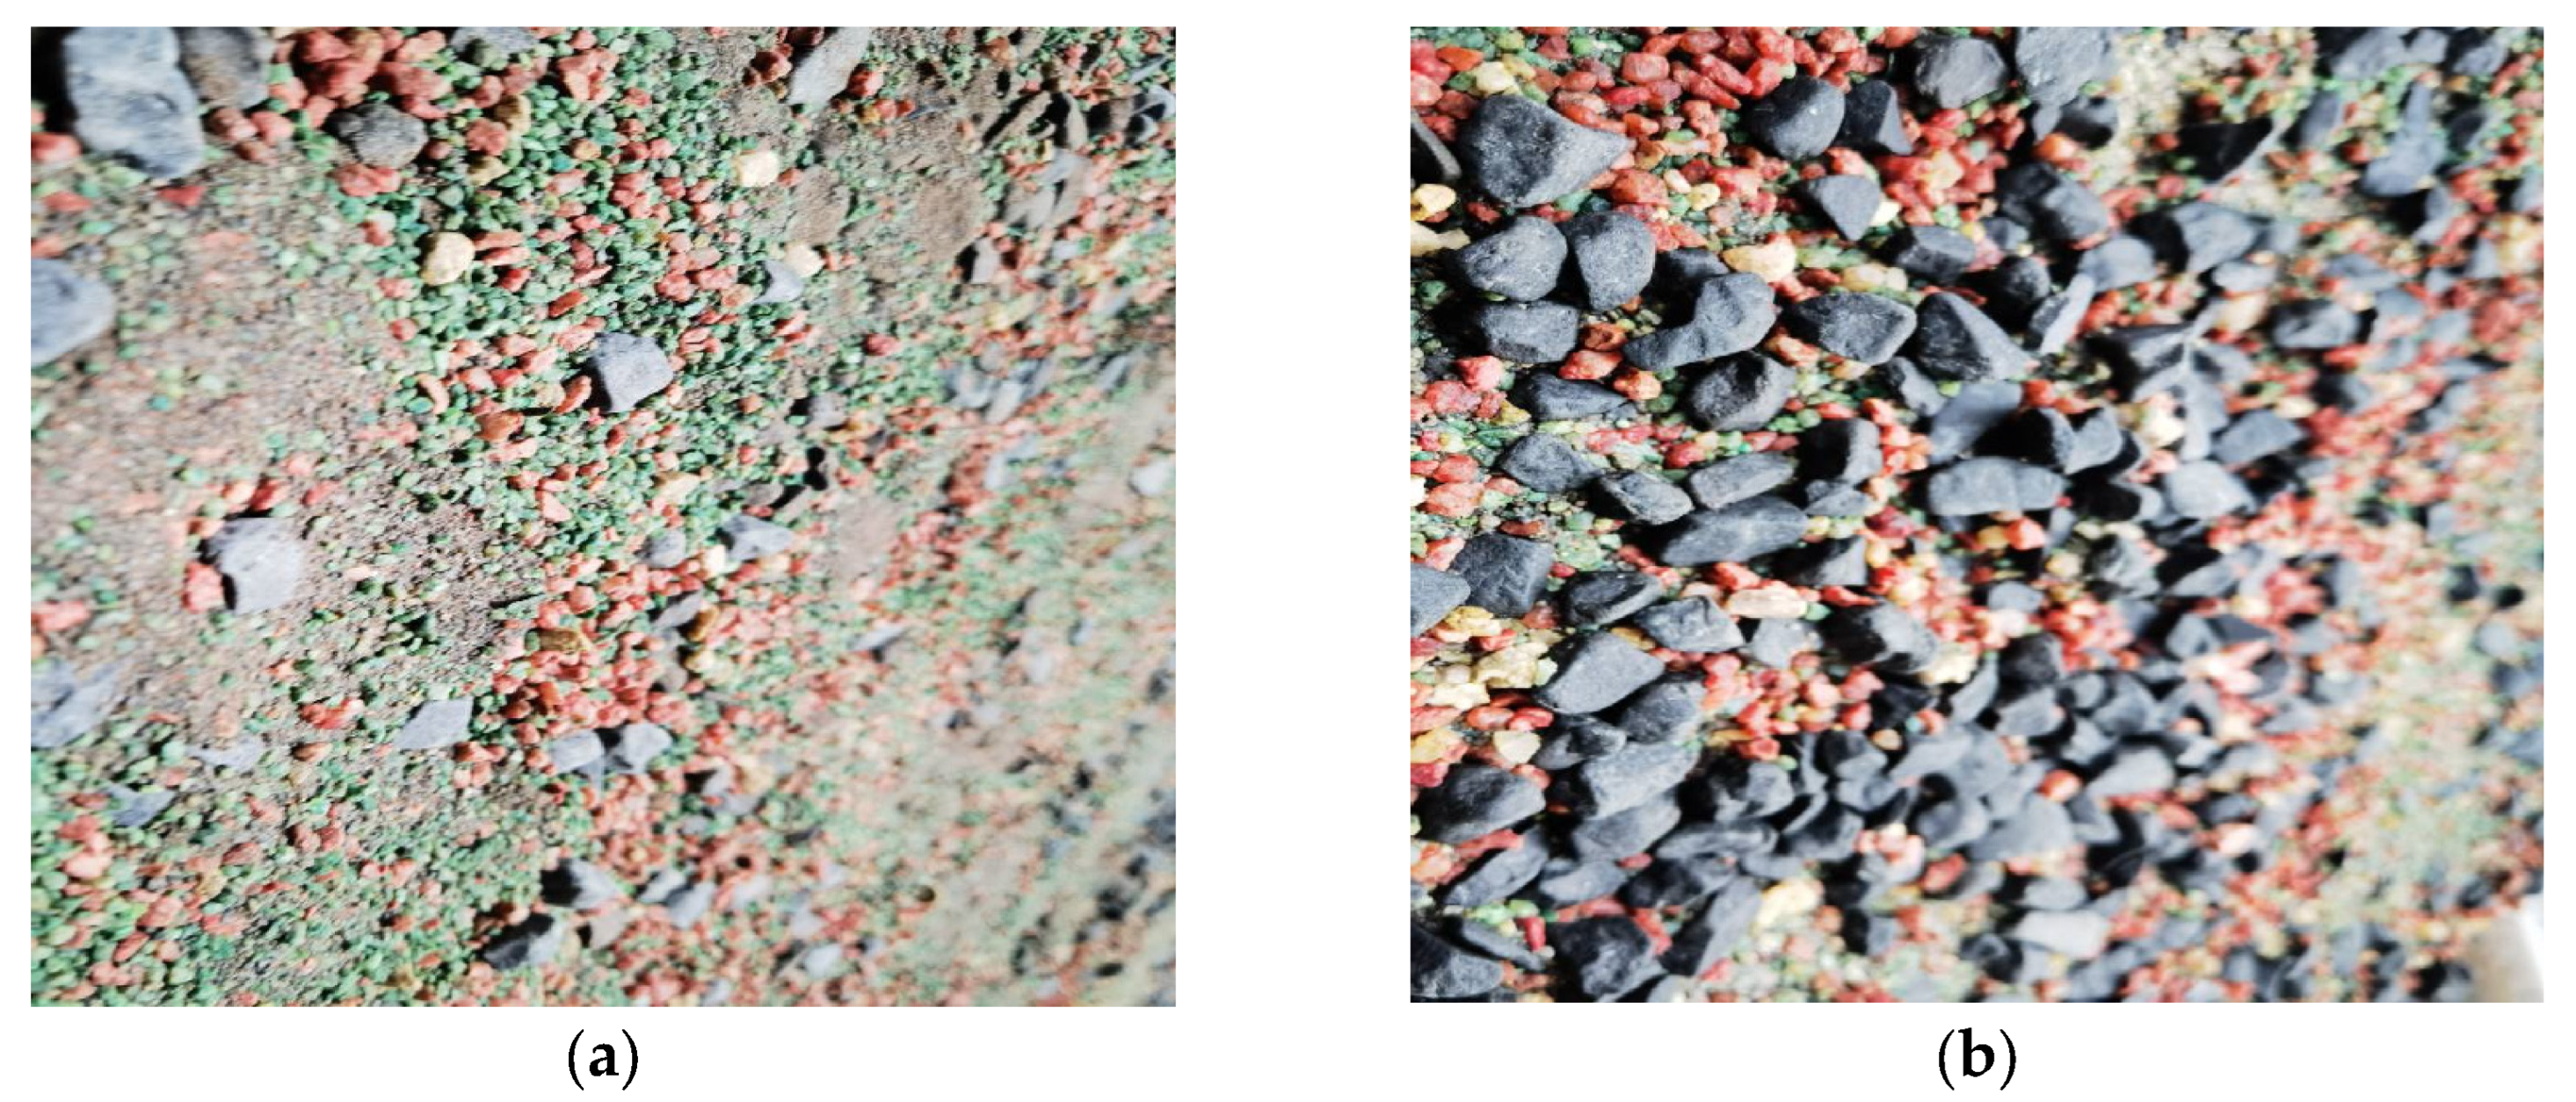
When observing the start-up of dyed soil particles on the slope, record the color of the start-up particle size and the flow velocity using the dye tracer method as the incipient flow velocity for this size of soil particle. The flow velocity was measured by the dye tracer method, and the water depth was measured by a water level probe;
(4)
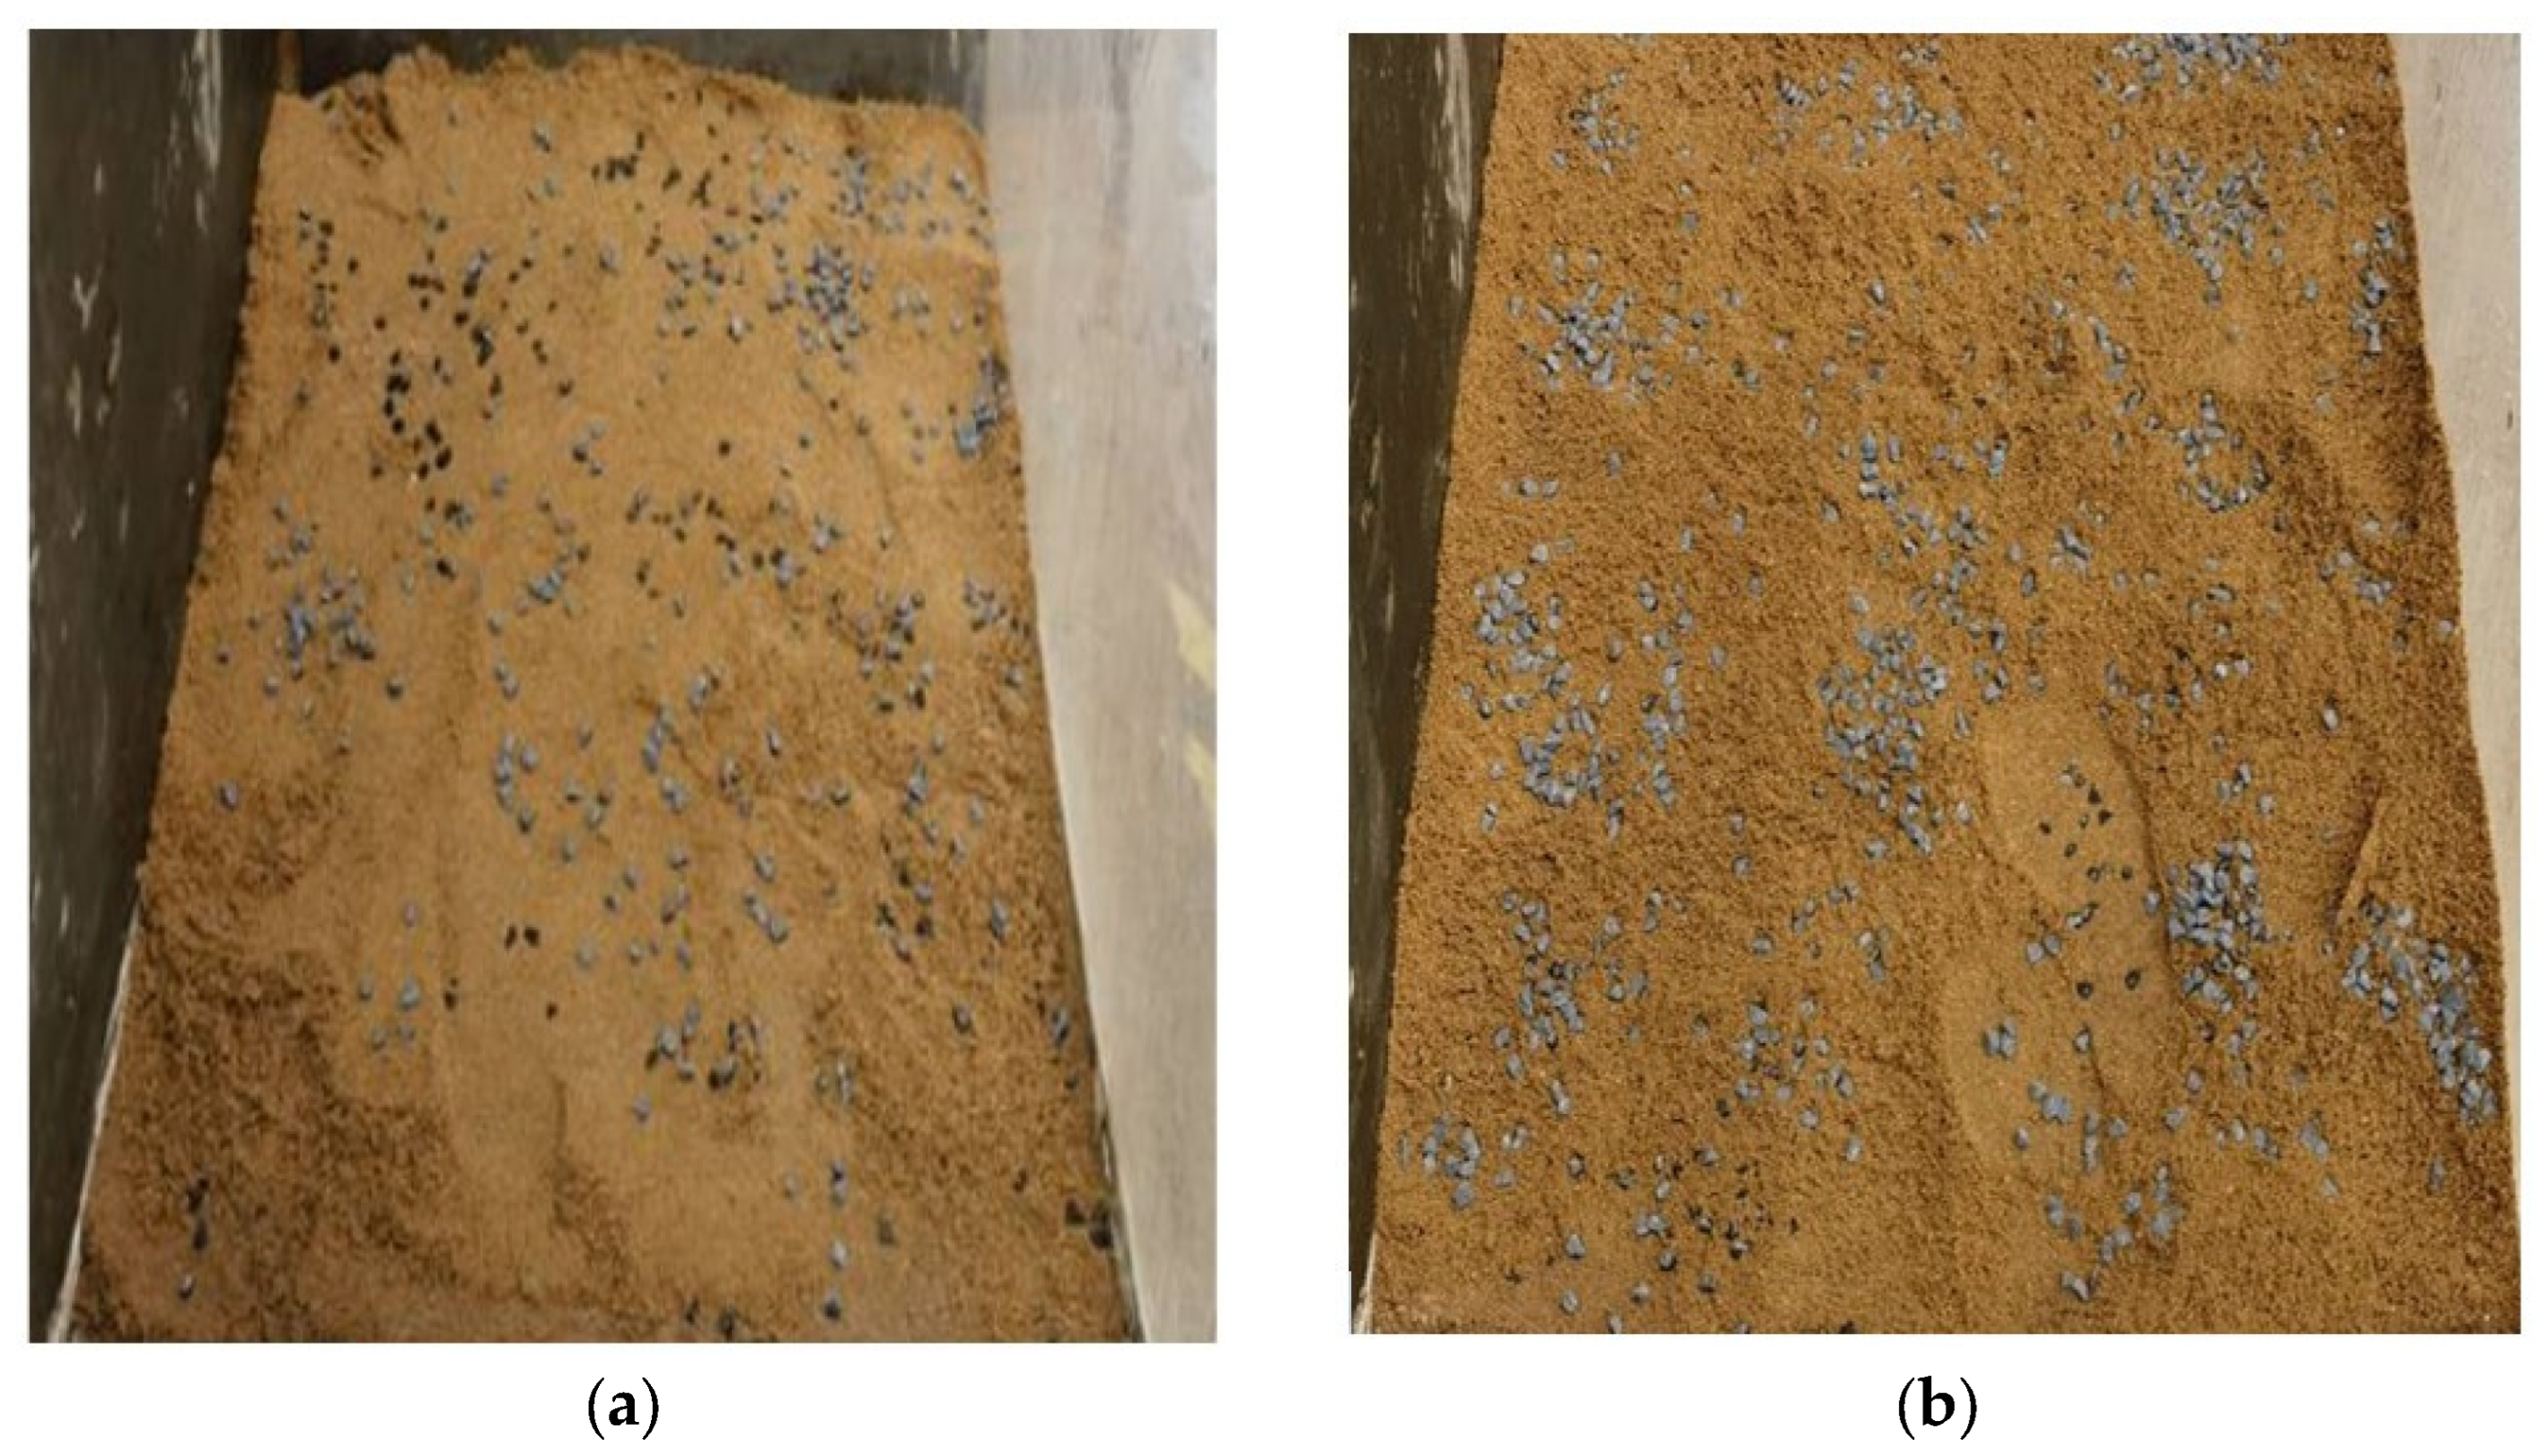
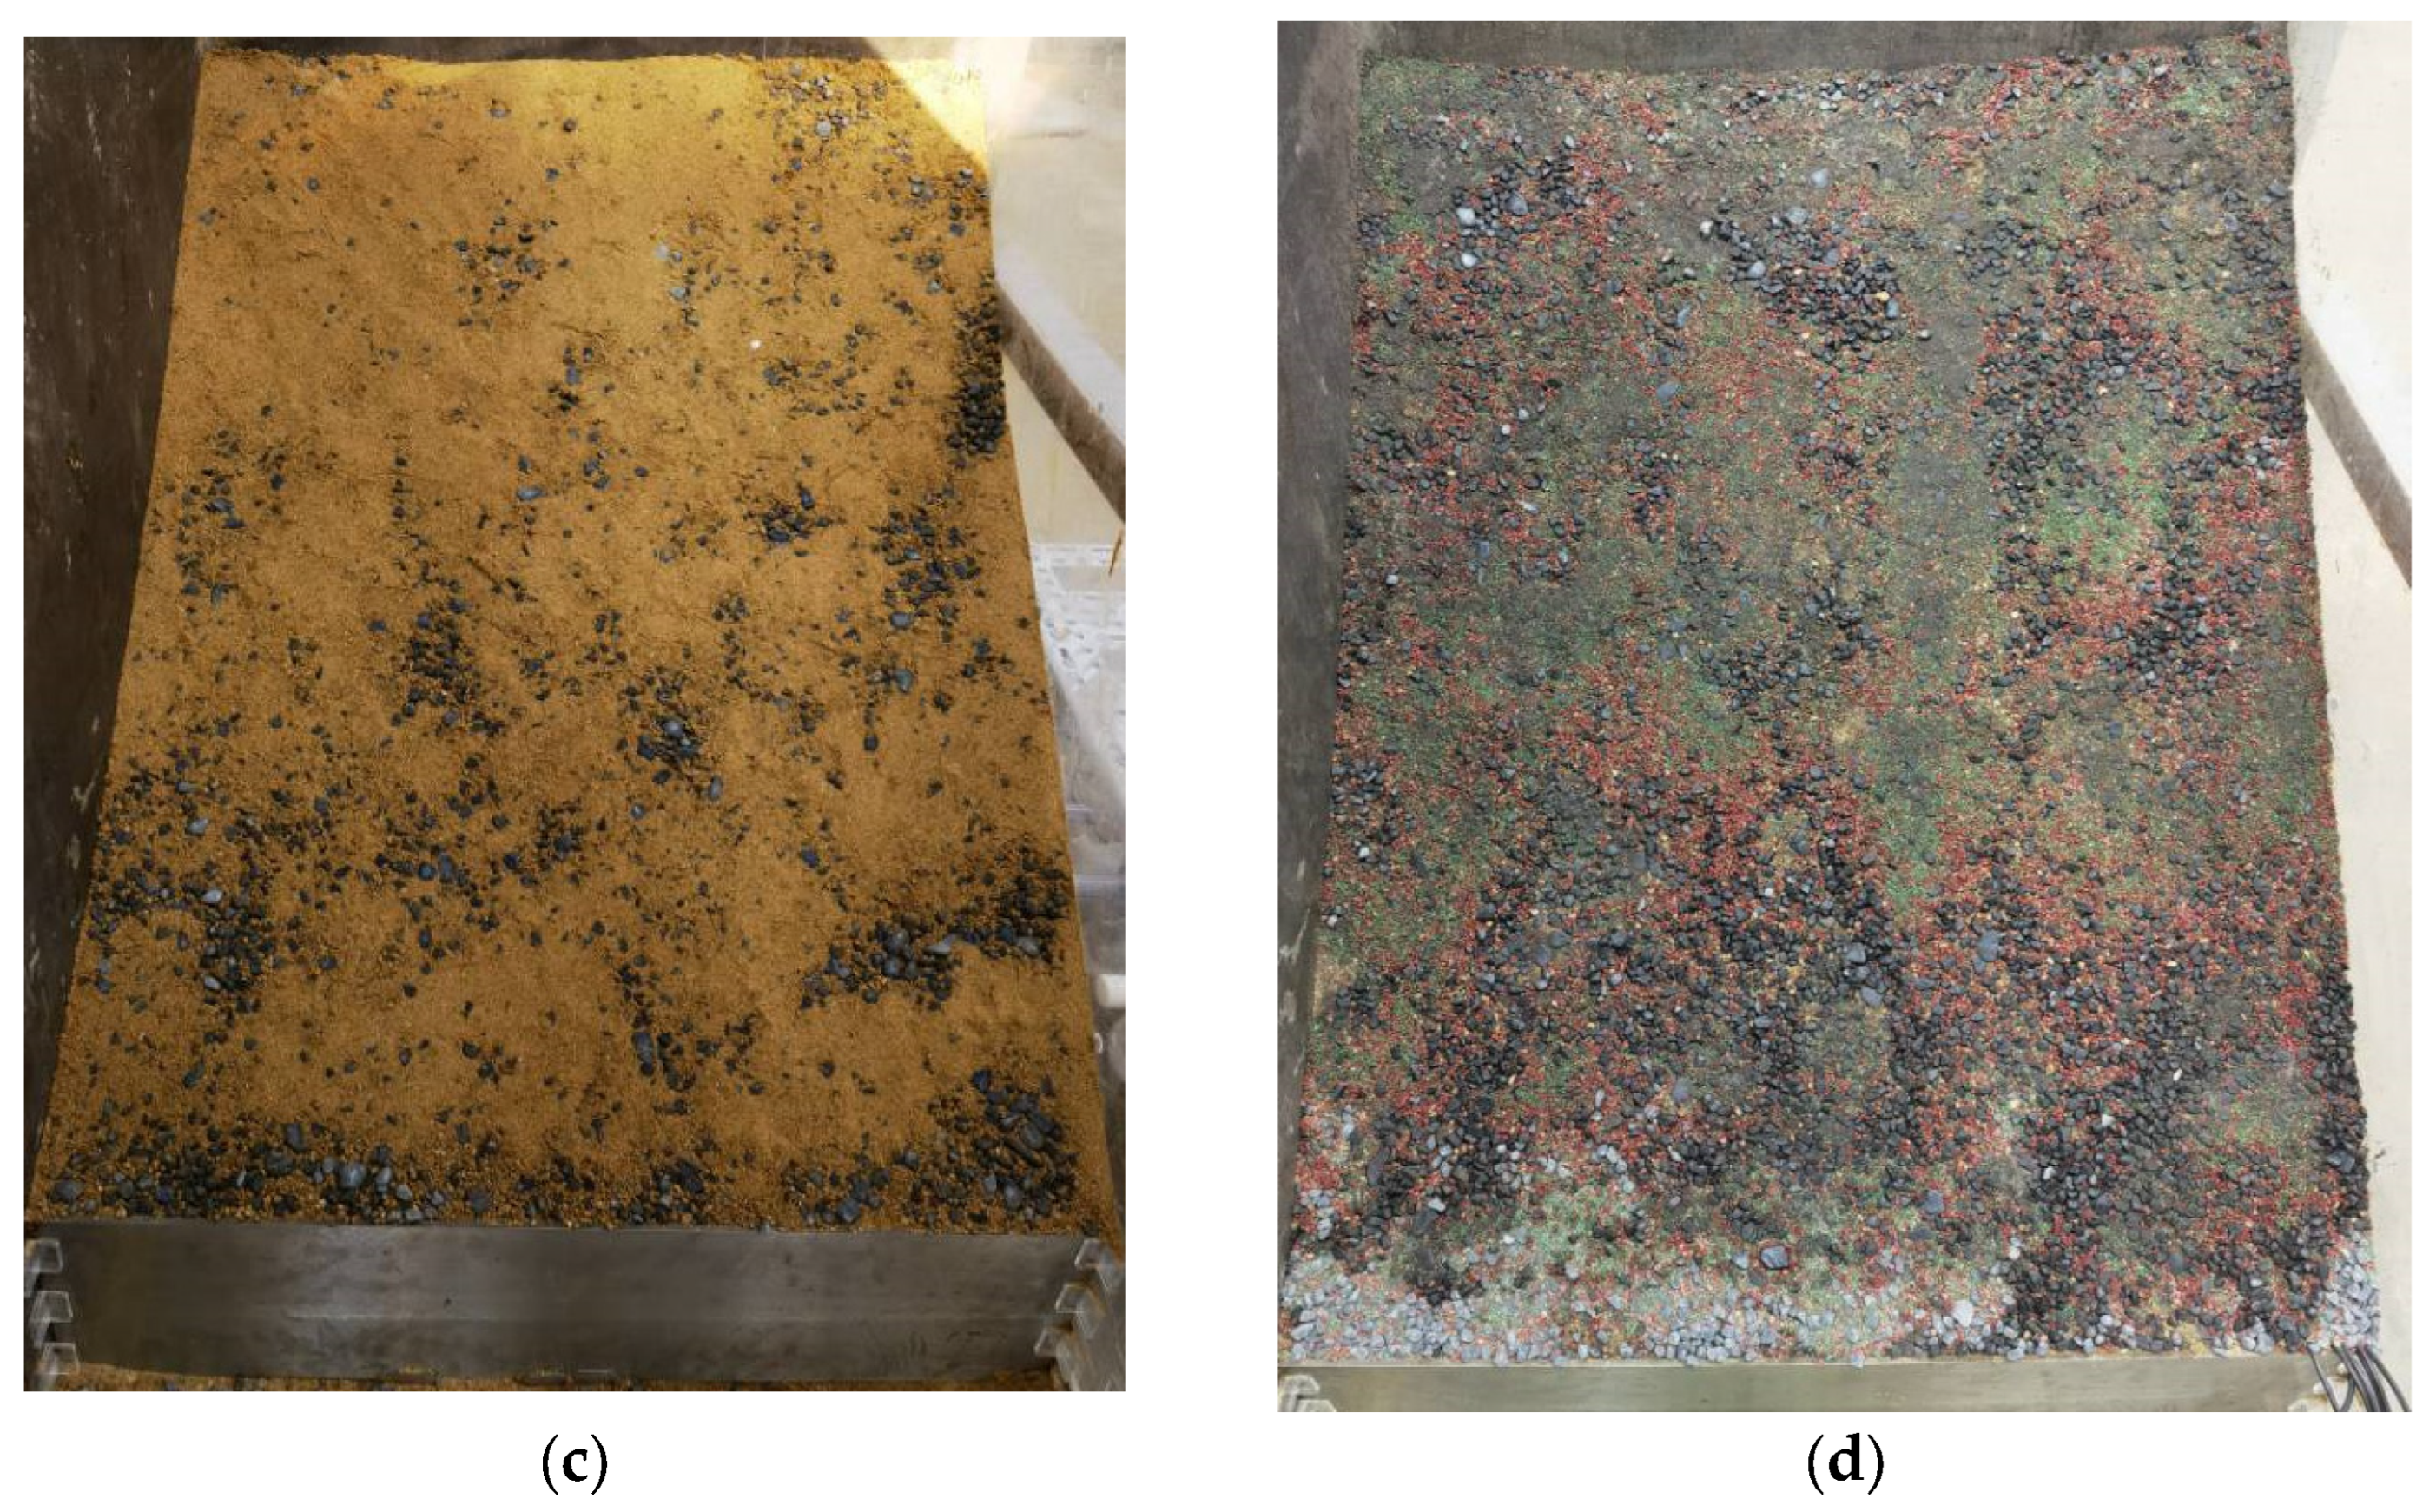
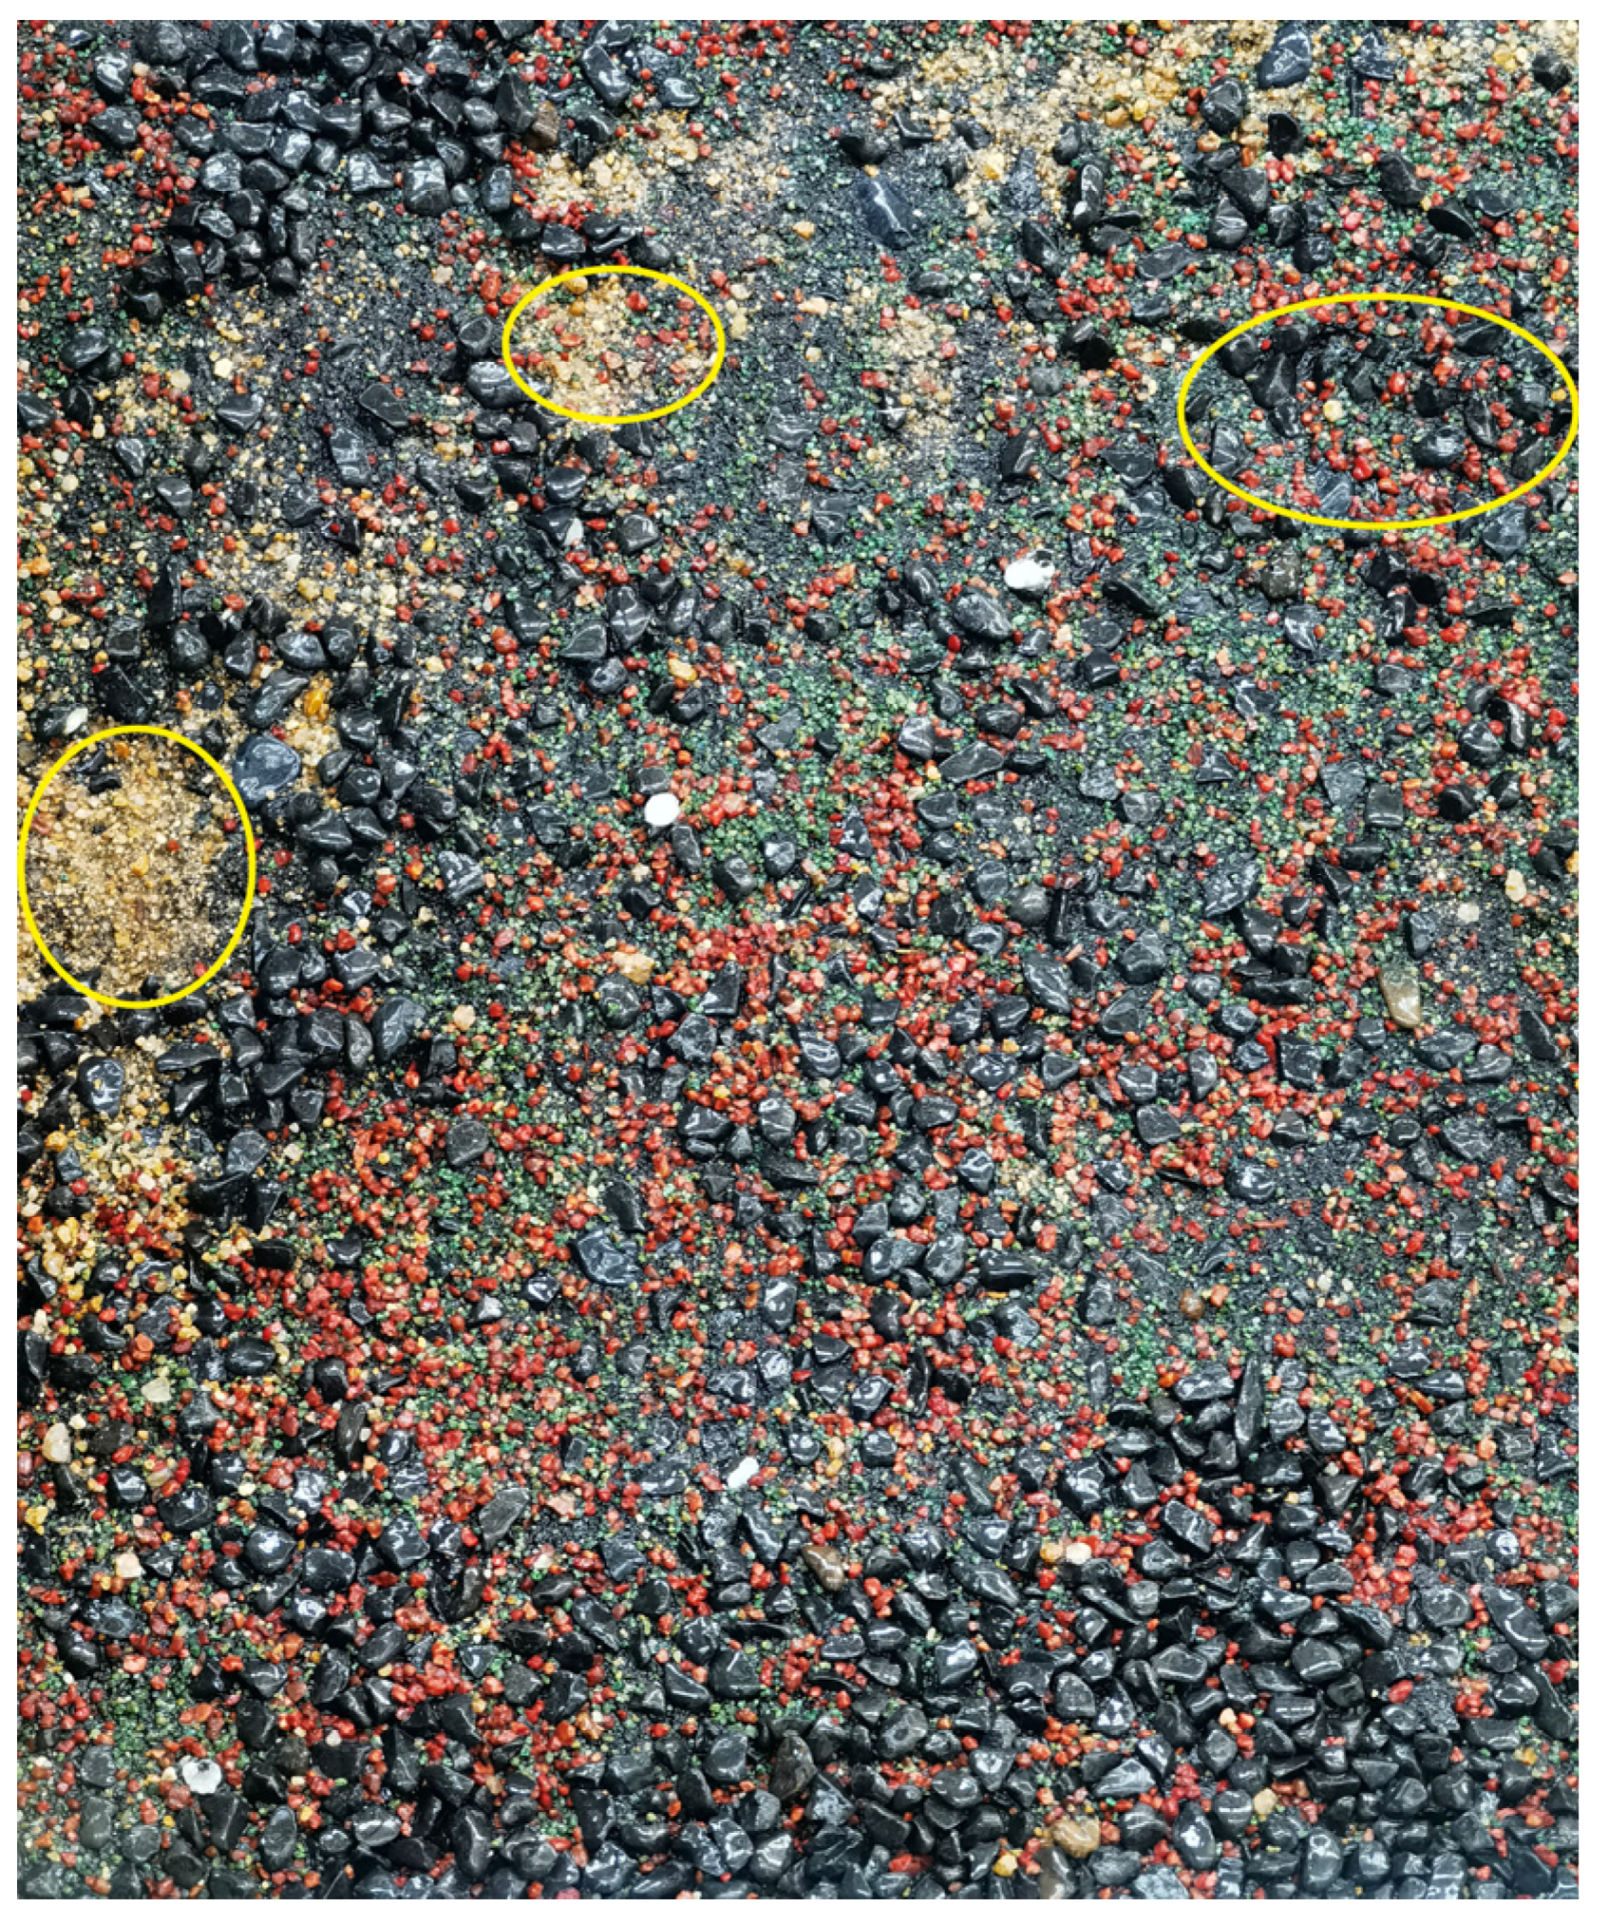
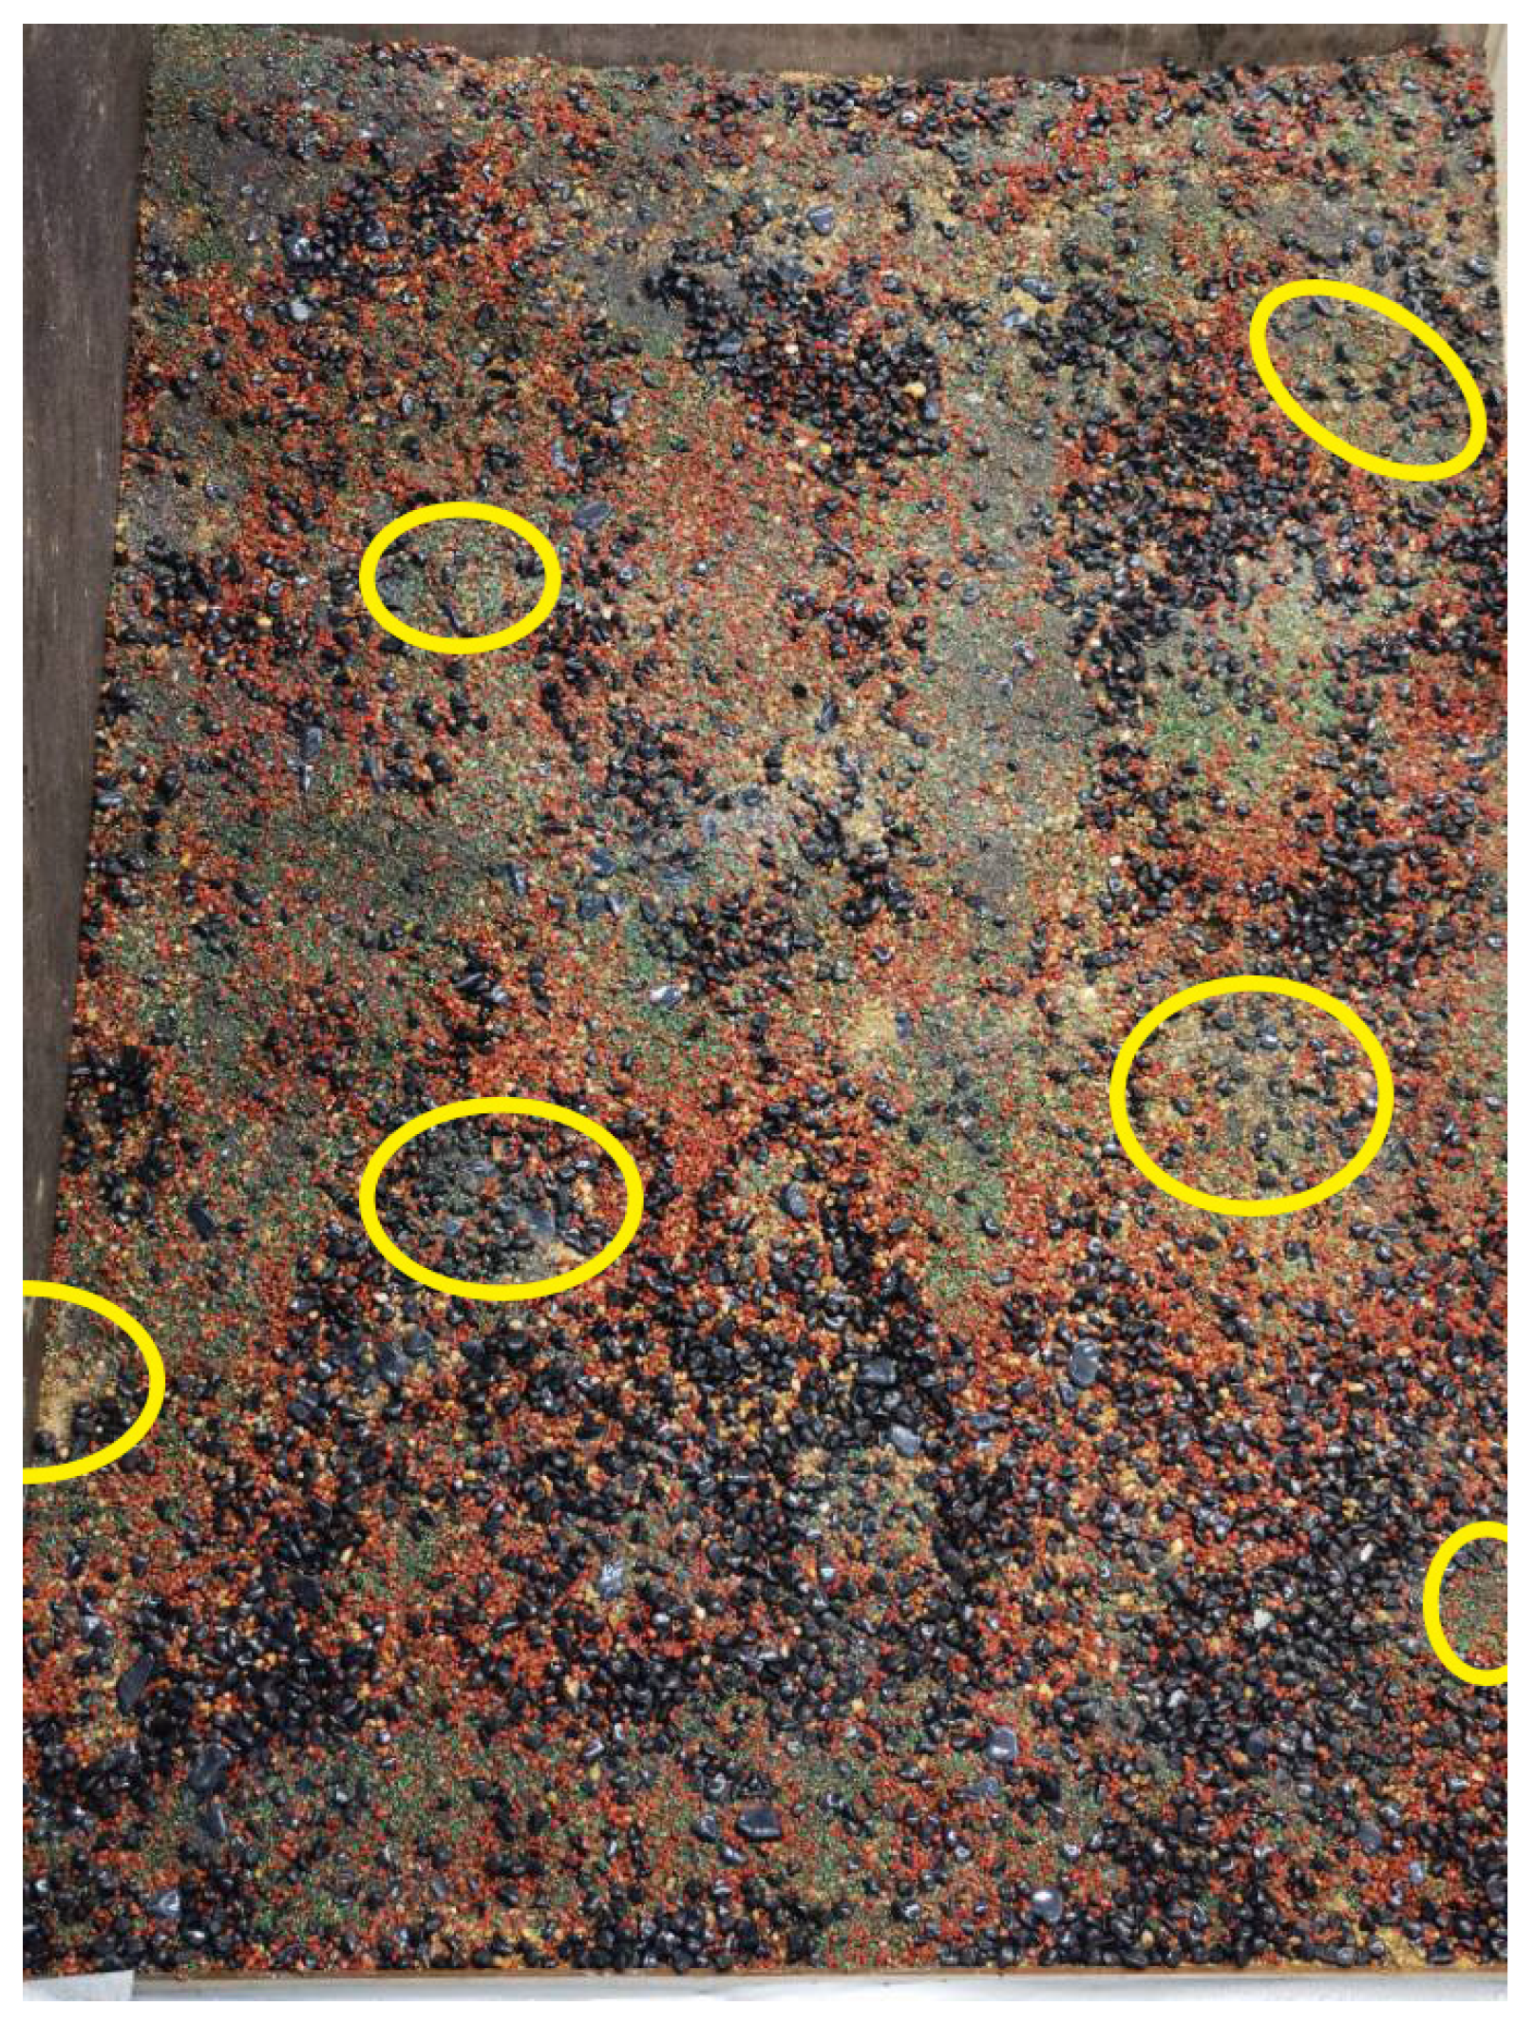
Every 8 min, record the slope scouring erosion patterns at different stages with the digital camera. After 40 min, turn off the water supply and collect the washed soil. Then, dry the collected soil and measure its size. After finishing one test group, weigh the total collected soil as the erosion quantity.
(5)
Carry out the next group of tests.

3. Test Results and Discussions

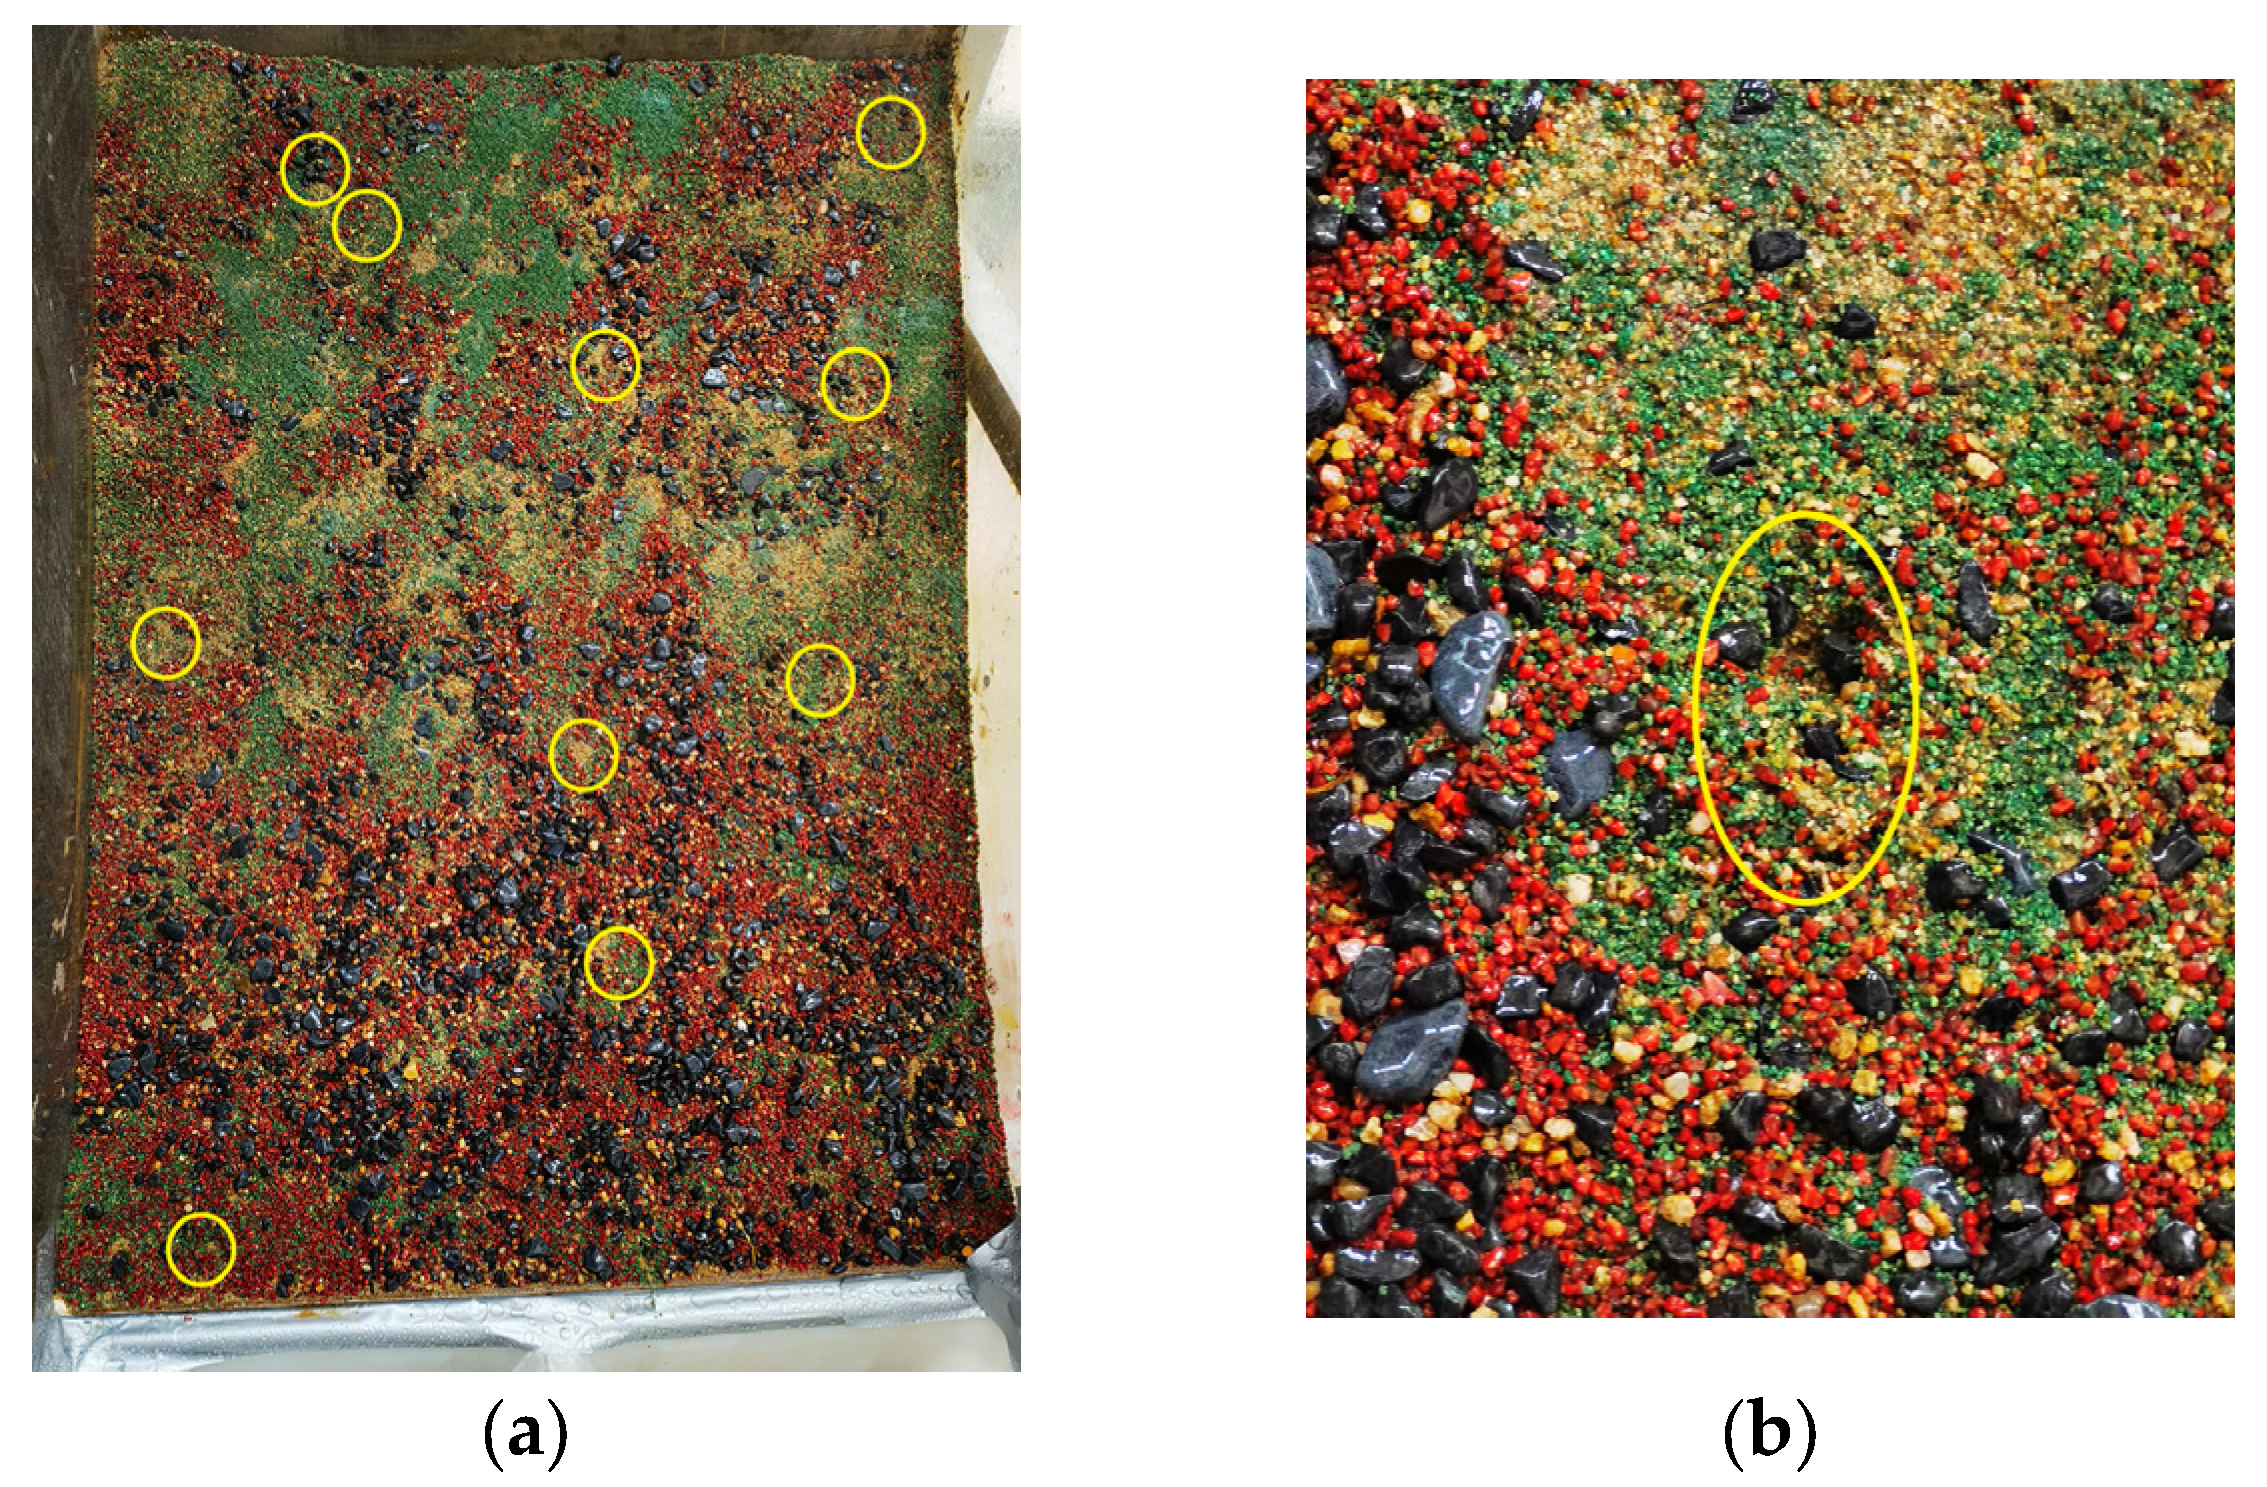
3.1. Occurrence and Development Process of Subgrade Slope Erosion of G1

The flow accelerated along the slope, scouring and transporting the soil particles in the loose area of the slope foot-first. Meanwhile, with the increase in ponding, the soil particles in the upper part of the slope would be transported to the scoured area at the lower part after scouring. This cycle formed an arc-shaped scouring and transportation mode on the slope, further inducing large-scale erosion such as sheet erosion and gully scouring erosion on the slope. Due to the low rainfall intensity in G1, no obvious scouring erosion occurred in the first 22 min. Until 22 min 15 s, it was observed that the particles were transported locally and gradually formed sheet erosion, as shown in Figure 5.
Under a rainfall intensity of 0.5 mm/min, as a small particle size group, R1 was scoured and transported first. Due to the increase in ponding and flow velocity, R2 experienced some degree of scouring erosion on its surface. The incipient flow velocity for R2 was 38.4% higher than R1, with the scour amount being 36.7% lower than the R1 group, as summarized in Table 3.

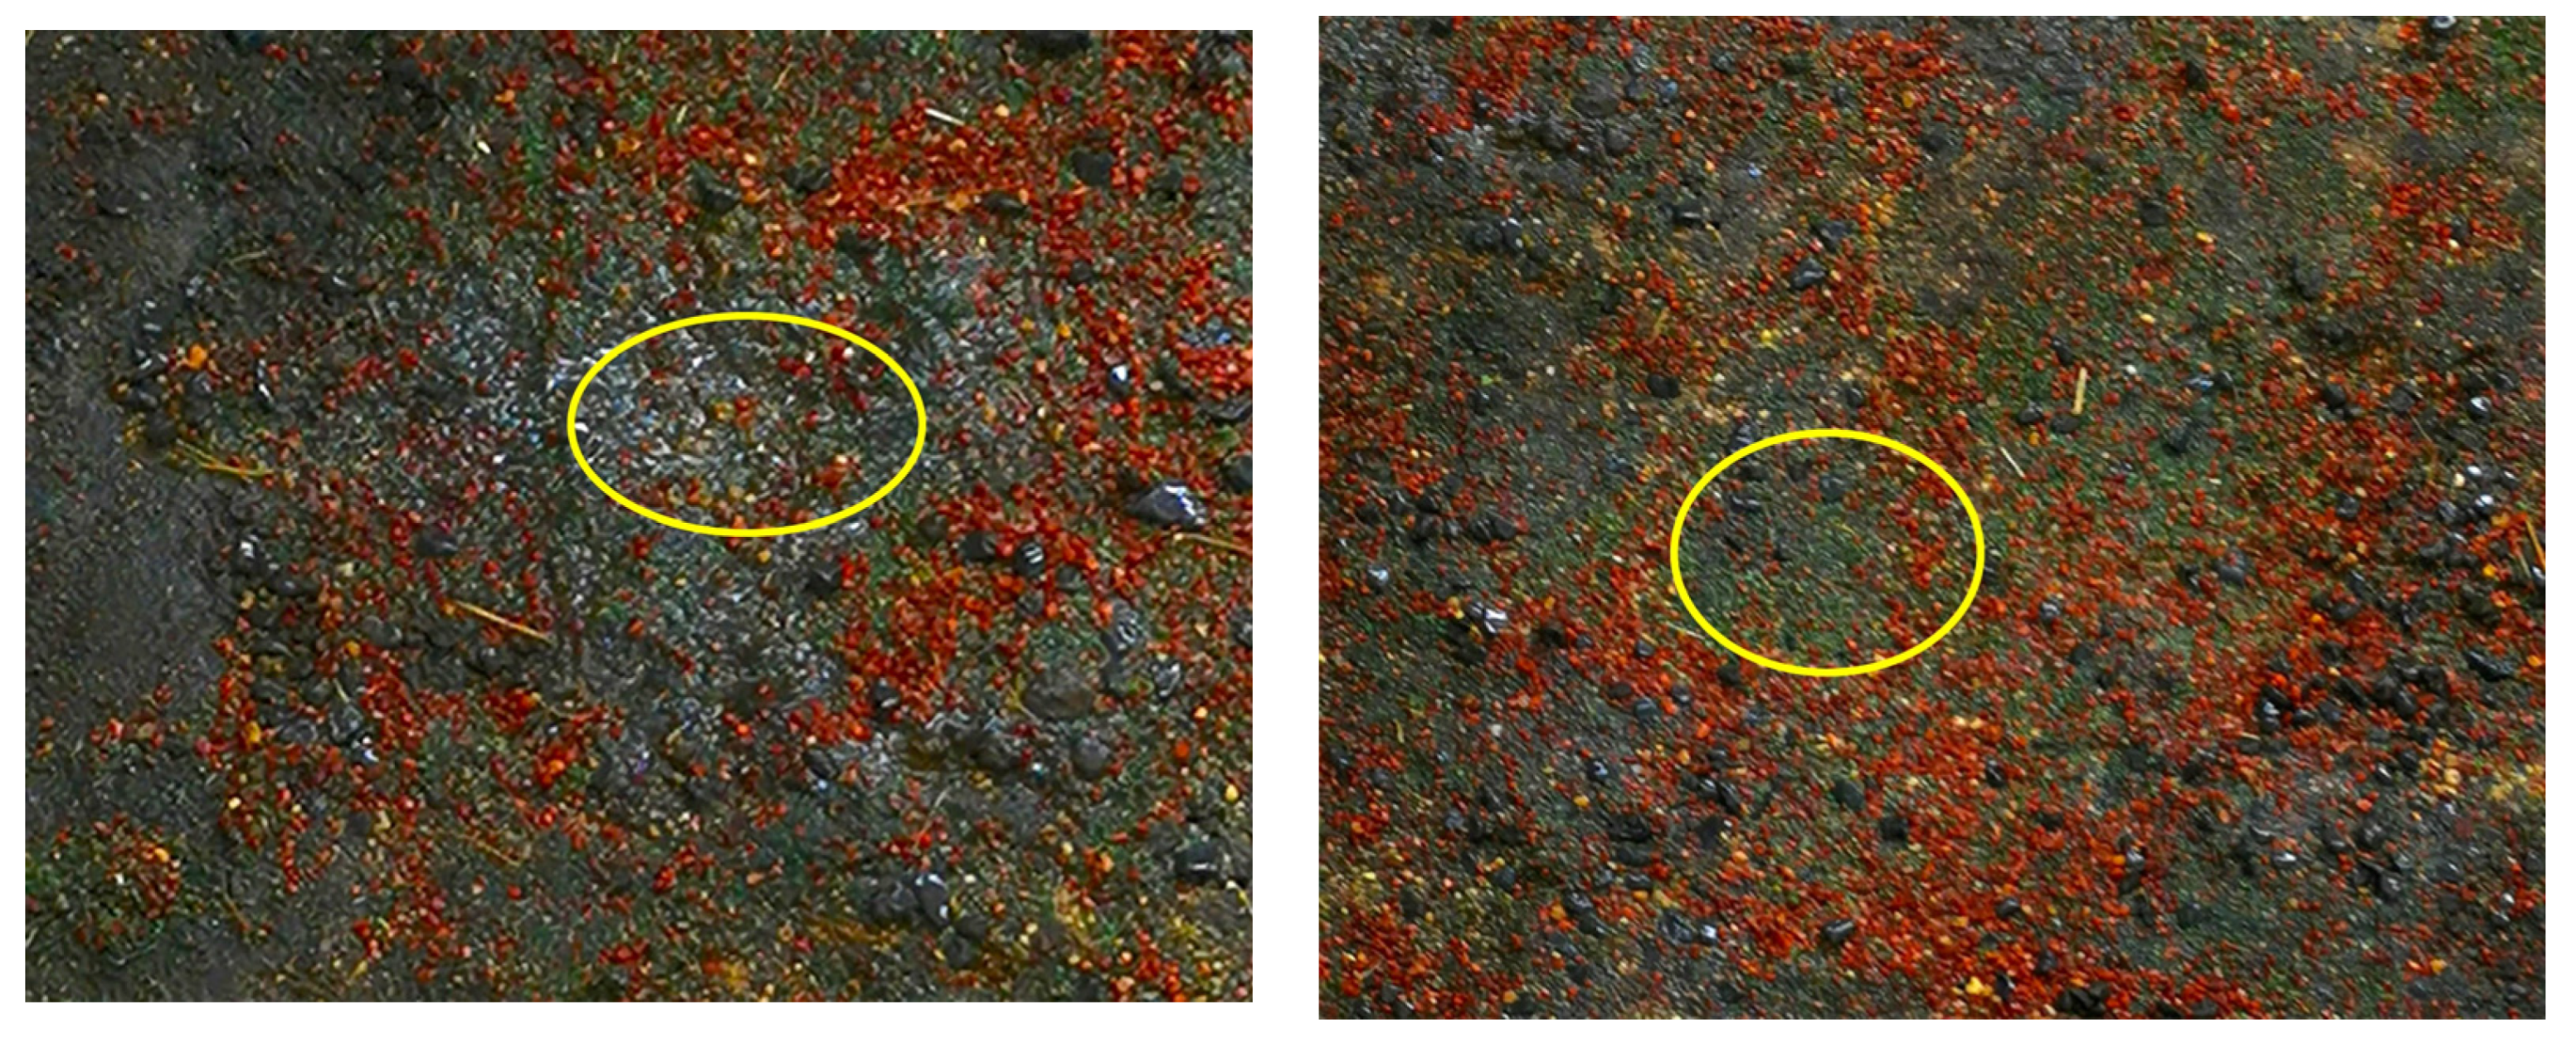
3.2. Occurrence and Development Process of Subgrade Slope Erosion of G2

Compared with G1, the ponding time on the slope surface was shorter. There was almost no erosion in the first 16 min, owing to the slope being mainly in the stage of infiltration and water accumulation in the first 16 min. The precise time it took for the water to accumulate was 15 min 47 s, with a water accumulation depth of 0.4 cm. Until 16 min and 23 s, soil particle transportation occurred, forming sheet erosion, as shown in Figure 6. At this stage, water flow scoured and transported the finer-grained soil particles to the lower part of the slope before the large-grained soil was exposed, as shown in Figure 7. Then the two most seriously eroded pits formed on the slope surface, with depths of 1.4 cm and 2 cm, and diameters of 3.5 cm and 3.7 cm, respectively, as shown in Figure 8.
As summarized in Table 4, R2 is 55.2% higher than R1 in incipient flow velocity and 80.6% higher in erosion quantity.

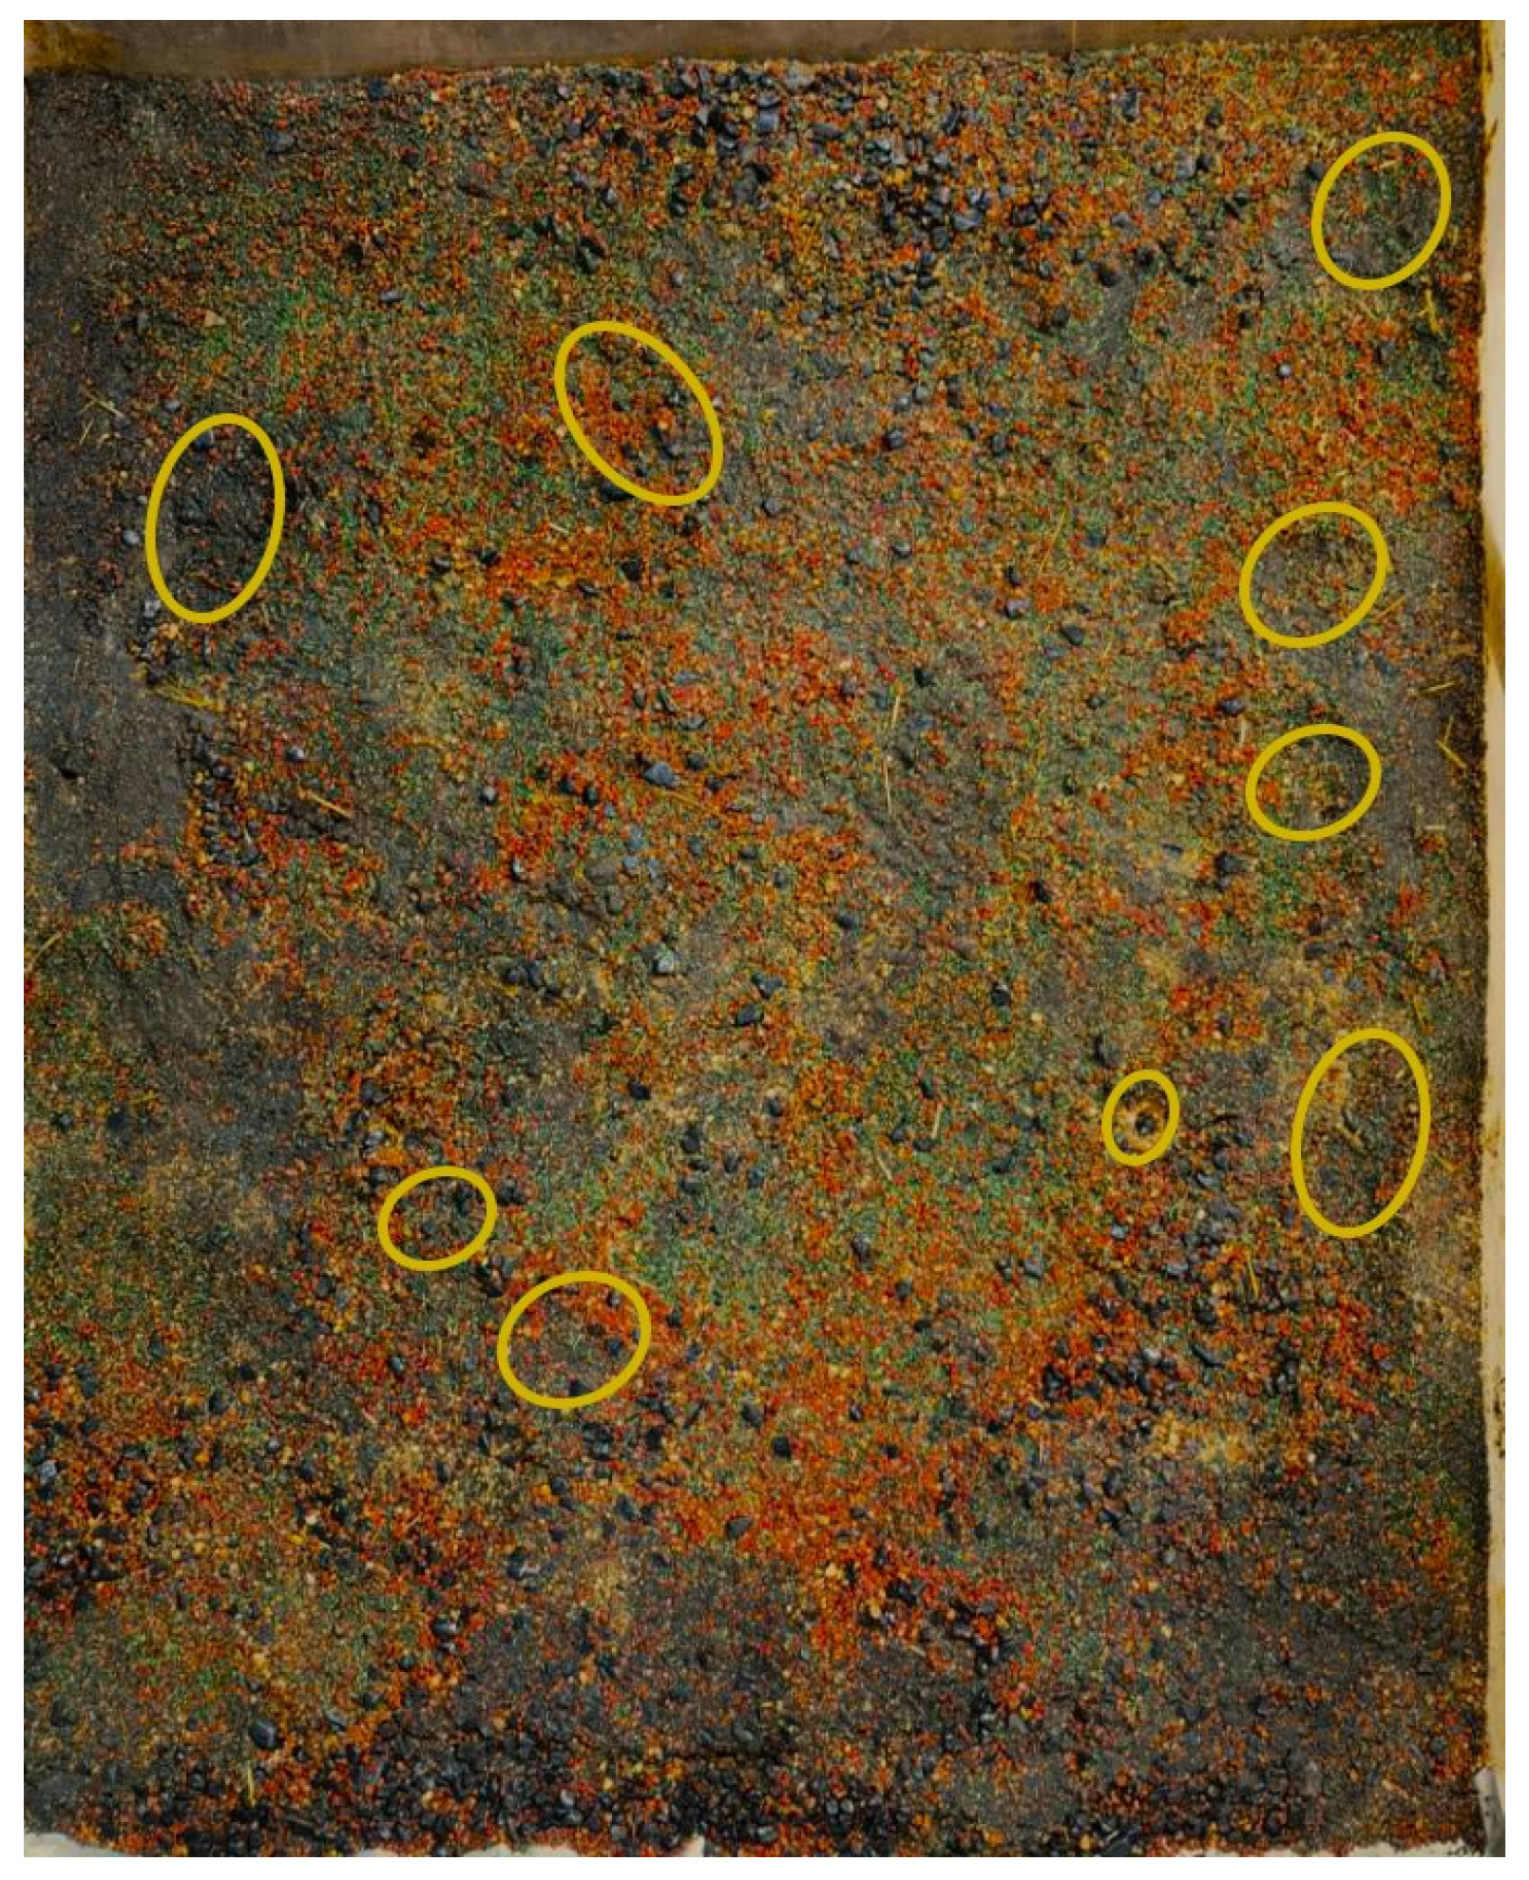
3.3. Occurrence and Development Process of Subgrade SLOPE Erosion of G3

Under a rainfall of 1.5 mm/min for G3, ponding on the slope surface generated quickly, and the soil particles of R1 quickly became sticky, forming small deformations and splash erosions, as shown in Figure 9. An eroded pit with a diameter of 3 cm and a depth of 1.5 cm appeared at 11 min 23 s and then expanded, finally forming a pit with a diameter of 6.2 cm and a depth of 2.5 cm, as shown in Figure 10a. The sheet erosion of the whole slope is shown in Figure 10b.
The erosion and collection conditions of G3, as shown in Table 5, were compared with R1 and R2, R2 and R3, and R3 and R4; the incipient flow velocity increased by 54.5%, 43.1%, and 35.6%, respectively, while the erosion quantity increased by 318%, −42.0%, and −37.5%, respectively.

3.4. Occurrence and Development Process of Subgrade Slope Erosion of G4

Unlike the previous three groups, the permeability coefficient of G4 increased significantly and the ponding time decreased due to the removal of the minimum soil particle size R1. Local ponding occurred at 10 min 5 s, and the overall ponding occurred at 14 min 30 s, with a depth of 0.34 cm.
Due to the lack of cohesion provided by the soil particles of R1, water flow runoff and scouring erosion occurred on the surface of G4 faster than G2. In the first 14 min, no erosion occurred. Until 14 min 33 s, soil particles, transported locally, formed sheet erosion, as shown in Figure 11. At this stage, the water flow first scoured and transported the soil particles of R2, then R3 particles also underwent erosion, while R4 had a larger particle size and was less likely to be eroded under a rain intensity of 1.0 mm/min. The eroded pits generated at 15 min 12 s. After scouring, eroded pitting of a similar size was finally formed, with a maximum diameter of 4 cm and a depth of 2.5 cm, as shown in Figure 12. If we extend the scouring time, this pitting erosion will further develop into gully erosion, leading to the overall collapse of the slope.
The erosion and collecting condition of G4 is shown in Table 6. Due to the low cohesion of soil filler, G4 was prone to be eroded under a 1.0 mm/min rainfall intensity. R2 and R3 were scoured and transported at 14 min 33 s and 16 min 51 s, respectively. Compared with R2, the incipient flow velocity of R3 increased by 41.5%, and the erosion quantity decreased by 55.2%.
Compared with G2, G4 experienced less flake erosion, but had more eroded pits, shorter ponding time, and more scouring R3 and R2 particles. Compared with the R2 of G4 and G2, the incipient flow velocity decreased by 15.9%, and the erosion quantity increased by 87.5%. The soil particles of R3 in G4 were not transported and scoured, unlike in G2, due to the loss of cohesion provided by the R1 in G4. Thus, appropriate fine particles can enhance the anti-scouring ability of the slope and improve the incipient flow velocity of the same soil particle size.

3.5. Occurrence and Development Process of Subgrade Slope Erosion of G5

As the slope gradient of G5 increased significantly, local ponding occurred in 9 min and 54 s, and the overall ponding occurred in 12 min and 14 s, with a depth of 0.4 cm.
In the first 12 min, there was no obvious erosion. Until 13 min 2 s, water flow transported soil particles locally, causing flake erosion with a large erosion area but slight depth, as shown in Figure 13. Water flow scoured and transported R1 particles of G5 first to the slope foot before R2 and R3 were scoured. Water flow started to transport and erode R1, R2 and R3 at 13 min 33 s, 14 min 4 s and 15 min 21 s, respectively. Due to the large particle size, R3 had only a small amount of scouring under a rainfall intensity of 1.0 mm/min. Pits of G5 appeared at 14 min 45 s, finally forming nine pits of different sizes, with a maximum diameter of 6 cm and a depth of 2.3 cm, as shown in Figure 14.
R1 was the first soil particle size group to be scoured on the slope with a gradient of 1:1.25, decreasing the cohesion of the slope surface, and leading to the erosion of other particle sizes. However, the R4 and R3 groups did not experience much scouring or transportation due to their large particle sizes and some residual soil particles of R1 that still provided shear strength. The erosion and collecting condition of G5 is summarized in Table 7. Compared with R1 and R2, R2 and R3, the incipient flow velocity increased by 56.9% and 47.3%, respectively, while the erosion quantity decreased by 65.8% and 44.5%, respectively.
Compared with G2, the larger slope gradient of G4 leads to faster flow acceleration, shorter po–nding time, more erosion quantity of R1 and R2, larger erosion area, and less quantity and depth of sheet erosion. Compared to R1 of G2 and G5, the incipient flow velocity decreased by 20.5%, while the erosion quantity increased by 258%. Compared to R2 of G2 and G5, the incipient flow velocity decreased by 19.7% while the erosion quantity decreased by 32.1%. Due to the larger gradient, water flow could scour R3 of G5 at a low velocity, but not R3 of G2. Therefore, reducing the slope gradient appropriately can enhance the anti-scour ability and improve the starting velocity of the same particle size.
The start-up time and ponding depth of each particle size on the slope surface under various working conditions are summarized in Figure 15. Under the same conditions, the smaller particle size starts first, but when the rainfall intensity is high, the starting time of the particle size below 2.5 mm is almost the same. Compared with G2 and G4, after removing the R1, the permeability coefficient increases, causing the soil to saturate faster. Compared with G2 and G5, when the slope gradient increases, the drag force of soil particles along the slope direction increases, which not only accelerates the start-up time but also promotes the start-up of the R3 group.

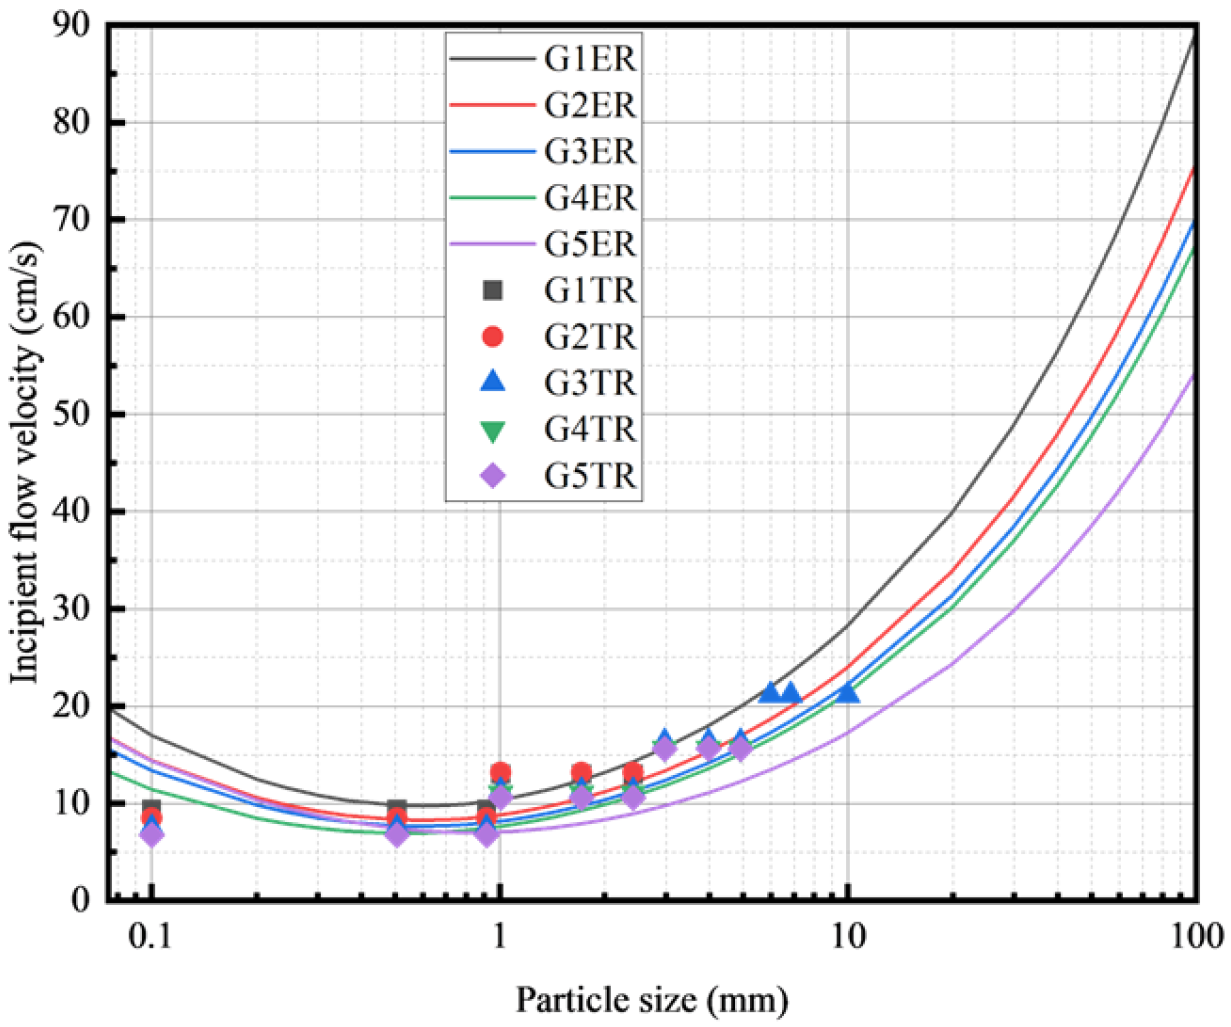
3.6. Equation Verification and Analysis of Incipient Flow Velocity

For the initiation of slope erosion under various working conditions, the physical parameters of each group of slopes in the theoretical formula of incipient flow velocity, Equation (1) [29], include dry weight γs, water weight γw, slope gradient θ, hydraulic radius R, cohesion C, internal friction angle φ, the frictional flow velocity f (UR·D/v), hydraulic slope Js, correction value χ, and roughness size ks, as shown in Table 8.
U = 5.75 [ ( γ s γ w + γ w J s ) ( tan φ cos θ sin θ ) + 6 C π D 3 ] f ( U R D v ) g D γ w log ( 12.27 χ R k s )
Substituting the data from Table 8 into theoretical Equation (1). Compared with the equation result (ER) and the model test result (TR), as shown in Figure 16, for particles with the same particle size, the increase in rainfall intensity, and the increase in slope gradient or decrease in soil cohesion could reduce the incipient flow velocity. Due to the contingency of the test results, the error was inevitable. Most of the TR is larger than the ER, that is, Equation (1) can play an early warning role in slope anti-scouring stability with safety. The single-factor analysis is discussed as follows:
(1)
Rainfall intensity impact on the incipient flow velocity
The corresponding rainfall intensities of G1, G2 and G3 were 0.5 mm/min, 1.0 mm/min and 1.5 mm/min, respectively, with a scouring time for 40 min on the slope of 1:1.5. The incipient flow velocities of the three groups within the same particle size range were relatively close. Nevertheless, when the rainfall intensity increased, the slope surface saturated faster, resulting in a decrease in maintaining ponding depth. The reduction in ponding depth decreased the hydraulic radius, which reduced the incipient flow velocity of the same particle size.
(2)
Slope gradient impact on the incipient flow velocity
The slope gradients of G2 and G5 were 1:0.5 and 1:1.25, with a scouring time of 40 min under a rainfall intensity of 1.0 mm/min. Comparing the ER of G2 and G5 with the TR, in G5, the larger the slope gradient was, the larger the maximum allowable incipient particle size, and the smaller the incipient flow velocity, that is, the easier the scouring erosion on the slope occurred.
(3)
Grading curve impact on the incipient flow velocity
The grading curves of G2 and G4 were S1 and S2, as shown in Figure 2, with a scouring time of 40 min under a rainfall intensity of 1.0 mm/min on the slope of 1:1.5. The internal friction angles of G4 and G2 are the same, but the cohesion decreases by 32.1%. The decrease in shear strength made the water flow scour and transport R4 on the G4 slope with greater ease. Therefore, the exit of R1 improved the anti-scour ability of the coarse-grained soil slope.

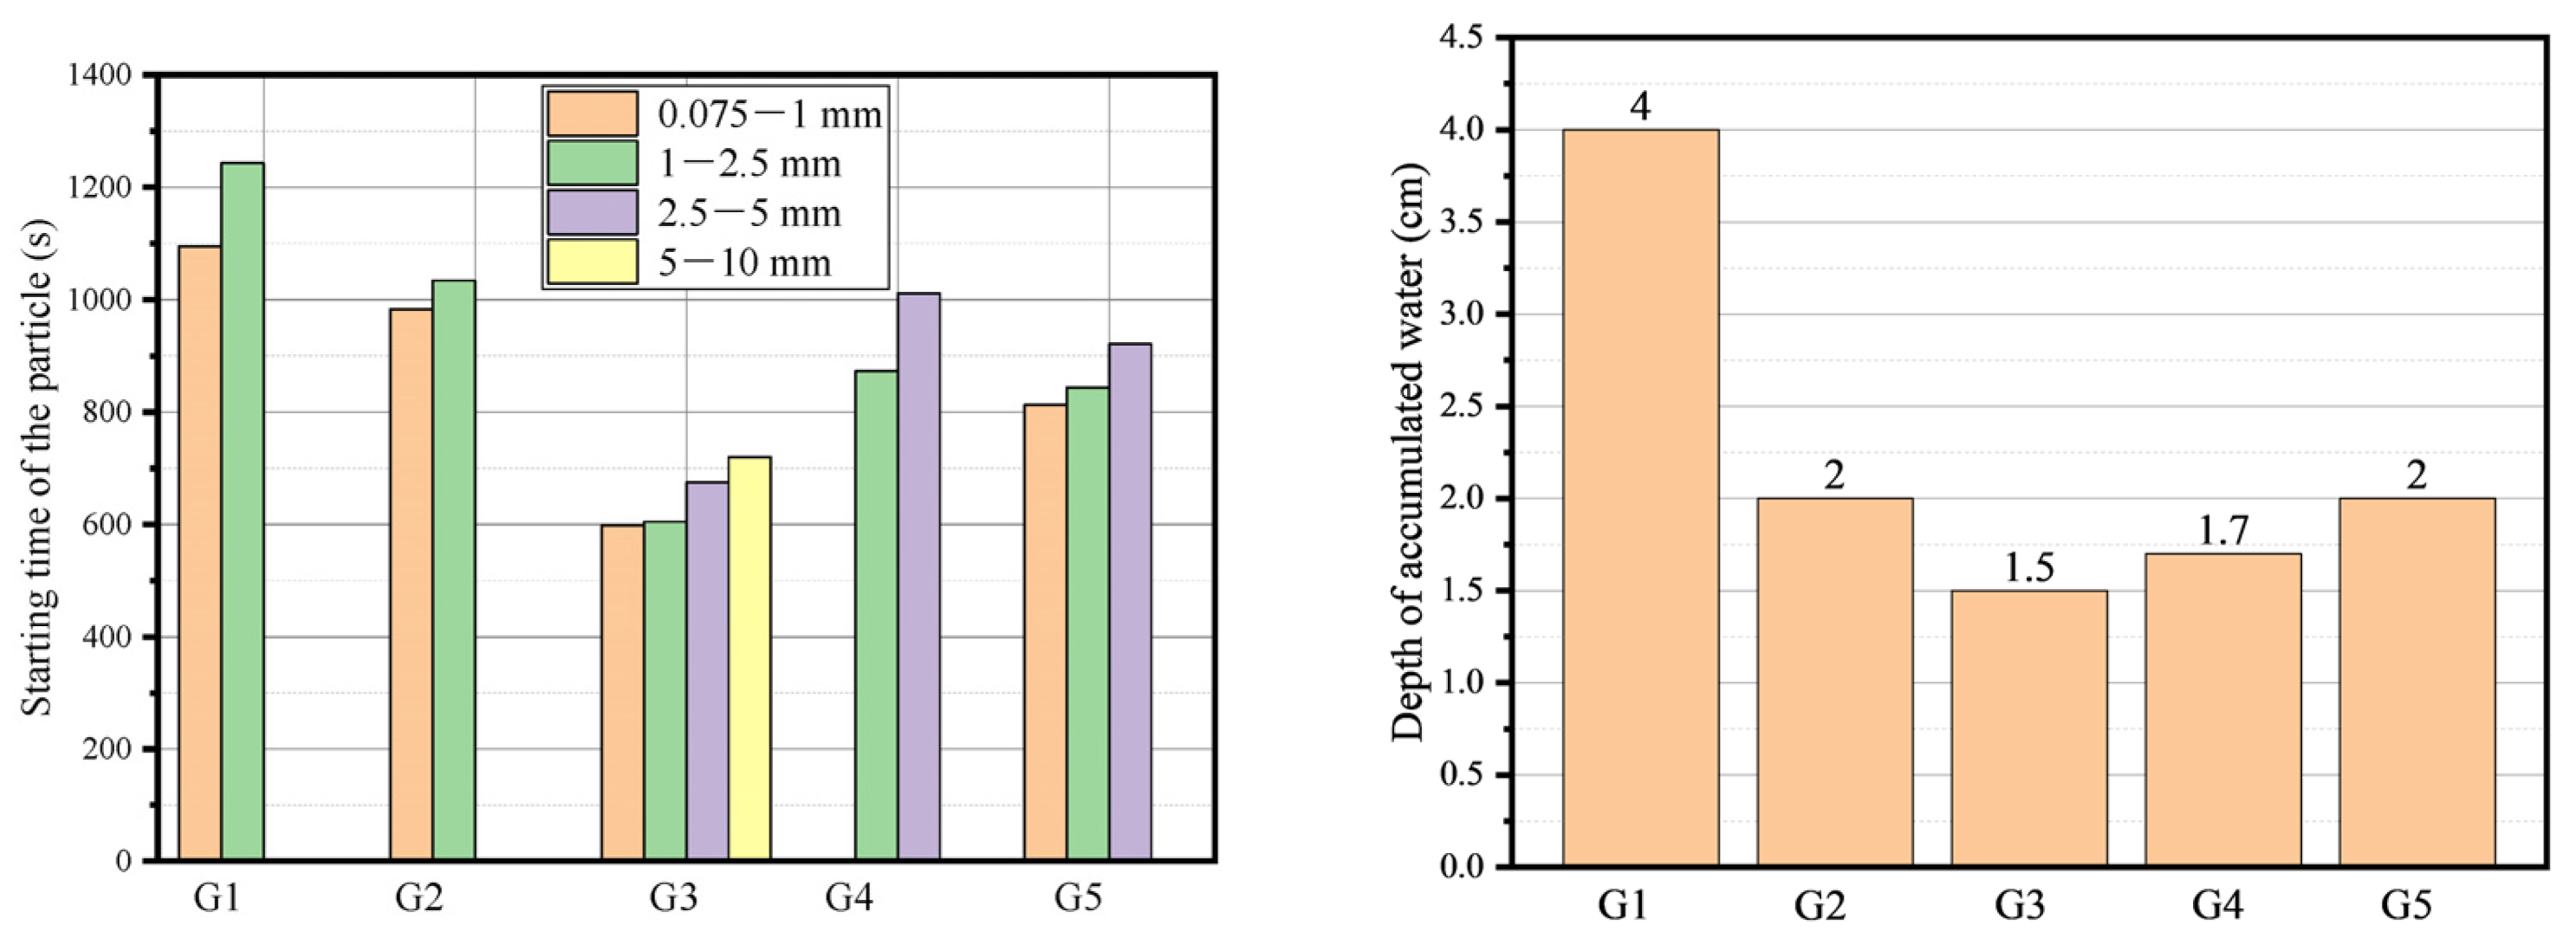
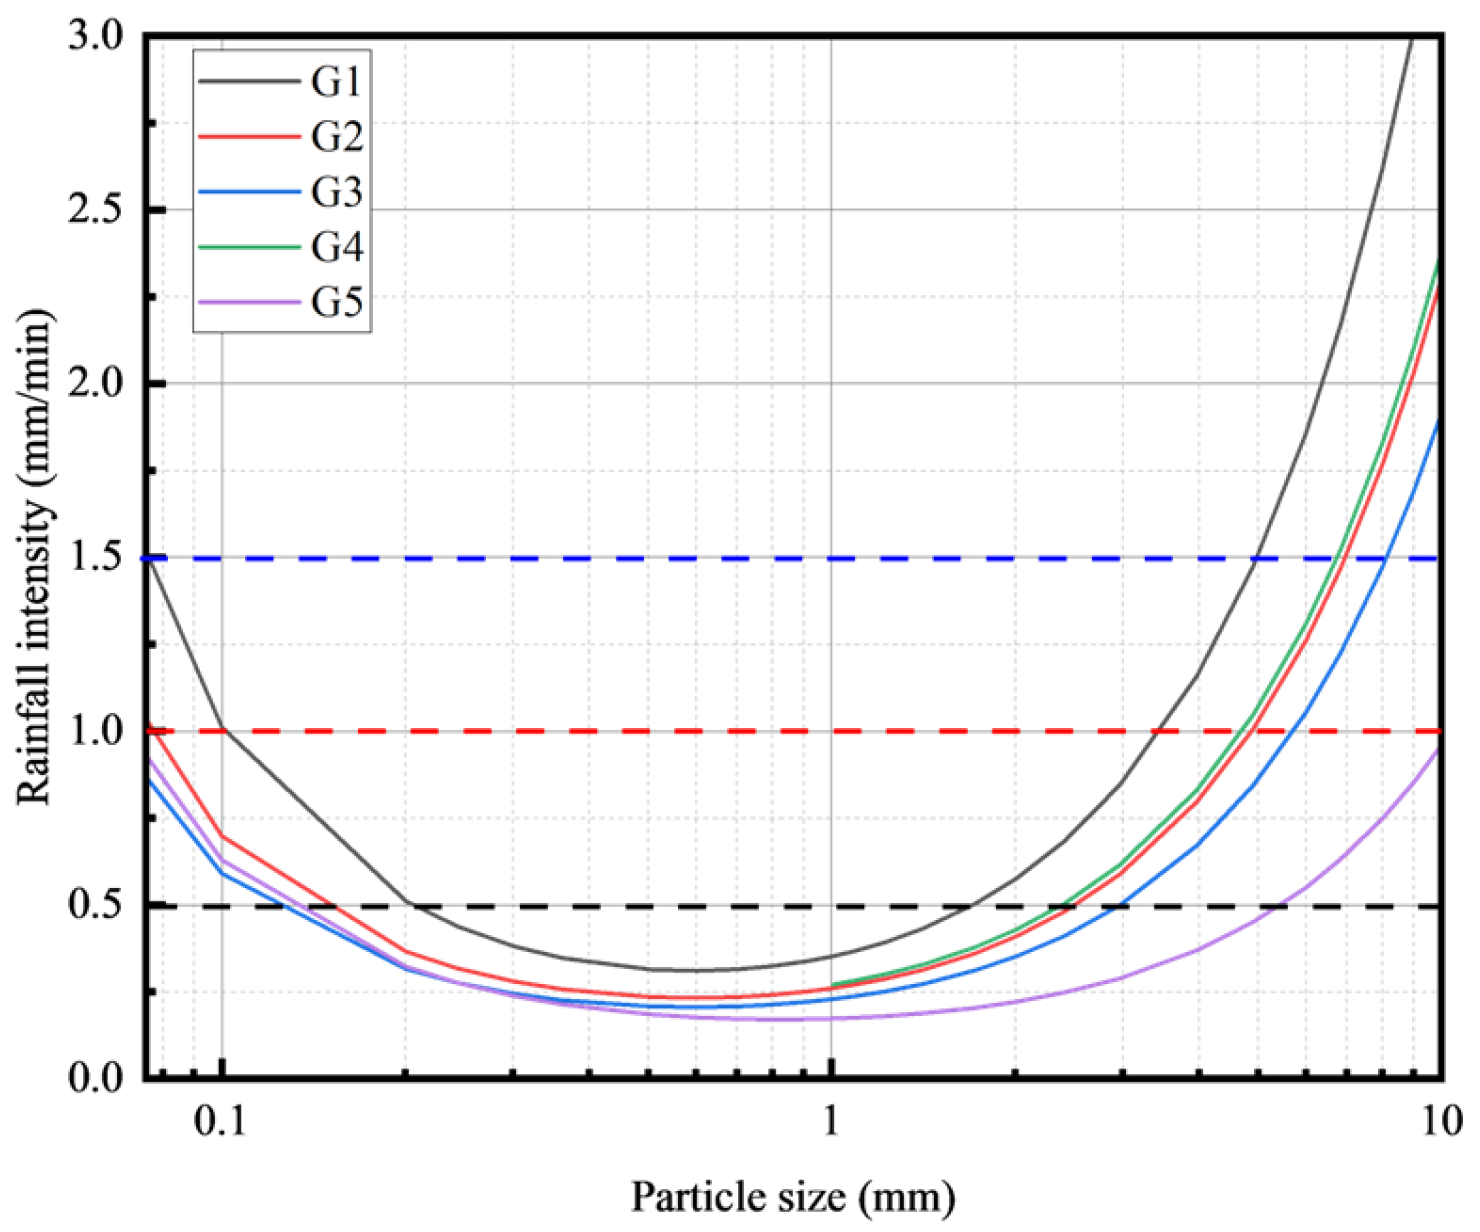
3.7. Relationship between Rainfall Intensity and Incipient Particle Size

Substituting Equation (2) [9] between rainfall intensity and flow velocity into Equation (1) yields:
ν = n 3 5 ( I K s ) 2 5 H 2 5 c t g 1 10 θ
I = K S + 33.06 ( H 0.4 n 0.6 log ( 12.27 χ R / k s ) tan 0.1 θ ) 2.5 ( [ ( γ s γ w + γ w J s ) ( tan φ cos θ sin θ ) + 6 C / π D 3 ] f ( U D / v ) g D / γ w ) 1.25
The curve relationship between the rainfall intensity and the incipient particle size under each working condition is obtained, as shown in Figure 17. Connect the curves of each group in the figure with the dotted line for rainfall intensity to form a closed area, which is the incipient particle size area under various working conditions, as shown in Table 9. Under the same slope gradient and soil grading curve, the increase in rainfall intensity makes the range of the incipient particle sizes larger.

4. Conclusions

Based on the indoor large-scale rainfall scouring erosion model test, this paper conducted a qualitative and quantitative study on the scouring erosion on the high-speed railway subgrade slope. The main conclusions are as follows:
During rainfall scouring, the smaller the particle size, the earlier the scouring erosion occurs. In addition, soil particles on the slope bottom were scoured more severely than those on the slope upper. With the increase in rainfall intensity or rainfall time, sheet erosion developed into more pits, and the depth and diameter of the pits gradually increased and evolved into gully erosion.
The incipient flow velocity formula of coarse-grained soil is verified by the model test result. Most of the TR is larger than the ER, and Equation (1) can play an early warning role in slope anti-scouring stability with safety.
With the increase in rainfall intensity, slope gradient, and the change in soil particle gradation (removing R1), the incipient velocity of soil particles on the slope will be reduced. The rainfall intensity increased from 0.5 mm/min to 1.5 mm/min, and the hydraulic radius decreased due to rapid slope saturation and difficulty in maintaining ponding, resulting in a reduction in the soil particle incipient velocity of up to 20%. When the slope increases from 1:1.5 to 1:1.25, the drag force on the soil particles along the slope direction increases and the hydraulic radius decreases, resulting in a decrease in the incipient flow velocity of about 20%. The removal of the smallest particle size soil particles, and the reduction in the shear strength of the slope soil makes soil particles easier to scour and start, and the incipient flow velocity decreases by about 16%.
Combined with the relationship between slope velocity and rainfall intensity, the rainfall intensity curve varied with the incipient particle size. Under different slope gradients, rainfall intensity and soil particle gradation are established, which can reflect the particle size range of the scouring erosion threshold on the slope surface under various rainfall intensities. With the increase in rainfall intensity, the soil particle size range of the erosion threshold on the slope becomes larger, which provides the basis for slope erosion stability analysis and protection design.

Author Contributions

Conceptualization, S.-W.W., J.-J.J. and S.L.; methodology, J.-J.J. and S.L.; software, J.-J.J. and Z.-D.C.; validation, J.-J.J. and S.L.; formal analysis, S.-W.W., J.-J.J. and S.L.; investigation, S.-W.W., J.-J.J. and Z.-D.C.; data curation, S.-W.W., J.-J.J. and Z.-D.C.; writing—original draft preparation, J.-J.J. and Z.-D.C.; writing—review and editing, J.-J.J. and Z.-D.C.; visualization, J.-J.J., S.-W.W. and S.L.; supervision, D.-G.C., S.-W.W., S.L. and Z.-D.C.; project administration, S.-W.W., J.-J.J. and Z.-D.C.; funding acquisition, D.-G.C., S.-W.W. and Z.-D.C.; resources, D.-G.C. All authors have read and agreed to the published version of the manuscript.

Funding

This work was supported by the Scientific Research Project of China Academy of Railway Sciences Co., Ltd. (2021YJ083). The funder had the following involvement with the study: determination of testing site, water and electricity supply.

Institutional Review Board Statement

Not applicable.

Informed Consent Statement

Not applicable.

Data Availability Statement

The data presented in this study are available on request from the corresponding author. The data are not publicly available due to privacy.

Conflicts of Interest

Author Shao-Wei Wei, Song Lv and De-Gou Cai were employed by the company China Academy of Railway Sciences Corporation Limited. The remaining authors declare that the research was conducted in the absence of any commercial or financial relationships that could be construed as a potential conflict of interest. The authors declare that this study received funding from China Academy of Railway Sciences Co., Ltd. The funder had the following involvement with the study: determination of testing site, water and electricity supply.

References

  1. Zou, Q.; Jiang, H.; Cui, P.; Zhou, B.; Jiang, Y.; Qin, M.; Liu, Y.; Li, C. A New Approach to Assess Landslide Susceptibility Based on Slope Failure Mechanisms. Catena 2021, 204, 105388. [Google Scholar] [CrossRef]
  2. Wang, L.; Li, X.-A.; Zheng, Z.-Y.; Zheng, H.; Ren, Y.-B.; Chen, W.-J.; Lei, H.-N. Analysis of the Slope Failure Mechanism a Under Tunnel Erosion Environment in the South-eastern Loess Plateau in China. Catena 2022, 212, 106039. [Google Scholar] [CrossRef]
  3. Jiang, J.-J.; Cui, Z.-D. Instability of High Liquid Limit Soil Slope for the Expressway Induced by Rainfall. Appl. Sci. 2022, 12, 10857. [Google Scholar] [CrossRef]
  4. Shen, E.; Liu, G.; Jia, Y.; Dan, C.; Abd Elbasit, M.A.; Liu, C.; Gu, J.; Shi, H. Effects of raindrop impact on the resistance characteristics of sheet flow. J. Hydrol. 2021, 592, 125767. [Google Scholar] [CrossRef]
  5. Shen, E.; Liu, G.; Xia, X.; Dan, C.; Zheng, F.; Zhang, Q.; Zhang, Y.; Guo, Z. Resistance to sheet flow induced by raindrop impact on rough surfaces. Catena 2023, 231, 107272. [Google Scholar] [CrossRef]
  6. TB10621-2014; Code for Design of High-Speed Railways. National Railway Administration: Beijing, China, 2015. (In Chinese)
  7. Japanese National Railways. Design Standards and Interpretation of Geostructures; China Railway Publishing House: Beijing, China, 1982. [Google Scholar]
  8. Gobel, C.; Lieberenz, K. Handbook of Railway Geotechnical Buildings; China Railway Publishing House Co., Ltd.: Beijing, China, 2009. [Google Scholar]
  9. Guo, Z. Study on the Behavior and Laws Rainfall Erosion for Railway Embarkment Slope; China Academy of Railway Sciences: Beijing, China, 2012. (In Chinese) [Google Scholar]
  10. Fenta, A.A.; Tsunekawa, A.; Haregeweyn, N.; Tsubo, M.; Yasuda, H.; Kawai, T.; Ebabu, K.; Berihun, M.L.; Belay, A.S.; Sultan, D. Agroecology-based soil erosion assessment for better conservation planning in Ethiopian river basins. Environ. Res. 2021, 195, 110786. [Google Scholar] [CrossRef]
  11. Hu, M.J.; Wang, R.; Zhang, P.C. Experiment analysis of the erosion character on slope surface in Jiang-jia valley. Rock Soil Mech. 2002, 23, 645–648. (In Chinese) [Google Scholar]
  12. Shen, S.J.; Sun, H.Y.; Shang, Y.Q.; Zhong, J.; Huang, J. Scouring-penetration Coupling Analysis of Embankment Slope under Rainfall Action. Chin. J. Rock Mech. Eng. 2011, 12, 2456–2462. (In Chinese) [Google Scholar]
  13. Huang, X.; Wang, C.; Song, P.; Wang, T. Physical Simulation Experiment for Characteristics of Loess Slope Erosion. J. Eng. Geol. 2015, 23, 725–730. (In Chinese) [Google Scholar]
  14. Shenghui, P. Simulation Test of Rainfall Scour Characteristics of Coarse-Grained Soil High Embankment Slope and Numerical Analysis; Changsha University of Science & Technology: Changsha, China, 2021. (In Chinese) [Google Scholar]
  15. Hu, M.; Wang, R.; Meng, Q.; Liu, S. Research on erosion process and features of loose gravelly soil slope. Rock Soil Mech. 2015, 31–35. (In Chinese) [Google Scholar]
  16. Wu, Q.; Wang, C.M.; Song, P.R.; Zhu, H.B.; Ma, D.H. Rainfall Erosion Experiment for Steep Loess Slope and Fluid-soil Coupling Simulation with PFC3D. Rock Soil Mech. 2014, 35, 977–985. (In Chinese) [Google Scholar]
  17. Li, R.; Zhang, S.; Bai, W.; Xiao, H. Function of a Deep-Buried Isolated Trench and Its Effect on Cracking Failure Characteristics of a Slope under Artificial Rainfall. Water 2022, 14, 1123. [Google Scholar] [CrossRef]
  18. Kuang, X. Research on the Rules and Evaluations of Water Erosion on Railroad Slopes; Beijing Jiaotong University: Beijing, China, 2009. (In Chinese) [Google Scholar]
  19. González, C.A.R.; Rodríguez-Pérez, Á.M.; Mancera, J.J.C.; Torres, J.A.H.; Carmona, N.G.; García, M.I.B. Applied Methodology Based on HEC-HMS for Reservoir Filling Estimation due to Soil Erosion. J. Hydrol. Hydromech. 2022, 70, 341–356. [Google Scholar] [CrossRef]
  20. Dou, G.R. Incipient Motion of Sediment Under Currents. China Ocean Eng. 2000, 14, 391–406. [Google Scholar]
  21. Bridhikitti, A.; Ruamchalerm, P.; Keereesuwannakul, M.; Prabamroong, T.; Liu, G.; Huang, C. Magnitude and factors influencing soil loss and sedimentation in the Mun River Basin, Thailand. Catena 2022, 210, 105872. [Google Scholar] [CrossRef]
  22. Guo, Z.; Zhao, Z. Numerical analysis of an expansive subgrade slope subjected to rainfall infiltration. Bull. Eng. Geol. Environ. 2021, 80, 5481–5491. [Google Scholar] [CrossRef]
  23. Guo, G.J.; Liu, G.H.; Sui, J.; Wu, J.Q. Subgrade Slope Stability Analysis under the Condition of Rainfall Infiltra-tion. Appl. Mech. Mater. 2013, 353–356, 1073–1076. [Google Scholar] [CrossRef]
  24. Ben Cheikha, L.; Jaoued, M.; Aouadi, T.; Ameur, M.; Gueddari, M. Quantifying of water erosion and sediment yield by SEAGIS model in Rmel watershed (north-eastern Tunisia). Environ. Earth Sci. 2021, 80, 790. [Google Scholar] [CrossRef]
  25. Fan, J.; Motamedi, A.; Galoie, M. Impact of C factor of USLE technique on the accuracy of soil erosion modeling in elevated mountainous area (case study: The Tibetan plateau). Environ. Dev. Sustain. 2022, 23, 12615–12630. [Google Scholar] [CrossRef]
  26. Baral, A.; Shahandashti, S.M. Identifying critical combination of roadside slopes susceptible to rainfall-induced failures. Nat. Hazards 2022, 113, 1177–1198. [Google Scholar] [CrossRef]
  27. Xu, G.-J.; Zhong, K.-Z.; Fan, J.-W.; Zhu, Y.-J.; Zhang, Y.-Q. Stability analysis of cohesive soil embankment slope based on discrete element method. J. Cent. South Univ. 2020, 27, 1981–1991. [Google Scholar] [CrossRef]
  28. GB/T50123-2019; Standards for Geotechnical Testing Method. Ministry of Housing and Urban-Rural Development of the People’s Republic of China: Beijing, China, 2019. (In Chinese)
  29. Wei, S.-W.; Cai, D.-G.; Lv, S.; Jiang, J.-J.; Cui, Z.-D. Rainfall Scouring Mechanism of the High-Speed Railway Subgrade Slope with Coarse-Grained Soil. Adv. Civ. Eng. 2023, 2023, 7320049. [Google Scholar] [CrossRef]
Figure 1. The model test system: (a) details of the test system, (b) rainfall equipment.
Applsci 14 00244 g001
Figure 2. The grading curve of coarse-grained soil.
Applsci 14 00244 g002
Figure 3. Dyeing treatment: (a) Grouping, (b) Mixing.
Applsci 14 00244 g003
Figure 4. Slope building process: (a) Layer-by-layer building, (b) Slope cutting, (c) Compaction, (d) Dyed layer covered.
Applsci 14 00244 g004aApplsci 14 00244 g004b
Figure 5. Erosion distribution of G1.
Applsci 14 00244 g005
Figure 6. Erosion distribution of G2.
Applsci 14 00244 g006
Figure 7. Intergranular binding of G2: (a) Before scouring, (b) After scouring.
Applsci 14 00244 g007
Figure 8. Pits occur after erosion of G2.
Applsci 14 00244 g008
Figure 9. Splash erosion occurs after erosion of G3.
Applsci 14 00244 g009
Figure 10. Pits after erosion of G3: (a) Panorama, (b) Enlarge.
Applsci 14 00244 g010
Figure 11. Sheet erosion occurs after erosion of G4.
Applsci 14 00244 g011
Figure 12. Pits after erosion of G4: (a) Panorama, (b) Enlarge.
Applsci 14 00244 g012
Figure 13. Sheet erosion occurs after erosion of G5.
Applsci 14 00244 g013
Figure 14. Pits after Erosion of G5.
Applsci 14 00244 g014
Figure 15. Soil particle starting time and distribution of ponding depth.
Applsci 14 00244 g015
Figure 16. Comparison for the incipient flow velocity between theoretical formula and test results.
Applsci 14 00244 g016
Figure 17. Waterlogging time of G1~G5.
Applsci 14 00244 g017
Table 1. The physical and mechanical properties of soils for the model test.
SoilSaturated Permeability Coefficient
(10−6 m/s)
Dry Bulk
Density (kN/m3)
CompactnessCohesion
(kPa)
Internal
Friction
Angle (°)
S11.31824.50.952837
S21.62021.60.951937
Table 2. Groups for the model test.
GroupSlope
Gradient
Rainfall Intensity (mm/min)Soil
Grading
Slope Height (m)
G11:1.50.5S10.6
G21:1.51.0S10.6
G31:1.51.5S10.6
G41:1.51.0S20.6
G51:1.251.0S10.6
Table 3. Erosion and collecting condition of G1.
Particle Size (mm)Incipient Flow Velocity (cm/s)Erosion Quantity (g)
0.075–1 (R1)9.403.0
1–2.5 (R2)13.011.9
Table 4. Erosion and collecting condition of G2.
Particle Size (mm)Incipient Flow Velocity (cm/s)Erosion Quantity (g)
0.075–1 (R1)8.503.1
1–2.5 (R2)13.195.6
Table 5. Erosion and collecting condition of G3.
Particle Size (mm)Incipient Flow Velocity (cm/s)Erosion Quantity (g)
0.075–1 (R1)7.503.3
1–2.5 (R2)11.3113.8
2.5–5 (R3)16.338.0
5–10 (R4)21.145.0
Table 6. Erosion and collecting condition of G4.
Particle Size (mm)Incipient Flow Velocity (cm/s)Erosion Quantity (g)
1–2.5 (R1)11.0910.5
2.5–5 (R2)15.654.7
Table 7. Erosion and collecting condition of G5.
Particle Size (mm)Incipient Flow Velocity (cm/s)Erosion Quantity (g)
0.075–1 (R1)6.7511.1
1–2.5 (R2)10.593.8
2.5–5 (R3)15.62.1
Table 8. Physical parameters in the theoretical formula for each group.
Groupsγs
(kN/m3)
γw
(kN/m3)
θ
(°)
R
(cm)
C
(kN)
φ
(°)
f(UD/v)Jsχks
(m)
G124.59.833.74.028370.040.6671.00.005
G224.59.833.72.028370.040.6671.00.005
G324.59.833.71.528370.040.6671.00.005
G421.69.833.71.719370.040.6671.00.005
G524.59.838.62.028370.040.8001.00.005
Table 9. Scouring situation of each group.
GroupsRainfall Intensity (mm/min)Max Flow Velocity
(cm/s)
Particle Size
(mm)
Max Percent of Eroded Particles (%)
G10.513.121.7127.92
G21.017.944.8949.48
G31.521.348.1385.04
G41.015.654.7158.84
G51.017.6110100
Disclaimer/Publisher’s Note: The statements, opinions and data contained in all publications are solely those of the individual author(s) and contributor(s) and not of MDPI and/or the editor(s). MDPI and/or the editor(s) disclaim responsibility for any injury to people or property resulting from any ideas, methods, instructions or products referred to in the content.

