Article

Trust-Aware Evidence Reasoning and Spatiotemporal Feature Aggregation for Explainable Fake News Detection

State Key Laboratory of Mathematical Engineering and Advanced Computing, Zhengzhou 450001, China
*
Authors to whom correspondence should be addressed.
Appl. Sci. 2023, 13(9), 5703; https://doi.org/10.3390/app13095703
Submission received: 28 March 2023 / Revised: 2 May 2023 / Accepted: 2 May 2023 / Published: 5 May 2023

Abstract

:
Fake news detection has become a significant topic based on the fast-spreading and detrimental effects of such news. Many methods based on deep neural networks learn clues from claim content and message propagation structure or temporal information, which have been widely recognized. However, firstly, such models ignore the fact that information quality is uneven in propagation, which makes semantic representations unreliable. Additionally, most models do not fully leverage spatial and temporal structures in combination. Finally, internal decision-making processes and results are non-transparent and unexplained. In this study, we developed a trust-aware evidence reasoning and spatiotemporal feature aggregation model for more interpretable and accurate fake news detection. Specifically, we first designed a trust-aware evidence reasoning module to calculate the credibility of posts based on a random walk model to discover high-quality evidence. Next, from the perspective of spatiotemporal structure, we designed an evidence-representation module to capture the semantic interactions granularly and enhance the reliable representation of evidence. Finally, a two-layer capsule network was designed to aggregate the implicit bias in evidence while capturing the false portions of source information in a transparent and interpretable manner. Extensive experiments on two benchmark datasets indicate that the proposed model can provide explanations for fake news detection results, and can also achieve better performance, boosting the F1-score 3.5% on average.

1. Introduction

Social media has become a significant platform for users to exchange and share messages, based on its openness and anonymity. However, based on its low barrier of entry and rapid provision and dissemination of online news, it also provides a hotbed for the rapid dissemination of disinformation, such as fake news. Fake news threatens the security of cyberspace, and also affects public opinion regarding major social events [1]. This can seriously interfere with personal cognition, causing people to make incorrect decisions, and even exert a serious negative influence on political order and the economy in the real world. For instance, during the 2016 US presidential election, various types of fake news were more popular and widespread on Facebook than sources of accurate news, which affected voter cognition, even changing the proportion of people supporting different parties and having a significant impact on the fairness of the election [2]. In the “information plague” accompanying the COVID-19 pandemic in 2020, many news reports with misleading content spread through social media, leading to socioeconomic disorder and the reduced effectiveness of national epidemic prevention measures [3,4,5]. Therefore, constructing a detection model to curb fake news on social media has important theoretical value and practical significance for maintaining national security and social stability [6].
Existing fake news detection methods have two main classes, namely content-based and social context-based methods [4]. Specifically, content-based methods are dedicated to modeling the text content of news. For instance, early approaches considered linguistic features [5,6,7], topics [8] and emotional features [9,10] in a manual way, and more recent methods have extracted higher-level and implicit semantic information from news’ text content using neural networks [11,12,13,14]. These methods have achieved huge success in regular fake news detection. However, compared to news articles, the information published on social media is short and non-standard in format, and contains less effective information with more noise, leading to the issue of sparse semantics [15]. Therefore, it is difficult for previous models which process long and standard text content of regular news to extract key semantic features for detection from the short news posted on social media, due to the semantic sparsity. To alleviate the semantic sparsity issue, recent studies have tried to introduce additional information sources (e.g., social context information). Social context information (e.g., interactions between users and a news story), providing abundant reference information, boasts great potential in alleviating the task, leading to social context-based methods. Concretely, they can be further divided into posts-based and propagation-based methods. Posts-based methods utilize user opinions regarding relevant content to help fake news detection, by modeling the semantic interactions between source information and user comments [16,17,18]. Motivated by the posts-based methods, propagation-based methods further consider the local characteristics of semantic interactions in message propagation to capture and distinguish user views regarding source information and comments in a fine-grained manner. Specifically, they model the information propagation process as a graph structure and use graph neural networks to aggregate spatial neighborhood information and learn high-level spatial structure semantic representations [19,20,21,22,23,24,25,26].
Although the methods discussed above have improved detection performance, they still have some limitations. First, based on the openness and low barrier of entry of social media, there may be artificial accounts [27] attempting to publish incorrect information to affect public opinion during message propagation. When aggregating neighborhood information, existing models treat all information equally, which may introduce noise and render semantic representations unreliable [28]. Therefore, it is necessary to mitigate the impact of noise on model detection by calculating the credibility of comments. Second, existing propagation-based research methods mainly model spatial propagating structure characteristics without considering the dynamic evolution of posts over time. As shown in Figure 1, both comments T8 and T9 are replying to comment T6 with the same spatial structure characteristics, but from the perspective of time there are clear differences between them (T8 is released earlier than T9, meaning users may already be affected by T8 when T9 is released). Recent studies [29,30,31] have demonstrated that temporal structure features can capture the dynamic evolution of information in a more fine-grained manner and promote early detection performance. Spatial and temporal structures depict the evolution of news messages from the perspectives of information interaction networks and temporal message propagation, respectively, which are complementary. Therefore, it is necessary to consider both the temporal neighborhood structure characteristics and spatial neighborhood structure characteristics of information. Additionally, existing methods focus on using deep learning models to integrate more external information and automatically mine hidden features to improve fake news detection performance, while with the model complexity increasing, the decision-making process within a model has become more difficult to explain and verify. A psychological research work [32] has shown that the spreading power of false information is closely related to the importance and fuzziness of events. Therefore, it is typically insufficient to simply mark information as false. A model must also automatically provide a judgment basis to enhance interpretability.
To alleviate the problems discussed above, we designed a novel model (Trust-aware evidence Reasoning and Spatiotemporal feature Aggregation (TRSA)) to discover evidence for interpretable fake news detection. Specifically, we first designed a trust-aware evidence reasoning module to calculate the credibility of posts based on a random walk model to discover high-quality posts as evidence. Then, considering the credibility of evidence, we designed an evidence representation module based on spatiotemporal structure to aggregate the spatiotemporal neighborhood characteristics of message propagation and enhance the reliable representation of evidence. Finally, we detected fake news by aggregating the implicit bias of evidence in source information based on a capsule network. Specifically, we first modeled the semantic interactions between evidence and source information to capture the controversial points (false portions) of source information, and formed an evidence capsule. We then aggregated the implicit bias of each evidence capsule from the source information through a dynamic routing mechanism. This study makes the following contributions and innovations.
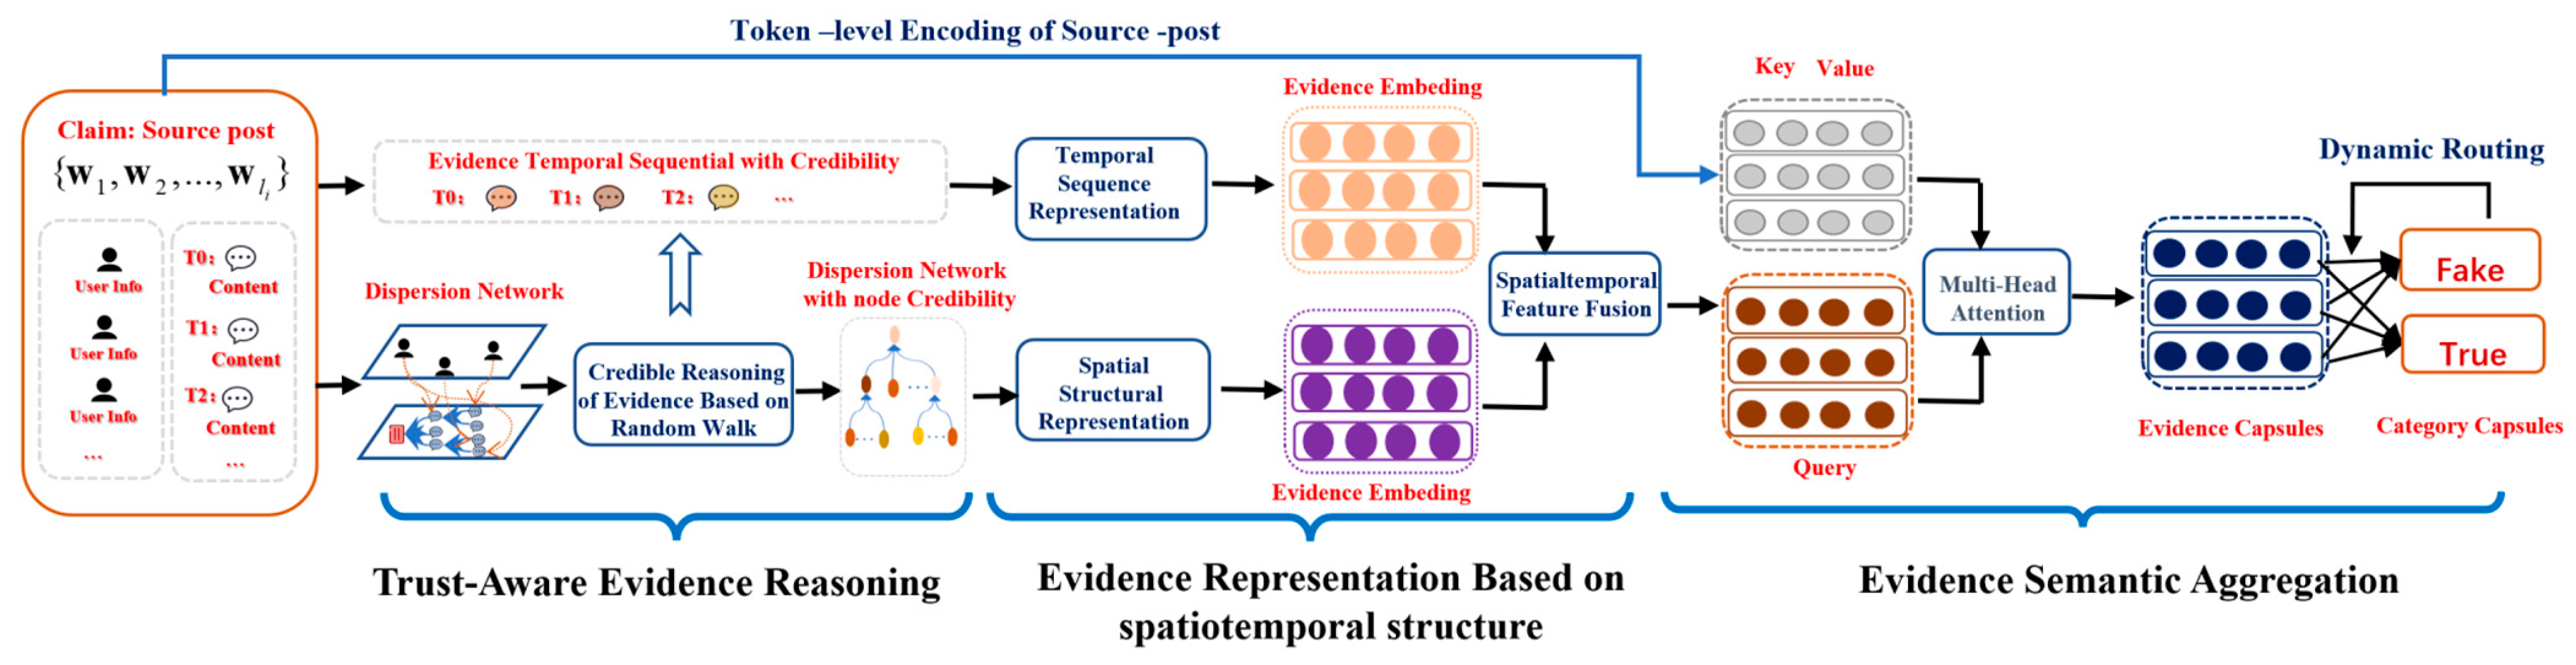
  • We developed a transparent and highly interpretable neural structure reasoning model that incorporates a random walk model and capsule network structure into the processes of evidence reasoning and aggregation, respectively, which not only provides reliable evidence for fake news detection, but also enhances the transparency of the model reasoning process;
  • Our evidence representation module can capture the semantic interactions between posts in a fine-grained manner based on the spatiotemporal structure of message propagation to enrich the semantic representation of posts (source information or comments);
  • The designed evidence aggregation module automatically captures the false portions of source information while aggregating the implicit bias of the evidence in source information;
  • Extensive experiments on public datasets illustrate that TRSA achieves more a promising performance than previous state-of-the-art approaches, as well as providing interpretations for fake news detection results.

2. Related Work

With the in-depth development of cutting-edge technologies such as big data and artificial intelligence, many researchers are attempting to apply these technologies to mine various characteristic signals of fake news, such as text, publishing users, participating users, and communication networks. Overall, we can classify these intelligent detection methods into the following categories:
Content-based approaches. Early methods based on content mainly focused on manually extracting various lexical, grammatical, or topical features, and using traditional machine learning methods to detect fake news. For example, Kwon et al. [12] found that emotion features are valuable for constructing false information classification models (including positive emotion words, negative words, and cognitive behavior words). On this basis, a time series model was designed to capture the key language differences between true and false information. Potthast et al. [10] used different writing styles to identify false statements. Ito et al. [11] introduced a potential Dirichlet distribution topic model for Twitter reliability evaluation. To avoid handcrafted feature engineering and automatically capture the deep hidden semantic features of text, various deep neural network models have been developed. Ma et al. [33] used recurrent neural networks to mine high-level hidden features in information for fake news detection. Wang et al. [34] applied a pre-training model to detect false information, and achieved good results. Hu et al. [13] constructed a heterogeneous graph containing topic, sentence, and entity information to represent a news document, and developed a novel network to distinguish fake news. These methods were significantly effective for distinguishing false news articles. However, news published on social media is short, leading to the issue of sparse semantics. Therefore, the detection performance of these models was significantly reduced.
Social context-based approaches. Social media is essentially a heterogeneous graph that includes users, posts, and other entities, as well as forwarding, commenting, and other relationships. Therefore, we can integrate social context information from different perspectives to perform fake news detection tasks. Social context-based approaches can be further grouped into posts- and propagation-based methods. Posts-based methods mainly rely on user reviews on social media, which can provide useful indicators for distinguishing false information. Therefore, user social responses in terms of emotions, opinions, or stances can be extracted through comments to optimize model detection performance. Wu et al. [20,21] used multitask learning and co-attention networks to capture both source information and comments jointly to improve task performance. Zhang et al. [35,36] hypothesized that fake news can often attract attention and arouse or activate emotions. Therefore, news comments (i.e., social emotions) from a crowd should not be ignored. The shortcoming of such models is that they overlook the obvious local characteristics of social media information interactions. Propagation-based methods mainly construct isomorphic or heterogeneous information propagation network modeling interactions between posts or users, mining the information propagating structural characteristics for evaluating the authenticity of one claim. Yuan et al. [22] proposed a novel attention network that jointly encodes local semantic information and global propagation structure information for false information detection. Bian et al. [23] devised a two-layer graph neural network (BiGCN) model to capture the bidirectional propagating structure of information. Although these models optimize performance through mining information dissemination structure features, they rely too heavily on the feature extraction performance of graph neural networks and ignore the fact that information quality is uneven in propagation, which makes semantic representations unreliable. As the complexity of a model increases, the decision-making process within the model becomes more difficult to explain and verify.
Interpretable machine learning. Our study was also correlated with interpretable machine learning, which mainly focuses on two aspects: the explanation of models and the explanation of results. The explanation of models primarily relies on probability graph models or knowledge graphs technologies. For example, Shi et al. [37] proposed a KG-based method to verify facts through predicate paths. Ciampaglia et al. [38] hypothesized that the shortest path between concept nodes could be determined by defining appropriate semantic proximity indicators on a knowledge graph, which can effectively approximate human fact checking. Most automatic fact-checking methods require a knowledge base, and must be updated regularly to ensure that the knowledge base remains current. However, it is difficult to handle new topics, such as symptoms of COVID-19, at an early stage. The explanation of results is primarily dedicated to visualizing the attention distribution in the model decision process. For example, Chen et al. [39] found that words reflecting negative emotions have higher attention weights than words related to events through visualizing the attention weights of their model. Wu et al. [21] depicted semantic interactions between high-quality comments and claims with a co-attention mechanism, and found that the attention weights of evidence-related words were higher than that of other words.
Compared to previous studies, we detected fake news in more realistic social media scenarios. To overcome the fact that information quality is uneven in propagation, we calculated the credibility of nodes in an information dispersion network from the perspectives of user authority and communication relationships, and filtered highly informative evidence from comments. To fully leverage spatial and temporal structures in combination, we designed an evidence representation module based on spatiotemporal structure to aggregate the spatiotemporal neighborhood characteristics of message propagation. To enhance the transparency of the model reasoning process, a capsule network was used to model the implicit bias of evidence relative to the source information in a transparent manner.

3. Problem Statement

Let Ψ = {S1, S2,…, Sn} be the source information to be detected and U = { u 1 , u 2 , , u l } be a user collection on social media. Each S i Ψ consists of a sequence of l i tokens { w 1 , w 2 , , w l i } , where each token w l i R d is a d-dimensional vector denoting the token feature. Each u i R represents the authority of user i calculated based on multiple meta-data features, including whether the account is verified, and geolocation information and homepage introduction exist, and the numbers of fans, friends and favorites. The specific calculation process is provided in Appendix A.
When a news story S i is posted, it causes users to discuss the story and generate comments or forwarded information. We describe the information propagation process from the perspective of temporal and spatial structures, as shown Figure 2. The spatial structure reflects user–content interaction (e.g., commenting, forwarding) in message propagation, while the temporal structure is associated with a series of posts (e.g., comments or forwarded messages) over time. We denote the temporal structure as P ( S i ) = { ( c 0 ,   t 0 ) , , ( c j , t j ) , } where c j is a d-dimensional vector representing the post (comment or forwarded) content at time j in the propagation of information S i and   t j is the time at which post c j is generated. c 0 denotes Si semantic feature. The spatial structure is denoted as G(Si) = <V, E>, where G(Si) represents the propagation graph of news Si. V is the node collection of G(Si) denoting posts in source information propagation. Each node in V is defined as v j = ( u j ,   c j ) V , where u j R represents the authority of the user who posted post j, and c j R d characterizes the post content. E denotes the edge collection describing the association relationship between nodes in G(Si). If c j is a comment or forwarded message to c i , a directed edge from node i to node j e i j = v i ,   v j will be added in E.
The interpretable fake news detection task can be described as learning a decision function f :   f ( S , P , G ) y that maximizes prediction accuracy with reliable evidence and marks the false portions of source information with explainable evidence-related words.

4. TRSA: Trust-Aware Evidence Reasoning and Spatiotemporal Feature Aggregation Model

In this section, we describe the details of the TRSA model. Its architecture is presented in Figure 3 and involves three modules: (1) a trust-aware evidence reasoning module for calculating the credibility of nodes in the information dispersion network based on a random walk model to discover high-quality evidence; (2) an evidence representation module with three units (temporal sequence representation unit, spatial structure representation unit, and fusion gate unit) for capturing the characteristics of high-level spatiotemporal structure and enhancing the semantic representation of evidence; and (3) an evidence semantic aggregation module for deepening the semantic interactions between evidence and source information, and modeling the implicit bias of evidence relative to source information based on a capsule network.

4.1. Trust-Aware Evidence Reasoning

Due to the openness and low barrier to entry of social media, erroneous information may be released by artificial accounts during message propagation, which can introduce noise into a fake news detection model. To avoid the impact of low-quality posts, we must calculate the credibility of posts and take highly credible posts as evidence to detect the truthfulness of source information. From the points of the publisher features and content of posts, two indicators were considered.
(1)
Authority of users who publish comments: the higher the authority of users, the more reliable their comments [40]. In other words, users tend to receive information published by users with high authority;
(2)
Degree of recognition of other comments in the information propagation process: comments recognized by other highly credible comments have high credibility.
To comprehensively consider these indicators together, we constructed a random walk model based on an information dispersion network that considers these indicators as the jump probabilities of random walkers in the network. The probability that random walkers will eventually travel to each node can be considered as the credibility of posts.

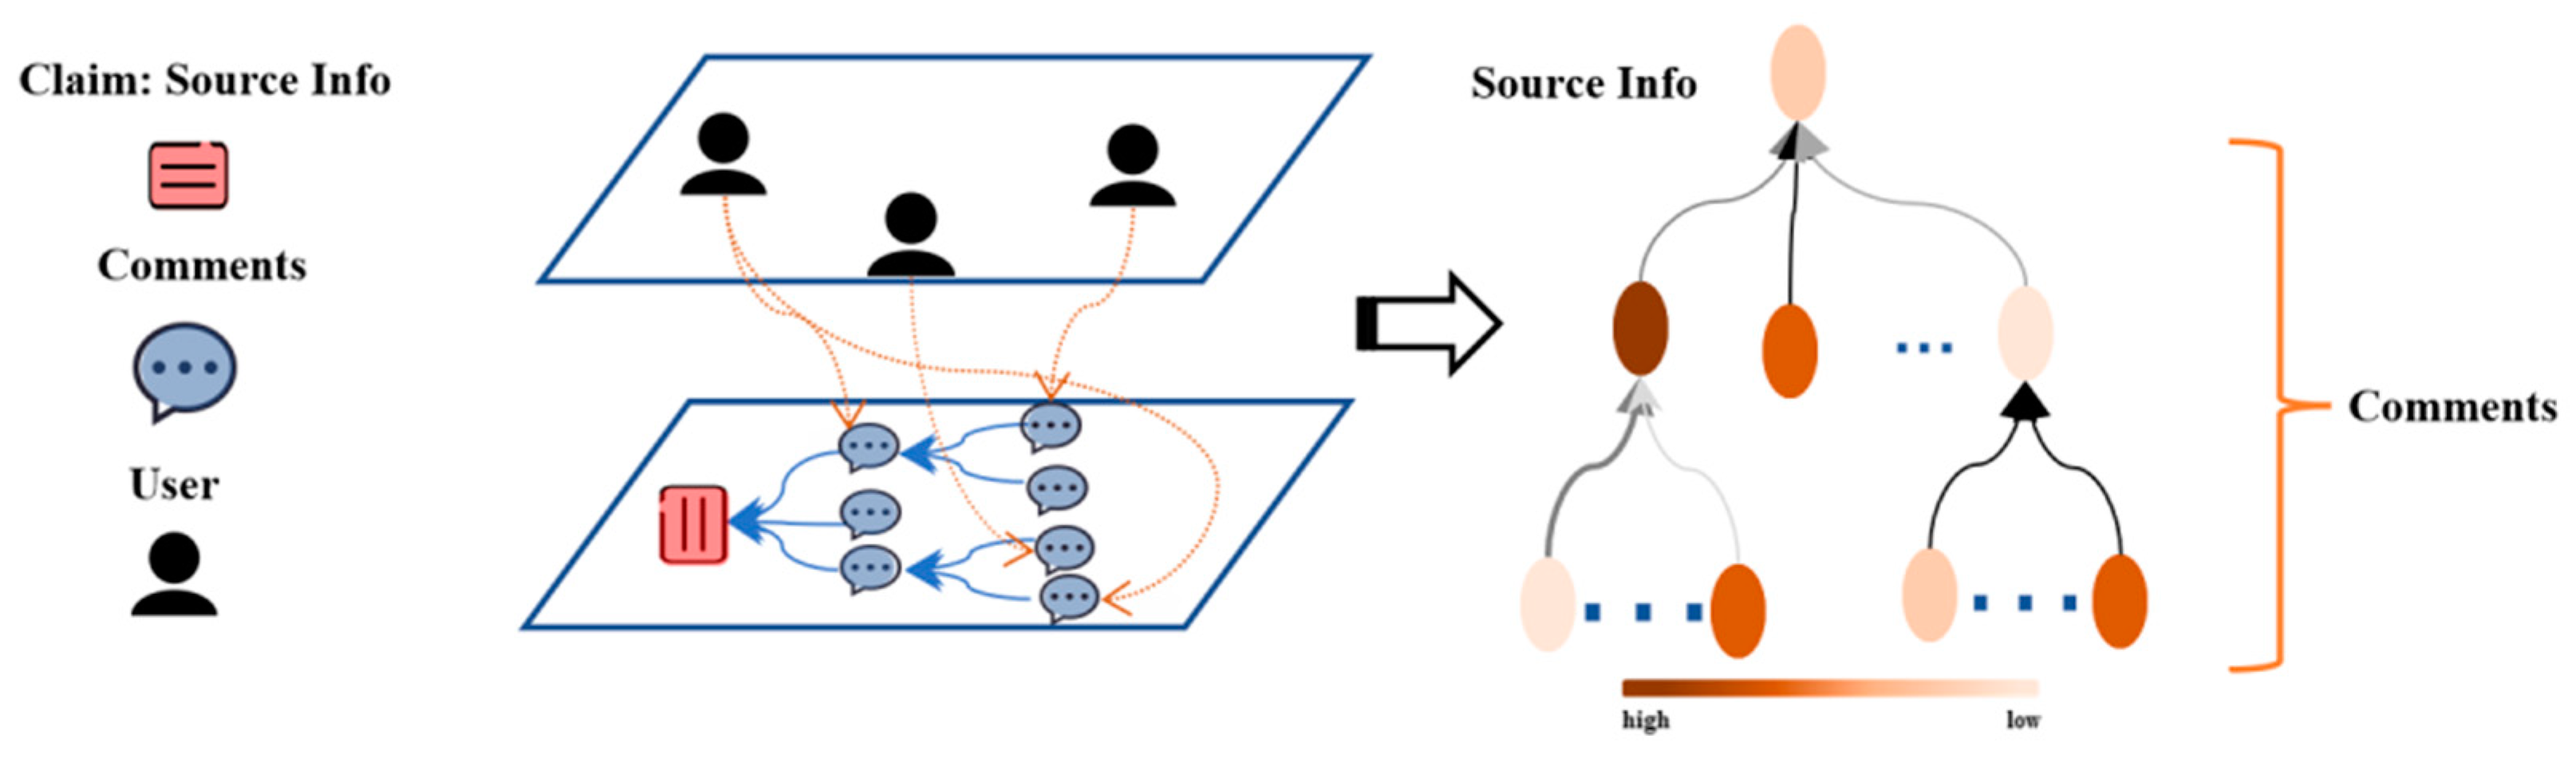
4.1.1. Information Dispersion Network Construction

The comment credibility ranking was based on an information dispersion network aimed at one claim (source information). We first constructed an information network G ( S ) = V , E based on source information along with its related comments, as well as the authority of users participating in the discussion, as shown in Figure 4.
The node at the top level of the network represents the source information, and the other nodes represent comments. As described in Section 3, each node is represented as v j = ( u j ,   c j ) V , where u j R represents the authority of the user who posted comment j, and c j R d is a d-dimensional vector obtained by a pre-trained BERT model that can be used to characterize the comment content. The initial weight of node i is represented by the corresponding user’s authority, uj. Each edge e i j   = v i , v j ; ω i j E represents the interaction between posts i and j. Edge weights wij indicate the recognition degree of post i relative to the content of post j. Its calculation process is as follows:
ω i j = sign ( c i , c j ) simlar ( c i , c j ) ,
where sign   ( c i , c j ) represents the emotional difference between posts. sign   ( c i , c j ) = 1 if the emotional polarity of the two posts is the same, and sign   ( c i , c j ) = 0 otherwise. s i m l a r ( c o n t e n t i , c o n t e n t j ) represents the semantic similarity; its value is in [0, 1]. We adopted the interface provided by the Baidu AI platform for calculating emotional difference (https://aip.baidubce.com/rpc/2.0/nlp/v1/sentiment_classify (accessed on 8 August 2022)) and adopted the soft cosine measure [41] between embeddings of comments (or the source post and its comments) as semantic similarity. In Equation (1), although there is interaction between posts I and j (e.g., i is a comment to j), w i j may still be 0. This is because there is no emotional resonance which means sign ( c i , c j ) = 0 , or the content of the two posts is irrelevant, which means sign ( c i , c j ) ) = 0 .

4.1.2. Credible Reasoning of Evidence Based on a Random Walk

Based on the information dispersion network, random walkers can walk randomly in the network in two ways: jumping randomly according to the weights of network nodes (i.e., considering the authority of users who publish posts) or walking randomly along to the edges in the network (i.e., considering the information interactions in the dispersion process).
The probability p i j of random walkers jumping from node i to node j according to the node weight is defined as follows:
p i j = exp ( u j ) i exp ( u i ) ,
where n exp ( u n ) represents the summation of weights of all nodes. According to Equation (2), the probability of random jump is only correlated with the goal node weight and its value is in (0, 1). If P denotes a jump matrix, the elements in each column are the same and the sum of elements in each row is 1.
Walking according to edge weights means that random walkers select a node to reach an adjacent node directly with a certain probability along the edges of the network. If the probabilities of moving along edges are expressed by an edge transfer matrix S, then the probability s i j of a random walker moving from node i to node j along an edge is expressed as follows:
s i j = { 0 , e i j E w i j , e i j E
We let α represent the probability of random walkers walking along an edge, which is called the damping coefficient, and 1 α is the probability of random walkers jumping according to node weight. The walking process of random walkers in the information dispersion network is described as follows:
r ( t + 1 ) = r ( t ) ( α S + ( 1 α ) P )
Here, r ( t ) and r ( t + 1 ) R   n are n-dimensional vectors denoting the visiting probability distribution of random walkers to all nodes in the information dispersion network before and after the update, respectively. Their elements are in [0, 1]. Initially, r ( 0 ) = ( 1 , 0 ,   ,   0 ) . Langville et al. [42] pointed out that this type of random walk algorithm converges to a unique vector when the transition matrix satisfies the irreducible and periodic properties. We prove that the transfer matrix constructed in this paper satisfies this property in Appendix B. Therefore, Equation (4) eventually converges to a stable vector after multiple iterations, which can be considered as the credibility of comments.

4.2. Evidence Representation Based on Spatiotemporal Structure

As shown in Figure 2, the propagation process of source information can be expressed by a spatiotemporal structure graph. The temporal sequence can reflect the dynamic evolution of comments’ (evidence) content over time, while the spatial structure can reflect the real semantic interactions between evidence items. To alleviate the semantic sparsity issue, we enriched the semantic representation of evidence by aggregating the temporal neighborhood and spatial neighborhood information of evidence based upon the information propagating spatiotemporal structure. Additionally, considering the difference in evidence quality, evidence credibility should be integrated into the evidence representation module to enhance the reliability of the evidence’s semantic representation. Specifically, we considered three types of units: a temporal sequence representation unit, a spatial structure representation unit, and a fusion gate unit.

4.2.1. Evidence Temporal Sequence Representation Unit

The evolution of source information is triggered by a sequence of forwards or comments over time, as shown in Figure 2. We aimed to exploit the initial semantic representation of source information and related evidence posts (comments or forwarded content) in combination with the temporal structure P ( S ) = { ( c 0 , t 0 ) , , ( c j , t j ) , } to learn evidence representation regarding temporal sequence. To obtain a more reliable sequence representation, we integrated the reliability of temporal neighborhood information into the sequence modeling process and used bidirectional long short-term memory (Bi-LSTM) [43] to model the temporal dependency of the information.
h i = L S T M ( exp ( r i ) c i )
    h i = L S T M ( exp ( r i ) c i )
h i = [ h i ; h i ]
The above equations demonstrate how to model the temporal sequence representation of evidence i. Specifically, we applied the corresponding credibility weights (calculated in Section 4.1.2 upon each piece of posts in P) and captured reliable context from temporal neighbor posts around evidence i. In the equations, h i R l and h i R l denote the hidden state of the forward LSTM L S T M and backward LSTM L S T M . l is the number of hidden units in the LSTM and [:] denotes a concatenation operation. r i [ 0 , 1 ] represents the credibility of information. To avoid the vanishing gradient problem when r i is too small, we used exp ( r i ) instead of r i . h i R 2 l is a semantic representation of the temporal structure of evidence i (when i = 0, it represents source information).

4.2.2. Evidence Spatial Structure Representation Unit

To capture the local spatial structure characteristics of evidence posts’ interactions in message propagation, inspired by graph attention networks (GATs) [44], we adopted attention mechanisms on the information dispersion network. Although GATs can automatically capture the contributions (attention weights) of different nodes to the target node when aggregating neighboring nodes, it ignores the credibility of neighborhood information. Therefore, such an aggregation may result in excessive noise. We introduced the credibility of posts in the process of spatial neighborhood aggregation to enhance the reliable representation of evidences, which can be formulated as
β i j = s o f t m a x ( L e a k y   R e L U ( α T [ exp ( r i ) c i ; exp ( r j ) c j ] ) ) ,
  m i = | | K k = 1 σ ( j N i β i j k W k c j ) .
Equation (8) demonstrates how to model the semantic contribution of neighborhood posts to target posts (evidence). Specifically, we used a feed forward network as an attention function, which contained a single hidden layer with a LeakyReLU, and used the global credibility weights to optimize the local semantic contribution of information. In the equation, α R   2 d is a learnable parameter weight vector and β i j denotes the semantic contribution of neighborhood node j to target node i. Equation (9) demonstrates how to aggregate spatial neighborhood information according to the calculated contributions. The spatial neighborhood representation of a piece of evidence is obtained by a weighted summation over all spatial neighborhood semantic representations. To capture diversified representations of spatial structure relationships, attention is expanded to multi-head attention. Specifically, Equation (8) (i.e., the attention operation) is repeated K times, then the learned representations are concatenated. || denotes a concatenation operation, σ ( · ) denotes the exponential linear activation function, N i denotes the collection of posts directly connected with evidence i in the information dispersion network, W k R   q × 2 d is a learnable shared parameter matrix that acts on each node in the network, and m i R   K q is the semantic representation of the spatial structure of evidence i (when i = 0, it represents source information).

4.2.3. Spatiotemporal Feature Fusion Unit

To represent the semantic features of information from multiple perspectives, the temporal semantic representations and spatial structural representations of evidence are selected and combined through a fusion gate to obtain a semantic representation of the spatiotemporal structure of evidence. Because the temporal semantic representation and spatial structural semantic representation of evidence are not in the same semantic space ( 2 l K q ), it is necessary to convert them into the same semantic space (i.e., h , m R   h ).
h i = tan h ( W h h i )   m i = tan h ( W m m i )
Here, W h R   h × 2 l and W m R   h × K q denote the transformation matrixes from the different feature spaces of evidence i to an implied common space.
Next, we used a fully connected layer with a sigmoid activation function to learn the importance of temporal sequence semantic representation and spatial structure semantic representation, as shown in Equation (11):
z = σ ( W z [ h i ; m i ] ) ,
where W z R h × 2 h is a learnable weight matrix. z R   h is a weight vector to trade off the semantic representation from spatial and temporal structures. Its elements are in (0, 1). Finally, the two semantic representations are fused using different weights.
x i = z h i + ( 1 z ) m i
Here, denotes elementwise multiplication. x i R h is the information representation obtained through the fusion gate, and h is the dimension of the fusion gate output representation.

4.3. Semantic Aggregation of Evidence Based on a Capsule Network

Based on the spatiotemporal semantic representation of evidence, fake information can be detected by aggregating the implicit bias of evidence to evaluate the truthfulness of source information. We incorporated a capsule network [45] into our model to model the implicit bias of evidence toward claims. This process is illustrated in Figure 3, where we first modeled the semantic interactions between evidence and source information to capture the controversial points (false portions) of source information and form evidence capsules (low-level capsule). We then aggregated the implicit bias of each evidence capsule regarding the source information through a dynamic routing mechanism.

4.3.1. Semantic Interactions between Evidence and Source Information Based on Multi-Head Attention

Although the fusion gate can efficiently aggregate the spatiotemporal neighborhood information of evidence to obtain a reliable evidence representation, it cannot model the fine-grained semantic interactions between evidence and source information. To capture the focus of evidence on source information, we adopted a multi-head attention mechanism [46] to model the semantic interactions between evidence and source information. Specifically, we considered the evidence representation set X = { x 0 , x 1 , , x m } R   ( m + 1 ) × h obtained in Section 4.2 as query vectors Q and considered the semantic representation of source information S = { w 1 , w 2 , , w l } R l × d as keys (K) and values (V). We used each piece of evidence in X to assign attention to each word in S through scaled dot-product attention, and then applied the resulting attention weights to the source information as follows:
A t t e n t i o n ( Q , K , V ) = s o f t m a x ( [ X K T d ] V )
To prevent the model from focusing too heavily on a particular location, we first mapped queries, keys, and values to different spaces through different types of linear transformations. We then performed attention calculations in different spaces in parallel to obtain representations of each comment (evidence) in different subspaces.
H e a d i = A t t e n t i o n ( X W i Q , S W i K , S W i V ) E = M u l t i H e a d A t t e n t i o n ( X , S , S ) = R e L U ( [ H e a d 1 | | H e a d 2 | | H e a d 3 H e a d n ] )
Here, W i Q R   h × p , W i k , W i v R   d × p and E = { e 0 , e 1 , , e m } R   ( m + 1 ) × n p represent collections of underlying evidence capsules.

4.3.2. Evidence Aggregation Based on a Dynamic Routing Mechanism

In the fake news detection task, high-level capsules are regarded as the representations of news (source information) authenticity, namely, category capsules. Specifically, there are two types of category capsules, namely, fake or true, in our capsule network. Each category capsule is assembled from the underlying evidence capsules using a weighted summation over all corresponding vectors. It can be described as follows:
v j = s q u a s h ( i = 0 m O j | i W j i e i ) , j ( 0 , 1 ) ,
where v j R   d v is a category capsule. O j | i is the probability that evidence e i supports that source information belongs to category j, which can be calculated by a dynamic routing mechanism on original logits b j i . The specifics of this process are provided in Algorithm 1. W j i R   d v × n p is a learned parameter matrix. To enable the module of the category capsule to determine the probability that information belongs to this category and increase nonlinear characteristics, a squash operation is applied to compress the module length of the capsule to [0, 1].
v j = s q u a s h ( v j ) = v j 2 1 + v j 2 v j v j
Algorithm 1 Dynamic Routing Mechanism
Input:  W j i , e i
Output:  v j
1: Init the coupling parameter b j i = = 0
2: for each iteration do
3:    Update O j | i = s o f t m a x ( b j i )
4:    Update all the class capsules based on Equation (15)
5:    Update b j i = W j i e i · v j
6: end for
7: return v j

4.3.3. Detection

After category capsules have been obtained through the dynamic routing mechanism, the category capsule with the largest module length is chosen as the representation of news (source information) truthfulness.
y ^ = max ( v 0 , v 1 )
Finally, the cross-entropy loss is used to capture the error between forecast results and factual value:
L ( θ ) = i y i log ( y ^ i ) ,
where θ denotes the model parametric set and y i { 0 , 1 } is the ground-truth label of the i-th instance.

5. Experiments and Discussion

In this section, we present experiments conducted on public datasets to evaluate the effectiveness of the TRSA model. Particularly, we aim at answering the four evaluation issues, as follows:
  • EI1: Can TRSA achieve better performance than the state-of-the-art models?
  • EI2: How effective is each component of TRSA in improving detection performance?
  • EI3: Can TRSA make detection results easy to understand using the evidence reasoning and evidence aggregation modules?
  • EI4: What is the performance of the model for the early detection of fake news?

5.1. Experimental Datasets and Settings

5.1.1. Datasets

We evaluated our model on two real datasets: PHEME (English dataset, mainly from international Twitter) [47] and CED (Chinese dataset, mainly from the domestic Sina platform) [48]. The PHEME dataset contains three types of labels: true, fake, and uncertain. The CED dataset contains only true and fake labels. Because CED lacks the basic information of the users participating in a discussion, we collected basic information on the users participating in discussions by designing a web crawler (since some of the participating accounts have been cancelled, we only collected nine types of meta-features of about 460 thousand related accounts, including gender, location, description, message, followers, friends, etc. The values of the cancelled accounts’ multiple meta-features are given as 0). Table 1 provides the detailed statistics of datasets.

5.1.2. Comparison Methods

We compared TRSA to the following baselines:
  • DTC [8]: This method utilizes multi-dimensional statistical features from the four perspectives of text content, user characteristics, forwarding behavior, and communication mode, and implements decision trees to determine the truthfulness of information;
  • HSA-BLSTM [49]: HSA-BLSTM is a hierarchical neural network model used to describe the semantic features of different levels of rumor events (a rumor event is composed of source information and multiple forwarded or commented posts, and each post is composed of words);
  • SVM-TS [50]: This method utilizes SVMs with linear kernel function to model temporal features for false information;
  • DTCA [21]: This model considers user comments as an evidence source for the truthfulness judgment of a claim and uses a co-attention network to enhance the semantic interactions between evidence and source information;
  • BERT-Emo [35]: BERT-Emo uses a pretrained language model to obtain the text semantic representation and the emotions difference between an information publisher and their audience;
  • GLAN [22]: GLAN is a novel neural network model that can corporately model local semantic features and global propagating features;
  • BiGCN [23]: BiGCN is a two-layer graph convolutional network model used to capture the bidirectional propagating structure of information. It also integrates source post information into each layer of the GCN to enhance the impact of source information;
  • DDGCN [31]: DDGCN is a dynamic graph convolution neural network model used to capture the characteristics of the information propagation structure and knowledge entity structure at each point in time. Since our model only concentrates on the contents and social contexts, we do not introduce a dynamic knowledge structure.

5.1.3. Experimental Setup

The environmental configurations of all experiments in this study were as follows: Intel Core i9 CPU, 64 GB of RAM, GTX-3090 GPU.
The experimental environments and parameters of all compared methods in this study were set according to the original reports. We used the PyTorch framework to implement our models. The model parameters were optimized and updated using the Adam optimizer. In our model, we used pre-trained BERT models (bert-base-uncased for English and bert-base-Chinese for Chinese) to initialize the vector representations of text information. We employed accuracy (A), precision (P), recall (R), and F1 as assessment indicators. Model hyperparameter details are provided in Table A2 in Appendix C.

5.2. Performance Comparison

To answer EI1, we contrasted TRSA with baseline models on two real datasets. The experimental results are reported in Table 2. The bold values represent the best results, and the underlined values represent the second-best results.
We can obtain several observations, as follows:
  • The deep neural network models are superior to the models based on feature engineering (DTC, SVM-TS). The most fundamental reason is that deep neural network models can automatically learn implicit high-level semantic representations, whereas traditional machine learning methods that rely on feature engineering can only capture obvious false information in the presentation layer, which leads to various limitations;
  • The models that add semantic interactions between claims and comments (DTCA, BERT-Emo) perform better than the models that work with text and hierarchical time-series structure (HSA\_BLSTM). DTCA automatically captures controversial portions of source information through a co-attention mechanism. The BERT-Emo model constructs a dual emotional feature set by measuring the difference between the emotions of an information publisher and their audience to improve false information detection performance;
  • The models based on information propagation structure are superior to the models based on text semantics (DTCA, BERT-Emo, HAS-BLSTM). For example, GLAN, BiGCN, and DDGCN achieved improvements of approximately 0.5% to 3.2% in terms of accuracy on the two datasets compared to DTCA. This indicates that mining the hidden structural features of information propagation is very helpful for improving detection performance. However, in terms of precision, because DTCA uses decision trees to filter out some low-credibility noise comments, its performance was approximately 1.5% higher than that of the aforementioned models on PHEME. Moreover, it can be observed that DDGCN showed better performance than BiGCN and GLAN, indicating that spatiotemporal structure features can finely depict the semantic interaction in message propagation and thus improve performance;
  • The proposed model outperformed most post-based models and propagation-based models in terms of most indicators on the two real datasets. Compared to DTCA, the proposed model enriched the claim and comment semantic information from the perspective of time and space propagation structures. Its performance was 5.7%, 3.2%, 7.15%, and 5.3% higher than that of DTCA in terms of accuracy, precision, recall, and F1, respectively. Compared to DDGCN, these four indicators were 3%, 4%, 2.65%, and 3.5% higher on average. This is because DDGCN treated all comments equally, which introduces noise. In contrast, our model reduced noise by calculating the credibility of comments.
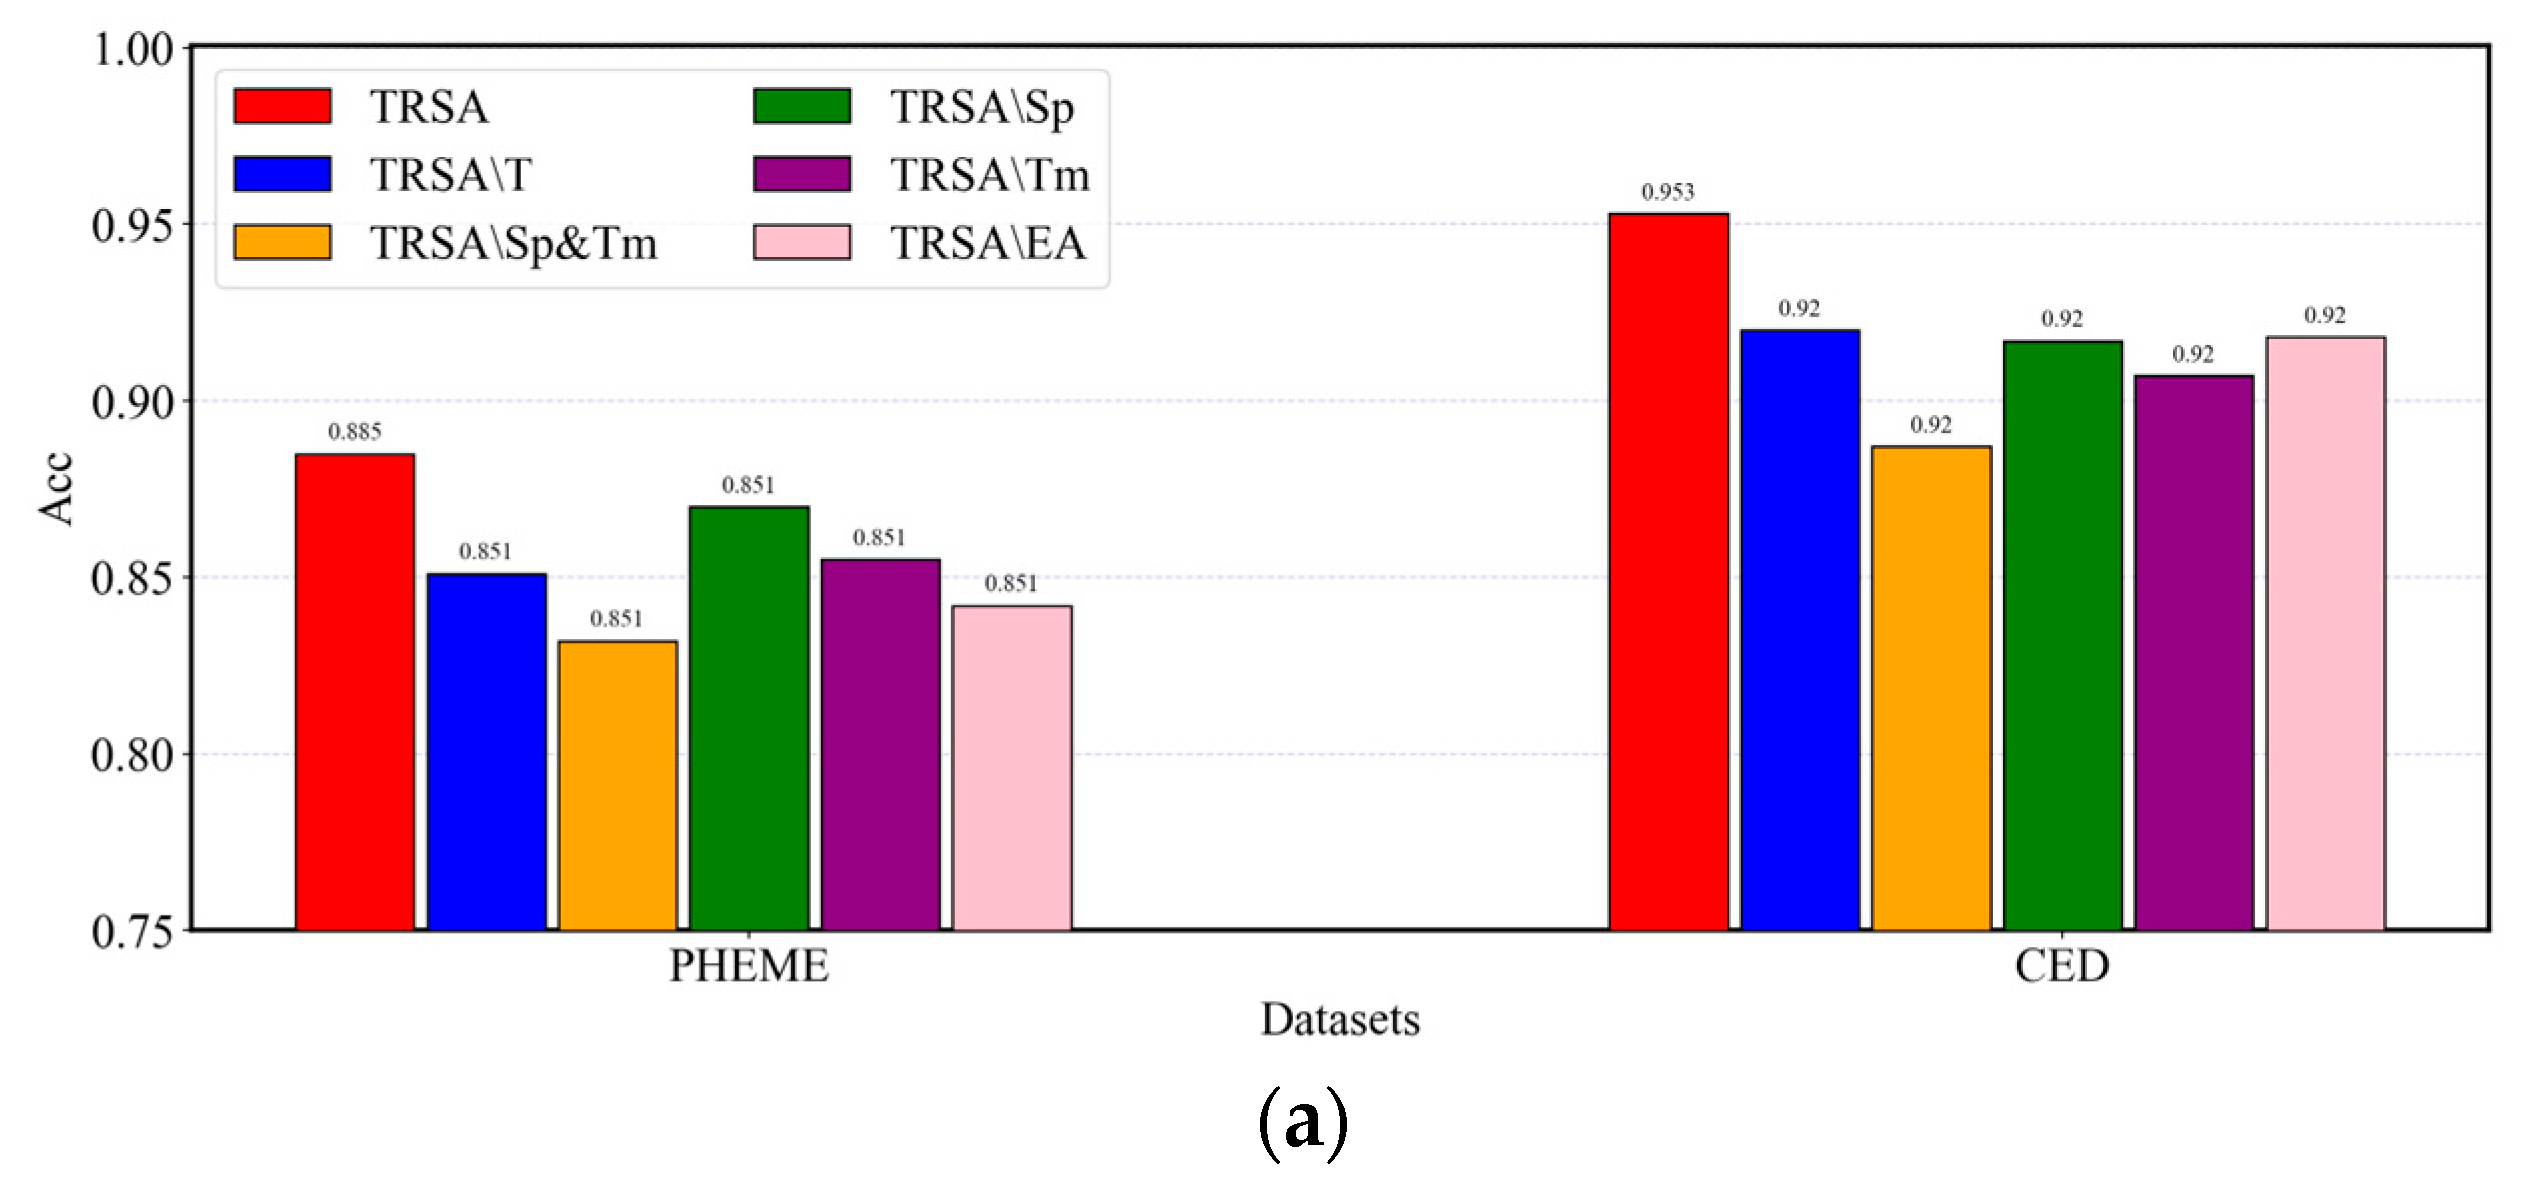
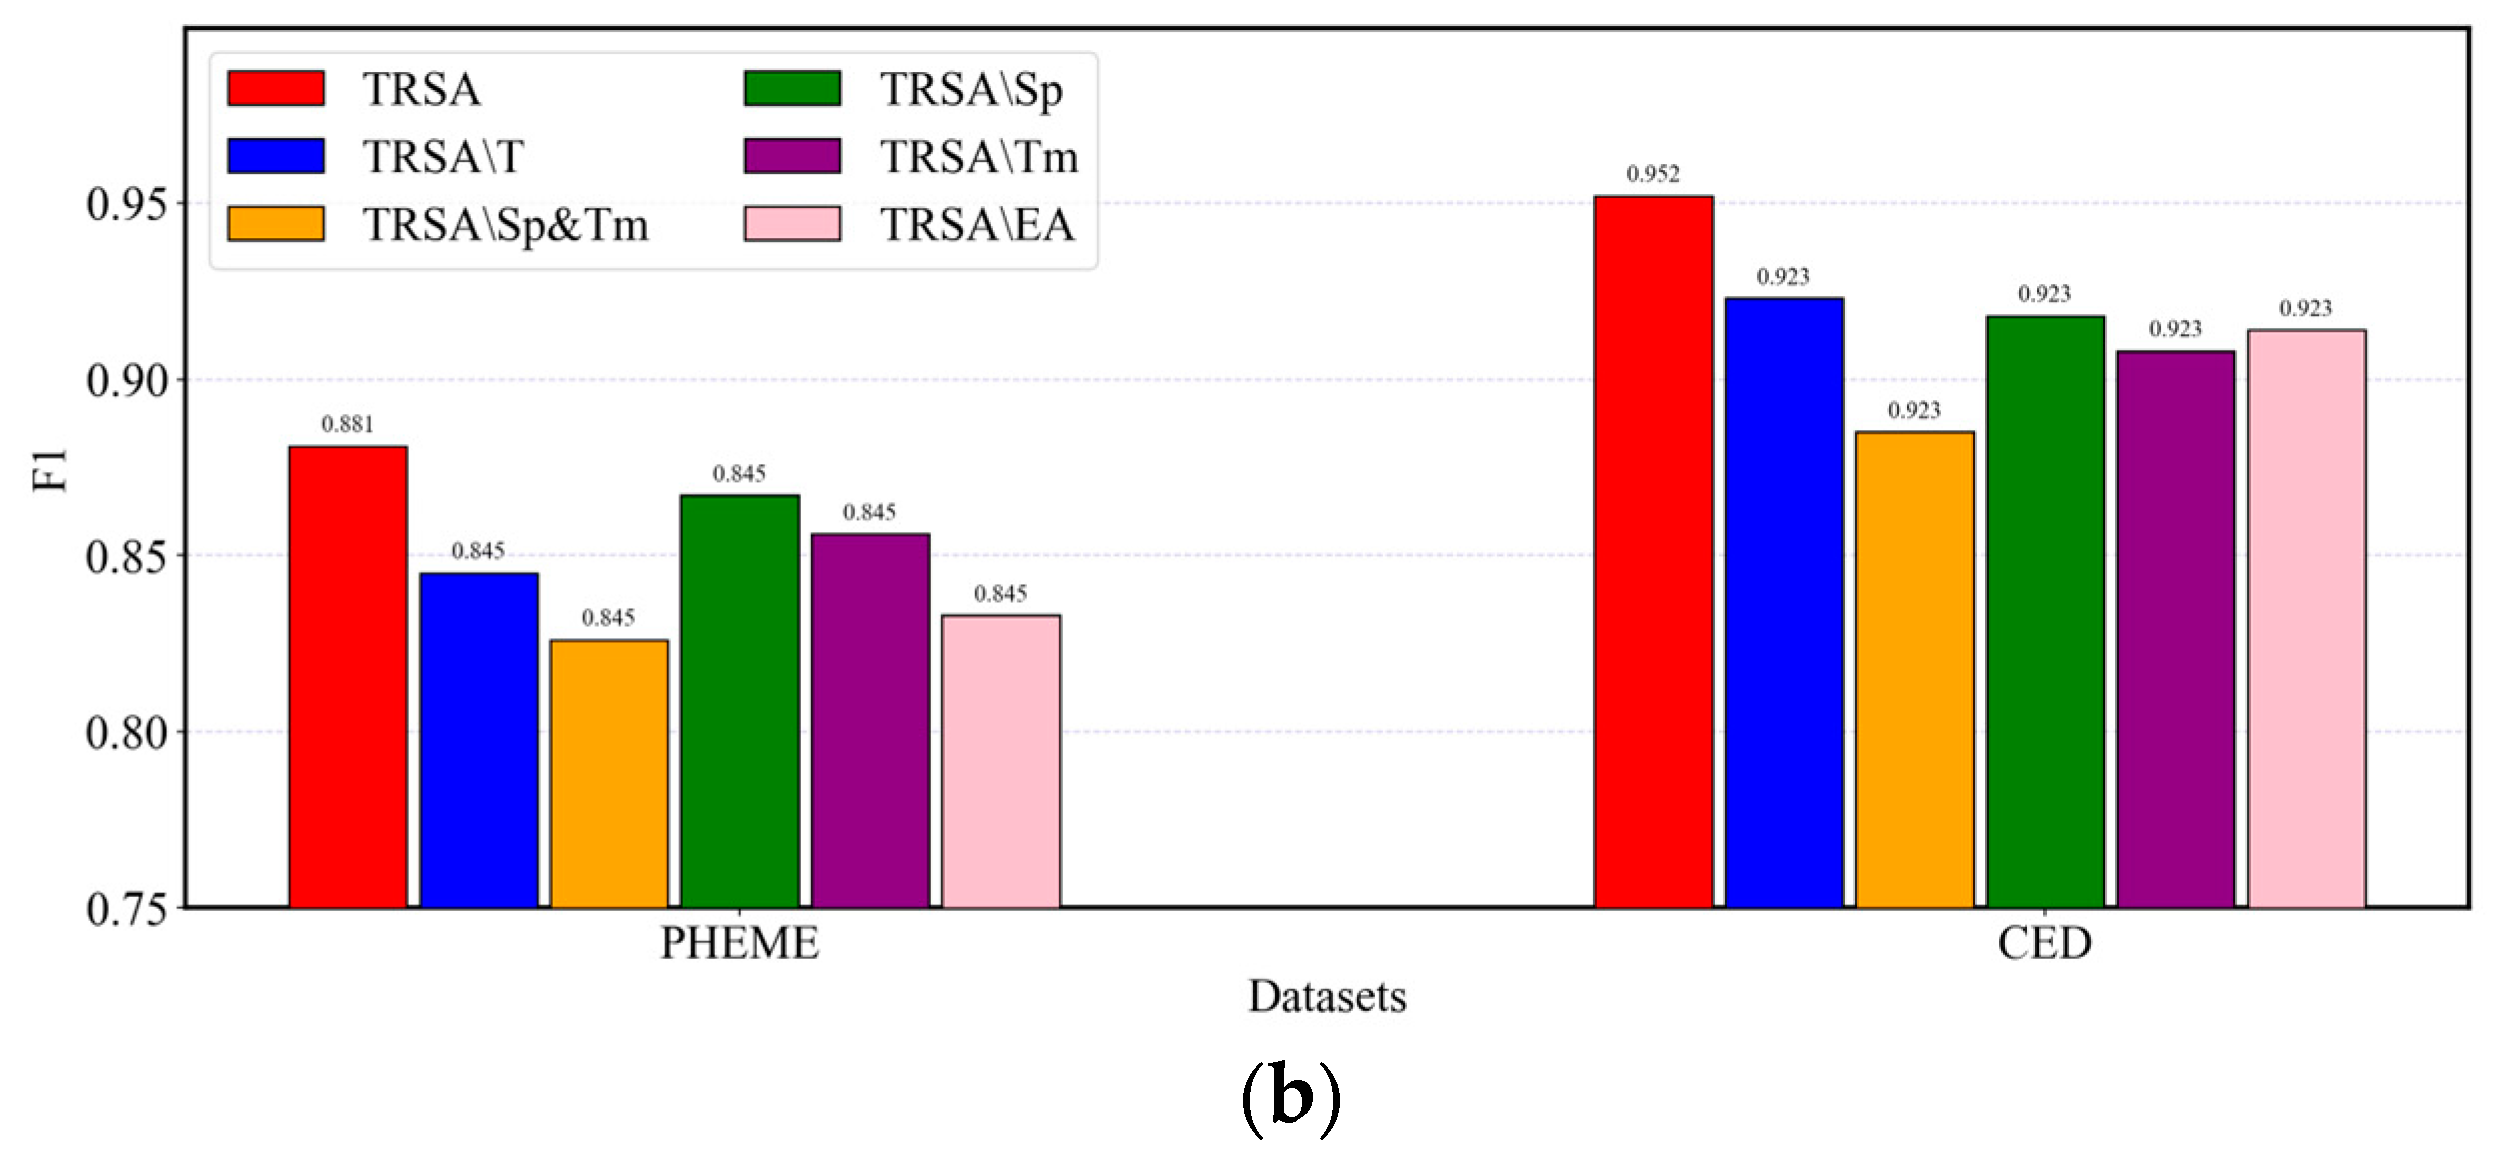
5.3. Ablation Study

To answer EI2, we investigated how effective the key components were on TRSA by designing five variations: (1) TRSA\T removes the trust-aware evidence reasoning module. (2) TRSA\Sp removes the spatial characteristics of information propagation. (3) TRSA\Tm removes the temporal characteristics of information propagation. (4) TRSA\Sp&Tm removes the spatiotemporal characteristics of information propagation. (5) TRSA\EA replaces evidence aggregation with a max-pooling layer and a fully connected layer.
In Figure 5, one can see that all variations performed less well than the complete TRSA model on both datasets. Specifically, when removing the spatiotemporal characteristics of information propagation, the F1 dropped by 5.5% on the PHEME dataset and 6.7% on the CED dataset. This indicates the necessity of the temporal and spatial propagation structure information to improve model performance. Furthermore, the results demonstrate that removing spatial structure caused a larger decrease in model performance compared to removing the temporal structure. This indicates that the spatial structure was more effective than the temporal structure. When removing the trust-aware evidence reasoning module, the decrease in terms of F1 on PHEME was 3.6% and that on CED was 2.9%. This demonstrates that the impact of low-quality comments on the performance of the model could be mitigated by the evidence credibility index. The replacement of the evidence aggregation module led to a decrease in F1 of 4.8% on PHEME and 3.8% on CED. This demonstrates the necessity of aggregating evidence semantics to achieve better performance.

5.4. Explainable Analysis

The trust-aware evidence reasoning and evidence aggregation modules made the decision-making process of TRSA more transparent and the results more interpretable. To answer EI3, we visualized the evidence credibility, attention weight distribution, and implicit biases of evidence when predicting fake news. Figure 6 presents the results for a specific sample in the PHEME testing set.
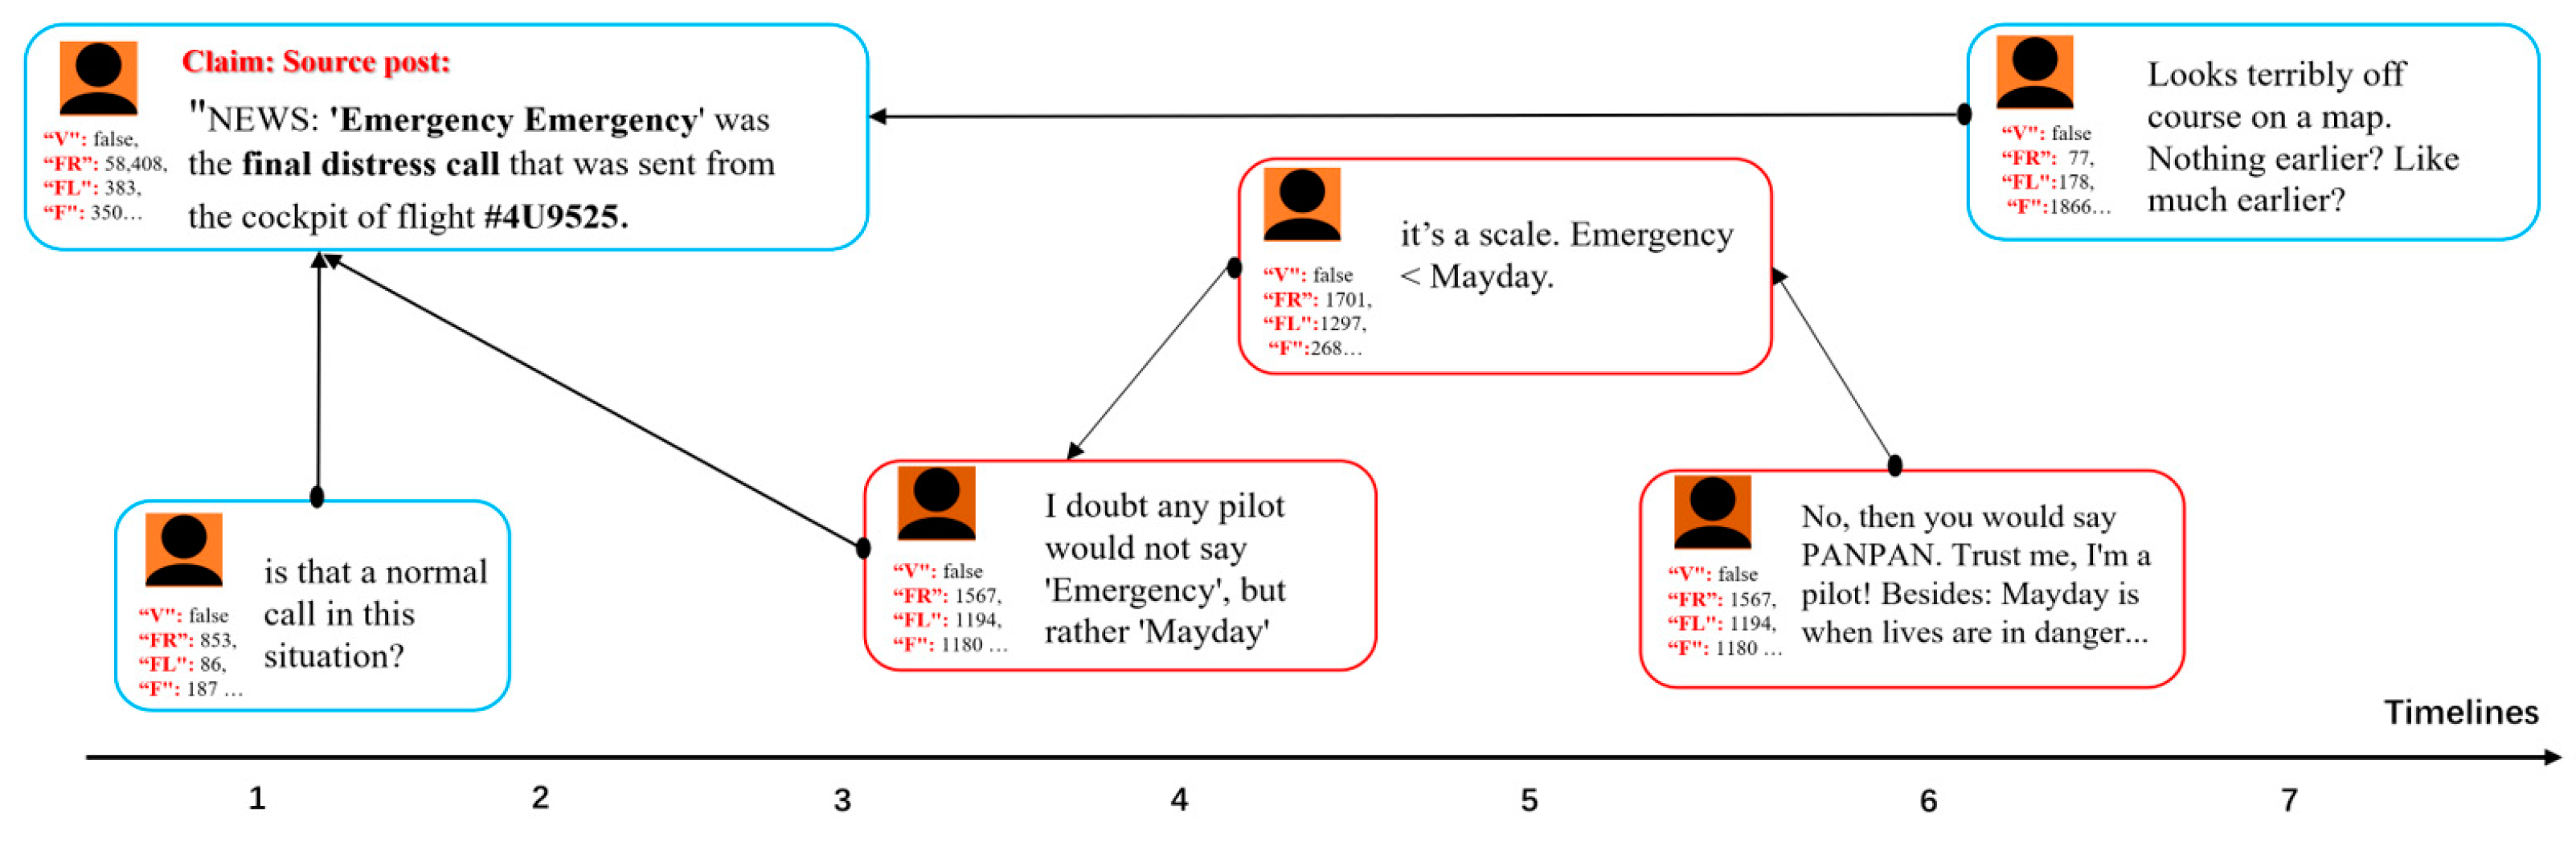
  • First, we focused on each token in the source information by accumulating the attention values of the interactions between evidence (high-quality comments) and claims (source information) in the information propagation process, which is represented by the size and color of each word. The larger the font, the darker the color of the word, indicating that more attention is assigned to the word in the process of information propagation and the word is more controversial. One can see that “Emergency”, “distress”, and “# 4U9525” have been widely discussed by users in the process of information propagation, which further demonstrates that our model can automatically capture controversial content;
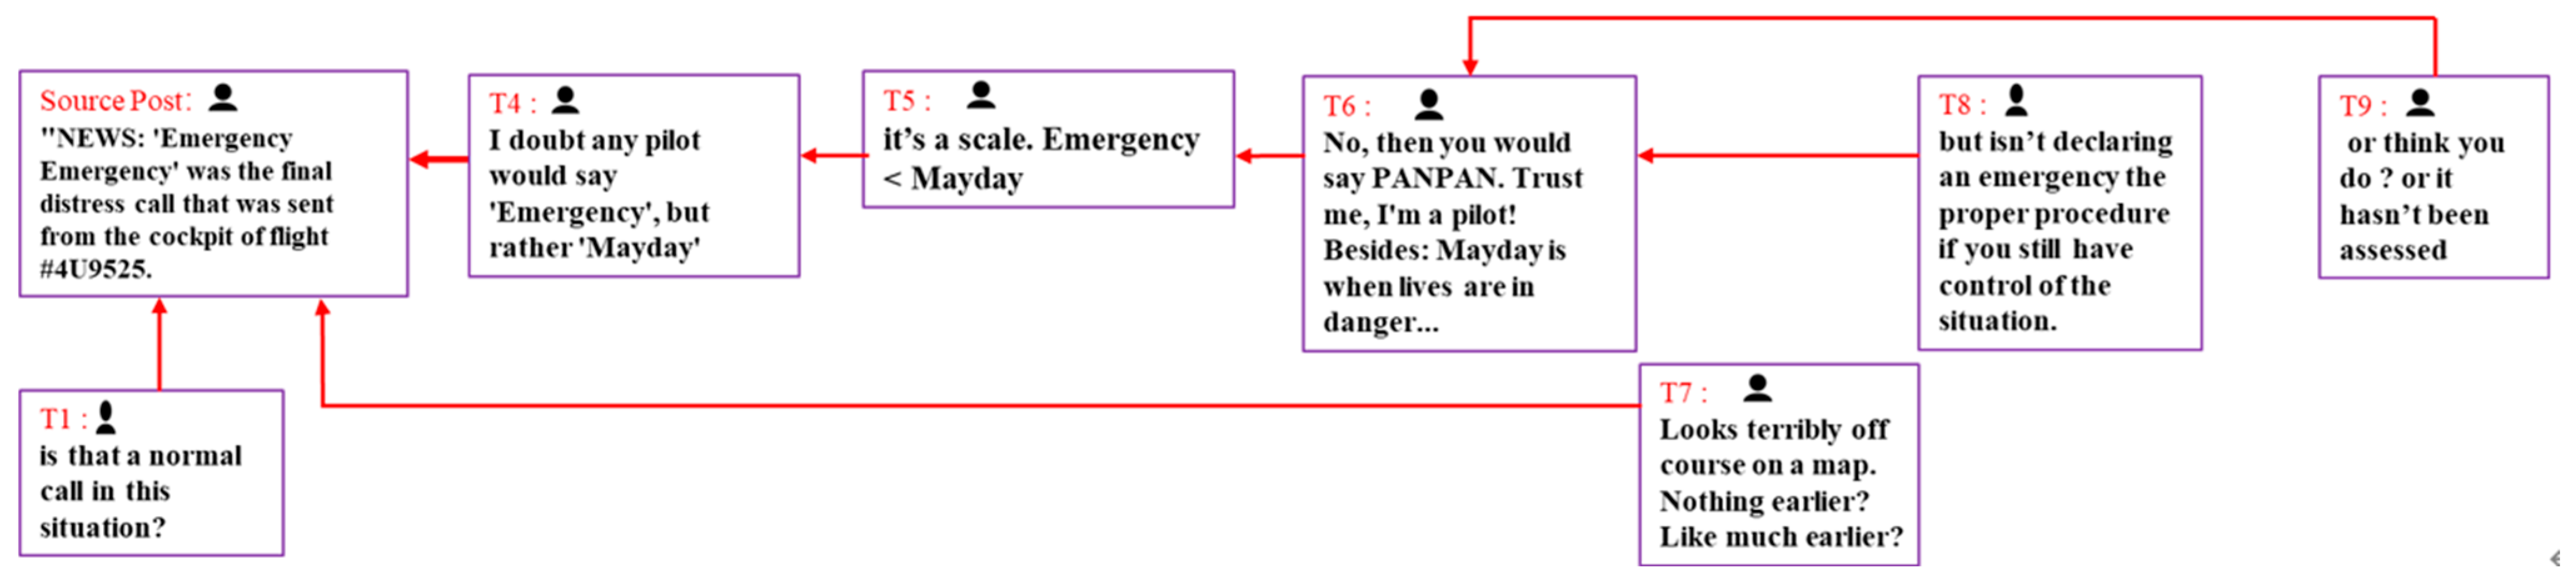
  • Second, we used Gephi to draw the information dispersion network, where the sizes of nodes were determined by their credibility (the higher the credibility of the node, the larger the node). One can see that the black nodes represented source information, and the other nodes represented related forwarding or comment posts. Comments endowed with high credibility weights could be used as evidence to prove that the source information is fake. Consider the following comments. “I doubt that any pilot would not say ‘Emergency,’ but rather ‘Mayday’.” “No, then you would say ‘PANPAN’. Trust me, I’m a pilot! Besides, ‘Mayday’ is a time when life is in danger.” “By the way: Cabin pressure loss in an airliner is a classic case for Mayday! \# 4u9525?”. The “PANPAN” and “Mayday” terms appearing in these comments are internationally used radio crisis call signals, indicating that the “Emergency” term in the source information is incorrect. This indicates that the trust-aware evidence reasoning module can provide highly reliable evidence to explain the model results. To measure the support of evidence for results objectively, we examined the implicit bias distribution of evidence by visualizing the aggregation probabilities of the underlying evidence capsules into the high-level category capsule in the evidence aggregation module. One can see that most of the highly credible evidence refutes the source information content;
  • To unfold user attention distribution differences between fake and true news content, we randomly selected three fake (0–2) and three true (3–5) news stories, and plotted their token weight distributions based on the attention of the interactions between the evidence and claims. As shown in Figure 7, the horizontal direction from left to right represented the word sequence. In the vertical direction, the first three entries represented fake information (0–2) and the last three represented true information (3–5). One can see that some parts of fake news had attracted widespread attention, while the attention to various components of real news was relatively uniform. The results show that to determine whether a piece of news is fake, one should first examine the distribution of users’ attention to news content. The evidence of fake news in terms of users’ attention may be unevenly concentrated on certain parts of news content.

5.5. Early Fake News Detection Performance

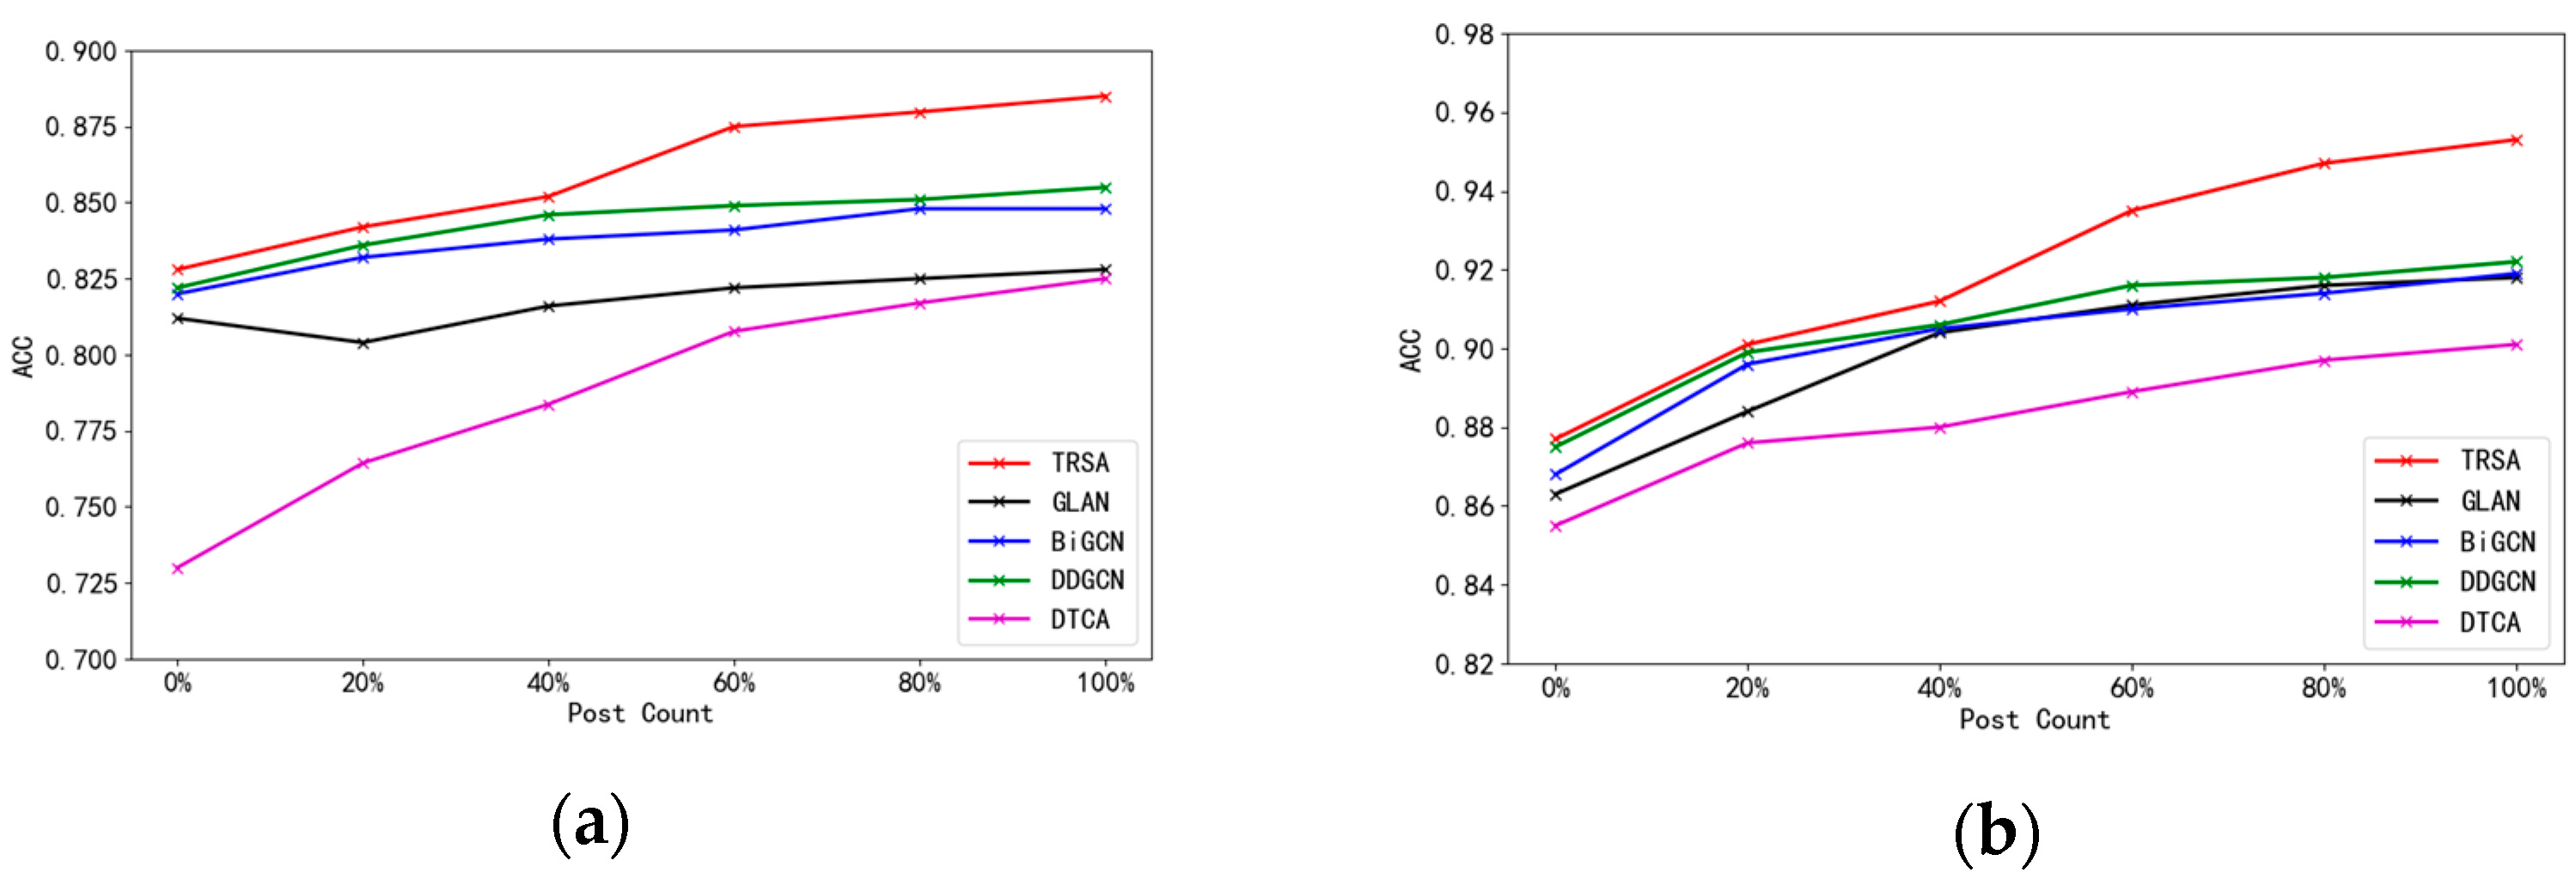
  • To answer EI4, we sorted all comments (or forwarded posts) according to their publishing time and evaluated the changes in TRSA’s detection performance by changing the number of posts received (0%, 20%, 40%, 60%, 80%, 100%). Figure 8 presents the early detection results of the model for both datasets. One can see that when only the first 40% of comments were considered, the accuracy of the proposed model could reach 85.2% and 91.2% on the two datasets, which was superior to the results of the baseline models. This indicates that our model performed well in terms of early detection. Additionally, we observed that the accuracies of the GLAN, BiGCN, and DDGCN models increased slowly over time, whereas the proposed model exhibited significantly improved performance over time. This is because the dispersion network structure of information becomes more complex and the types of posts become more diversified over time. The proposed model has a module for filtering noise posts. Therefore, they had good robustness.

5.6. Limitations Analysis of TRSA

In Figure 8, one can see that our model’s performance was not outstanding when the number of posts received by the model was between 0 and 20%. To further analyze the performance of the model in scenarios with few posts (low resources), we finely divided the test set into three parts based on the number of posts in the news (Source Information). The details are shown in Table 3. One can see that TRSA gave an outstanding performance on the test set for any test sample with more than 10 posts, while on the test set in which there were samples with fewer than three posts, TRSA did not perform well. This indicates that TRSA can capture valuable semantics from multiple posts, but its performance can be limited by samples with fewer posts.

6. Conclusions

Fake news detection has become a significant topic based on the fast-spreading and detrimental effects of such news. In this study, we proposed an interpretable fake news detection method called TRSA based on trust-aware evidence reasoning and spatiotemporal feature aggregation, which aimed to: (1) discover some reliable evidence and the false portions of source information to understand why news pieces are identified as fake; and (2) capture the characteristics of high-level spatiotemporal structures and enhance the semantic representation of evidence to improve detection performance. Extensive experiments on two benchmark datasets indicated that the proposed model could provide explanations for fake news detection results, as well as achieving better performance, boosting 3.5% in the F1-score on average. We believe that TRSA can be applied to other short-text classification tasks on social media, such as stance detection and hate speech detection. Based on the limitations analysis in Section 5.6, we plan to optimize our work from two perspectives to improve the performance of the model under zero or few-shot posts, by (1) introducing background knowledge to enrich the semantic information of news and (2) considering more meta data, such as the reliability of news sources, to enhance our model detection performance.

Author Contributions

Conceptualization, J.C. and G.Z.; methodology, J.C. and J.L.; software, J.C.; validation, J.C., S.W. and S.L.; writing—original draft preparation, J.C.; writing—review and editing, G.Z. and J.L.; visualization, J.C.; funding acquisition, J.C. and G.Z. All authors have read and agreed to the published version of the manuscript.

Funding

This research was funded by the Henan Province Science and Technology Project (Grant No. 222102210081).

Institutional Review Board Statement

Not applicable.

Informed Consent Statement

Not applicable.

Data Availability Statement

We evaluated our model on two public datasets: PHEME (https://figshare.com/articles/dataset/PHEME_rumour_scheme_dataset_journalism_use_case/2068650 (accessed on 8 August 2022)) and CED (https://github.com/thunlp/Chinese_Rumor_Dataset (accessed on 8 August 2022).

Conflicts of Interest

The authors declare no conflict of interest.

Appendix A. User Authority Calculation Method Based on Multidimensional Attribute Weighted Fusion

To represent authority, principal component analysis (PCA) was used to fuse multiple metadata features of users as
w i = λ 1 V F i + λ 2 F L i + λ 3 F R i + λ 4 D i + λ 5 G E O i + λ 6 F i
where λ i represents the weight coefficient of the user’s ith meta-feature. V F i , D i , and G E O i represent whether the elements of “verified,” “geo,” and “homepage introduction” exist, respectively. F L i , F R i , and F i represent the numbers of followers, friends, and favorites, respectively.
Table A1 lists the metadata and other information of users participating in discussion. For Boolean features, when the value was true we converted it to a value of one, and when the value was false we converted it to a value of zero. Because the value ranges of each feature were very different, we applied the min-max normalization method to make the values of the metadata features of the six-dimensional users dimensionless while keeping their feature distribution characteristics unchanged.
Table A1. Metadata characteristics of users participating in discussion.
Data TypeMultidimensional MetadataWeights
PHEMECED
BOOLverified(V)1.20 × 10−62.19 × 10−7
whether there is homepage introduction (D)1.00 × 10−52.25 × 10−4
whether geo-spatial positioning is allowed (GEO)1.26 × 10−58.08 × 10−6
Long Intfans (FL)2.11 × 10−11.26 × 10−1
friends (FR)9.58 × 10−11.06 × 10−2
favorites (F)(PHEME)/message (M)(CED)1.91 × 10−19.91 × 10−1
The PCA method was adopted to convert six-dimensional metadata user features into multiple comprehensive indicators to calculate user authority while minimizing the loss of metadata information. Figure A1 presents the relationship between the number of principal components and the variance contribution rate.
Figure A1. Variance contribution rate of different principal components on two data sets.
Applsci 13 05703 g0a1
One can see that the variance contribution rate of the first principal component on both datasets exceeded 0.8. Therefore, to simplify our calculations, we directly represented the authority of users involved in a discussion. For the two datasets, the weights of the six-dimensional features in the first principal component are presented in the third column of Table A1.

Appendix B. A Proof of the Irreducible and Aperiodic Property of the Transfer Matrix

Let B = α S + ( 1 α ) P .
First, we proved that matrix B was irreducible: since all elements in S were greater than or equal to 0 and all elements in P were greater than 0, all elements in B were greater than 0. Therefore, the directed graph G(B) corresponding to matrix B must be strongly connected. According to Theorem A1.
Theorem A1. 
Complex matrix B of order n (n > 1) is irreducible if and only if the directed graph G(B) corresponding to matrix B is strongly connected, matrix B was irreducible.
Then, we proved that matrix B had aperiodic property: according to the previous analysis, the elements on the diagonal of matrix B were all greater than 0, so there were self-cyclic edges in its corresponding strongly connected graph. Therefore, matrix B also had aperiodic property.

Appendix C. Optimal Parameter Configuration of the TRSA Model on Two Datasets

For easy understanding, Table A2 shows the important mathematical notations used throughout the paper.
Table A2. Important notations and descriptions.
NotationsDescriptions
Sithe news (source information) to be detected
w l i a d-dimensional vector denoting the semantic feature of token in Si
u l the authority of user i
P ( S i ) = { ( c 0 ,   t 0 ) , , ( c j , t j ) , } the temporal structure of S i , where c j is a d-dimensional vector representing the post (comment or forwarded) content at time j in the propagation of information S i and   t j is the time at which post c j is generated
G(Si) = <V, E>the propagation graph of news Si, V is the node collection of G(Si), denoting posts in source information propagation. E denotes the edge collection, describing the association relationship between nodes in G(Si)
ω i j the recognition degree of post i relative to the content of post j
r ( t + 1 ) n-dimensional vectors denoting the visiting probability distribution of random walkers to all nodes in the information dispersion.
h i the semantic representation of the temporal structure of evidence i
m i the semantic representation of the spatial structure of evidence i
x i the semantic representation of the spatiotemporal structure of evidence i
E = { e 0 , e 1 , , e m } the collections of underlying evidence capsules; e m is the semantic representation of an underlying evidence capsule
v j the semantic representation of a category capsule
Table A3 presents the optimal configuration of the proposed model for the two datasets.
Table A3. Detailed configuration of model hyperparameters.
HyperparametersDescriptionsValues
LEARNING_RATEthe initial learning rate of the model2 × 10−5
BATCH_SIZEnum. of training samples in one session8
EPOCH num. of iterations15
MAX_SEQUENCE_LENGTHthe maximum number of tokens contained in the news required by model70
LEN_COMthe maximum number of posts associated with the news required by model50
NHEADSnumber of heads with multi-head attention8
LSTM_hidden sizethe number of hidden units in the LSTM, which are used to control the dimensions of h i 384
GAT_hidden sizethe number of hidden units in the GAT, which are used to control the dimensions of m i 96
Multi_Head Attention_outsizethe number of hidden units in Multi_Head Attention, which are used to control the dimensions of e i 200
Capsule_out_dimthe number of hidden units in category capsule, which are used to control the dimensions of v j 200
Further, we analyzed the changes in model performance under different damping coefficients α (described in Section 4.1.2 and the optimal damping parameter determined. The value range of the damping coefficient is [0, 1]). For α = 0 , random walkers only jump according to user authority, regardless of the actual dispersion network (i.e., the credibility of the obtained evidence is only determined by user own authority). For α 1 , random walkers largely ignore user authority and jump along the actual dispersion network. In Figure A2, one can see that on the PHEME dataset, when α = 0.8 is used, the model performance is optimal, and on the CED dataset the optimal value of the damping coefficient is 0.7.
Figure A2. Performance analysis with different damping coefficients. (a) PHEME Dataset. (b) CED Dataset.
Applsci 13 05703 g0a2

References

  1. Sheng, Q.; Cao, J.; Bernard, H.R.; Shu, K.; Li, J.; Liu, H. Characterizing multi-domain false news and underlying user effects on chinese weibo. Inf. Process. Manag. 2022, 59, 102959. [Google Scholar] [CrossRef]
  2. Fourney, A.; Racz, M.Z.; Ranade, G.; Mobius, M.; Horvitz, E. Geographic and temporal trends in fake news consumption during the 2016 us presidential election. In Proceedings of the 2017 ACM on Conference on Information and Knowledge Management, Association for Computing Machinery, Singapore, 6–10 November 2017; pp. 2071–2074. [Google Scholar]
  3. Islam, M.S.; Sarkar, T.; Khan, S.H.; Kamal, A.H.M.; Hasan, S.M.; Kabir, A.; Yeasmin, D.; Islam, M.A.; Chowdhury, K.I.A.; Anwar, K.S.; et al. COVID-19-Related Infodemic and Its Impact on Public Health: A Global Social Media Analysis. Am. J. Trop. Med. Hyg. 2020, 103, 1621–1629. [Google Scholar] [CrossRef] [PubMed]
  4. Lee, J.-W.; Kim, J.-H. Fake Sentence Detection Based on Transfer Learning: Applying to Korean COVID-19 Fake News. Appl. Sci. 2022, 12, 6402. [Google Scholar] [CrossRef]
  5. Verri Lucca, A.; Augusto Silva, L.; Luchtenberg, R.; Garcez, L.; Mao, X.; García Ovejero, R.; Miguel Pires, I.; Luis Victória Barbosa, J.; Reis Quietinho Leithardt, V. A Case Study on the Development of a Data Privacy Management Solution Based on Patient Information. Sensors 2020, 20, 6030. [Google Scholar] [CrossRef]
  6. Alghamdi, J.; Lin, Y.; Luo, S. Does Context Matter? Effective Deep Learning Approaches to Curb Fake News Dissemination on Social Media. Appl. Sci. 2023, 13, 3345. [Google Scholar] [CrossRef]
  7. Bazmi, P.; Asadpour, M.; Shakery, A. Multi-view co-attention network for fake news detection by modeling topic-specific user and news source credibility. Inf. Process. Manag. 2023, 60, 103146. [Google Scholar] [CrossRef]
  8. Qazvinian, V.; Rosengren, E.; Radev, D.; Mei, Q. Rumor has it: Identifying misinformation in microblogs. In Proceedings of the 2011 Conference on Empirical Methods in Natural Language Processing, Edinburgh, Scotland, UK, 27–31 July 2011; pp. 1589–1599. [Google Scholar]
  9. Castillo, C.; Mendoza, M.; Poblete, B. Information credibility on twitter. In Proceedings of the 20th International Conference on World Wide Web, Hyderabad, India, 28 March–1 April 2011; pp. 675–684. [Google Scholar]
  10. Potthast, M.; Kiesel, J.; Reinartz, K.; Bevendorff, J.; Stein, B. A stylometric inquiry into hyperpartisan and fake news. In Proceedings of the 56th Annual Meeting of the Association for Computational Linguistics (Volume 1: Long Papers), Melbourne, Australia, 15–20 July 2018; pp. 231–240. [Google Scholar]
  11. Ito, J.; Song, J.; Toda, H.; Koike, Y.; Oyama, S. Assessment of tweet credibility with lda features. In Proceedings of the 24th International Conference on World Wide Web, Association for Computing Machinery, Florence, Italy, 18–22 May 2015; pp. 953–958. [Google Scholar]
  12. Kwon, S.; Cha, M.; Jung, K.; Chen, W.; Wang, Y. Prominent features of rumor propagation in online social media. In Proceedings of the 2013 IEEE 13th International Conference on Data Mining, Dallas, TX, USA, 7–10 December 2013; pp. 1103–1108. [Google Scholar]
  13. Hu, X.; Tang, J.; Gao, H.; Liu, H. Social spammer detection with sentiment information. In Proceedings of the 2014 IEEE 14th International Conference on Data Mining, Shenzhen, China, 14–17 December 2014; pp. 180–189. [Google Scholar]
  14. Karimi, H.; Tang, J. Learning hierarchical discourse-level structure for fake news detection. In Proceedings of the 2019 Conference of the North American Chapter of the Association for Computational Linguistics, Human Language Technologies, Volume 1 (Long and Short Papers), Minneapolis, MN, USA, 2–7 June 2019; pp. 3432–3442. [Google Scholar]
  15. Shu, K.; Wang, S.; Liu, H. Beyond news contents: The role of social context for fake news detection. In Proceedings of the 12th ACM International Conference on Web Search and Data Mining, Association for Computing Machinery, Melbourne, VIC, Australia, 11–15 February 2019; pp. 312–320. [Google Scholar]
  16. Wang, Y.; Qian, S.; Hu, J.; Fang, Q.; Xu, C. Fake news detection via knowledge-driven multimodal graph convolutional networks. In Proceedings of the 2020 International Conference on Multimedia Retrieval, Association for Computing Machinery, Dublin, Ireland, 8–11 June 2020; pp. 540–547. [Google Scholar]
  17. Hu, L.; Yang, T.; Zhang, L.; Zhong, W.; Tang, D.; Shi, C.; Duan, N.; Zhou, M. Compare to the knowledge: Graph neural fake news detection with external knowledge. In Proceedings of the 59th Annual Meeting of the Association for Computational Linguistics and the 11th International Joint Conference on Natural Language Processing (Volume 1: Long Papers), Online, 1–6 August 2021; pp. 754–763. [Google Scholar]
  18. Yan, R.; Yen, I.E.; Li, C.T.; Zhao, S.; Hu, X. Tackling the achilles heel of social networks: Influence propagation-based language model smoothing. In Proceedings of the 24th International Conference on World Wide Web, Florence, Italy, 18–22 May 2015; pp. 1318–1328. [Google Scholar]
  19. Shu, K.; Cui, L.; Wang, S.; Lee, D.; Liu, H. defend: Explainable fake news detection. In Proceedings of the 25th ACM SIGKDD International Conference on Knowledge Discovery & Data Mining, Association for Computing Machinery, Anchorage, AK, USA, 4–8 August 2019; pp. 395–405. [Google Scholar]
  20. Wu, L.; Rao, Y.; Jin, H.; Nazir, A.; Sun, L. Different absorption from the same sharing: Sifted multi-task learning for fake news detection. In Proceedings of the 2019 Conference on Empirical Methods in Natural Language Processing and the 9th International Joint Conference on Natural Language Processing (EMNLP-IJCNLP), Hong Kong, China, 3–7 November 2019; pp. 4644–4653. [Google Scholar]
  21. Wu, L.; Rao, Y.; Zhao, Y.; Liang, H.; Nazir, A. Dtca: Decision tree-based co-attention networks for explainable claim verification. In Proceedings of the 58th Annual Meeting of the Association for Computational Linguistics, Online, 5–10 July 2020; pp. 1024–1035. [Google Scholar]
  22. Yuan, C.; Ma, Q.; Zhou, W.; Han, J.; Hu, S. Jointly embedding the local and global relations of heterogeneous graph for rumor detection. In Proceedings of the 2019 IEEE International Conference on Data Mining (ICDM), Beijing, China, 8–11 November 2019; pp. 796–805. [Google Scholar]
  23. Bian, T.; Xiao, X.; Xu, T.; Zhao, P.; Huang, W.; Rong, Y.; Huang, J. Rumor detection on social media with bi-directional graph convolutional networks. In Proceedings of the AAAI Conference on Artificial Intelligence, New York, NY, USA, 7–12 February 2020; pp. 549–556. [Google Scholar]
  24. Lu, Y.J.; Li, C.T. Gcan: Graph-aware co-attention networks for explainable fake news detection on social media. In Proceedings of the 58th Annual Meeting of the Association for Computational Linguistics, Online, 5–10 July 2020; pp. 505–514. [Google Scholar]
  25. Song, Y.Z.; Chen, Y.S.; Chang, Y.T.; Weng, S.Y.; Shuai, H.H. Adversary-aware rumor detection. In Proceedings of the Findings of the Association for Computational Linguistics: ACL-IJCNLP, Online, 1–6 August 2021; pp. 1371–1382. [Google Scholar]
  26. Xu, S.; Liu, X.; Ma, K.; Dong, F.; Riskhan, B.; Xiang, S.; Bing, C. Rumor detection on social media using hierarchically aggregated feature via graph neural networks. Appl. Intell. 2022, 53, 3136–3149. [Google Scholar] [CrossRef] [PubMed]
  27. Huang, Z.; Lv, Z.; Han, X.; Li, B.; Lu, M.; Li, D. Social bot-aware graph neural network for early rumor detection. In Proceedings of the 29th International Conference on Computational Linguistics, Gyeongju, Republic of Korea, 12–17 October 2022; pp. 6680–6690. [Google Scholar]
  28. Guo, B.; Jiang, Z.-b.; Kumar, M. What is the internet water army? A practical feature-based detection of large-scale fake reviews. Mob. Inf. Syst. 2023, 2023, 2565020. [Google Scholar] [CrossRef]
  29. Huang, Q.; Zhou, C.; Wu, J.; Liu, L.; Wang, B. Deep spatial–temporal structure learning for rumor detection on twitter. Neural Comput. Applic 2020, 1–11. [Google Scholar] [CrossRef]
  30. Xia, R.; Xuan, K.; Yu, J. A state-independent and time-evolving network for early rumor detection in social media. In Proceedings of the 2020 conference on empirical methods in natural language processing (EMNLP), Online, 16–20 November 2020; pp. 9042–9051. [Google Scholar]
  31. Sun, M.; Zhang, X.; Zheng, J.; Ma, G. DDGCN: Dual Dynamic Graph Convolutional Networks for Rumor Detection on Social Media. In Proceedings of the AAAI Conference on Artificial Intelligence, Virtual, 22 February–1 March 2022; pp. 4611–4619. [Google Scholar]
  32. Rosnow, R.L. Inside rumor: A personal journey. Am. Psychol. 1991, 46, 484. [Google Scholar] [CrossRef]
  33. Ma, J.; Gao, W.; Mitra, P.; Kwon, S.; Jansen, B.J.; Wong, K.-F.; Cha, M. Detecting rumors from microblogs with recurrent neural networks. In Proceedings of the 25th International Joint Conference on Artificial Intelligence, New York, NY, USA 9–15 July 2016; AAAI Press: New York, NY, USA, 2016; pp. 3818–3824. [Google Scholar]
  34. Wang, Y.; Wang, L.; Yang, Y.; Lian, T. SemSeq4FD: Integrating global semantic relationship and local sequential order to enhance text representation for fake news detection. Expert Syst. Appl. 2020, 166, 0957–4174. [Google Scholar] [CrossRef] [PubMed]
  35. Zhang, X.; Cao, J.; Li, X.; Sheng, Q.; Zhong, L.; Shu, K. Mining dual emotion for fake news detection. In Proceedings of the Web Conference 2021, Association for Computing Machinery, Ljubljana, Slovenia, 19–23 April 2021; pp. 3465–3476. [Google Scholar]
  36. Luvembe, A.M.; Li, W.; Li, S.; Liu, F.; Xu, G. Dual emotion based fake news detection: A deep attention-weight update approach. Inf. Process. Manag. 2023, 60, 103354. [Google Scholar] [CrossRef]
  37. Shi, B.; Weninger, T. Discriminative predicate path mining for fact checking in knowledge graphs. Know.-Based Syst. 2016, 104, 123–133. [Google Scholar] [CrossRef]
  38. Ciampaglia, G.L.; Shiralkar, P.; Rocha, L.M.; Bollen, J.; Menczer, F.; Flammini, A. Computational fact checking from knowledge networks. PLoS ONE 2015, 10, e0128193. [Google Scholar]
  39. Chen, T.; Li, X.; Yin, H.; Zhang, J. Call attention to rumors: Deep attention based recurrent neural networks for early rumor detection. In Proceedings of the Paciffc-Asia Conference on Knowledge Discovery and Data Mining, Melbourne, VIC, Australia, 3–6 June 2018; pp. 40–52. [Google Scholar]
  40. Shan, Y. How credible are online product reviews? The effects of self-generated and system-generated cues on source credibility evaluation. Comput. Hum. Behav. 2016, 55, 633–641. [Google Scholar] [CrossRef]
  41. Sidorov, G.; Gelbukh, A.; Gómez-Adorno, H.; Pinto, D. Soft similarity and soft cosine measure: Similarity of features in vector space model. Comput. Sist. 2014, 18, 491–504. [Google Scholar] [CrossRef]
  42. Langville, A.N.; Meyer, C.D. Google’s PageRank and Beyond: The Science of Search Engine Rankings; Princeton University Press: Princeton, NJ, USA, 2006. [Google Scholar]
  43. Graves, A.; Fernández, S.; Schmidhuber, J. Bidirectional LSTM Networks for Improved Phoneme Classification and Recognition. In Proceedings of the International Conference on Artificial Neural Networks, Warsaw, Poland, 11–15 September 2005. [Google Scholar]
  44. Veličković, P.; Cucurull, G.; Casanova, A.; Romero, A.; Lio, P.; Bengio, Y. Graph attention networks. In Proceedings of the 6th International Conference on Learning Representations, Vancouver, BC, Canada, 30 April–3 May 2018. [Google Scholar]
  45. Sabour, S.; Frosst, N.; Hinton, G.E. Dynamic routing between capsules. In Proceedings of the 31st International Conference on Neural Information Processing Systems, Long Beach, CA, USA, 4–9 December 2017; pp. 3859–3869. [Google Scholar]
  46. Vaswani, A.; Shazeer, N.; Parmar, N.; Uszkoreit, J.; Jones, L.; Gomez, A.N.; Kaiser, Ł.; Polosukhin, I. Attention is all you need. In Proceedings of the 31st International Conference on Neural Information Processing Systems, Curran Associates Inc., Long Beach, CA, USA, 4–9 December 2017; pp. 6000–6010. [Google Scholar]
  47. Zubiaga, A.; Liakata, M.; Procter, R.; Wong Sak Hoi, G.; Tolmie, P. Analysing how people orient to and spread rumours in social media by looking at conversational threads. PLoS ONE 2016, 11, e0150989. [Google Scholar] [CrossRef] [PubMed]
  48. Song, C.; Yang, C.; Chen, H.; Tu, C.; Liu, Z.; Sun, M. Ced: Credible early detection of social media rumors. IEEE Trans. Knowl. Data Eng. 2021, 33, 3035–3047. [Google Scholar] [CrossRef]
  49. Ma, J.; Gao, W.; Wei, Z.; Lu, Y.; Wong, K.-F. Detect rumors using time series of social context information on microblogging websites. In Proceedings of the 24th ACM International on Conference on Information and Knowledge Management, Association for Computing Machinery, Melbourne, Australia, 19–23 October 2015; pp. 1751–1754. [Google Scholar]
  50. Guo, H.; Cao, J.; Zhang, Y.; Guo, J.; Li, J. Rumor detection with hierarchical social attention network. In Proceedings of the 27th ACM International Conference on Information and Knowledge Management, Association for Computing Machinery, Torino, Italy, 22–26 October 2018; pp. 943–951. [Google Scholar]
Figure 1. Schematic diagram of the spatiotemporal structure of information dissemination.
Applsci 13 05703 g001
Figure 2. A piece of news on PHEME, and the meta-data of users participating in the discussion, the relevant comments or forwarded message on social media over time. The unit of time axis is minutes. “V” represents whether the account is verified or not, and “FL”, “FR” and “F” represent the numbers of followers, friends and favorites, respectively. The bold words are the false portions of source information, and some explainable comments can directly confirm the falsehood of these words in the news.
Applsci 13 05703 g002
Figure 3. Framework of the proposed TRSA model.
Applsci 13 05703 g003
Figure 4. Information dispersion network (node color represents node credibility and edge color represents the degree of recognition of content between nodes).
Applsci 13 05703 g004
Figure 5. Results contrasted among ablation variations on the PHEME and CED datasets. (a) Accuracy contrast among ablation variations on the PHEME and CED datasets. (b) F1 score contrast among ablation variations on the PHEME and CED datasets.
Applsci 13 05703 g005aApplsci 13 05703 g005b
Figure 6. A case study on the explainability of TRSA through visualizing the detection process of one example (labeled fake).
Applsci 13 05703 g006
Figure 7. Visualization of word-level attention weights in propagations of three fake (0–2) and three true (3–5) source tweets.
Applsci 13 05703 g007
Figure 8. Fake news early detection performance contrast between different models. (a) PHEME Dataset. (b) CED Dataset.
Applsci 13 05703 g008
Table 1. Statistics of datasets.
Statistical IndicatorsPHEMECED
Source Tweets24023387
Comments/rep30,7231,275,179
Users20,5381,064,970
Fake6381538
True10671849
Uncertain697-
Table 2. Results contrasted between different methods.
MethodsPHEMECED
APRFAPRF1
DTC0.6690.6780.6780.6670.7310.7310.7190.725
SVM-TS0.7220.7880.7580.7210.8570.8590.8580.859
HSA_BLSTM0.7570.7720.7310.7450.8780.8770.8760.876
DTCA0.8230.8610.7910.8250.9010.9210.8910.902
BERT-Emo0.8000.7950.7950.7930.9050.9160.9130.914
GLAN0.8280.8240.8220.8230.9180.9170.9140.915
BiGCN0.8470.8400.8340.8350.9190.9180.9160.917
DDGCN0.8550.8460.8410.8440.9220.9200.9310.925
TRSA0.8850.8960.8710.8810.9530.9500.9540.952
Table 3. Performance analysis of TRSA on test sets with different numbers of posts.
News A 1 on PEHEMA on CED
News with posts ∈ [0, 3]0.8260.879
News with posts ∈ [3, 10]0.8450.898
News with posts ∈ [10, ∞]0.8850.959
1 A is the abbreviation for accuracy indicator.
Disclaimer/Publisher’s Note: The statements, opinions and data contained in all publications are solely those of the individual author(s) and contributor(s) and not of MDPI and/or the editor(s). MDPI and/or the editor(s) disclaim responsibility for any injury to people or property resulting from any ideas, methods, instructions or products referred to in the content.

