Article

Comparison of Ultra-Sonication and Microwave Extraction Followed by Filtration or Filtration and Solid-Phase Extraction Clean-Up for PAH Determination from Sediment and Sludge: Human Health and Ecological Risk Assessment

by
Sinayo Ndwabu
1,
Mncedisi Malungana
1 and
Precious Mahlambi
2,*
1
Department of Scientific Services, Laboratory Services, Umgeni Water, 310 Burger Street, P.O. Box 9, Pietermaritzburg 3201, South Africa
2
Department of Chemistry, University of Kwa-Zulu Natal, PBag X01, Scottsville, Pietermaritzburg 3209, South Africa
*
Author to whom correspondence should be addressed.
Appl. Sci. 2023, 13(9), 5619; https://doi.org/10.3390/app13095619
Submission received: 20 December 2022 / Revised: 8 April 2023 / Accepted: 28 April 2023 / Published: 2 May 2023

Abstract

:
Polycyclic aromatic hydrocarbons (PAHs) are compounds originating from pyrogenic and petrogenic sources, which increases their potential introduction into the environment and possible exposure to humans. PAHs have been identified as compounds of concern due to their environmental persistence and toxicity to living organisms, leading to harmful health effects. As a consequence, the South African government (The Department of Water and Sanitation) has set national norms and standards for the assessment of waste for landfill disposal through the National Environmental Management: Waste Act, 2008 (NEMWA) license (Act No. 59 of 2008). This study therefore evaluated the concentrations, origin sources, human health and ecological risk of PAHs in sediment and sludge samples, which is a requirement by the South African government. The PAHs were determined using ultrasonic extraction (UE) and microwave-assisted extraction (MAE), followed by filtration, or filtration and clean-up with solid-phase extraction (SPE). The results obtained indicated that both methods can be used for the extraction of PAHs with relative accuracy and sensitivity. However, higher concentrations were obtained with F + SPE-cleaned samples (95.96–926.0 µg/kg) compared to filtered samples (21.61–380.6 µg/kg), with pyrene showing dominance over all other PAHs. The detected concentrations indicated that the PAHs were of petrogenic origin. These concentrations are currently within the total acceptable concentration levels of 5.0 × 10⁴ µg/kg as prescribed by the NEMWA standards for sludge and sediments. However, the concentration above the effective medium range in river sediments revealed potential toxic effects to aquatic organisms. The ILCRderm values suggested a very high potential risk of cancer through dermal exposure to the inhabitants of the area. These findings indicate that continuous monitoring of these compounds is of paramount importance as the study area is not entirely safe for use even for recreational purposes.

1. Introduction

Polycyclic aromatic hydrocarbons (PAHs) are organic contaminants that are derived from both domestic and industrial sources as a consequence of incomplete combustion. These can include incomplete burning from food processing, materials during forest fires, volcanic eruptions, automobile exhaust, industrial emission and other anthropogenic activities. The low-molecular-weight PAHs (two or three fused aromatic rings) are emitted from petrogenic and pyrogenic sources, while high-molecular-weight PAHs (four or more fused aromatic rings) are a result of pyrolytic sources [1]. PAHs can potentially lead to health issues as they are teratogenic, mutagenic and carcinogenic. In birds and aquatic life, they possess moderate-to-severe toxicity, while in soil, they may lead to reproductive and developmental effects and tumours on terrestrial invertebrates [1,2]. It is thus endorsed by the National Environmental Management: Waste Act of 2008 (NEMWA) that contaminants, including PAHs, are monitored in all aspects of the environment, including water treatment plants [3]. The NEMWA of 2008 ensures the protection of human health and the environment through regulating waste management by providing reasonable measures for the prevention of pollution and ecological degradation in order to secure ecological sustainable development. This Act stipulates the set national norms and standards for the assessment of waste management for landfill disposal in all spheres of government in order to ensure compliance [4].
As PAHs are persistent organic pollutants which do not degrade quickly in the environment, they can be transported and distributed throughout the environment by rain and wind [5]. PAHs have been classified as priority pollutants by the World Health Organisation (WHO) and their presence in the environment and exposure to humans and other living organisms is therefore of great concern [6]. On the one hand, the introduction of PAHs into the environment has increased with the increase in demand for petroleum products, which is one of the original sources of PAHs, amongst others, such as wastewater treatment plants, industrial discharge, etc. Water boards aim to ensure the control of pollution, as the treatment process employed at waterworks produces sludge which, after the dewatering process, is often disposed of in landfills. It is therefore of great importance that the extent of pollution in the landfills and the surrounding areas be assessed. This is per directive given by the South African government through the NEMWA license, which states that all water boards and municipalities need to analyse organics and other pollutants in sludge to ensure compliance. Even though significant research on PAHs and other organic contaminants has been undertaken in developed countries, this still remains a gap in the developing countries, such as South Africa, where limited data (sources and concentration levels) are still a hindrance for policy making [7].
Techniques for the extraction and concentration of PAHs from environmental solid samples, such as soxhlet extraction (SE), microwave-assisted extraction (MAE), ultra-sonication extraction (UE), linear shaker (LS) and QuEChERS methodology, are often used for the extraction of organics from solid samples. Soxhlet has been largely used as the benchmark of extraction of PAHs in solid samples as it is a well-studied method. In SE, extraction is achieved via a reflux cycle with the use of an appropriate solvent. Although SE has been used successfully, it has its disadvantages, including the use of large volumes of solvents (~300 mL) and being time-consuming (~24 h) and labour-intensive [8]. Extraction with linear shaker can be used in order to reduce the amount of solvent required (~20 mL) for PAHs in solid samples. However, like SE, extraction with the use of a linear shaker is time-consuming, and its sensitivity is only attainable when long shaking times (~20 h) are applied in order to extend the contact time with the solvent. Techniques such as MAE and UE have been used in order to reduce extraction times and promote ease of sample preparation. Silalahi et al. compared the efficiencies of Soxhlet, ultra-sonication and mechanical shaking for the extraction of PAHs in soil and found that the ultra-sonication method had the highest extraction efficiency compared to Soxhlet and shaking [9].
QuEChERS, an acronym for Quick, Easy, Cheap, Effective, Rugged and Safe, is a dispersive and fairly new solid-phase extraction (SPE) technique. The technique’s advantages are speed, ease of execution, minimal solvent requirement and cost [10]. This technique was initially developed for extracting multi-residue pesticides from fruits and vegetables. However, it has now been extended to other sample matrices, including soil and other compounds such as PAHs [11,12,13]. In QuEChERS, the sample preparation is performed in two steps: analyte extraction followed by dispersive SPE (extract clean-up). The sample is first ground and then sieved to give a uniform surface area. The sample must be at least 80% hydrated in order to maximise extraction. Therefore, water is usually added before adding a solvent and salt to the sample; the salt aids in the separation of water and the organic phase where the extractants are contained [14]. A portion of the organic phase is then transferred to a clean-up tube containing a combination of sorbents for the removal of possible interferences in the sample. Although the use of this technique reduces solvent consumption and extraction times, it also has its limitations. This is noticeable where samples have high fat content and low water content, as the effect of purification becomes non-ideal, with large losses of analytes, and thus the efficiency of extraction can be low [15]. Oduntan et al. compared the extraction of PAHs using QuEChERS and Soxhlet techniques in fish from two different dams in South Africa. The study found that the concentrations of PAHs obtained with the use of the QuEChERS method were comparable to Soxhlet extraction, though for some PAHs, the QuEChERS gave slightly higher results [10].
In MAE, microwave energy is applied to heat solvents in contact with samples, achieving the partition of the target compounds of interest from the sample into the solvent [16]. The MAE technique is vastly used because it complies with the minimum criteria required for modern sample preparation techniques, and provides a very attractive alternative to conventional approaches for the extraction of organic compounds from a wide variety of matrices [17]. MAE also provides the possibility of simultaneously extracting multiple samples, drastically improving sample output. Ultrasonication extraction mainly involves the use of high-power ultrasound to accelerate solvent penetration into solid materials and it is a good alternative to linear shaker extraction. The ultrasonic uses mechanical vibration as the linear shaker extraction, but with a shorter timer. Once the PAHs have been extracted from the sample matrix, they may be determined satisfactorily using high-performance liquid chromatography (HPLC) and gas chromatography (GC) with various detection techniques. However, GC coupled with a mass spectrometer is preferred as it offers robust identification of the analyte compounds both by retention time and mass spectrum, with additional structural information [18].
Therefore, the aim of this work was to develop and compare the efficiency of the UE and MAE, followed by either filtration, or filtration with SPE cleaning of samples, for determining concentrations. This was followed by evaluating the source of origin and assessing the human health and ecological risks of PAHs. The filtration and cleaning with SPE was performed so as to ensure that impurities were sufficiently removed, as they tend to camouflage the analyte of interest, leading to underestimation of concentrations. To the best of the authors’ knowledge, this is the first time an analysis of PAHs from the studied sludge landfill has been conducted. Thus, the potential human health effect which could result from the presence of PAHs in the study area was revealed for the first time. Furthermore, the comparison of filtration alone and filtration followed by solid phase as the clean-up methods after microwave and ultrasonic extraction were explored for the first time in this work.

2. Experimental Section

2.1. Chemicals and Reagents

Acetonitrile (99.9%), acetone (99.8%), ethyl acetate (99.9%) and n-hexane were purchased from Merck (Johannesburg, South Africa), while the PAHs mixture (100% purity) containing naphthalene, acenaphylene, acenaphthene, fluorene, Phenanthrene, anthracene, fluoranthene, pyrene, benz(a)anthracene, benzo(k)fluoranthene, benzo(a)Pyrene, benzo(ghi)perylene and dibenz(a,h)anthracene was purchased from Sigma-Aldrich (Johannesburg, South Africa).

2.2. Instrumentation

A Multiwave 5000 microwave was purchased from Anton Paar (Johannesburg, South Africa) and an Eumaxultrasonic cleaner bath was purchased from LABOTEC (Singen, Germany). A Supelco SPE Vac-Elut unit, purchased from Sigma Aldrich (Darmstadt, Germany), was used to extract PAHs in solid samples. Oasis hydrophilic–lipophilic balance (HLB) cartridge (60 mg, 3 mL) used for the extraction of PAHs was purchased from Waters (Dublin, Ireland). A vacuum pump from Edward 8 and Holdoph-Basis Hei-VAP Value rotor evaporator purchased from Holdoph (Berlin, Germany). PAHs were quantitatively analysed with the use of Gas Chromatography (GC), Mass Spectrometry (MS) combination (QP-2010 series (Kyoto, Japan). Separation of PAHs was successfully carried out using the capillary column InertCap 5MS/Sil 30 m (I.D. = 0.25 mm, film thickness = 0.25 µm, Japan). Helium at a flow rate of 1.32 mL/min and an injection temperature of 260 °C was used as a carrier gas. In total, 3 µL was the injection volume performed in a splitless mode. The temperature of an oven was held at 40 °C for 1 min, then increased to 100 °C at a rate of 15 °C/min, and the 2nd ramp was 10 °C/min to 210 °C, then held for 2 min. The final ramp was programmed at a rate of 5 °C/min to 310 °C, held for 8 min. To identify the analytes, the MS selected ion monitoring (SIM) mode was used. Due to some target ions having the same mass ions (m/z), boiling points were also used for quantification, which were 128 g/mol (naphthalene), 152 m/z (acenaphthylene), 154 m/z (acenaphthene), 166 g/mol (fluorene), 178 g/mol, 336 °C (phenanthrene), 178 m/z, 340 °C (anthracene), 202 m/z, 375 °C (fluoranthene), 202 m/z, 404 °C (pyrene), 228 m/z (benz(a)anthracene), 252 m/z, (benzo(k)fluoranthene), 252 m/z, 495 °C (benzo(a)pyrene), 278 m/z, 524 °C (dibenz(a,h)anthracene) and Benzo(g,h,i)perylene at 278 m/z, 550 °C [7].

2.3. Preparation of Calibration Standards

The mixture of thirteen PAHs at 2000 µg/L (naphthalene, acenaphylene, acenaphthene, fluorene, phenanthrene, anthracene, fluoranthene, pyrene, benz(a)anthracene, benzo(k)fluoranthene, benzo(a)pyrene, benzo(ghi)perylene and dibenz(a,h)anthracene) was used for the calibration of the instrument. This mixture was diluted in acetonitrile to give a stock solution of 10 mg/L. The stock solution was then further diluted in a 100 mL volumetric flask to give 0.01 mg/L–0.8 mg/L calibration standards.

2.4. Sampling of Sediments and Sludge Samples

The solid samples were collected from along uMsunduzi river (Figure 1a) and Darvill wastewater works (WWW) sludge landfill (Figure 1b) at Umgeni Water in Willowtown, Pietermaritzburg, Kwa-Zulu Natal. These samples were collected from four different sampling points, namely: Camps Drift (CD), College Road (CR), Woodhouse (WH) and Bishopstowe (BS) at uMsunduzi river, which were chosen as a result of being high contamination points. Darvill WWW samples were collected from two different points (7A and 14A) of the Darvill landfill for the disposal of treated sludge. The sludge samples were collected near the surface using a spade and stored in 1000 mL honey jars on the 30 August 2021 at Darvill WWW while the sediment samples were collected on the basin of the river on the 28 April 2021 in uMsunduzi river. The samples were then air-dried in a fume hood for 14 days before grinding using a soil grinder and sieving through a 125 µm sieve to fine soil particles of less than 0.125 µm. These samples were then stored at room temperature until further analyses were performed.

2.5. Optimization of UE

The UE method of Oluseyi et al. [19] was optimized prior to application to real samples in order to increase recoveries for PAHs. The UE parameters that were investigated included the extraction solvents (n-hexane:acetone, n-hexane:water, n-hexane:ethyl acetate and n-hexane) and extraction solvent volumes (10 mL, 25 mL and 50 mL) at 30 min, 60 min and 90 min extraction times. A statistical evaluation was also carried out in order to determine the probability of significant difference between the parameter’s recoveries. This optimisation was imperative to determine the optimum extraction solvent and the volume needed to maximise the penetration of the solvent into the solids in order to sufficiently break their surfaces, thus allowing efficient extraction of the targeted determinants.
Under optimum conditions, 0.5 g of the soil/sludge sample was dissolved with 50 mL of 1:1 ratio of acetone:nhexane. The sample was then ultra-sonicated in the sonication bath for 60 min with occasional swirling to prevent sticking on the bottom of the flask and then rested for 5 min. The extraction solution was filtered into a beaker using filter paper. Next, 1 mL of the filtrate was collected while the rest was cleaned using SPE, and then the eluate was reduced with nitrogen gas to give a final volume of 1 mL.

2.6. Optimization of MAE

Extraction of PAHs by the use of a microwave was achieved through the use of the EPA 3546 method [20]. The parameter that was investigated on the MWE was the extraction solvents, and the solvent mixture used was based on the fact that at least one component was able to absorb microwave energy. The extraction solvent mixture chosen gave optimum, reproducible recovery of the analytes of interest from the solid samples. The extraction solvent mixtures that were chosen were (i) nhexane:acetone, (ii) nhexane:acetonitrile and (iii) nhexane:ethyl acetate.
Under optimum conditions, 2 g of the soil/sludge sample was diluted in 50 mL of equal parts (1:1) of nhexane:acetone in an extraction vessel. The extraction vessel containing the sample and solvent mixture was heated to 110 °C for 5 min and then extracted for 15 min; the mixture was then allowed to cool down. The vessel was then opened and the contents filtered; 1 mL was collected for analysis while the rest of the filtrate was cleaned using SPE and the eluate reduced with nitrogen gas to 1 mL.

2.7. Methods Validation (Quality Assurance)

To ensure the validity of the method and quality of the results, a variety of parameters, such as linearity, accuracy, recoveries, limit of detection (LOD), limit of quantification (LOQ), sensitivity and selectivity/specificity were accounted for. Linearity was determined by analysing calibration standards and obtaining the correlation coefficient (r2) value of ≥0.995. Accuracy was determined using the recovery test through spiking the sample with the standard of interest with a known concentration of 10 µg/kg, and the analysis was carried out in five replicates. Sensitivity is the capability of the method to discriminate between small differences of concentration of analytes [21]. The LOD is the smallest concentration of an analyte in the test sample that can be reliably distinguished from zero concentration, and it is calculated at concentrations given by 3 times the standard deviation of signal-to-noise ratio. LOQ is defined as the lowest concentration of an analyte that can be determined with acceptable precision and accuracy, and it is given by concentrations 10 times the standard deviation of signal-to-noise ratio. Specificity/selectivity is the ability of a method to respond to a particular analyte of interest in the presence of possible interferences, such as impurities, degradants and matrix effects. This was ensured by using the mass spectrometer as a detector where the detector was set to selectively detect only ions of the targeted PAHs [22]. Specificity of the method was ensured by comparing spiked and non-spiked samples under SIM mode to ensure that the electron ionization detector source on the GC-MS instrument was set to target and identify only the PAHs of interest by using specific m/z values.

3. Results and Discussion

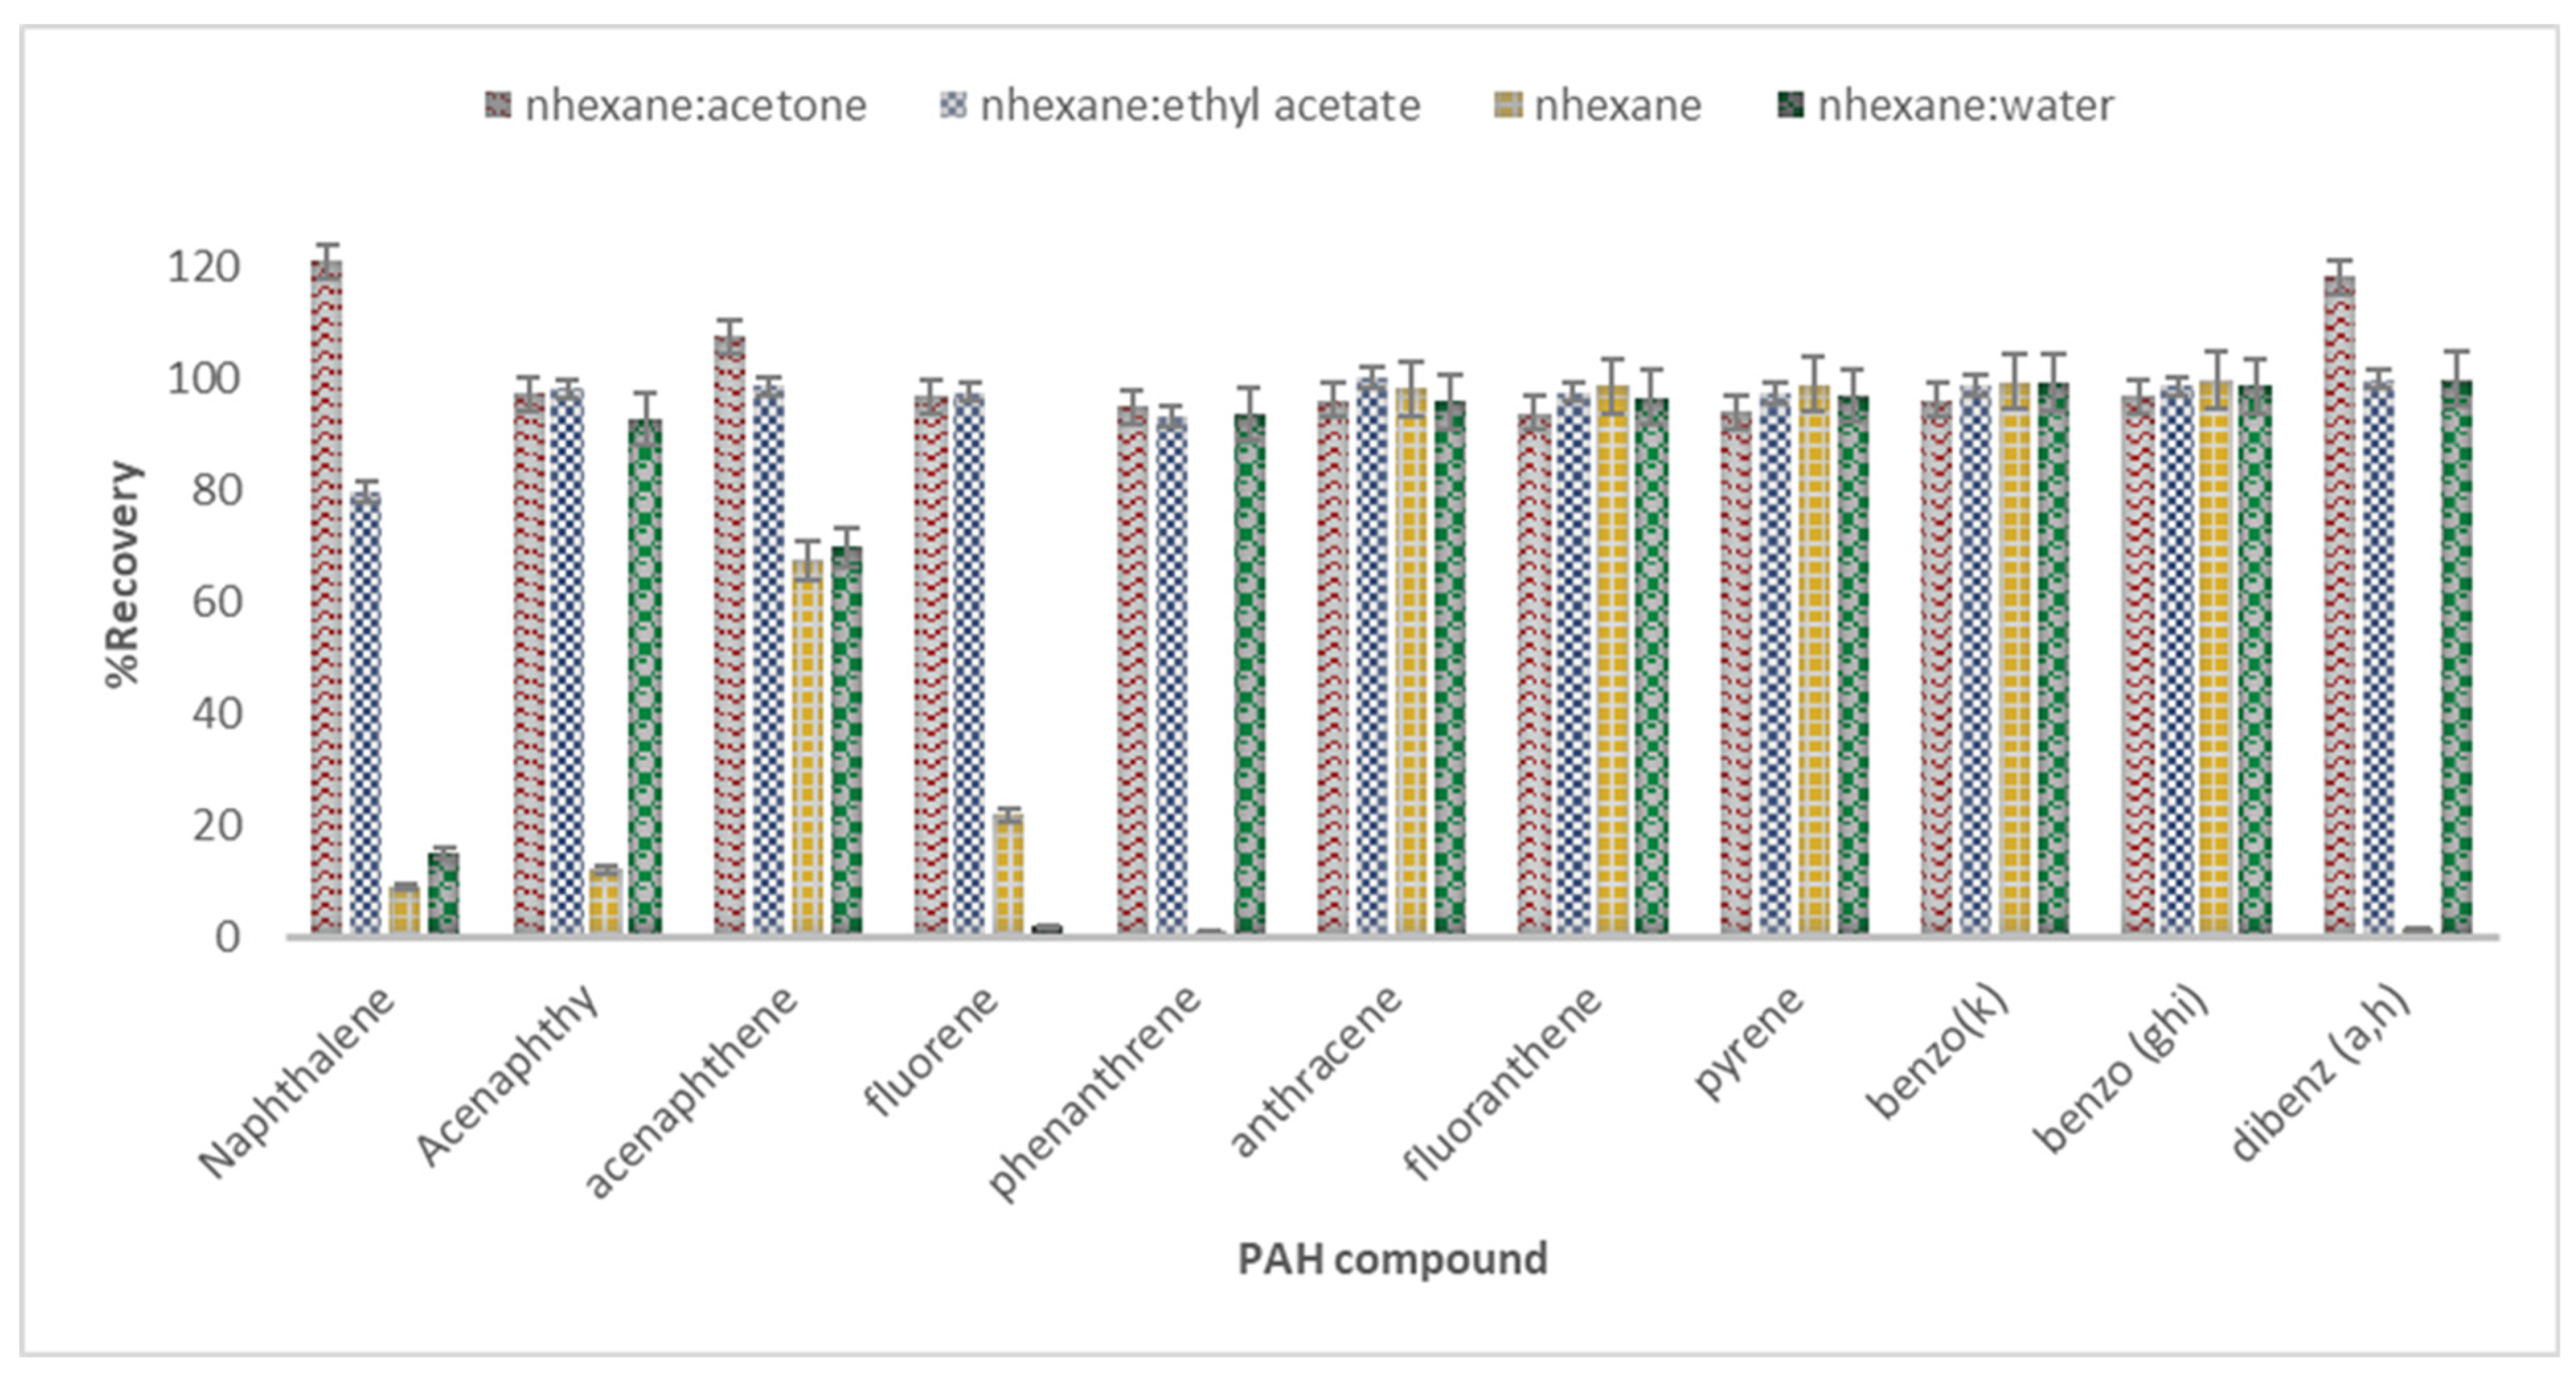
3.1. Optimization of UE

3.1.1. Effect of the Extraction Solvent

Effective extraction of the determinants depended on the efficiency of the solvent ability to penetrate the solids in order to sufficiently break down and obtain enough surface area to extract from. In order to sufficiently extract the target analyte, extraction time needed to be controlled so as to prevent excessive exposure to irradiation, which may degrade the contaminants in the sample and reduce the extraction amount to be recovered. Therefore, when choosing the correct extraction solvent, extraction time was of high importance and the effect of the extraction solvent was investigated using different solvent mixtures with a 1:1 ratio: (i) nhexane (nH) + acetone (ACT), (ii) nhexane + water (H2O), (iii) nhexane + ethyl acetate (EA) and (iv) n-hexane. The n-hexane + acetone mixture gave the highest recoveries, with percentages between 93.7–121%, while nhexane + ethyl acetate gave low recoveries ranging between 69.8–99.8% (Figure 2). This could be attributed to the small dielectric constant compared to acetone and ethyl acetate, thus leading to their inadequacy in extracting the target analyte. The recoveries in Table S1 were not significantly different for nH + ACT to nH + EA (p = 0.18) and nH + H2O (p = 0.06), while a significant difference was observed for nH (p = 0.007). Additionally, no significant difference in recoveries was observed for nH + EA to nH + H2O (p = 0.12) and nH to nH + H2O (p = 0.20), while the opposite is true for nH + EA to nH with a p value of 0.01. These results were obtained when the extraction time was at 60 min. The high recoveries obtained from the use of the nhexane + acetone showed that it is an effective extraction solvent, and the order of the extraction efficiencies for most of the PAHs was as follows: nhexane + acetone > nhexane + H2O > nhexane + ethyl acetate > nhexane. Its efficiency could be attributed to the high polarity of acetone in comparison to water and ethyl acetate, which led to a high penetration power of the solvent, thus breaking down the solid samples, increasing their surface area [7]. In turn, this aided hexane (non-polar) to sufficiently dissolve the analyte through contact, which ultimately led to a successful extraction [23,24]. The n-hexane–acetone solvent mixture has been used in other studies to extract quantitative amounts of PAHs in matrices such as soil, sediment and plant material [25].

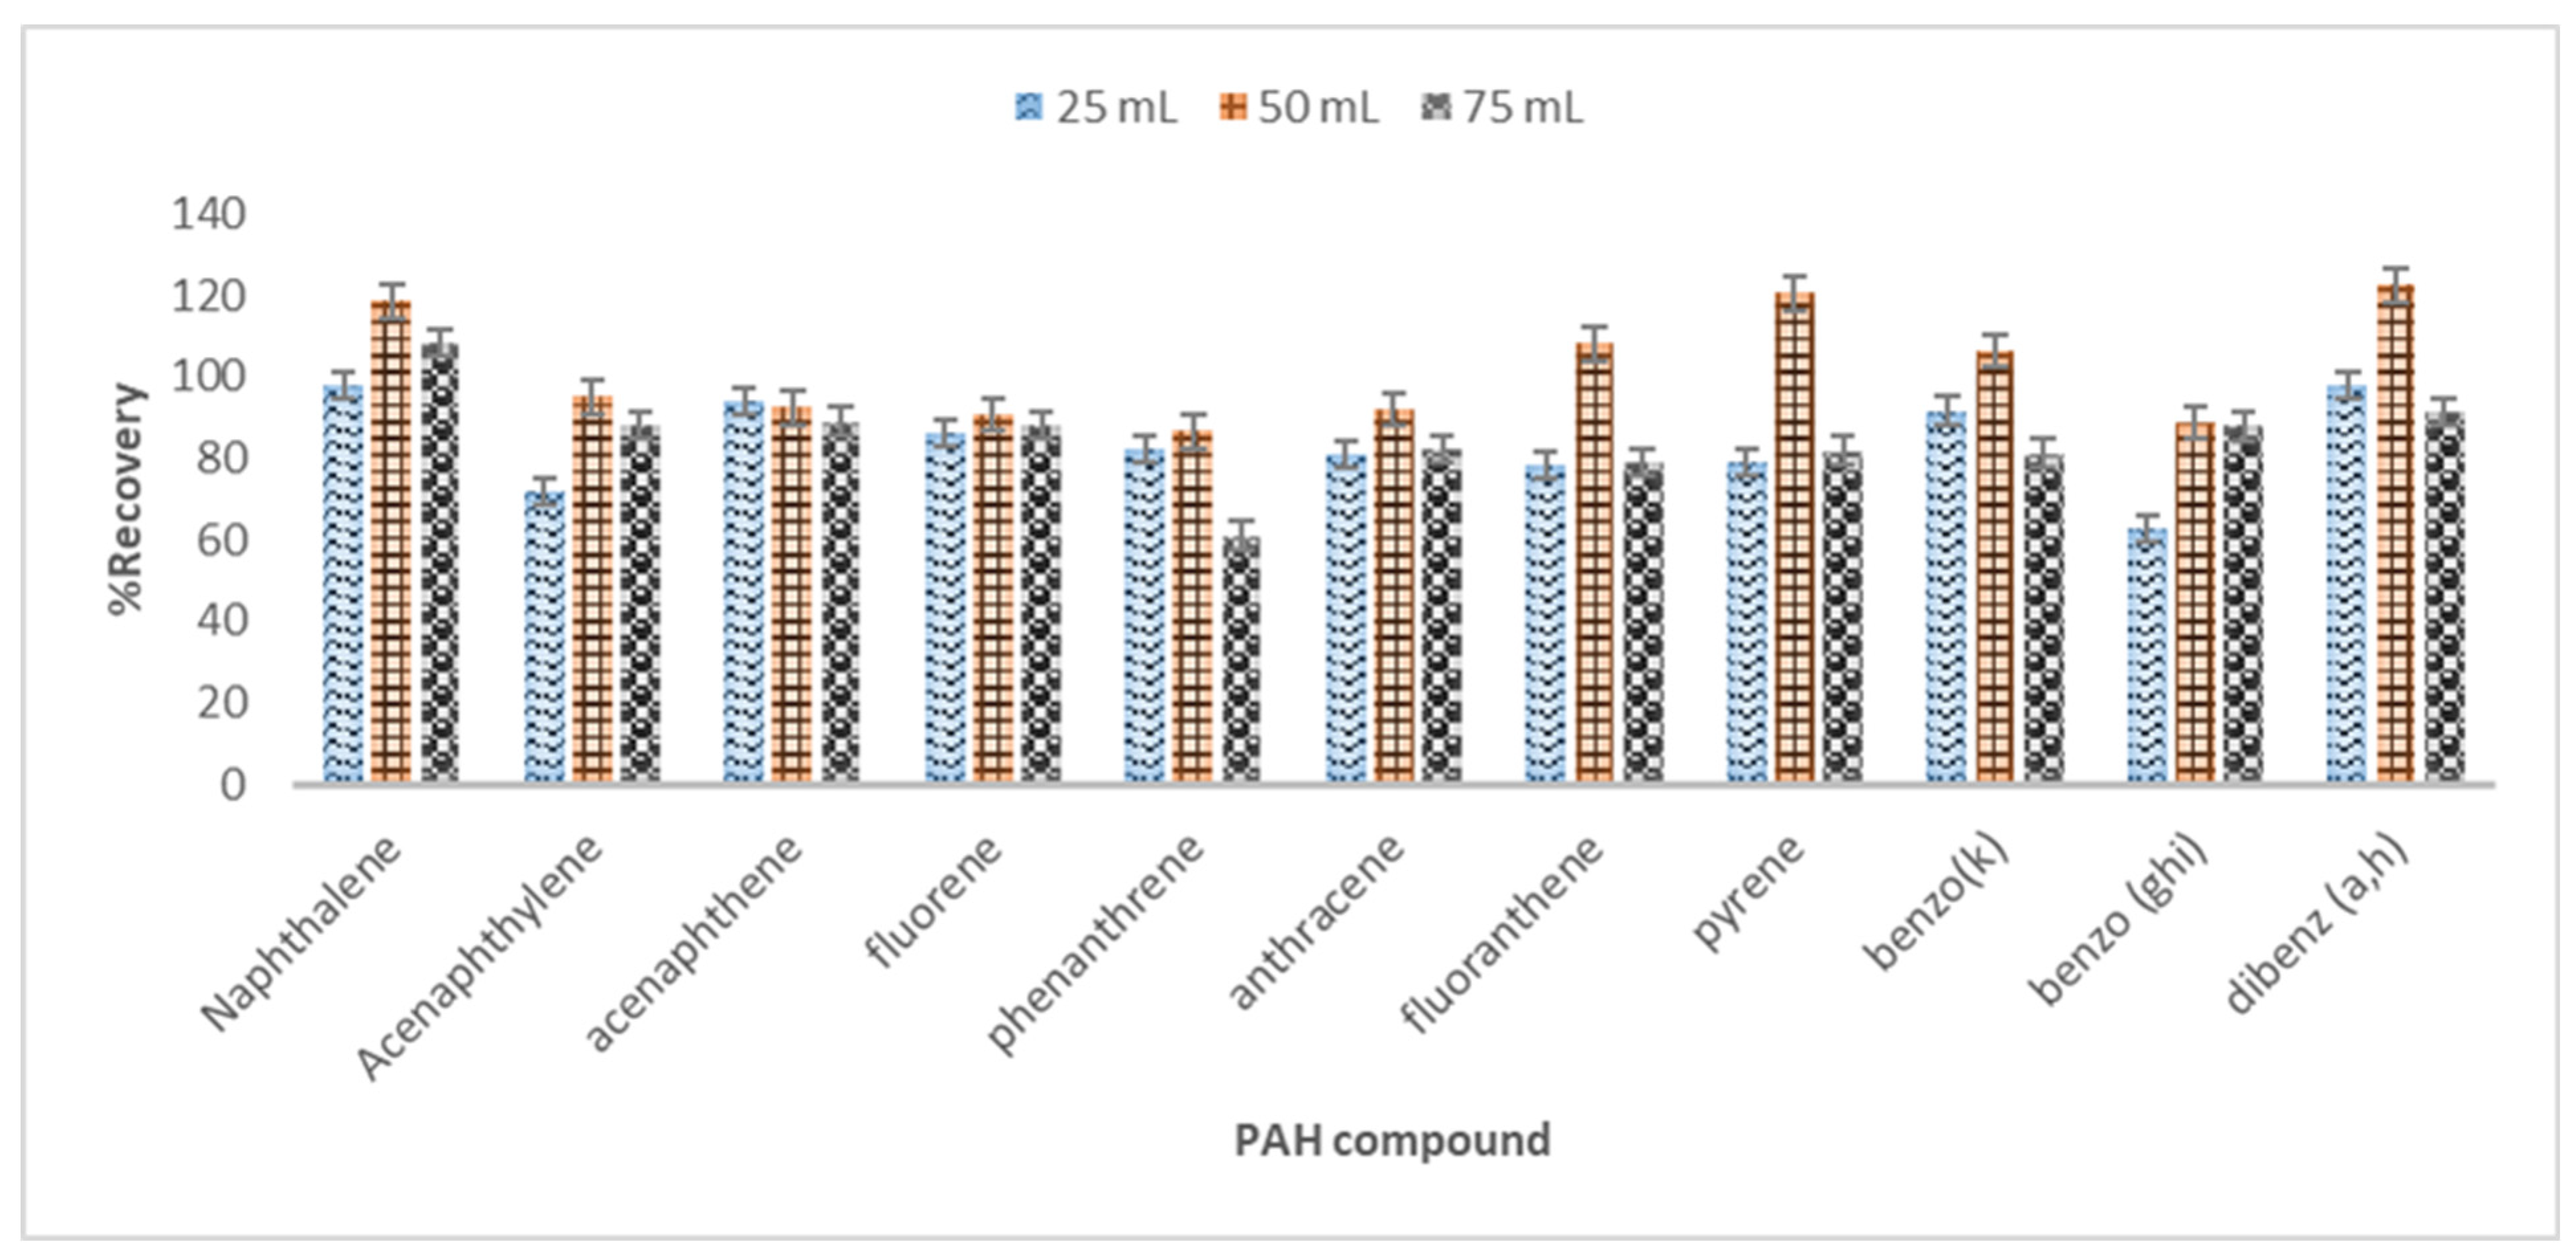
3.1.2. Effect of the Extraction Solvent Volume

The extraction solvent volumes of 25 mL, 50 mL and 75 mL were used in the investigation of their efficiency. The percentage recovery increased with an increase in solvent volume from 25 mL to 50 mL for most of the PAHs, which can be attributed to the fact that more solids were dissolved in a larger amount of the solvent. The statistical evaluation (Student’s t-test) in Table S2 showed that there was a significant difference between the recoveries of these volumes with a p value of 0.02. When the solvent volume was increased from 50 mL to 75 mL, the recoveries obtained showed a slight decrease with a significant difference (p = 0.005) in recoveries. This could mean that the solution was saturated; a point of equilibrium where no more solute could dissolve in the solvent. Therefore, 50 mL was chosen as the extraction solvent volume as it gave the highest recoveries (86.7–123%), (Figure 3). The recoveries obtained in this study were comparable to the recoveries obtained by Aydin et al. (2007) of 48–100% with 25 mL, 67–100% (50 mL), 70–112% (75 mL) and 76–114% (100 mL) [26].

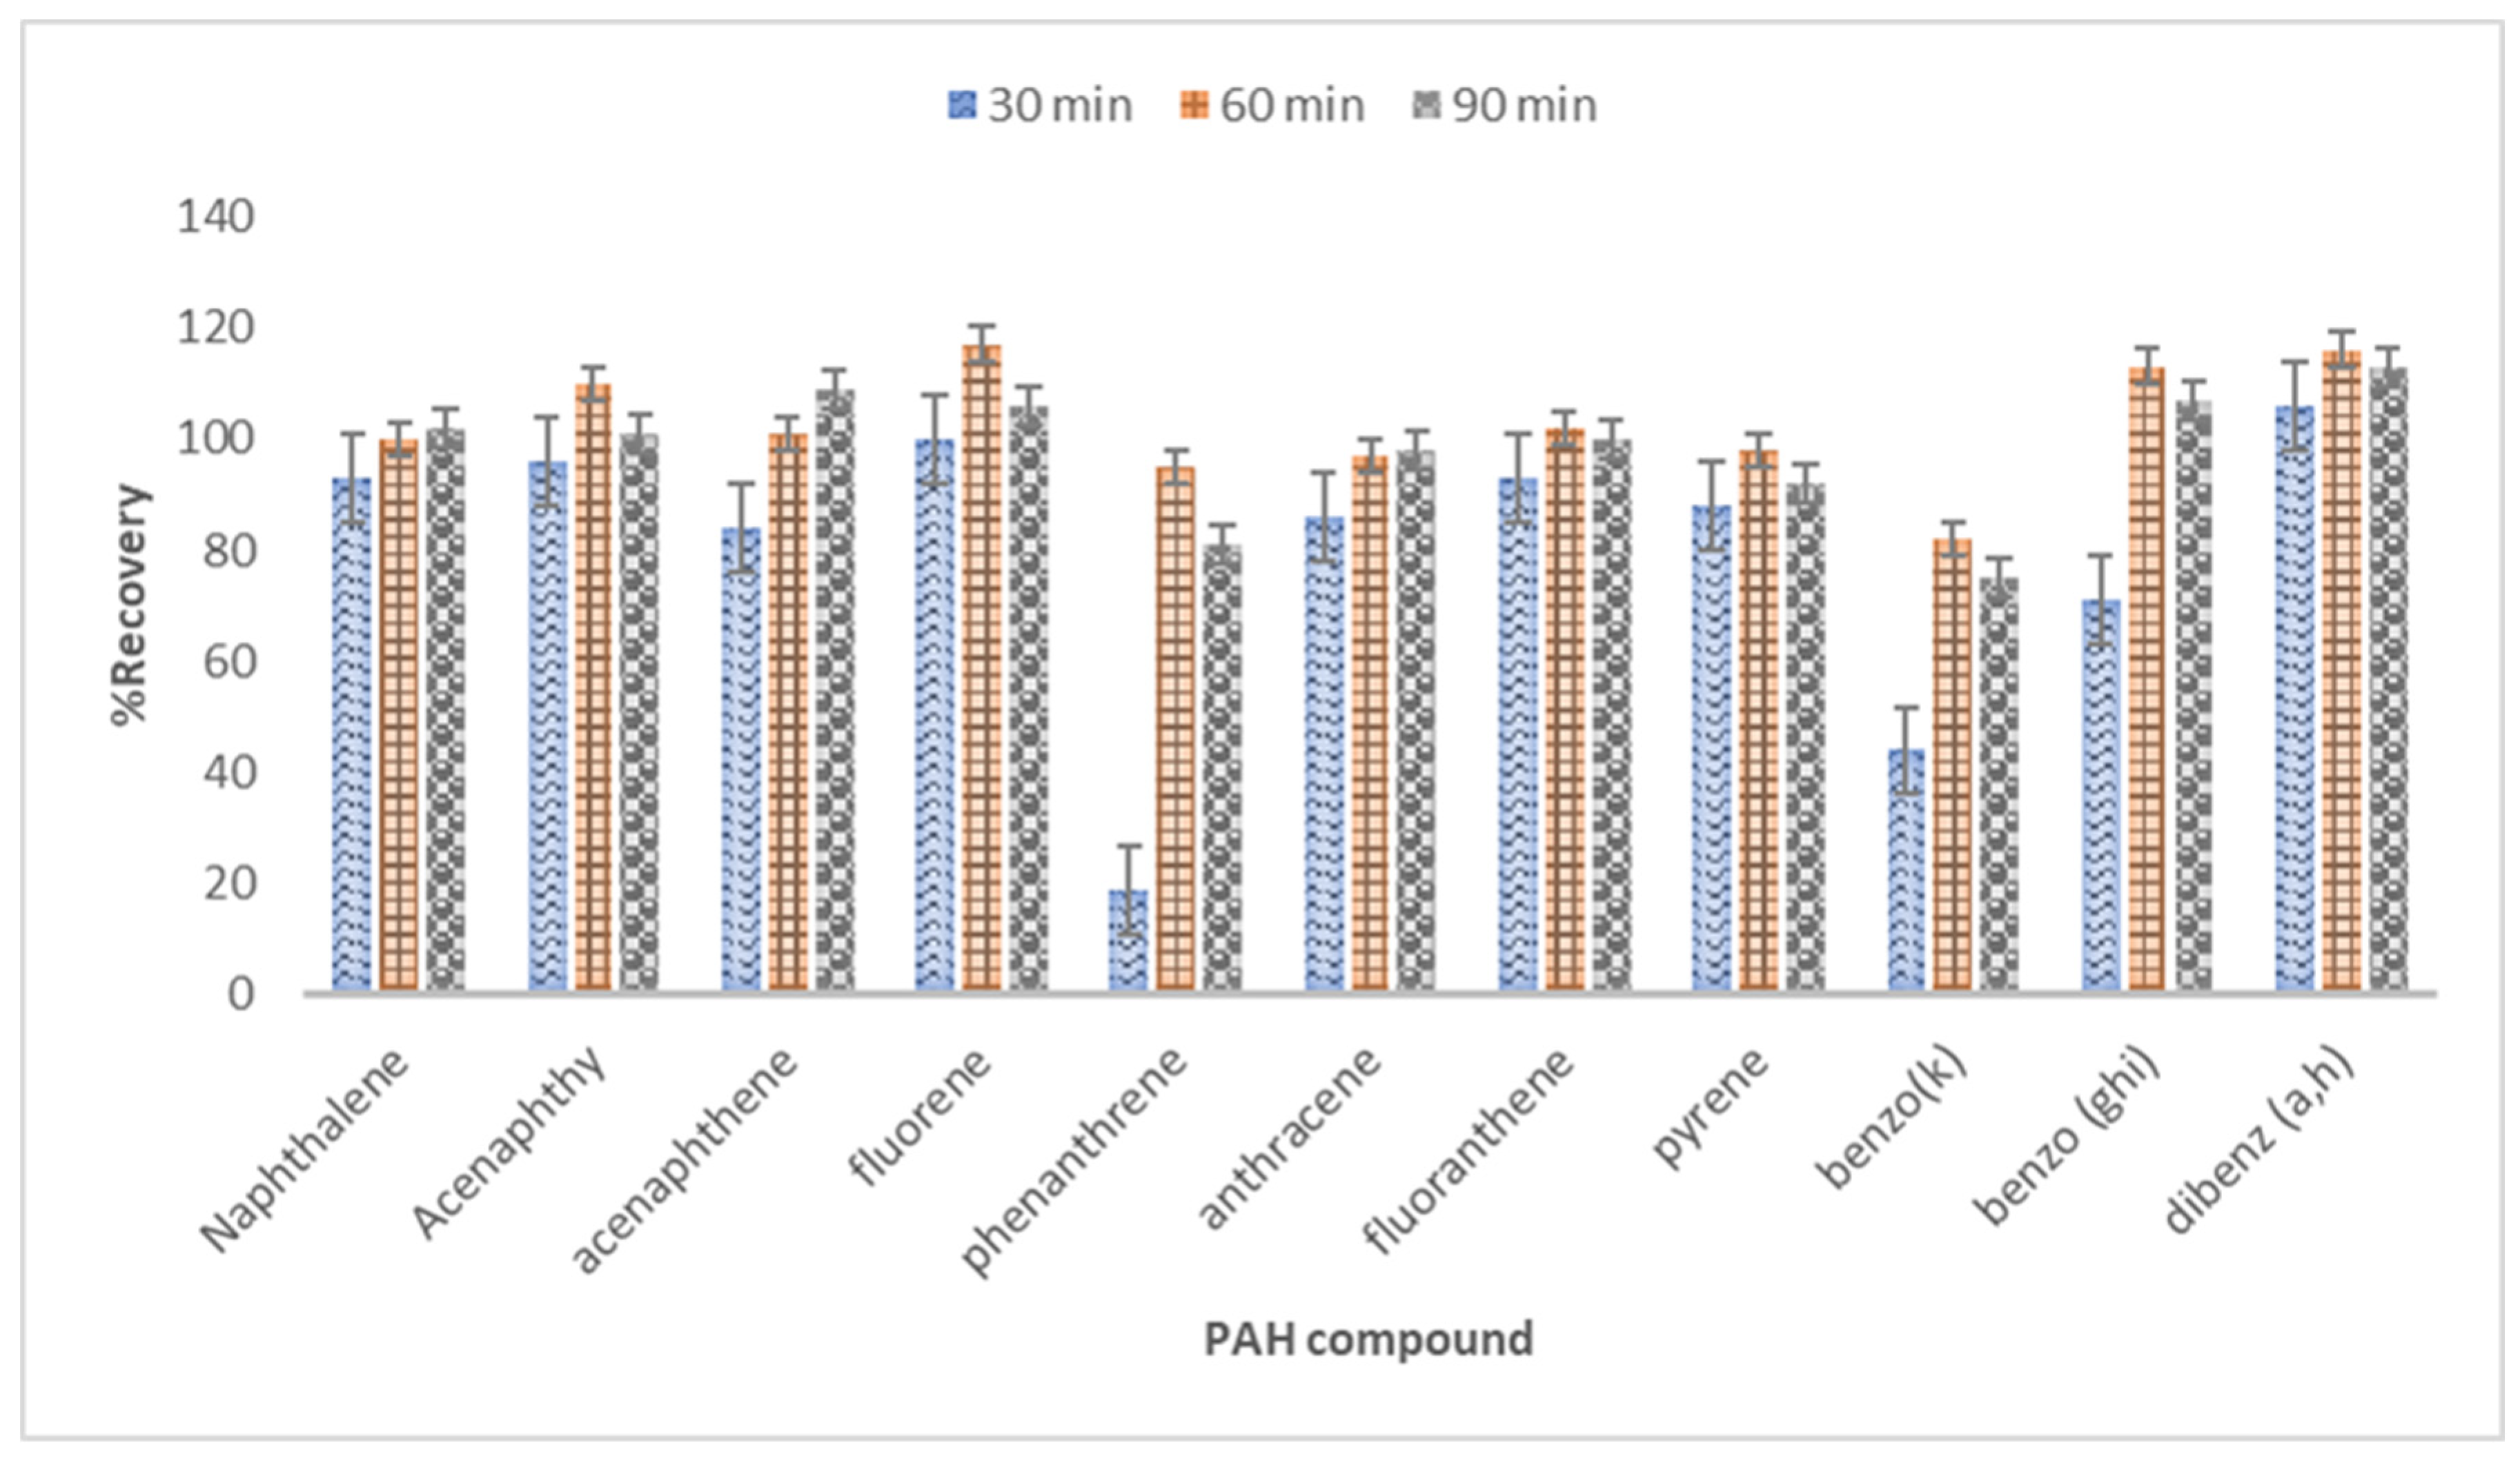
3.1.3. Effect of Extraction Time

The extraction time was also optimised to ensure sufficient extraction without degradation of the target analyte; the investigated times were 30 min, 60 min and 90 min. It was found that percentage recovery increased from 30 min to 60 min with a significant difference (p = 0.02) in recovery, while a further increase of extraction time from 60 min to 90 min showed a slight decrease in the percentage recovery (Figure 4) with no significant difference (p = 0.37) in recovery, a pattern followed by 30 min recoveries when compared to that of 90 min (p = 0.05), as shown in Table S3. The decrease in recoveries could indicate the possible degradation of the analytes by radiation; therefore, 60 min was used as the optimal extraction time. The results obtained were comparable to those obtained by Aydin et al., who optimised extraction times of 15–60 min and obtained higher recoveries (70 to 112%) at 45 min [26].

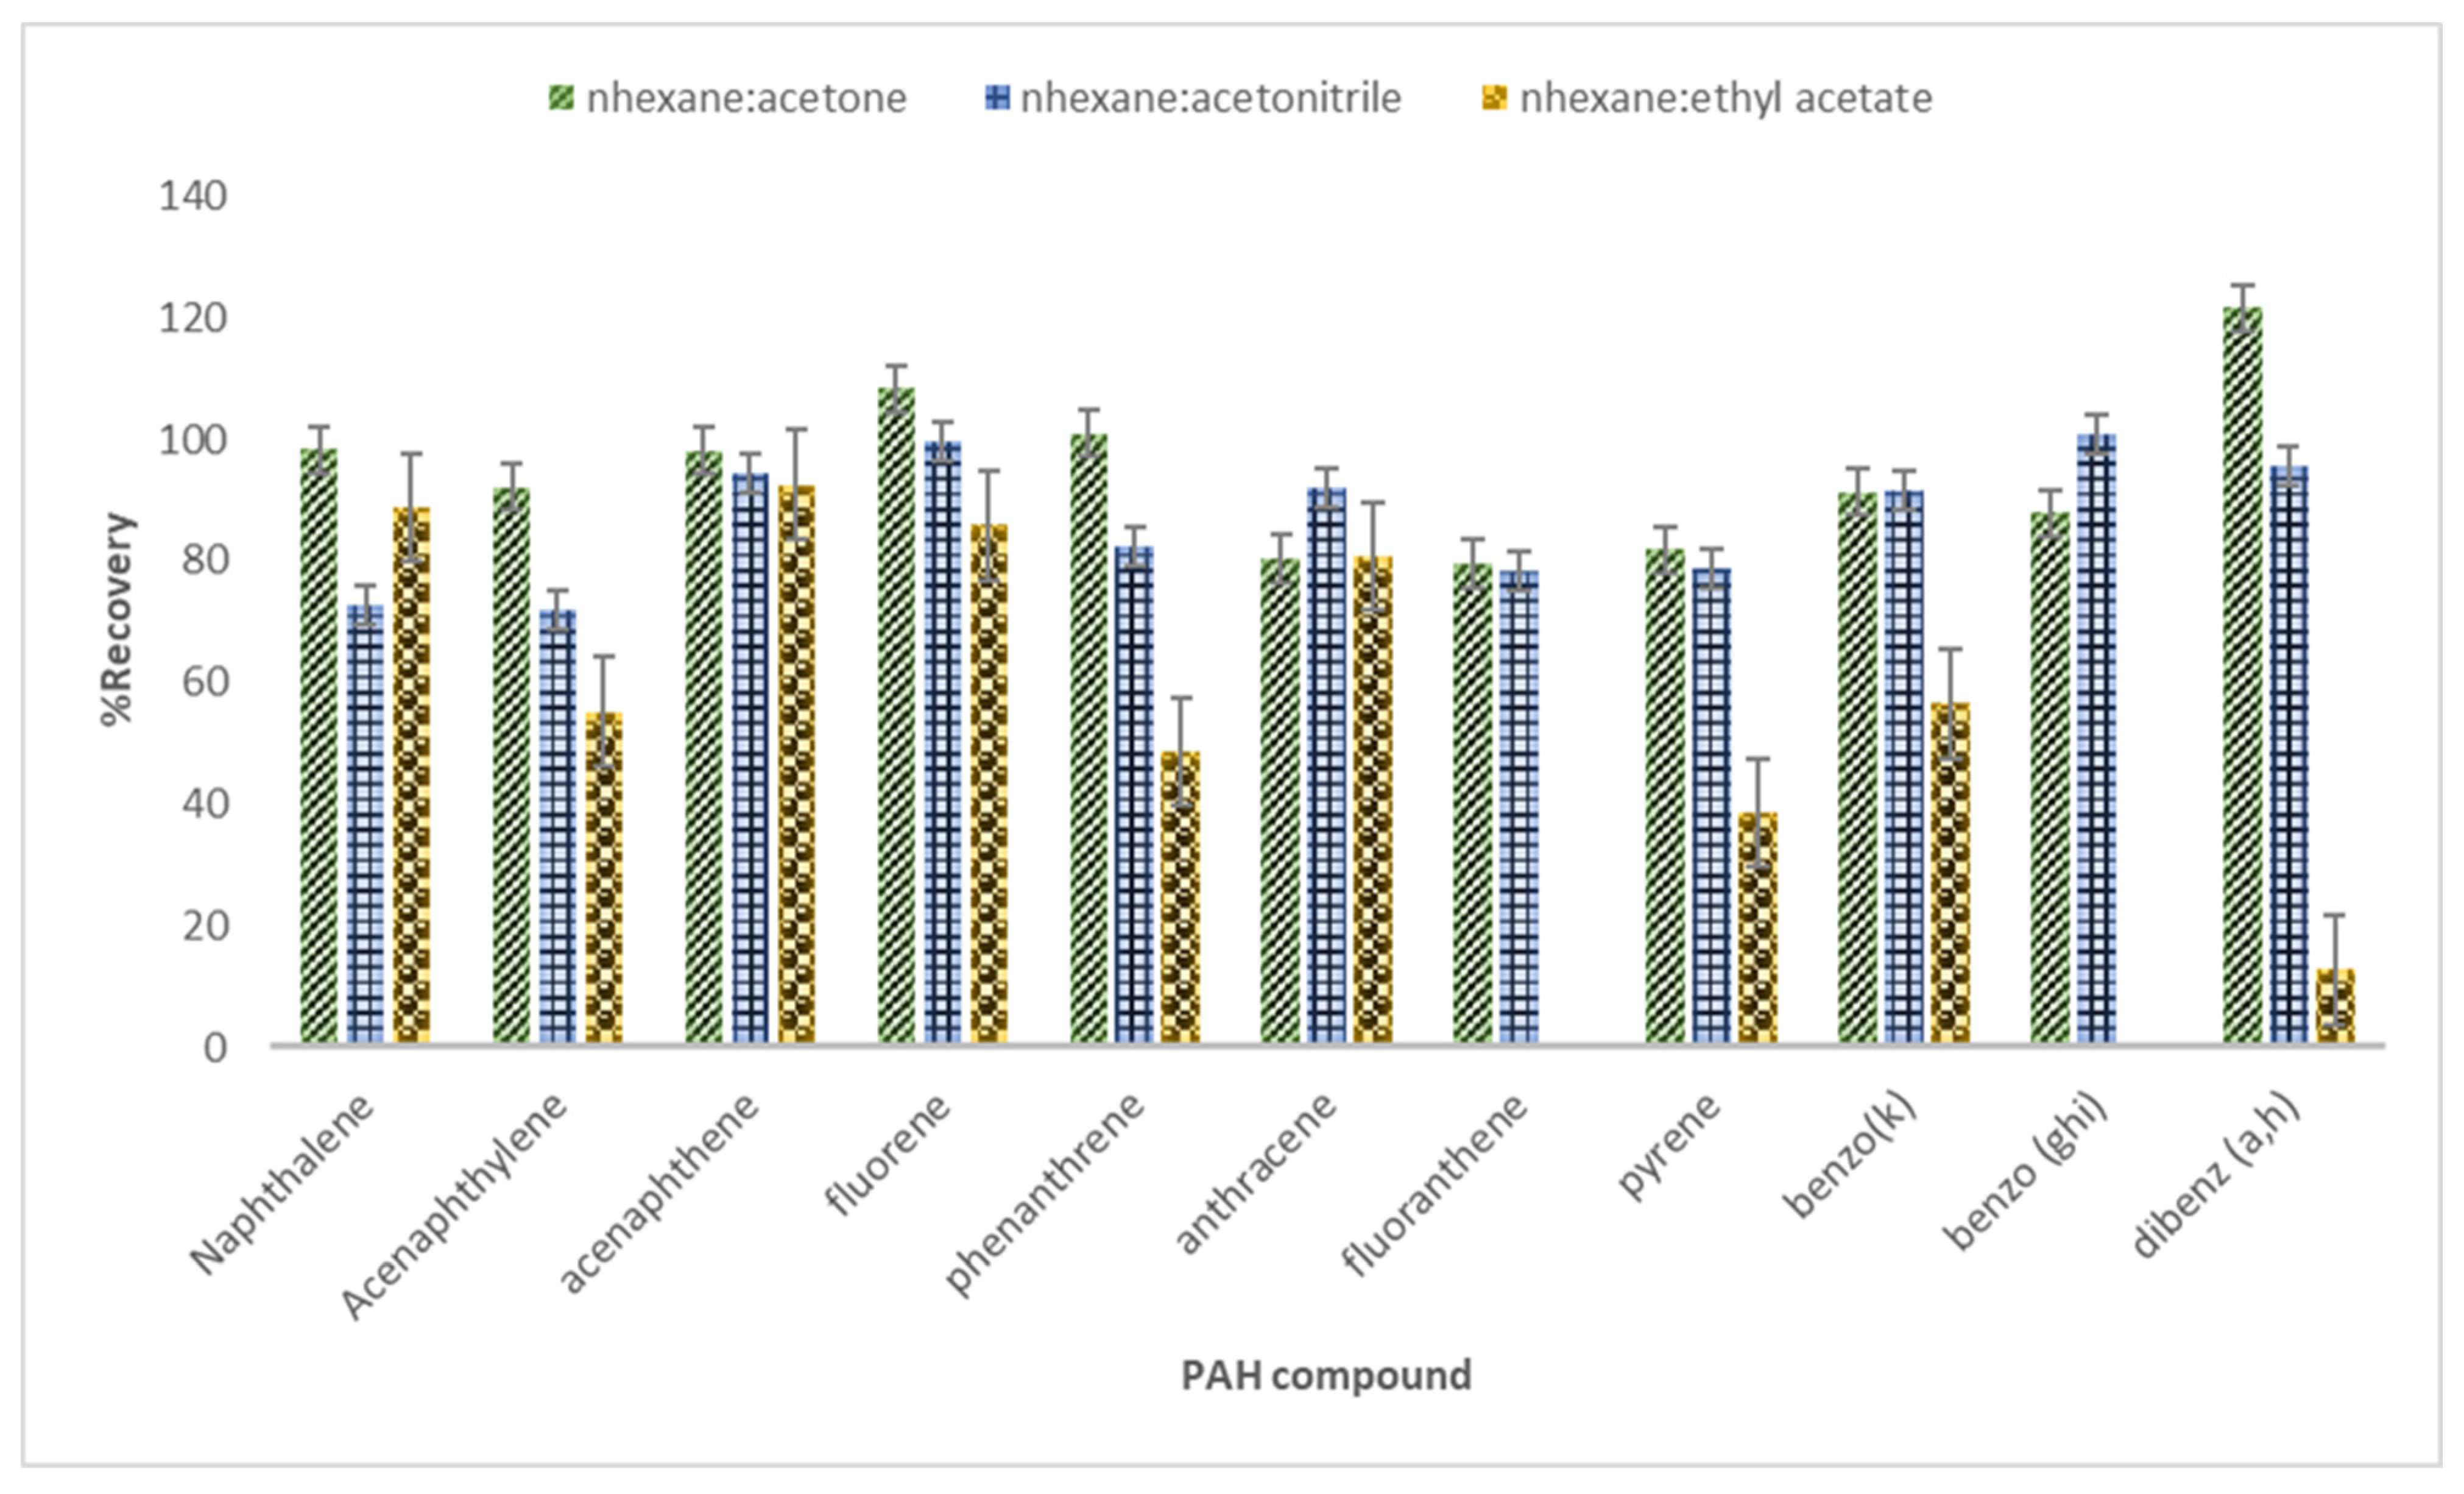
3.2. Optimization of MAE

Effect of the Extraction Solvent on Recoveries

The selection of the extraction solvent when using MAE is based on the solvent’s dielectric constant, which is a solvent’s ability to absorb microwave energy. This constant, also known as the relative permittivity, measures a solvent’s ability to store electric charges and is directly propositional to polarity [24]. One solvent is often immiscible while the other one is miscible with water; the miscible solvent helps the mixed solvent to penetrate the layer of water on the surface of the solid in order to successfully facilitate extraction [20]. Therefore, the effectiveness of the extraction solvent was determined as shown in Figure 5 using (i) n-hexane + acetone, (ii) n-hexane + acetonitrile and (iii) n-hexane + ethyl acetate. The n-hexane and acetone combination gave the highest recoveries, ranging between 79.6% and 120%, while nhexane + acetonitrile gave comparable recoveries that ranged from 71.8% to 101%, with no significant difference (p = 0.15) observed between the mixture’s recoveries; therefore, the solvent with higher recoveries was used as the optimum. The nhexane + ethyl acetate mixture gave low recoveries (12.8–92.6%) and the p value of the mixture for nH + ACN (0.03) and nH + ACT (0.007) suggested a significant difference in their recoveries (Table S4). The recoveries obtained using acetone and acetonitrile were high compared to ethyl acetate, which could be a result of their high dielectric constants compared to that of ethyl acetate, which allows the penetration of the surface layer of the solid, leading to a successful extraction as the microwave directly binds and polarise the molecules that are available in the mixture [27], The results obtained above are in agreement with results obtained by Sanchez-Uria et al. where nhexane/acetone as an extracting solvent was compared to acetone alone for the same purpose [28].

3.3. Method Validation

Method validation is an important factor in ensuring that both qualitative and quantitative analysis is achieved for the compounds of interest. The method validation for the developed UE and MAE methods was achieved by investigating linearity, accuracy, recoveries, limit of detection LOD, LOQ, sensitivity and selectivity/specificity. The R2 values for the PAHs ranged from 0.9977–0.9993, which were all greater than the minimum value of 0.99. The recovery test (n = 5, spiked at 10 µg/kg) gave a %recovery of 93.7–121% and 79.6–122% for UE and MAE, respectively, with a %RSD that was less than 10% (Table 1) and thus within the acceptable recovery range of 70–120% [29]. Silalahi et al. also found that ultrasonic showed a good recovery of greater than 80%, except for with naphthalene [9], while Wang et al. found that most PAHs recovery ranges between 75.5–99.7% using MAE, indicating the validity of the extraction and cleanup procedures [30]
Student’s t-test showed that there was no significant difference (p = 0.24) between the recoveries of both UE and MAE (Table S5). The LOD and LOQ were calculated by using signal-to-noise ratios of 3 and 10, which ranged from 0.0250 µg/kg to 1.21 µg/kg and 0.0800 µg/kg to 3.54 µg/kg for MAE, and from 0.0840 µg/kg to 0.215 µg/kg and 0.0190 µg/kg to 0.642 µg/kg for UE, respectively (Table 1). The LODs for PAHs obtained by Wang et al. for MAE were higher at 0.12–2.40 µg/kg than those obtained in this study, while for UE the LODs were lower at 0.002 to 1.87 µg/kg, as reported by Ozcan et al. [30,31]. The p values obtained (Table S5) for both LODs and LOQs showed no significant difference between their concentrations at 0.18 and 0.10, respectively. The results obtained showed that both microwave and ultrasonic extraction methods can be effectively used, although UE was more sensitive and accurate for most compounds.

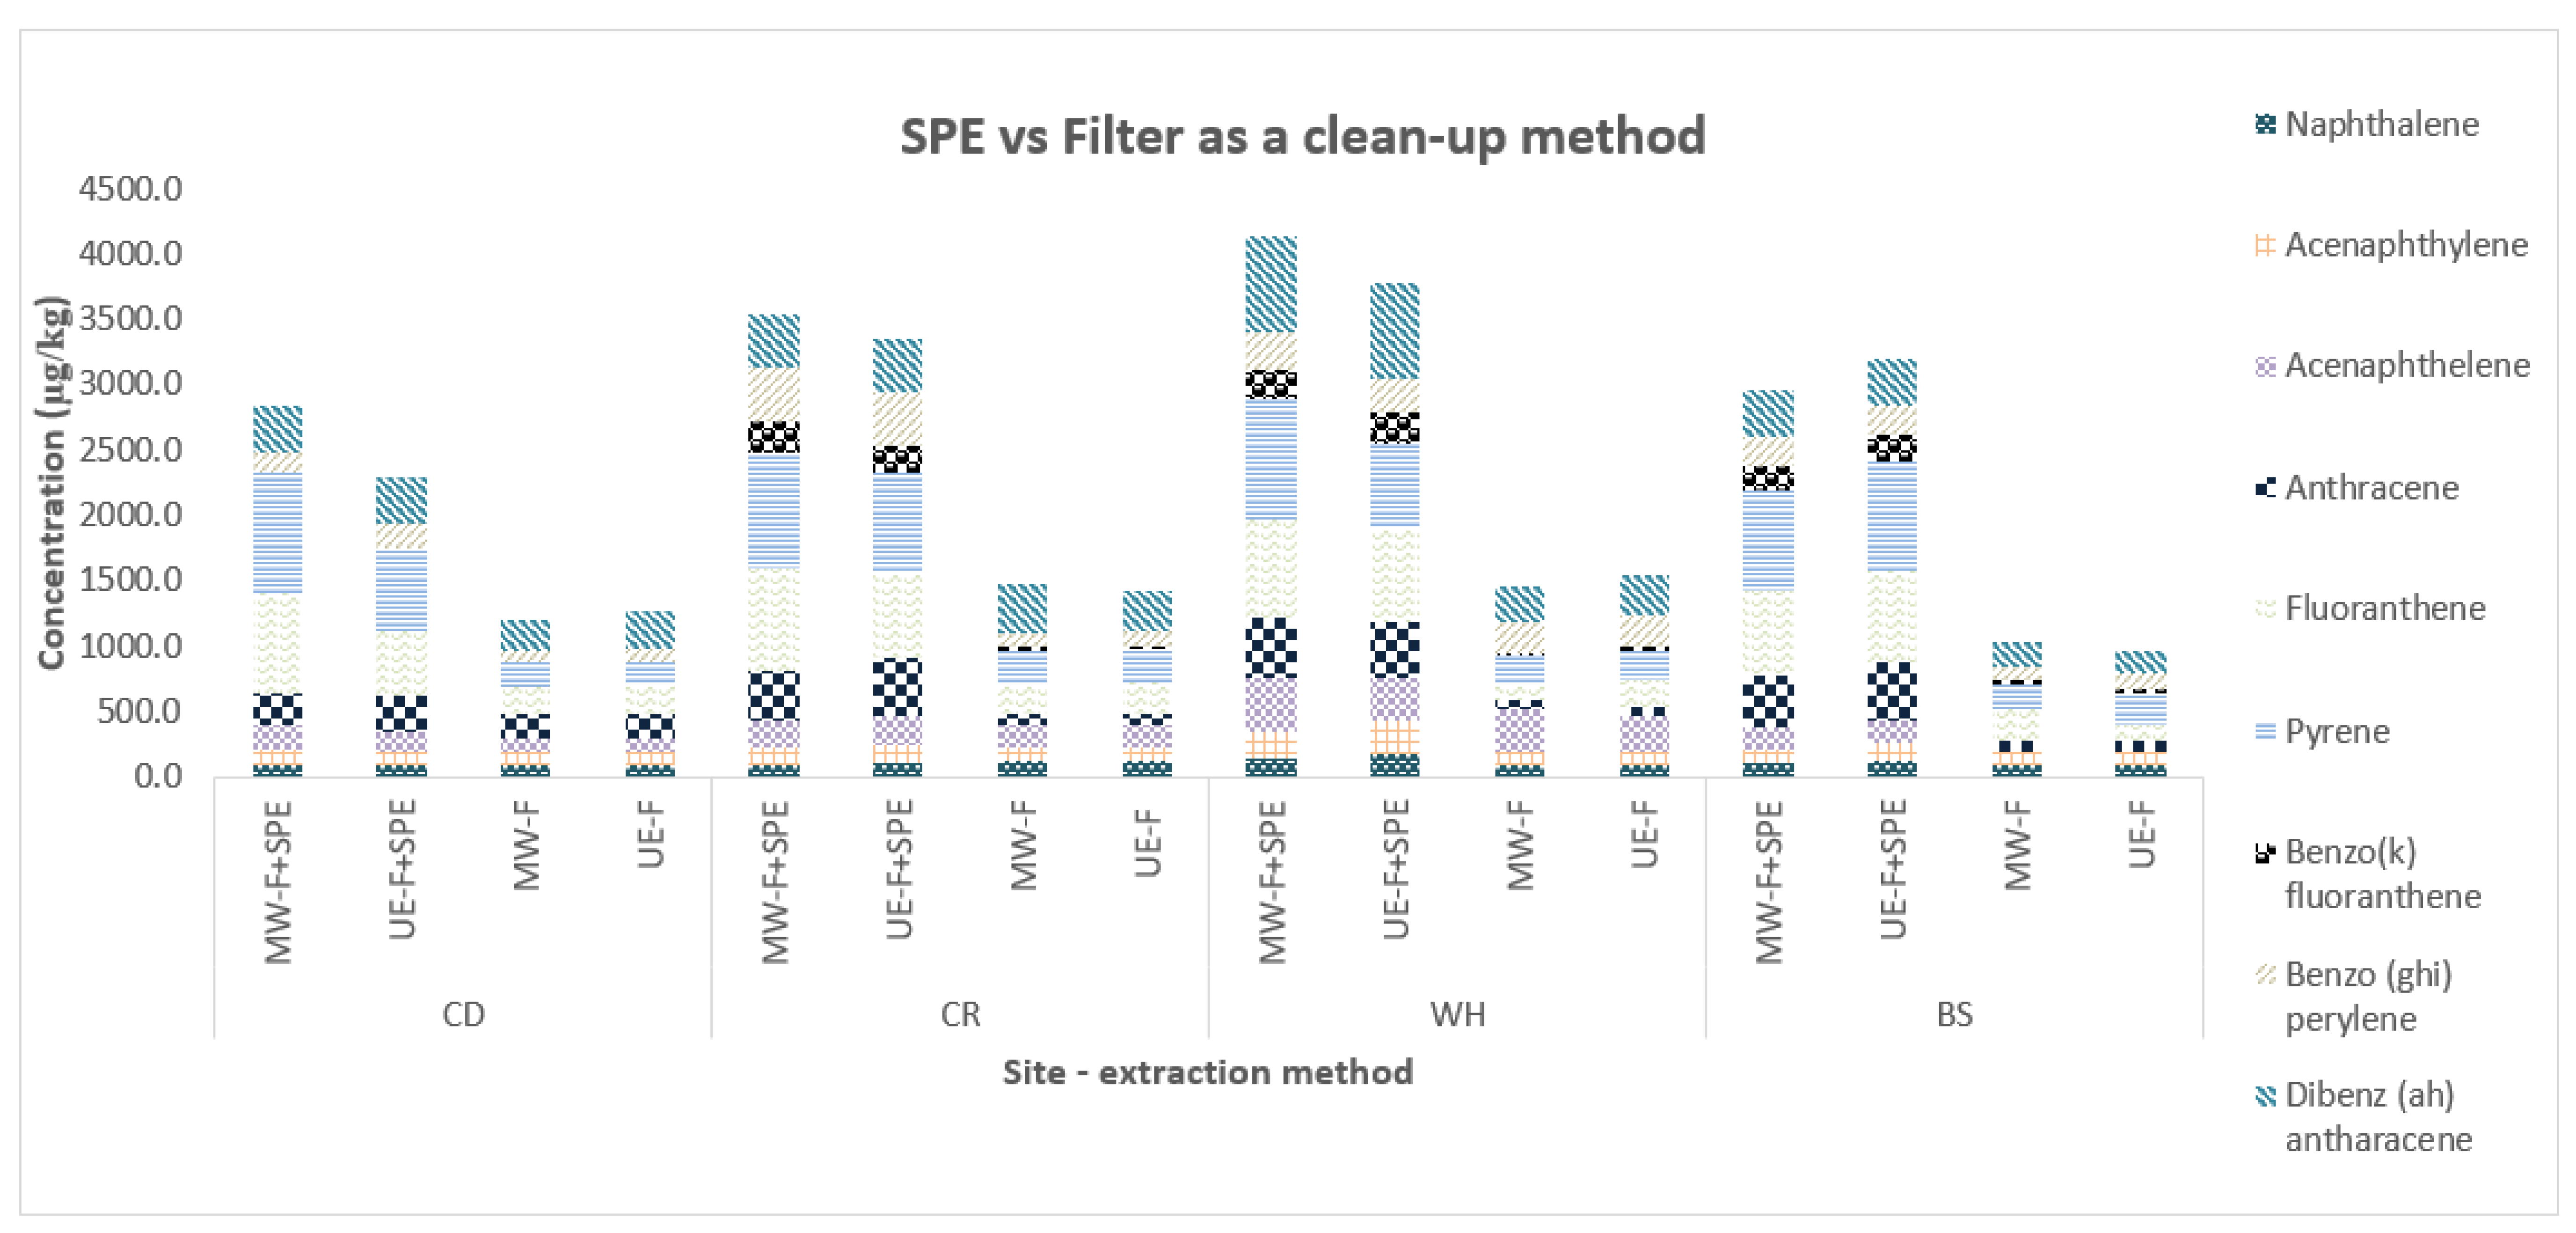
3.4. PAHs Concentration Detected in uMsunduzi River Sediment Samples

The optimised MAE and UE conditions were also applied in sediment samples collected from uMsunduzi River at four different sampling sites, namely: CD, CR, WH and BS. The samples from both the microwave and ultrasonic extraction methods were either filtered only or filtered then passed through SPE for further sample purification. The extraction methods and the effects of filtering and SPE cleaning of samples were then compared to determine their efficiency. All the studied PAHs were detected in all the collected sediment samples at varied concentrations, except for phenanthrene and fluorene (Figure 6). Pyrene, a four-ring PAH, showed high total concentration dominance at 24%, followed by a five-ring (Dibenz (ah) anthracene) at 17%, and then fluoranthene, another four-ring PAH at 13%. All the PAH concentrations obtained were within the maximum allowable concentration of 3.0 × 10³ µg/kg (for naphthalene, acenaphthylene, acenaphthene, fluorene, phenanthrene, anthracene, pyrene and benzo[ghi]perylene), except for dibenz (ah) anthracene, which showed concentrations above the limit of 300 µg/kg in all four sampling sites. The anticipated dominance of these high-molecular-weight PAHs suggests the predominance of pyrolytic (incineration processes) contamination sources [32].
The highest pyrene concentrations were obtained in sampling site CD, followed by WH, CR and BS, which is expected since CD is the industrial hub of Pietermaritzburg and WH is close to the New England dumpsite and Willowtown factories. The HWM-PAHs are more hydrophobic than those with low molecular weight, which allows them to be adsorbed in a soil matrix easily since they do not dissolve in water [33]. The results obtained when using MAE and UE with the same purification technique (filtering or SPE-cleaning) were comparable, while the results with the same extraction but different purification technique were different. The SPE-cleaned results gave high concentrations compared to the concentrations obtained when filtering only. The MAE-F + SPE gave concentrations ranging from 95.96 to 919.0 µg/kg while the UE-F + SPE gave concentrations at ranges of 96.26–926.0 µg/kg. The MAE-F and UE-F gave low concentrations in comparison to the aforementioned, with ranges from 21.75 to 380.6 µg/kg and 21.61 to 308.3 µg/kg, respectively. The low concentrations obtained from the filtered samples could be attributed to interferences in the sample as a result of inadequate purification of the sample, which could possibly camouflage the analyte of interest [34]. Silalahi et al.’s study showed that a clean-up technique is significant as it improves the extraction method detection capability [9].

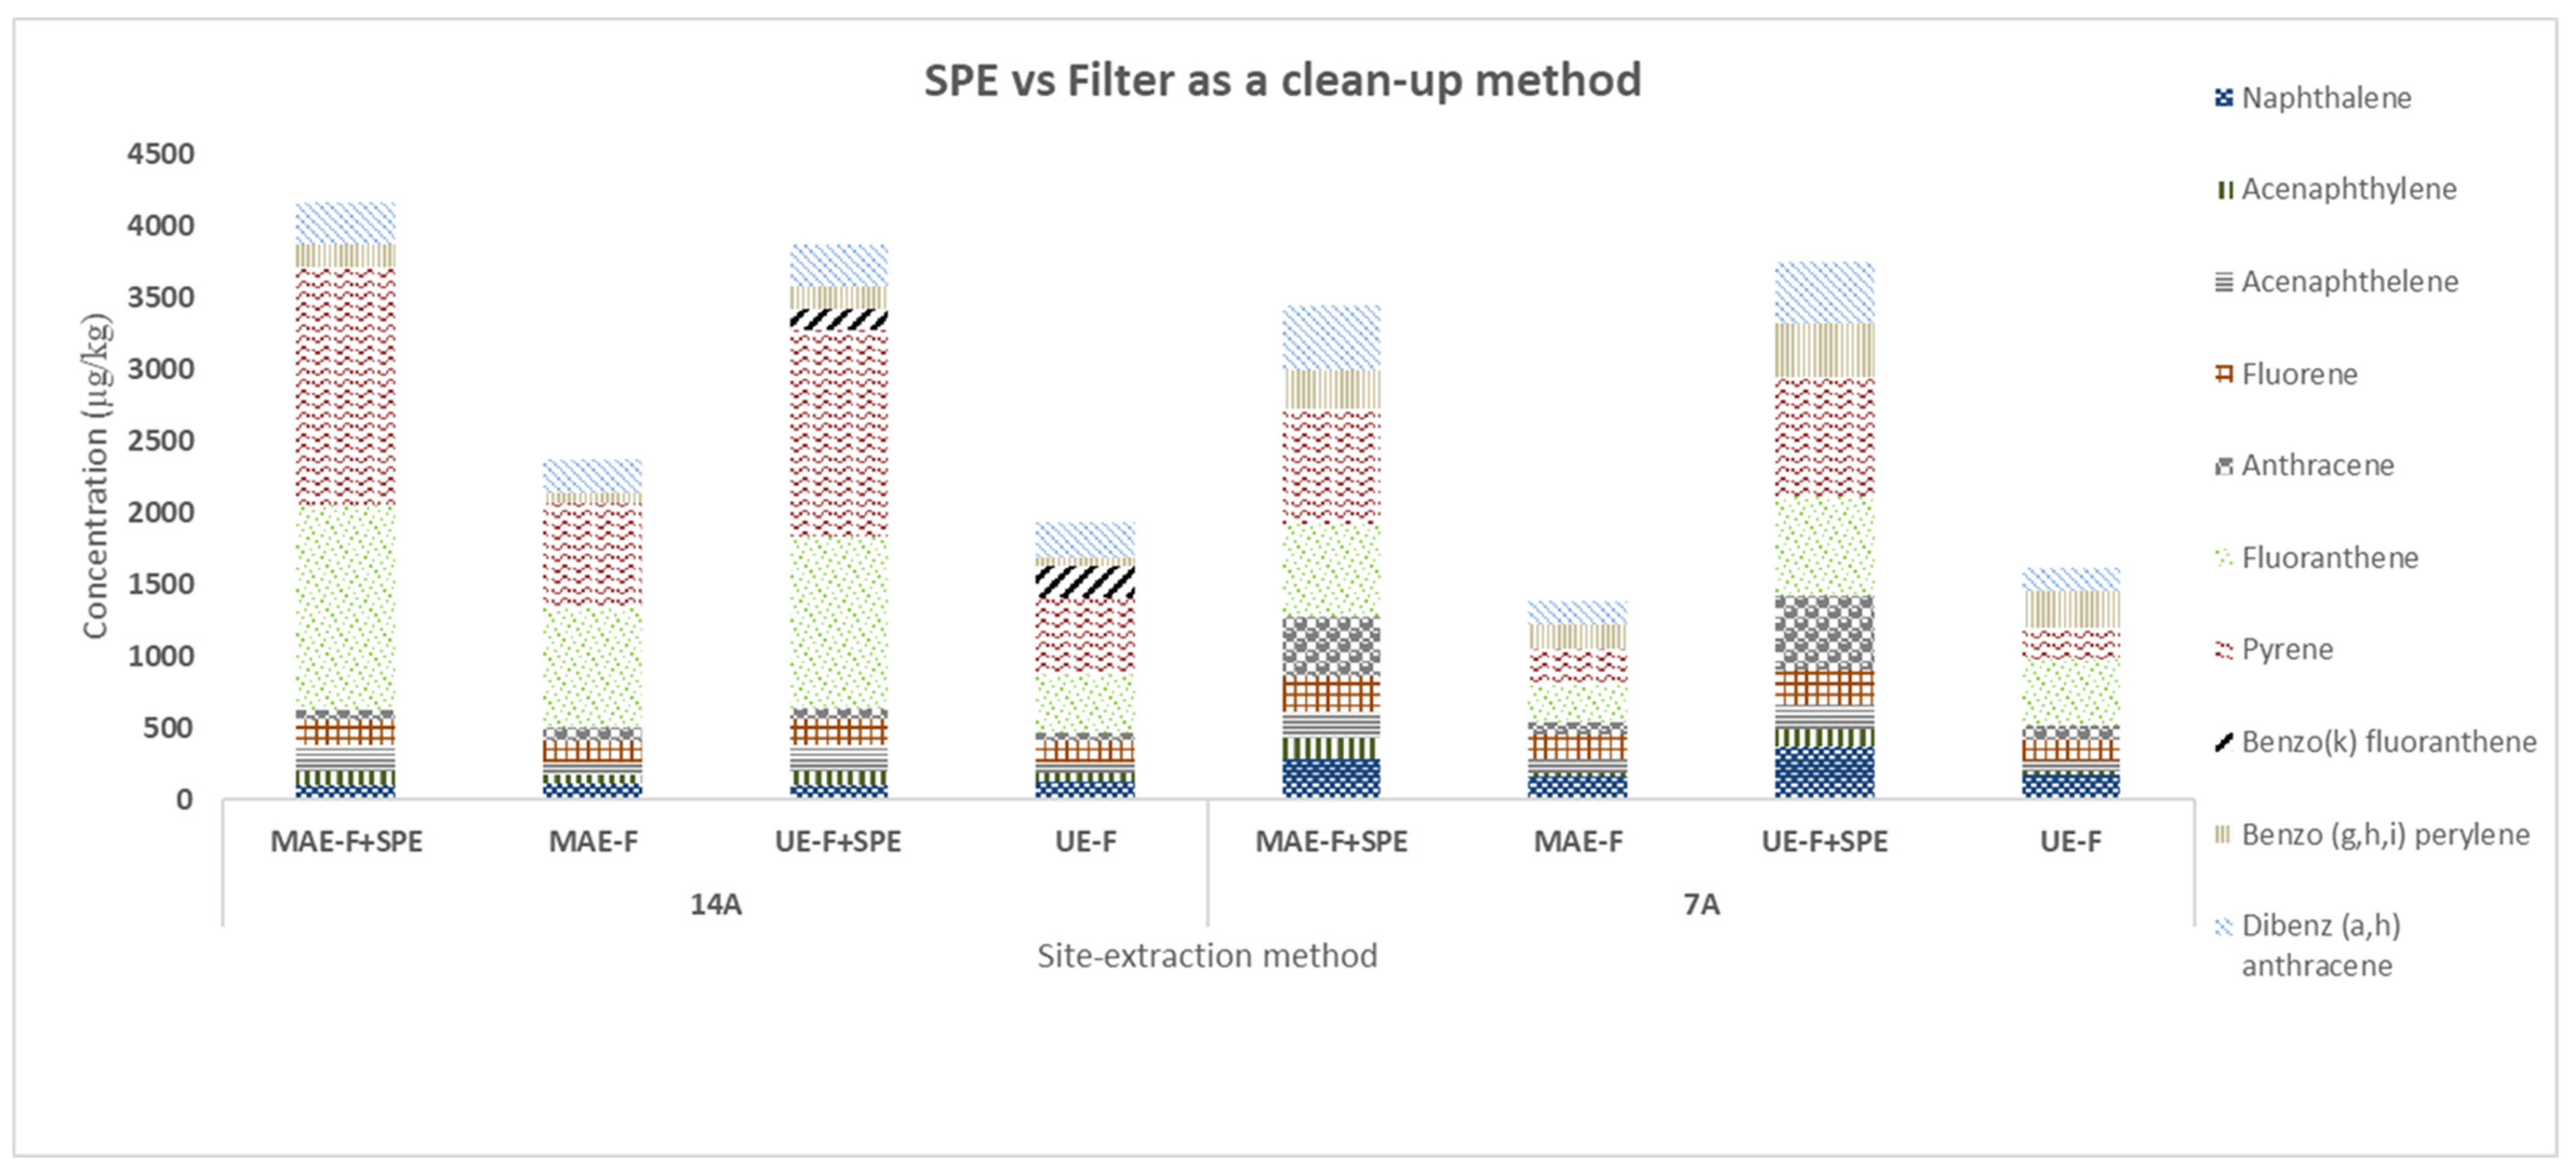
3.5. PAH Concentration Detected in Darvill Sludge Landfill

Figure 7 shows the concentrations of PAHs obtained from filtered, SPE-cleaned, microwaved or ultra-sonicated sludge samples at sampling points 7A and 14A of the Darvill sludge landfill used for sludge disposal by Darvill wastewater works. These two sampling points are the centre of the sludge landfill, which makes them likely to be more concentrated than the rest of the points. All the targeted PAHs were detected except for phenanthrene (Figure 7). Pyrene dominated with a total concentration of 34%, followed by fluoranthene and dibenz (ah) anthracene, both at 12%; their concentrations were all within the maximum allowable limits of 5.0 × 10⁴ µg/kg. Since the sampling sites were also dominated by HMW-PAHs, similar pollution sources are expected as these two sampling sites are close to the New England dumpsite and Willowtown. The concentrations for microwave filtering and F + SPE cleaning ranged from 55.79 to 728.4 µg/kg and 71.62 to 1656 µg/kg, respectively, while for UE-filtered they ranged from 54.39 to 535.4 µg/kg and UE F + SPE-cleaned 70.9 to 1443 µg/kg. The SPE-cleaned samples in both sampling points gave higher concentrations compared to the filtered ones, with both extraction methods giving relatable concentrations. The high concentration levels of PAHs in the sludge landfill could be a result of the fact that Darvill is designed to biologically treat inorganic nutrients and trace metal to meet the discharge limits, and therefore whatever contaminant entered the treatment process, including PAHs, can still be detected after the treatment has taken place [35].
Only a few studies have been carried out on PAHs in sediments, and even fewer in sludge matrices, especially in South Africa. The maximum concentration obtained from the sediment analysis of this study is higher (926 µg/kg) than the concentrations obtained by Ngubo et al. [7] at 42 µg/kg, but lower than the ones obtained by Munyengabe et al. [36] at 69,070 µg/kg in the same area of study (uMsunduzi river). However, pyrene was found at the highest average concentration in all three studies. The maximum concentration obtained in Kwa-Zulu Natal (69,070 µg/kg) is higher than the ones obtained in other South African Provinces, such as Limpopo at 21,600 µg/kg by Edokpayi et al. [37] and Eastern Cape at 22,310 µg/kg by Adeniji et al. [38]. The maximum concentration of PAHs observed in South African studies was higher than those obtained in other African countries, such as Nigeria by Asagbra et al. at 6561 µg/kg [39]. The maximum concentrations obtained in African countries were higher than those reported in overseas countries, such as Mexico by Jaward at 68 µg/kg [40] or China by Zhang et al., at a maximum concentration of 5568 µg/kg [41]. The PAHs obtained in the sludge analysis of this study showed lower concentrations than a study conducted in China (82,520 µg/kg and 3264 µg/kg) by Hua et al. [42] and Wu et al. [43], respectively, while in Italy, concentrations were found to be 2645 µg/kg by Torretta et al. [44]. The high concentration of PAHs in South Africa and other parts of the world emphasizes the importance of monitoring the concentrations of PAHs in the environment.

3.6. PAH Origin Identification

Diagnostic Isomer Ratio

Different diagnostic ratios, such as Fl/(Fl + Pyr) and LMW/HMW, were used to identify the original sources of PAHs, either petrogenic or pyrogenic. The pyrolytic sources are a result of incineration processes, while petrogenic PAHs are a result of incomplete combustion of petroleum products. When the ratio (Fl/(Fl + Pyr)) is less than 0.40, the PAHs are said to be due to petrogenic sources and when greater than 0.40 are a result of pyrogenic sources [45]. When the LMW/HMW ratio is greater than 1, the PAHs are typically a result of combustion of petroleum contaminants, and when less than 1 due to combustion of grass, wood or coal.
The Fl/(Fl + Pyr) was determined to be greater than 0.4 for all sites, indicating that the PAHs originated from incineration processes (Table 2). The LMW/HMW ratio was also found to be less than 1 for all sampling sites in uMsunduzi river and Darvill sludge, which suggests that the PAH were indeed a result of emissions of high-temperature combustion or incineration processes, which typically results in PAH mixtures with higher proportion of HMW PAHs [46].

3.7. Toxicity Studies

3.7.1. Risk Assessment

To characterize and assess the toxicity of PAHs, a number of factors were evaluated, which included the effects range low (ERL), effects range median (ERM) and the benzo(a)pyrene toxic equivalency quotient (TEQ), together with mutagenic equivalency quotient (MEQ) and the increment life cancer risk (ILCR). The concentrations of PAHS in soil obtained from MAE-F + SPE were used to assess the toxicity of PAHs, since it was found to be the most efficient method. The ERL, which corresponds to the 10th percentile of data (concentration below with which effects that infrequently occur), and the effects range ERM, corresponding to the 50th percentile of data (effects that frequently occur), were used [47]. The ERL and ERM values (Table 3) were used as guidelines on where the average acceptable concentration levels of total PAH in sediments should be below the ERL, while the unacceptable concentration levels were the ones above the ERM. Average concentrations above ERM are indicative of toxic effects relative to the area of investigation [47]. The TEQ and MEQ were calculated using Equations (1) and (2), where Ci is the PAH concentration, TEF is the toxic equivalency factor and MEF is mutagenic equivalency factor [38]. The ILRC was evaluated based on the dermal exposure risk (Equation (3)) since the uMsunduzi river is used for recreational purposes, such as the Dusi canoe marathon, and the sludge landfill is used for planting landscaping grass (lawns). The contamination by the PAHs in the studied sites was classified into three different groups: (1) not contaminated when the total PAH concentration of a site was less than 200 µg/kg, (2) weakly contaminated when the total concentration was between 200–600 µg/kg and (3) heavily contaminated when it was greater than 1000 µg/kg [48].
TEQ = ∑Ci × TEF
MEQ = ∑Ci × MEF
The average concentration levels were between the ERL and ERM for all PAHs in uMsundizi river sediments except for naphthalene, acenaphthylene and acenaphthelene, which had values above ERM, indicating that mild toxic effects to the organisms are likely to occur and indicative of toxic effects to the surrounding environment. The TEQ and MEQ were calculated by multiplying the PAH compound concentration with their corresponding TEF and MEF values, respectively [49]. The PAH TEQ and MEQ average ranged from 0.49 to 1850 µg/kg and 72.6–434 µg/kg, respectively. The sum of toxic equivalency quotient (∑TEQ) of all PAH compounds was below the safe level of 600 µg/kg, except for the ∑TEQ of dibenz(ah)anthracene, indicating its high toxicity potency in the study area [49]. Therefore, consideration of regulating combustion and ensuring all activities that cause these contaminants in the environment are controlled to ensure the safety of human and aquatic lives is vital. All the sites investigated were heavily contaminated, with concentrations ranging from 2909 µg/kg (CD)–4326 µg/kg (14a).

3.7.2. Increment Life Cancer Risk

The increment life cancer risk was evaluated for the PAHs with probable carcinogenic potentials to humans as listed by the International Agency for Research on Cancer (IARC) and U.S Environmental Protection Agency (US EPA), which include Benzo(k) fluoranthene (BkF) and Dibenz(a,h)anthracene (DahA) [50]. The BkF and DahA contributed 4.7% and 13%, respectively, with the highest concentration of DahA (730 µg/kg) recorded at WH, while for sludge, the highest concentration of DahA was recorded at 7a (452 µg/kg). Due to the high contribution of DahA to the total carcinogenic PAHs concentration, it was used in the calculation of ILCR. The model equation and parameters used for the evaluation of ILCR were taken from the literature and are tabulated in Table 4 The regulatory guidelines of the New York State Department of Health provided the classification of ILCR values where it was suggested that if the ILCR is less than 10−6 it is very low or negligible risk, between 10−6 to 10−4 it is low risk, and when greater than 10−4 to 10−3 it is moderate risk, while greater than 10−3 to 10−2 is high risk and ≥ 10−1 is classified as very high risk [51]. The ILCRderm represents the increment life cancer risk via dermal contact (µg/kg/day) and was calculated using Equation (3); the variables used are tabulated in Table 4.
ILCRderm = C i × S A × K p × E T × E F × E D × C F B W × A T
Table 4. Parameters used in the estimation of human cancer risk.
VariablesChildAdultReference
Concentration, Ci (µg/kg)--
Skin area exposed, SA (cm2)28005700[38,47]
Exposure duration, ED (years)630[38]
Body weight, BW (kg)1571.9[52]
Permeability coefficient, Kp (cm/h) (DahA)2.3[38]
Exposure time, ET (h/day)8[47]
Exposure frequency, EF (days/year)313[47]
Averaging time, AT (day)64.63 × 365 days = 23,590[53]
Conversion factor, CF1 × 10−6[47]
ILCRderm (µg/kg/day)-sediments1.92 × 10−14.98 × 10⁻¹This study
ILCRderm (µg/kg/day)-sludge1.01 × 10−12.62 × 10⁻¹
Life expectancy of an average South African is 65 years.
The ILCRderm values calculated with DahA concentrations for sludge and sediments were 1.01 × 10⁻¹ and 1.92 × 10⁻¹ for children and 2.62 × 10⁻¹ and 4.98 × 10⁻¹ for adults, correspondingly. Both the sites exhibited very high potential risk of cancer to the inhabitants of the area, suggesting that the study area is not entirely safe for use even for recreational purposes. An article titled “uMsunduzi River being flushed ahead of Dusi marathon” published by Mercury News also echoed the unsafeness of being exposed to the water of uMsunduzi river, where Henley dam water was released in order to flush toxins in the river water prior to the annual Dusi canoe marathon of 2022 [54]. It is worth noting that adults have a higher probability of being dermally exposed to these carcinogenic contaminants than children. Therefore, such pollution should be regulated in order to ensure the safety of human beings and living organisms in these areas.

4. Conclusions

Both the optimised extraction methods (MAE and UE) coupled with GC-MS were found to be efficient in determining the PAHs with high accuracy and precision. The type of clean-up method, either filtering only or filtering followed by SPE, showed a significant impact on the concentrations of PAHs obtained. The filtered plus SPE-cleaned samples gave higher concentrations than only filtered samples; thus, it can be recommended for daily analysis of PAHs.
Pyrene was found to be the dominating PAH in both sediment and sludge samples. However, all the PAHs were within the maximum allowable concentration except for DahA in all sampling sites except for 14a. The PAHs in the investigated areas were found to be a result of pyrolytic sources; from the incineration of biomass, such as burning of waste in landfill, fumes from industries, etc. All the sampling sites were shown to be highly contaminated with PAHs, with TEQ and MEQ of DahA suggesting carcinogenic and mutagenic risk. The ILCR values of DahA also suggested high potential carcinogenic risk through dermal exposure for adults than children. Therefore, the continuous use of regulations such as NEMWA as a guideline for proper pollution monitoring is of importance to safeguard human health.

Supplementary Materials

The following supporting information can be downloaded at: https://www.mdpi.com/article/10.3390/app13095619/s1, Table S1: UE extraction solvent; Table S2: UE extraction solvent volume; Table S3: UE extraction time; Table S4: MAE extraction solvent; Table S5: UE/MAE method validation.

Author Contributions

Conceptualization, P.M. and S.N.; Methodology, P.M. and S.N.; Validation, P.M. and S.N.; Formal Analysis, S.N.; Investigation, S.N.; Resources, P.M. and M.M.; Data Curation, S.N.; Writing—Original Draft Preparation, S.N.; Writing—Review and Editing, P.M. and S.N.; Supervision, P.M. and M.M.; Project Administration, P.M. and S.N.; Funding Acquisition, P.M. and M.M. All authors have read and agreed to the published version of the manuscript.

Funding

This research was funded by [Umgeni Water and National Research Foundation of South Africa under Thuthuka] grant number [121869].

Institutional Review Board Statement

Not applicable.

Informed Consent Statement

Not applicable.

Data Availability Statement

All the data collected in this work have been added to the paper.

Conflicts of Interest

The authors declare no conflict of interest.

References

  1. Abdel-Shafy, H.I.; Mansour, M.S.M. A review on polycyclic aromatic hydrocarbons: Source, environmental impact, effect on human health and remediation. Egypt. J. Pet. 2016, 25, 107–123. [Google Scholar] [CrossRef]
  2. Knuckles, M.E.; Inyang, F.; Ramesh, A. Acute and subchronic oral toxicities of benzo[a]pyrene in F-344 rats. Toxicol. Sci. 2001, 61, 382–388. [Google Scholar] [CrossRef] [PubMed]
  3. Edokpayi, J.N.; Odiyo, J.O.; Durowoju, O.S. Impact of Wastewater on Surface Water Quality in Developing Countries: A Case Study of South Africa. In Water Quality; IntechOpen: London, UK, 2017; pp. 401–416. [Google Scholar]
  4. Gama, S.; Arnot, J.A.; Mackay, D. Toxic Organic Chemicals toxic(s) organic chemicals. In Encyclopedia of Sustainability Science and Technology; Springer: New York, NY, USA, 2013; pp. 10657–10671. [Google Scholar] [CrossRef]
  5. Cano-Lerida, L.; Rose, M.; Walton, P. Polycyclic Aromatic Hydrocarbons. In Bioactive Compounds in Foods; Elsevier: Amsterdam, The Netherlands, 2008; pp. 378–399. [Google Scholar] [CrossRef]
  6. Masood, F.; Singh, H.P.; Batish, D.R. Polycyclic Aromatic Hydrocarbons as Environmental Pollutants: A review. Int. J. Adv. Res. Sci. Eng. Technol. 2017, 6, 1361–1369. [Google Scholar] [CrossRef]
  7. Ngubo, A.; Mahlambi, P.N.; Ojwach, S.O. Occurrence of polycyclic aromatic hydrocarbons in water and sediment samples from KwaZulu Natal Province, South Africa. Water Environ. J. 2020, 35, 84–96. [Google Scholar] [CrossRef]
  8. Naudé, Y.; de Beer, W.H.J.; Jooste, S.; van der Merwe, L.; van Rensburg, S.J. Comparison of supercritical fluid extraction and Soxhlet extraction for the determination of DDT, DDD and DDE in sediment. Water SA 1998, 3, 205–213. [Google Scholar]
  9. Silalahi, E.T.M.E.; Anita, S.; Teruna, H.Y. Comparison of Extraction Techniques for the Determination of Polycyclic Aromatic Hydrocarbons (PAHs) in Soil. J. Phys. Conf. Ser. 2021, 1819, 012061. [Google Scholar] [CrossRef]
  10. Oduntan, A.O.; Tavengwa, N.T.; Mhlanga, S.; Chimuka, L.; Cukrowska, E. QuEChERS method development for bio-monitoring of low molecular weight polycyclic aromatic hydrocarbons in South African carp fish using hplc-fluorescence: An initial assessment. S. Afr. J. Chem. 2016, 69, 98–104. [Google Scholar] [CrossRef]
  11. Sadowska-Rociek, A.; Surma, M.; Cieślik, E. Comparison of different modifications on QuEChERS sample preparation method for PAHs determination in black, green, red and white tea. Environ. Sci. Pollut. Res. 2013, 21, 1326–1338. [Google Scholar] [CrossRef]
  12. Onopiuk, A.; Kołodziejczak, K.; Marcinkowska-Lesiak, M.; Poltorak, A. Determination of polycyclic aromatic hydrocarbons using different extraction methods and HPLC-FLD detection in smoked and grilled meat products. Food Chem. 2021, 373, 131506. [Google Scholar] [CrossRef]
  13. Khan, A.I. Analysis of 18 Polycyclic Aromatic Hydrocarbons in Soil Using the QuEChERS Method; Thermo Scientific: Waltham, MA, USA, 2014. [Google Scholar]
  14. Anastassiades, M.; Lehotay, S.J.; Štajnbaher, D.; Schenck, F.J. Fast and Easy Multiresidue Method Employing Acetonitrile Extraction/Partitioning and “Dispersive Solid-Phase Extraction” for. J. AOAC Int. 2003, 86, 412–431. [Google Scholar] [CrossRef]
  15. Harwach Scientific. Characteristics of the QuEChERS Method. 2019. Available online: https://www.hawachquechers.com/news/characteristics-of-the-quechers-method/ (accessed on 7 April 2023).
  16. Llompart, M.; Garcia-Jares, C.; Celeiro, M.; Dagnac, T. Extraction|Microwave-Assisted Extraction. In Encyclopedia of Analytical Science; Elsevier: Amsterdam, The Netherlands, 2019; pp. 67–77. [Google Scholar] [CrossRef]
  17. de Castro, M.L.; Priego-Capote, F. Soxhlet extraction: Past and present panacea. J. Chromatogr. A 2010, 1217, 2383–2389. [Google Scholar] [CrossRef]
  18. Adeniji, A.O.; Okoh, O.O.; Okoh, A.I. Analytical Methods for Polycyclic Aromatic Hydrocarbons and their Global Trend of Distribution in Water and Sediment: A Review. In Recent Insights in Petroleum Science and Engineering; InTech: London, UK, 2018. [Google Scholar] [CrossRef]
  19. Oluseyi, T.; Olayinka, K.; Alo, B.; Smith, R. Improved Analytical Extraction and Clean-up Techniques for the Determination of PAHs in Contaminated Soil Samples. Int. J. Environ. Res. 2011, 5, 681–690. [Google Scholar] [CrossRef]
  20. Coker, A.K. Method 3546: Microwave Extraction, part of Test Methods for Evaluation; United States Environmental Protection Agency: Washington, DC, USA, 2007; pp. 1–13.
  21. SANAS. SANAS TR 26-3, Criteria for Validation of Methods Used by Chemical Laboratories; SANAS: Palo Alto, CA, USA, 2017; pp. 1–25. [Google Scholar]
  22. Hinshaw, J.V. Upgrading gas chromatography: This month in “GC Connections”, John Hinshaw discusses issues that can arise when deciding to upgrade or replace gas chromatography technologies. LC-GC N. Am. 2010, 28, 34–39. Available online: https://go.gale.com/ps/i.do?p=AONE&sw=w&issn=15275949&v=2.1&it=r&id=GALE%7CA219898024&sid=googleScholar&linkaccess=fulltext (accessed on 7 September 2022).
  23. Ncube, S.; Madikizela, L.; Cukrowska, E.; Chimuka, L. Recent advances in the adsorbents for isolation of polycyclic aromatic hydrocarbons (PAHs) from environmental sample solutions. TrAC Trends Anal. Chem. 2018, 99, 101–116. [Google Scholar] [CrossRef]
  24. Scaramboni, C.; Neris, J.B.; Nascimento, R.d.K.S.D.; da Rosa, N.L.C.; Carvalho, J.S.; Grosseli, G.M.; Campos, M.L.A.M.; Fadini, P.S.; Urban, R.C. Optimization of a Low Volume Extraction Method to Determine Polycyclic Aromatic Hydrocarbons in Aerosol Samples. Front. Environ. Sci. 2021, 9, 742251. [Google Scholar] [CrossRef]
  25. Banjoo, D.R.; Nelson, P.K. Improved ultrasonic extraction procedure for the determination of polycyclic aromatic hydrocarbons in sediments. J. Chromatogr. A 2005, 1066, 9–18. [Google Scholar] [CrossRef]
  26. Aydin, M.E.; Ozcan, S.; Tor, A. Ultrasonic Solvent Extraction of Persistent Organic Pollutants from Airborne Particles. CLEAN-Soil Air Water 2007, 35, 660–668. [Google Scholar] [CrossRef]
  27. Fecher, P.A.; Schlemmer, G.C.; Schoeberl, K.S. Safety Aspects, Quality Control, and Quality Assurance using Microwave-Assisted Sample Preparation Systems. In Microwave-Assisted Sample Preparation for Trace Element Determination; Elsevier: Amsterdam, The Netherlands, 2014; pp. 345–384. [Google Scholar] [CrossRef]
  28. Sánchez-Uría, J.E.; Del Castillo-Busto, E. Analytical performance of microwave-assisted solvent extraction (MASE) for the routine determination of pahs in polluted soils by gas chromatographic-mass spectrometry (GC-MS). Rev. Int. Contam Ambient. 2018, 34, 355–366. [Google Scholar] [CrossRef]
  29. Steiner, D.; Krska, R.; Malachová, A.; Taschl, I.; Sulyok, M. Evaluation of Matrix Effects and Extraction Efficiencies of LC–MS/MS Methods as the Essential Part for Proper Validation of Multiclass Contaminants in Complex Feed. J. Agric. Food Chem. 2020, 68, 3868–3880. [Google Scholar] [CrossRef]
  30. Wang, W.; Zhang, Y.; Du, W.; Tao, S. Water-induced release of recalcitrant polycyclic aromatic hydrocarbons from soil organic matter during microwave-assisted solvent extraction. Environ. Pollut. 2021, 284, 117493. [Google Scholar] [CrossRef]
  31. Ozcan, S.; Tor, A.; Aydin, M.E. Determination of Polycyclic Aromatic Hydrocarbons in Soil by Miniaturized Ultrasonic Extraction and Gas Chromatography-Mass Selective Detection. CLEAN-Soil Air Water 2009, 37, 811–817. [Google Scholar] [CrossRef]
  32. Lucas, J.; Percelay, I.; Larcher, T.; Lefrançois, C. Effects of pyrolytic and petrogenic polycyclic aromatic hydrocarbons on swimming and metabolic performance of zebrafish contaminated by ingestion. Ecotoxicol. Environ. Saf. 2016, 132, 145–152. [Google Scholar] [CrossRef]
  33. Jorfi, S.; Rezaee, A.; Moheb-Ali, G.-A.; Jaafarzadeh, N.A. Pyrene removal from contaminated soils by modified Fenton oxidation using iron nano particles. J. Environ. Health Sci. Eng. 2013, 11, 17. [Google Scholar] [CrossRef]
  34. Dąbrowska, H.; Dąbrowski, Ł.; Biziuk, M.; Gaca, J.; Namieśnik, J. Solid-phase extraction clean-up of soil and sediment extracts for the determination of various types of pollutants in a single run. J. Chromatogr. A 2003, 1003, 29–42. [Google Scholar] [CrossRef]
  35. DWWW. Darvill Wastewater Works; Darvill Waste Water Treatment Site: Pietermaritzburg, South Africa, 2013; pp. 345–353. [Google Scholar]
  36. Munyengabe, A.; Mambanda, A.; Moodley, B. Polycyclic Aromatic Hydrocarbons in Water, Soils and Surface Sediments of the Msunduzi River. J. Environ. Anal. Chem. 2017, 4, 1–13. [Google Scholar] [CrossRef]
  37. Edokpayi, J.N.; Odiyo, J.O.; Popoola, O.E.; Msagati, T.A.M. Determination and Distribution of Polycyclic Aromatic Hydrocarbons in Rivers, Sediments and Wastewater Effluents in Vhembe District, South Africa. Int. J. Environ. Res. Public Health 2016, 13, 387. [Google Scholar] [CrossRef] [PubMed]
  38. Adeniji, A.O.; Okoh, O.O.; Okoh, A.I. Levels of Polycyclic Aromatic Hydrocarbons in the Water and Sediment of Buffalo River Estuary, South Africa and Their Health Risk Assessment. Arch. Environ. Contam. Toxicol. 2019, 76, 657–669. [Google Scholar] [CrossRef]
  39. Asagbra, M.; Adebayo, A.; Anumudu, C.; Ugwumba, O.; Ugwumba, A. Polycyclic aromatic hydrocarbons in water, sediment and fish from the Warri River at Ubeji, Niger Delta, Nigeria. Afr. J. Aquat. Sci. 2015, 40, 193–199. [Google Scholar] [CrossRef]
  40. Jaward, F.M.; Alegria, H.A.; Reyes, J.G.G.; Hoare, A. Levels of PAHs in the Waters, Sediments, and Shrimps of Estero de Urias, an Estuary in Mexico, and Their Toxicological Effects. Sci. World J. 2012, 2012, 687034. [Google Scholar] [CrossRef]
  41. Zhang, Y.; Peng, C.; Guo, Z.; Xiao, X.; Xiao, R. Polycyclic aromatic hydrocarbons in urban soils of China: Distribution, influencing factors, health risk and regression prediction. Environ. Pollut. 2019, 254, 112930. [Google Scholar] [CrossRef]
  42. Hua, L.; Wu, W.-X.; Liu, Y.-X.; Tientchen, C.; Chen, Y.-X. Heavy Metals and PAHs in Sewage Sludge from Twelve Wastewater Treatment Plants in Zhejiang Province. Biomed. Environ. Sci. 2008, 21, 345–352. [Google Scholar] [CrossRef] [PubMed]
  43. Wu, Q.; Liu, Z.; Liang, J.; Kuo, D.T.F.; Chen, S.; Hu, X.; Deng, M.; Zhang, H.; Lu, Y. Assessing pollution and risk of polycyclic aromatic hydrocarbons in sewage sludge from wastewater treatment plants in China’s top coal-producing region. Environ. Monit. Assess. 2019, 191, 102. [Google Scholar] [CrossRef]
  44. Torretta, V.; Katsoyiannis, A. Occurrence of polycyclic aromatic hydrocarbons in sludges from different stages of a wastewater treatment plant in Italy. Environ. Technol. 2013, 34, 937–943. [Google Scholar] [CrossRef]
  45. Montuori, P.; De Rosa, E.; Di Duca, F.; Provvisiero, D.P.; Sarnacchiaro, P.; Nardone, A.; Triassi, M. Estimation of Polycyclic Aromatic Hydrocarbons Pollution in Mediterranean Sea from Volturno River, Southern Italy: Distribution, Risk Assessment and Loads. Int. J. Environ. Res. Public Health 2021, 18, 1383. [Google Scholar] [CrossRef] [PubMed]
  46. Mohseni-Bandpei, A.; Majlesi, M.; Rafiee, M.; Nojavan, S.; Nowrouz, P.; Zolfagharpour, H. Polycyclic aromatic hydrocarbons (PAHs) formation during the fast pyrolysis of hazardous health-care waste. Chemosphere 2019, 227, 277–288. [Google Scholar] [CrossRef] [PubMed]
  47. Howard, I.C.; Okpara, K.E.; Techato, K. Toxicity and Risks Assessment of Polycyclic Aromatic Hydrocarbons in River Bed Sediments of an Artisanal Crude Oil Refining Area in the Niger Delta, Nigeria. Water 2021, 13, 3295. [Google Scholar] [CrossRef]
  48. Bandowe, B.A.M.; Shukurov, N.; Leimer, S.; Kersten, M.; Steinberger, Y.; Wilcke, W. Polycyclic aromatic hydrocarbons (PAHs) in soils of an industrial area in semi-arid Uzbekistan: Spatial distribution, relationship with trace metals and risk assessment. Environ. Geochem. Health 2021, 43, 4847–4861. [Google Scholar] [CrossRef] [PubMed]
  49. CCME. Carcinogenic and Other Polycyclic Aromatic Hydrocarbons; CCME: Winnipeg, MB, Canada, 2010.
  50. IARC. List of Classifications by Cancer Sites with Sufficient or Limited Evidence in Humans, Volumes 1 to 113 * Cancer Site Carcinogenic Agents with Sufficient Evidence in Humans Agents with Limited Evidence in Humans Lip, Oral Cavity, and Pharynx List of Cl. 2020:1-12. Available online: https://monographs.iarc.fr/agents-classified-by-the-iarc/ (accessed on 15 November 2022).
  51. NYSDOH. Public Health Assessment Hopewell Precision Area Contamination; New York State Department of Health: New York, NY, USA, 2007.
  52. World Data Info. Average Height of Men and Women Worldwide. World Data Info. 2019. Available online: https://www.worlddata.info/average-bodyheight.php (accessed on 18 August 2022).
  53. Macrotrends. South Africa Life Expectancy, 1950–2020. 2020. Available online: https://www.macrotrends.net/countries/ZAF/south-africa/life-expectancy (accessed on 18 August 2022).
  54. Magubane, T. Msunduzi River Being Flushed ahead of Dusi Marathon. Mercury News. 2022. Available online: https://www.iol.co.za/mercury/news/msunduzi-river-being-flushed-ahead-of-dusi-marathon-8d1fb7ef-782b-4064-9b1b-0b925c0e9bba (accessed on 18 August 2022).
Figure 1. Graphic maps showing the location of the 5 sampling points (CD, CR, YMCA, WH and BS) along uMsunduzi river (a) and the 2 sampling points (7A and 14A) in Darvill WWW landfill (b) used for sludge disposal.
Applsci 13 05619 g001
Figure 2. Effect of extraction solvent on PAHs %recovery using UE (n = 5).
Applsci 13 05619 g002
Figure 3. Effect of the extraction solvent volume on the PAH’s %recovery using UE (n = 5).
Applsci 13 05619 g003
Figure 4. Effect of extraction time on the PAH’s %recovery using UE (n = 5).
Applsci 13 05619 g004
Figure 5. Efficiency of different extraction solvents using MAE (n = 5).
Applsci 13 05619 g005
Figure 6. Concentrations of PAHs in uMsunduzi river sediments.
Applsci 13 05619 g006
Figure 7. Concentrations of PAHs in Darvill sludge landfill.
Applsci 13 05619 g007
Table 1. Recoveries, LOD and LOQ for MAE and UE, and correlation coefficient R2.
PAH Compound (n = 5)LOD (µg/kg)LOQ (µg/kg)%Recovery ± %RSDR2 Values
MAEUEMAEUEMAEUE
Naphthalene0.1620.0950.4340.24592.3 ± 0.04121 ± 0.020.9992
Acenaphthylene0.1130.0510.3230.13698.1 ± 0.0397.2 ± 0.010.9970
Acenaphthene0.0340.1450.0800.39498.1 ± 0.01107 ± 0.040.9969
Fluorene0.7620.0841.2380.23488.4 ± 0.21 96.7 ± 0.020.9969
Phenanthrene1.2110.9603.5361.259101 ± 0.3394.9 ± 0.02 0.9988
Anthracene0.1380.0190.3100.049113 ± 0.2196.1 ± 0.0040.9970
Fluoranthene0.9640.0932.7950.26679.1 ± 0.2693.7 ± 0.020.9991
Pyrene0.9680.0912.8140.25981.9 ± 0.2693.9 ± 0.020.9993
Benzo(k)fluoranthene0.0580.1830.1180.54681.3 ± 0.2996.0 ± 0.050.9982
Benzo(ghi)perylene0.0250.2150.4450.64287.9 ± 0.2696.6 ± 0.060.9989
Dibenz(a,h)anthracene0.0620.1270.2450.382122 ± 0.13118 ± 0.040.9977
Table 2. Diagnostic ratios.
Sampling PointCDCRWHBS14A7A
Fl/(Fl + Py)0.450.470.450.450.460.45
LMW/HMW0.290.290.430.370.300.21
Table 3. Min, max, average concentrations, ERL, ERM, TEQ and MEQ.
PAHsMin Concentration Max
Concentration
MeanERLERMTEFMEF∑TEQ∑MEQTotal %PAHs
Naphthalene96.013810997.01010.001-0.49-3.52
Acenaphthylene1122131401131170.001-0.64-4.60
Acenaphthelene1724132481762030.001-1.01-7.22
Anthracenendndndndnd0.01-16.0-11.4
Fluoranthenendndndndnd0.001-2.99-21.4
Pyrene2414463582773720.001-3.59-25.7
Benzo(k)fluoranthenend7877386797610.10.1166.072.64.72
Benzo(ghi)perylene7819268808159070.010.1911.51808.20
Dibenz(ah)antharacene18622921219322210.29185043413.2
Disclaimer/Publisher’s Note: The statements, opinions and data contained in all publications are solely those of the individual author(s) and contributor(s) and not of MDPI and/or the editor(s). MDPI and/or the editor(s) disclaim responsibility for any injury to people or property resulting from any ideas, methods, instructions or products referred to in the content.

