Article

Experimental Investigations on the Deformation and Breakup of Hundred-Micron Droplet Driven by Shock Wave

1
Department of Fluid Engineering, Zhejiang University of Science and Technology, Hangzhou 310018, China
2
National Key Laboratory of Shock Wave and Detonation Physics, Institute of Fluid Physics, China Academy of Engineering Physics, Mianyang 621900, China
*
Author to whom correspondence should be addressed.
Appl. Sci. 2023, 13(9), 5555; https://doi.org/10.3390/app13095555
Submission received: 24 March 2023 / Revised: 20 April 2023 / Accepted: 28 April 2023 / Published: 29 April 2023

Abstract

:
This study examines the process of a 240 µm droplet breakup under a shock wave through experiments using a double-pulse laser holographic test technique on a shock tube. The technique allowed for high-resolution data to be obtained at the micron-nanosecond level, including the Weber number distribution of deformation and breakup modes for droplets of different sizes and loads. Results were compared with larger droplets at the same Weber number, revealing that higher Weber numbers result in more difficulty in droplet breakup, longer deformation times, and increased deformation behavior. At low Weber numbers within the critical range, changes in droplet diameter affect the Rayleigh–Taylor waves and alter the droplet’s characteristics. The study also investigates the laws and reasons behind windward displacement variation for hundred-micron droplets at different Weber numbers over time.

1. Introduction

The deformation and breakup of droplets under the action of shock waves are classical multiphase hydrodynamic phenomena, which hold significant practical applications and research value across various fields. As hypersonic vehicles continue to operate at increasingly high speeds, the demand for high-performance propulsion systems has surged. The combustion chamber of these systems, such as the scramjet, is afflicted by complex interactions between shock waves and fuel droplets, ultimately influencing engine performance [1]. Therefore, conducting an in-depth study of the breakup behavior under shock wave exposure and deciphering its underlying physical mechanism is critical for realizing its engineering potential.
Since the 1950s, researchers have theoretically, experimentally, and numerically studied the droplet deformation and breakup process. Hinze [2] examined the deformation and breakup behavior of individual droplets subjected to gas flow, emphasizing the crucial role of the Weber number (We) in droplet deformation and breakup. Subsequent experiments have revealed a wide range of droplet breakup modes. Pilch et al. [3] and Guildenbecher et al. [4] summarized the various droplet breakup modes and classified them into five categories: vibrational, bag, bag-and-stamen, stripping, and catastrophic breakup. According to Theofanous et al. [5,6,7,8], the primary factor affecting is Rayleigh–Taylor instability (R–T instability) when We < 102. In contrast, when We > 103, Kelvin–Helmholtz instability (K–H instability) emerges as a crucial factor determining droplet breakup. When 102 < We < 103, droplet breakup results from the combination of R–T instability and K–H instability. Boiko [9] proposed a method for determining aerodynamic drag based on the body velocity-relaxation parameter behind a shock wave. In some typical flow-free-body interaction scenarios that consider droplet deformation, the analytical form of the motion function was discovered. Xiong et al. [10] investigated the relationship between millimeter-sized droplet displacement in the gas flow direction and lateral deformation and time under high-speed gas flow induction with high-speed shadowgraph systems. They discovered that an increase in interfacial tension prevents droplet deformation and breakup, while gas–liquid density ratios have the opposite effect. Shi et al. [11] employed high-speed schlieren systems to capture the deformation and breakup characteristics of submillimeter droplets under supersonic conditions. Additionally, they analyzed the spatial–temporal relationships of droplet motion parameters. Shen et al. [12] recorded droplet deformation behavior induced by shock waves using high-speed shadowgraph systems. They observed that, in cases where there is a wide range of interacting inertia, the rate of droplet deformation is reduced due to the additional viscous forces provided by viscosity.
As computational fluid dynamics and numerical simulation methods have advanced, it has become possible to obtain the pressure distribution and velocity distribution around liquid droplets. Fakhari et al. [13] conducted two-dimensional numerical simulations of droplet deformation and breakup modes using the Lattice Boltzmann method. They found that increasing the Reynolds or Weber number resulted in greater droplet deformation and breakup. Yu [14], Meng [15,16], and Jalaal [17] successively demonstrated that the pressure difference between the equatorial and anterior(posterior) stationary points is the main driver of droplet flattening. Thus the uneven pressure distribution on the droplet surface thereby leads to a difference in the deformation rate between the windward and leeward sides. Xiang et al. [18] performed numerical simulations to study the evolution of low-pressure regions inside droplets after their collision with shock waves. Poplavski et al. [19] used the volume of fluid (VOF) method to resolve the phase interface and the large eddy simulation (LES) model to describe turbulence. Their study included an investigation of the structure of the flow near and in the wake of a droplet, an examination of the flow features around a droplet, an analysis of the type of shape evolution, and an evaluation of the character of the mass entrainment. Bijarchi et al. [20] used the finite volume method and VOF two-phase model to numerically study the splitting of T-junction ferrofluid droplets under asymmetric Pulse–Width Modulation (PWM) magnetic fields. By utilizing the PWM magnetic field, two novel regimes of ferrofluid droplet splitting were observed for the first time: same branch flow (SBF) and double splitting (DS).
Previous investigations into droplet deformation and breakup have been limited by technology, with many stopping at sub-millimeter droplet dimensions (Shi and Shen [11,12]). However, in actual spray fields, droplet diameter ranges from 5 to 300 μm and droplet curvature increases sharply. It is unknown whether conclusions drawn from Weber number analysis can be applied. In this study, droplets with an initial diameter of 240 µm were obtained employing a pneumatic droplet generator designed. We combined shock wave-driven droplet experiments and double-pulse laser holographic testing to collect experimental data with micron-nanosecond high spatial and temporal resolution on the deformation and breakup modes of hundred-micron droplets under different loading, as well as the Weber number distribution of these breakup modes. The results of our study provide a reference for further research on the deformation and breakup behavior of hundred-micron droplets.

2. Experimental Devices and Methods

2.1. Experimental Devices

The experiments were carried out in a horizontal shock tube (Institute of Fluid Physics of China Academy of Engineering Physics, Mianyang, China). The system diagram is shown in Figure 1. The system is characterized by the following main features: (1) the cross section area of the inner cavity of the horizontal shock tube is 60 mm × 60 mm, and the total length is 4000 mm; (2) a high-pressure chamber (length 1280 mm) and a low-pressure channel (length 2220 mm) are separated by a film in the initial state; (3) a measuring section (length 500 mm) equipped with quartz windows 60 mm × 140 mm in size to carry out visualization, as well as a pneumatic droplet generator; (4) the pneumatic droplet generator is shown in Figure 2a, which consists of an end cover, generator base, gas nozzle, electric oscillator, sealing platen, fluid storage column and nozzle; (5) to prevent the influence of serial and parallel droplets on adjacent, we arranged the holes according to the pattern depicted in Figure 2b, with a spacing of 10 mm between adjacent holes, which equates to approximately 50 times the droplet diameter; (6) In the rapid recording process, dynamic spatial and temporal resolution is one of the main factors that determine the choice of recording equipment and its operation method. High-speed schlieren/shadowgraph systems cannot capture micron-level high-resolution and high-frame rate images. Moreover, these systems are subject to the defocusing phenomenon when attempting to capture the deformation and breakup of even a hundred-micron droplet, Therefore, we utilized the double-pulse laser holographic test technique to accurately record the droplets’ deformation and breakup process.
In our experiment, we employed a Beamtech dual-pulse Q-switched nanosecond laser system (Vilte-200) to generate laser light. For imaging purposes, we selected Apogee’s CCD camera (RMV-50100), possessing a resolution of 8176 × 6132 with a pixel size of 6.0 μm × 6.0 μm, and a maximum shooting frequency of 27 Hz. Static pressure signal data was collected using pressure transducers (PCB 113B26) and an oscilloscope, while shock wave speed was determined via signal interval calculations.
A high-pressure cylinder was utilized to pressurize the drive section with nitrogen gas to the desired experimental conditions. An input electrical signal triggered the digital delay generator, which then output signals A, B, C, and D. Signal A was connected to the CCD camera, which began recording upon signal reception. Signal B was connected to a double-pulse laser, releasing a first pulse to capture the initial position of the droplet and shock wave, and a second pulse to capture images of droplet deformation and breakup under the shock wave and high-speed gas flow. Signal C triggered the solenoid valve of the pneumatic droplet generator, generating droplets. Signal D activated the film-broken device, resulting in the rapid heating of the resistive wire in close contact with the film, burning off the diaphragm, and generating a shock wave. To ensure the smooth propagation of the after-shock gas flow in the shock tube, 0.02 mm, and 0.05 mm thick polypropylene films were chosen as the diaphragm material under low We and high We conditions, respectively.

2.2. Experimental Parameters

The aerodynamic force acting on the droplet’s surface, the interfacial tension between the droplet and the ambient gas, and the viscous force inside the droplet are the main factors affecting the deformation and breakup of the droplet under the action of gas flow. The Weber number We and Ohnesorge number Oh are crucial dimensionless numbers related to droplet deformation and breakup. We is the ratio of the aerodynamic force from the ambient gas and the interfacial tension, which plays a dominant role in the deformation and breakup of the droplet. And Oh relates the viscosity to the aerodynamic force and interfacial tension [2]. The equations for We and Oh are as follows:
W e = ρ g u g 2 d 0 σ
O h = μ l ρ l σ d 0
where d0 is the initial droplet diameter, σ is the interfacial tension, ug is the gas velocity behind the wave, ρg is the gas density behind the wave, μl is the dynamic viscosity of the droplet, and ρl is the droplet density.
The diameter of the water droplets generated by the pneumatic droplet generator is around 240 μm. The diameter error between different droplets is less than 5% due to the inherent error of the pixel dot size. The relative errors of both gas velocity and density were less than 1% (averaged over multiple calculations). The table of relevant parameters of the experiment is shown in Table 1.
In the definition of thermodynamic or aerodynamic parameters, which involve temperature or temperature-dependent physical quantities, the temperature before the shock wave is usually used to define them. Therefore, for the temperature-dependent physical quantities involved in calculating We and Oh, the temperature before the shock wave, which is the ambient temperature, is used. As a result, the dynamic viscosity of the droplet is 1.00160 × 10⁻³ Pa·s, the density of the liquid droplet is 997.07 kg/m3 and the interfacial tension is 0.0728 N/m (at a temperature of 293.2 K and a pressure of 101,325 Pa). When Oh is low enough (Oh < 0.1), the viscous force inside the droplet can be ignored, and We is the main parameter dominating droplet breakup [21].

2.3. Image Post-Processing

Figure 3 depicts a typical unprocessed hologram captured by a CCD camera. In Figure 3a, the composite image at time t1 was recorded by the first pulse signal, and the image at time t2 was recorded by the second pulse signal. Figure 3a presents 18 rows of droplets in pairs. The droplet on the left was recorded in the image at time t1, while the right droplet after deformation and breakup was recorded in the image at time t2, as depicted in Figure 3b. The moment when the shock wave meets the leftmost droplet is set to moment 0. Ti, at which the i-th column of droplets is located, can be obtained from Equation (3), xi is the distance between the windward side of the i-th column of droplets and the shock wave, and us is the speed of the shock wave that can be obtained from the oscilloscope. With this approach, one can obtain the moment of each column of droplets in the t2 image.
T i = x i u s
Post-processing of holograms is carried out to eliminate interference caused by factors such as image noise. Figure 4a–c depicts the Static flow field holographic image, broken flow field holographic image, and post-processing holographic image, respectively.

3. Results and Discussion

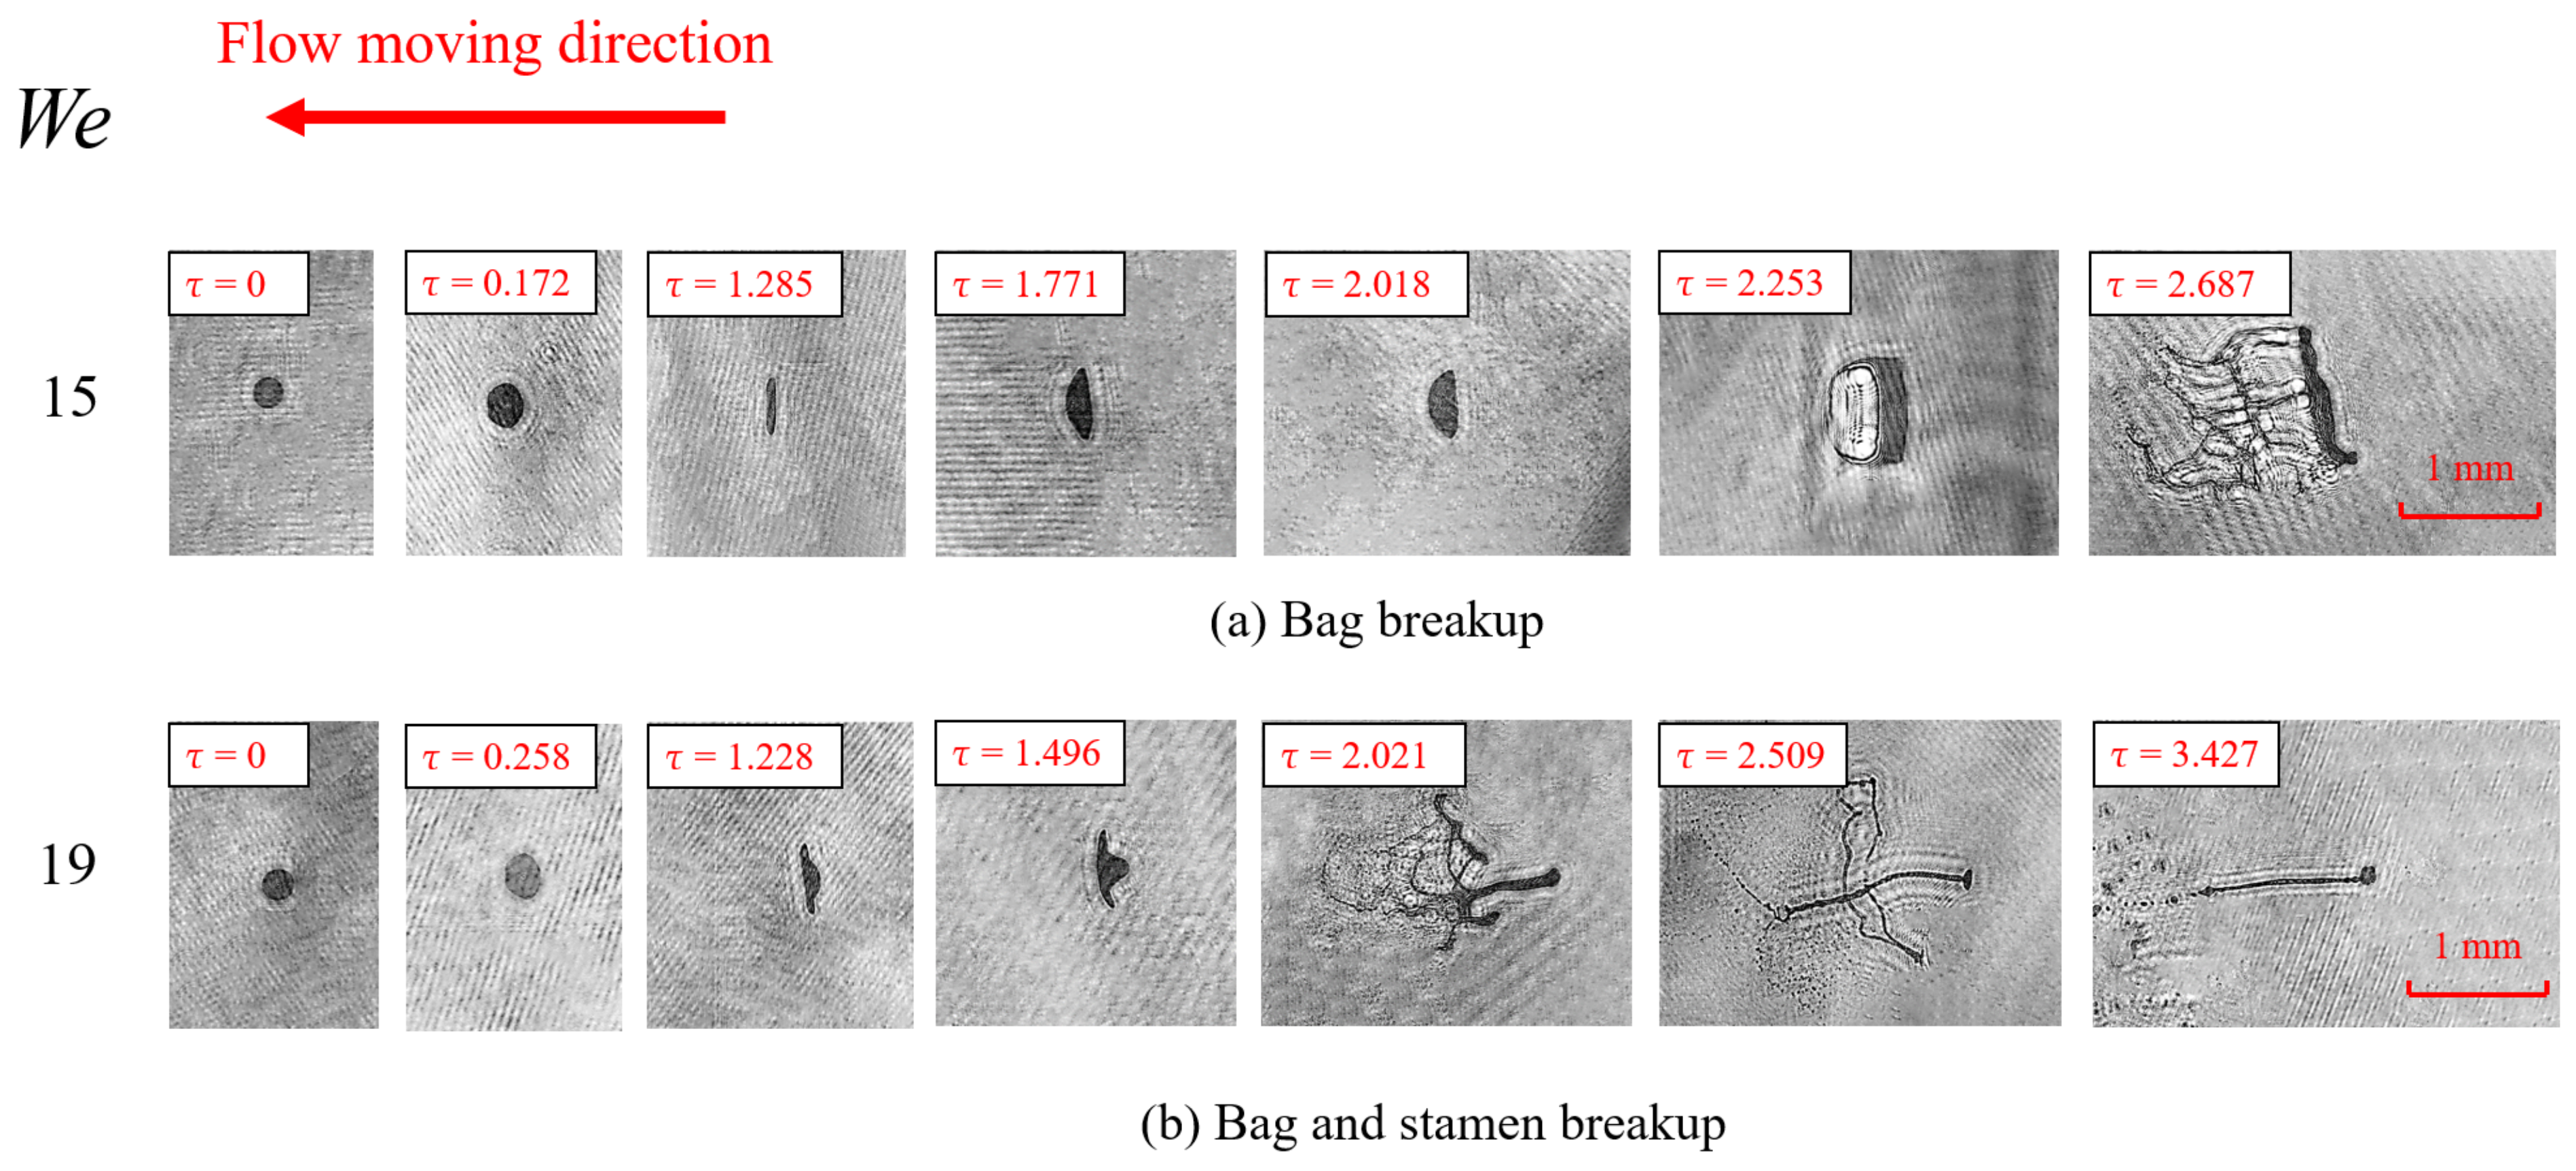
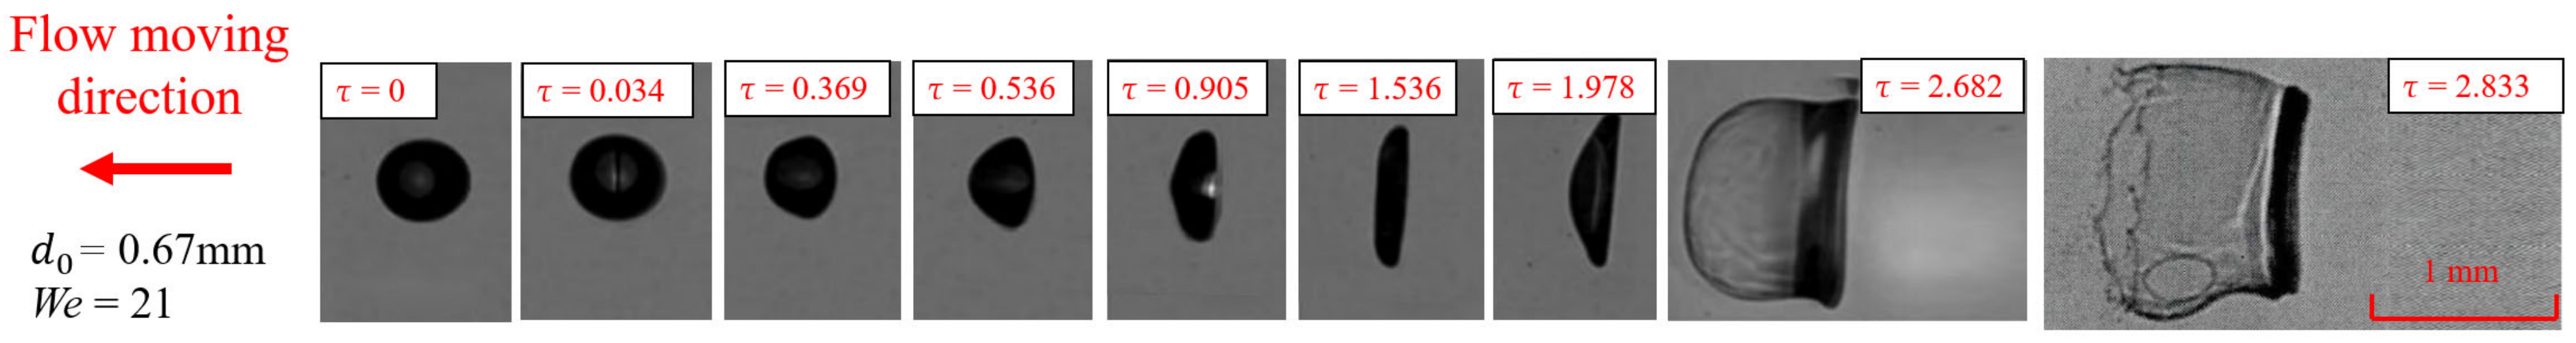
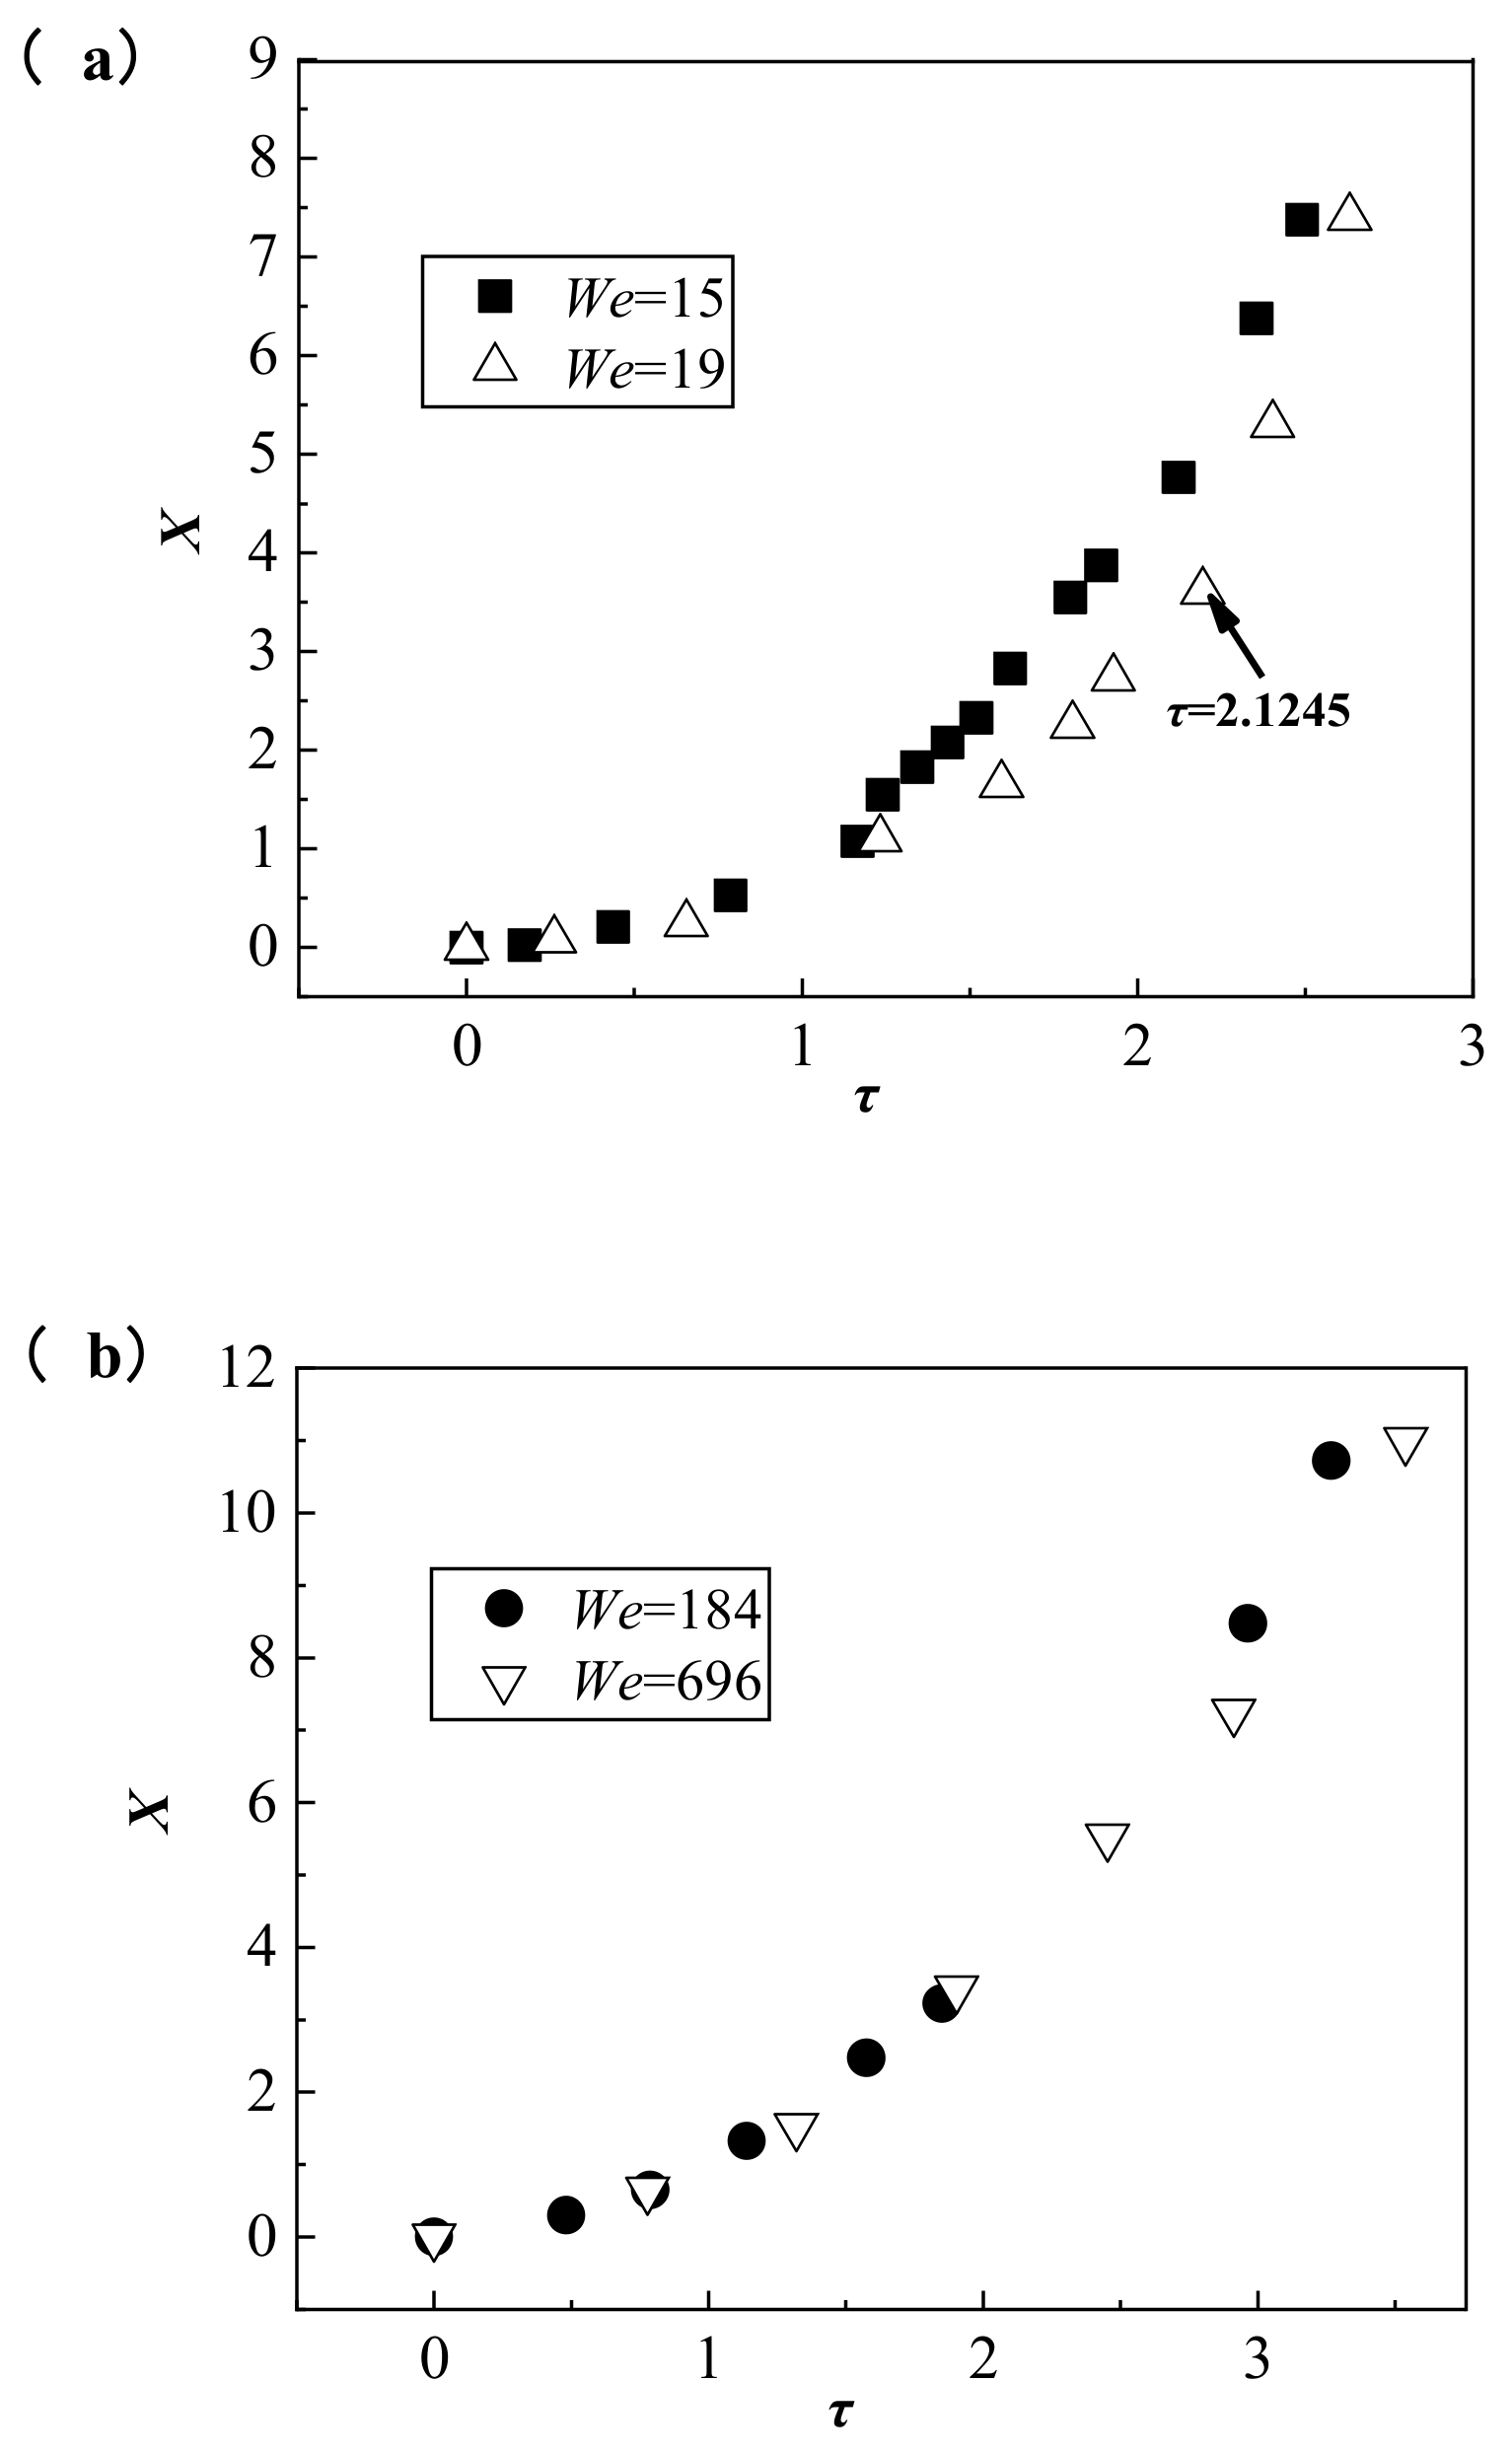
3.1. The Low Weber Number Conditions

To eliminate the effects of droplet size, gas velocity/density, and droplet density, the dimensionless treatment of the droplet break-up time is shown in Equation (4):
τ = t u g d 0 ρ g / ρ l
where τ is the dimensionless time, t is the dimensional time, ug is the gas velocity behind the wave, d0 is the initial droplet diameter, and ρg/ρl is the ambient-to-droplet density ratio.
As shown in Figure 5a, at We = 15, the non-uniform pressure distribution leads to an initial droplet deformation due to the acceleration of the ambient fluid around the droplet (τ = 0~1.285). The aforementioned deformation is resisted by interfacial tension, and the droplet ultimately adopts a disk-like morphology (τ = 1.285). The droplets subsequently undergo the breakup process due to the action of aerodynamic forces (τ = 1.285~2.687). As the gas flows through the droplet, it forms a hysteresis point on both the front and back surfaces, where a maximum velocity surrounds the droplet. Following the formation of the bag, expansion of the bag and the liquid ring occurs due to the pressure exerted upon them by the high-pressure stagnation inside the bag. The growth process of the bag corresponds to the development of R–T instability on the droplet surface.
In Figure 5b, it can be observed that at We = 19, the droplet experiences bag and stamen breakup. In a study by Zhao [22], the morphology of the bag, and bag and stamen breakup, were observed and analyzed. The results indicated the transition We between bag breakup, and bag and stamen breakup, was 16 while Oh tended to 0. The transition We in this experiment was 15 < We < 19, which is consistent with the range of We observed in Zhao’s study. Throughout the bag and stamen breakup process, an initial perturbation was formed on the droplet surface by R–T instability, which subsequently evolved into a stamen structure (τ = 0~1.228). The stamens are not in the droplet center during bag growth, which leads to different growth rates in different parts of the bag. During bag and stamen breakup, the stamens gradually become core droplets (τ = 1.228~2.021). The upper and lower edges of the initial droplet are pulled out into pockets, which indicates the presence of two R–T waves, and in this mechanism, droplet deformation leads to internal flow from the poles to the equator. At the time of bag breakup, the interfacial tension is sufficient to resist this flow, resulting in the formation of a ring. However, as the rate of deformation increases, the interfacial tension is insufficient, and the droplets continue to elongate, reaching a critical point. Eventually, the edges of the droplets become particularly thin, and the plume droplets lose their liquid film connection with the nucleus and are carried away by the ambient gas flow, leaving only the nucleus portion to continue moving in the direction of the gas flow(τ = 2.021~3.427).
To further understand the effect of droplet diameter on deformation and breakup at identical We, we compared the submillimeter droplet images captured by Shi [11] with our own experimental images, as illustrated in Figure 6. When droplets were subjected to close We, the submillimeter droplets did not undergo bag and stamen breakup, but bag breakup. This suggests that the reduction in droplet diameter at the same We alters the breakup mode and typical characteristics of the droplets. Our analysis indicates that, holding We constant, and decreasing the droplet diameter leads to an increase in the number of R–T waves, ultimately resulting in a change in droplet breakup mode. It is worth mentioning that this conclusion applies only to the We = 19 condition. In the We = 184 and We = 696 conditions, decreasing the droplet diameter did not change the droplet’s breakup mode and typical characteristics. This is because We = 19 is in the transition range from bag breakup to bag and stamen breakup.

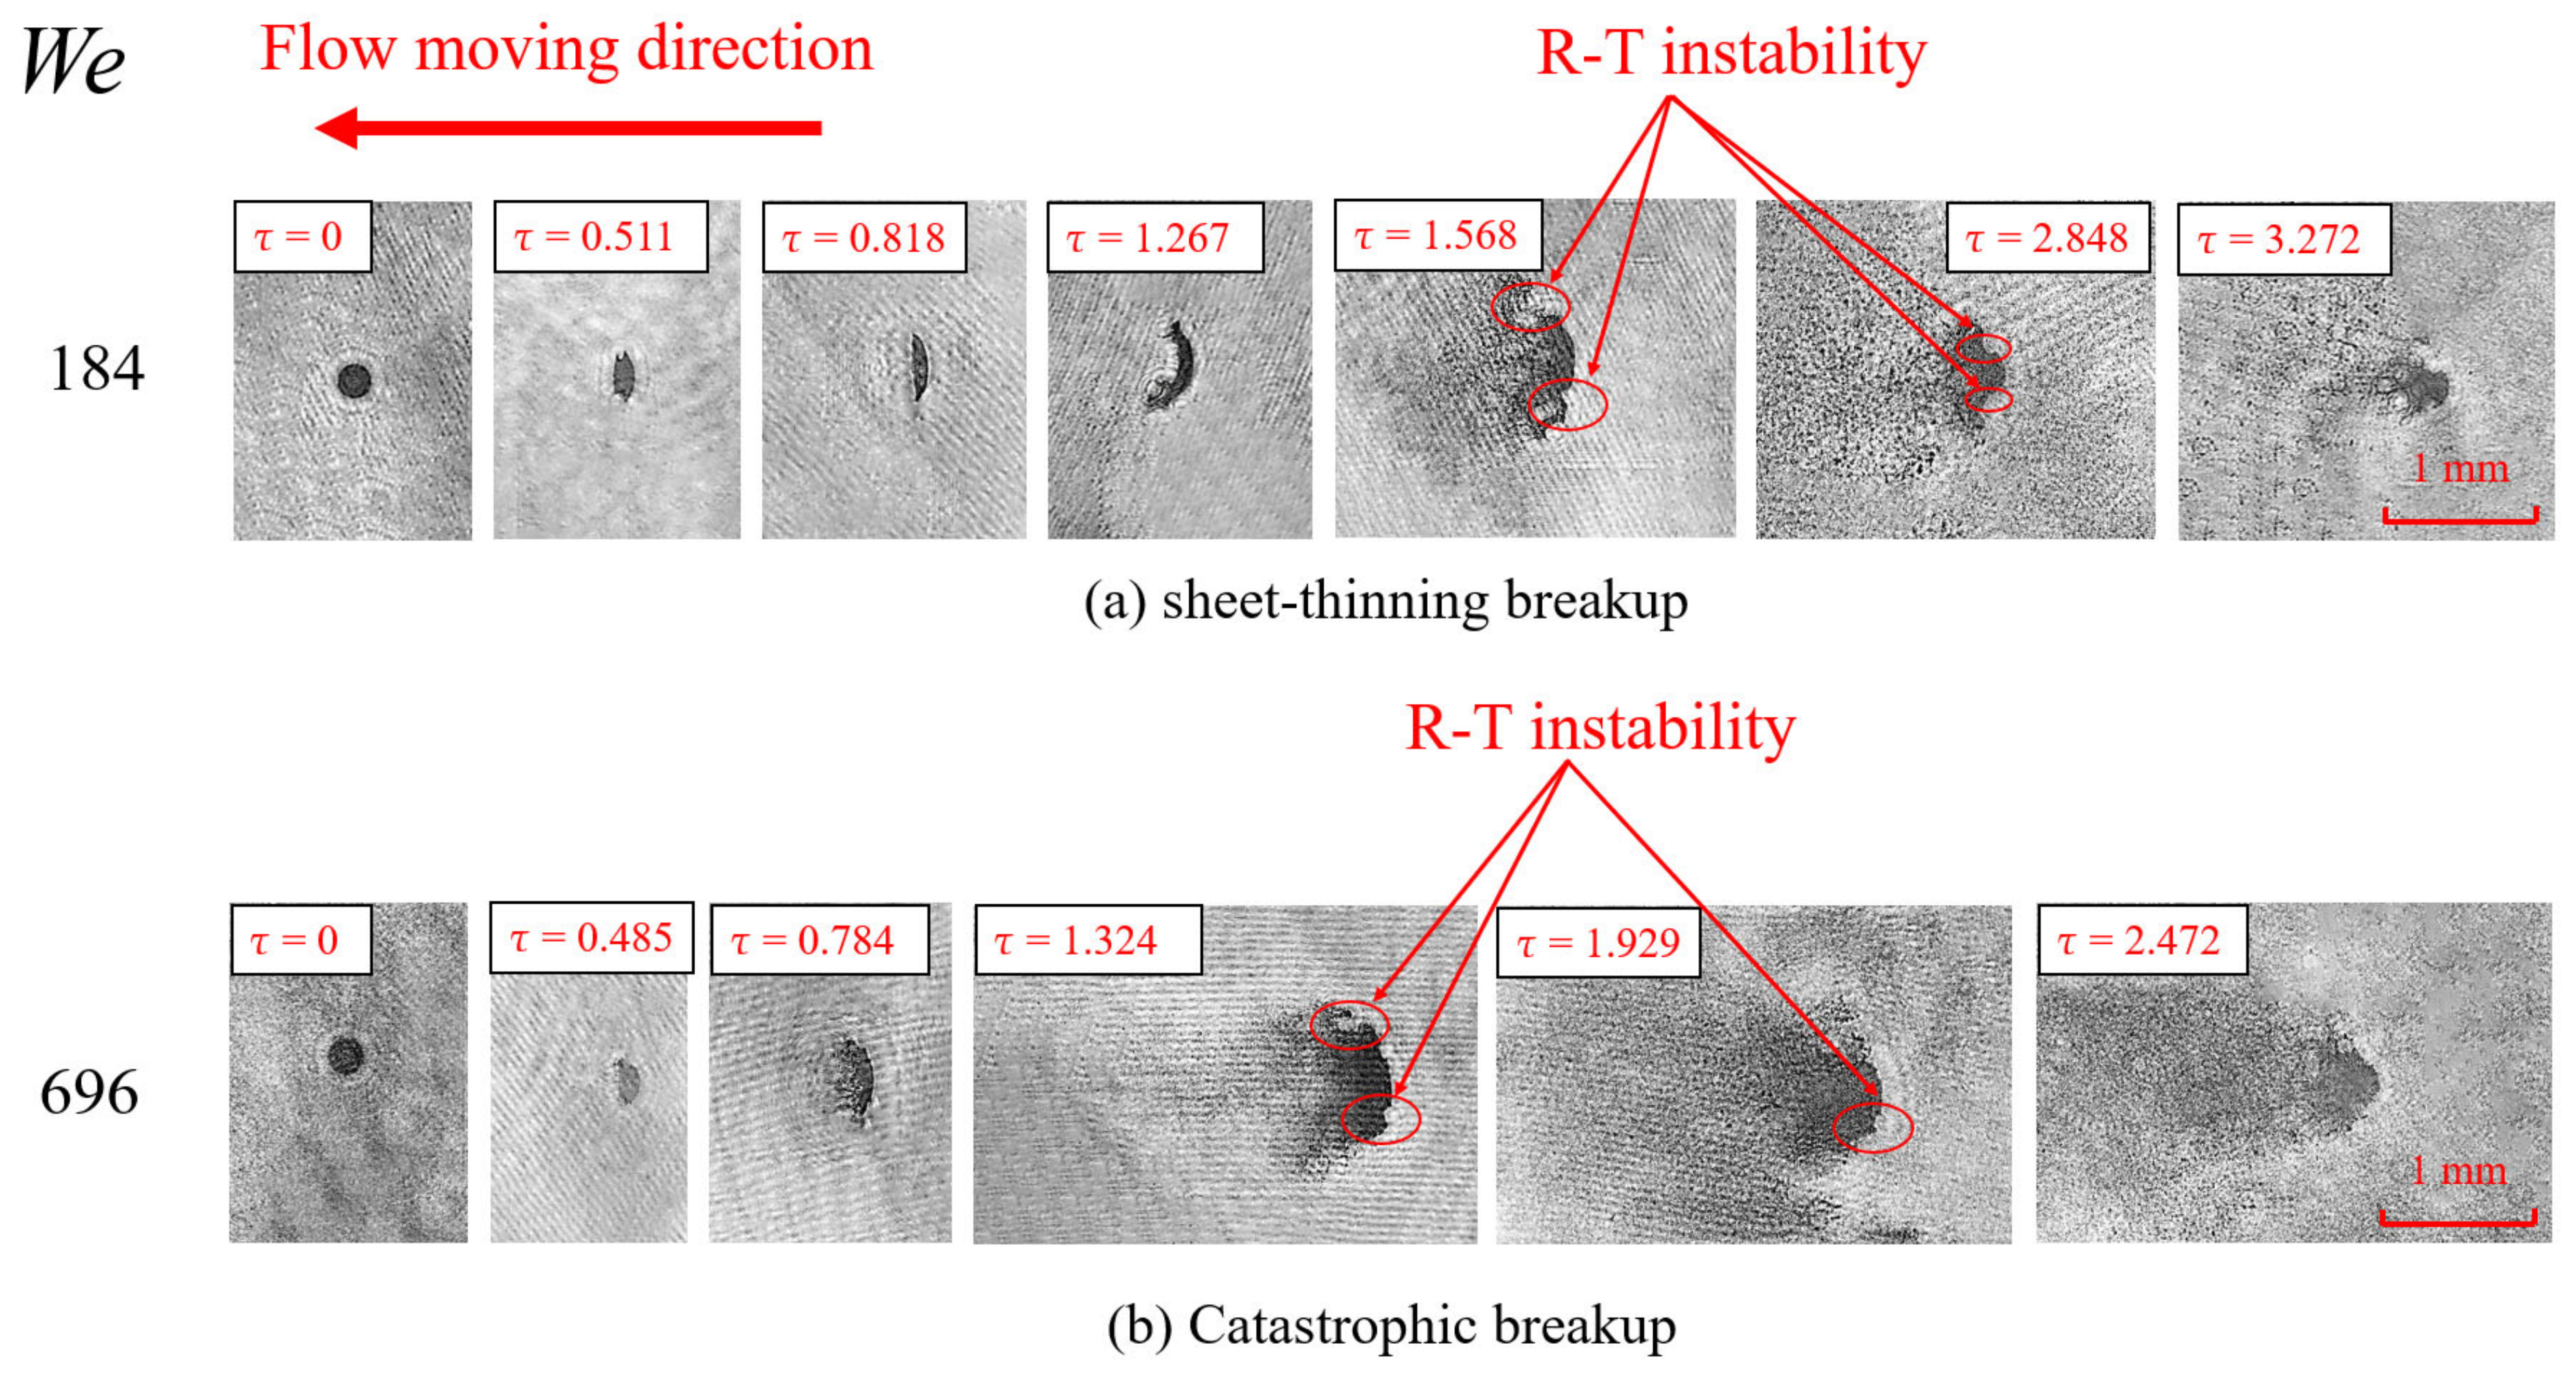
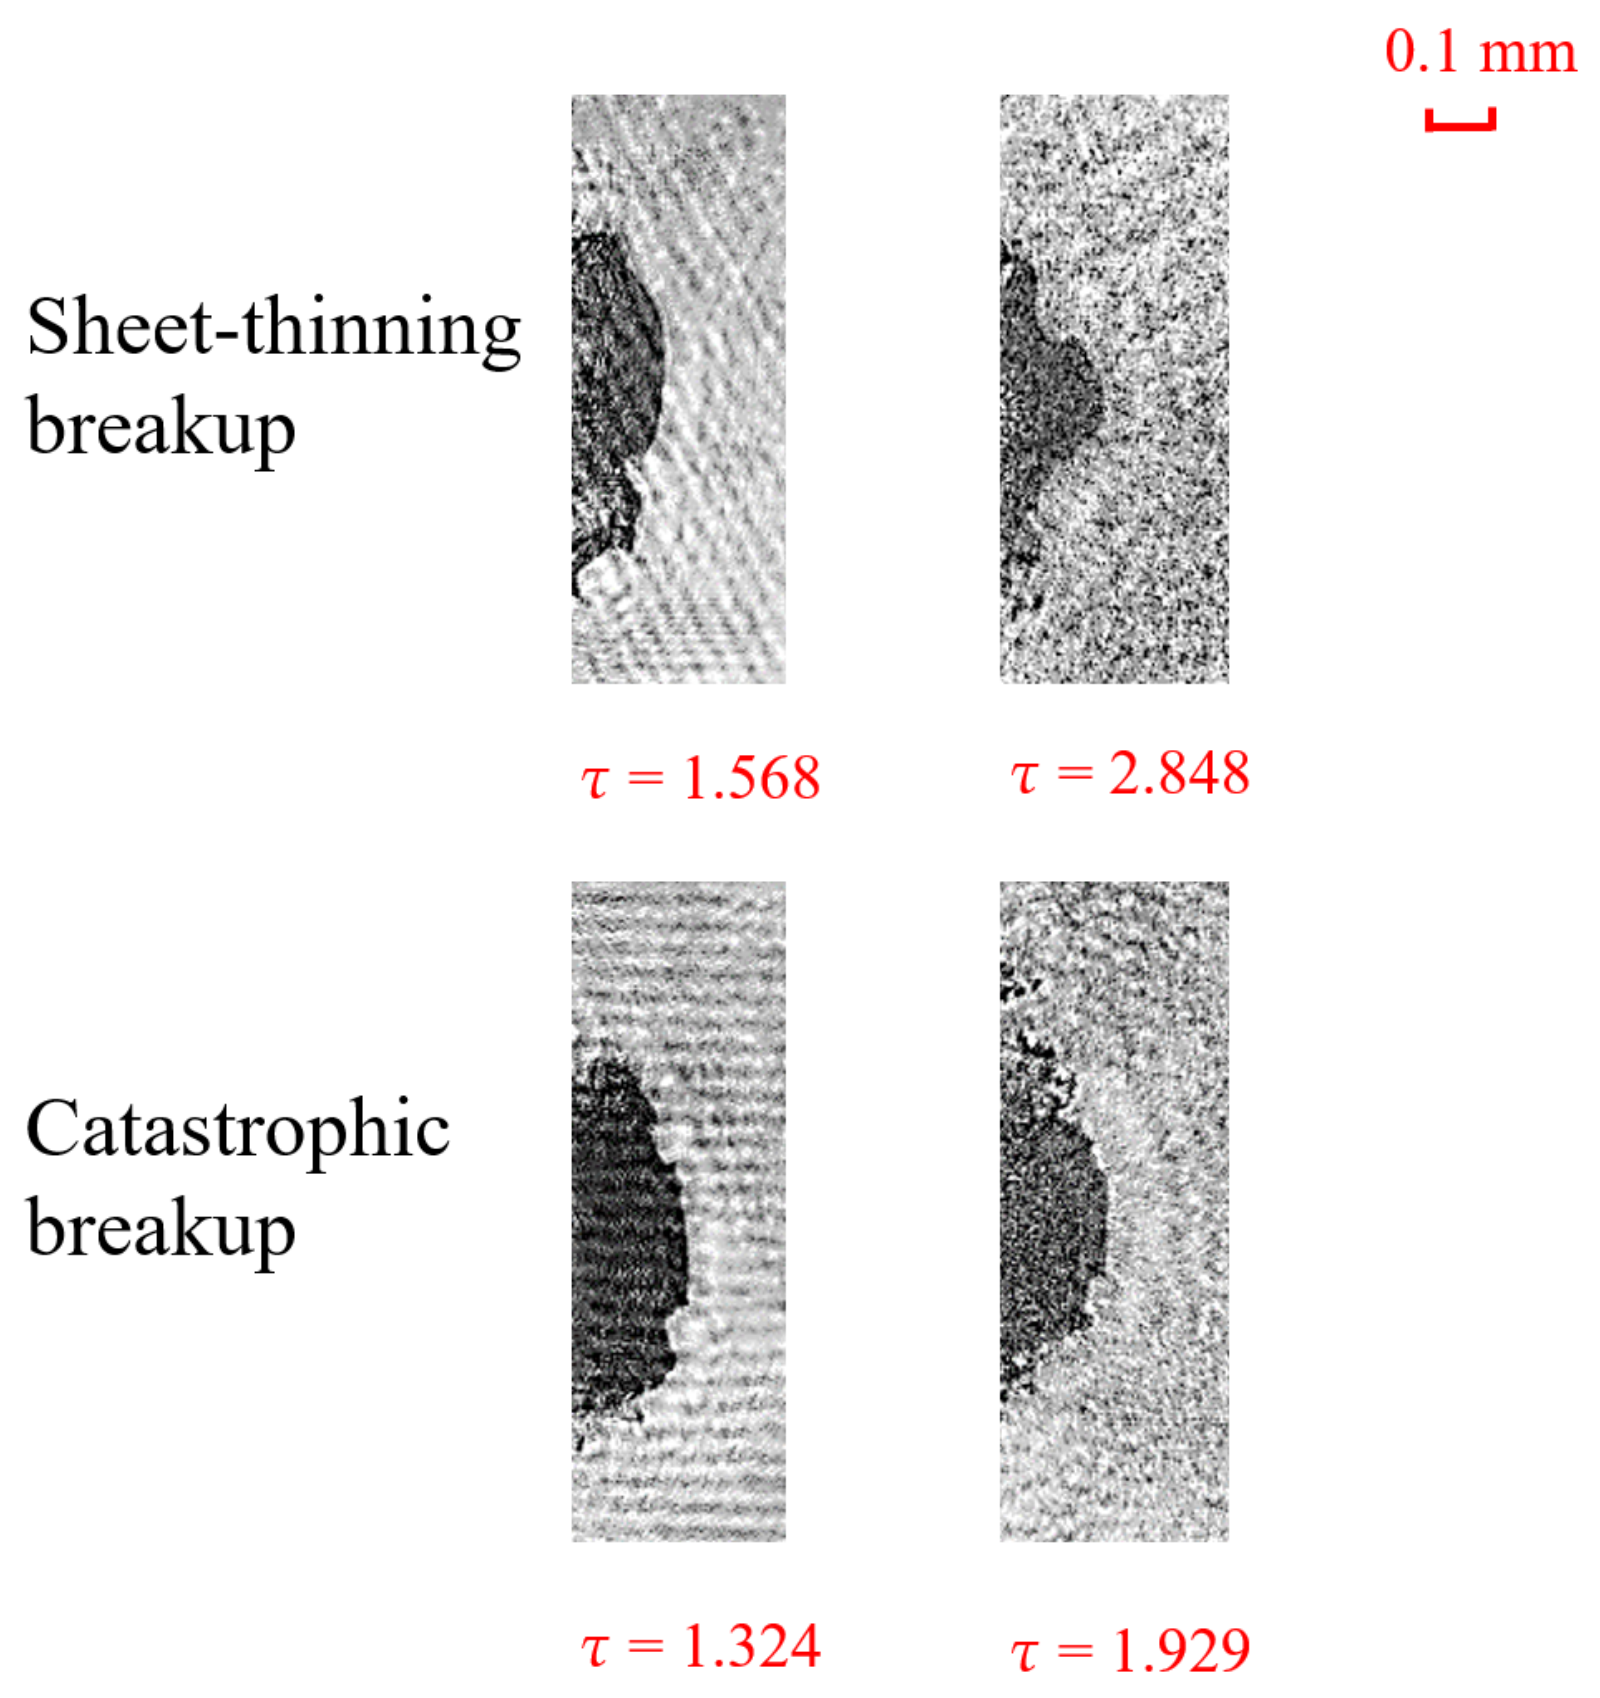
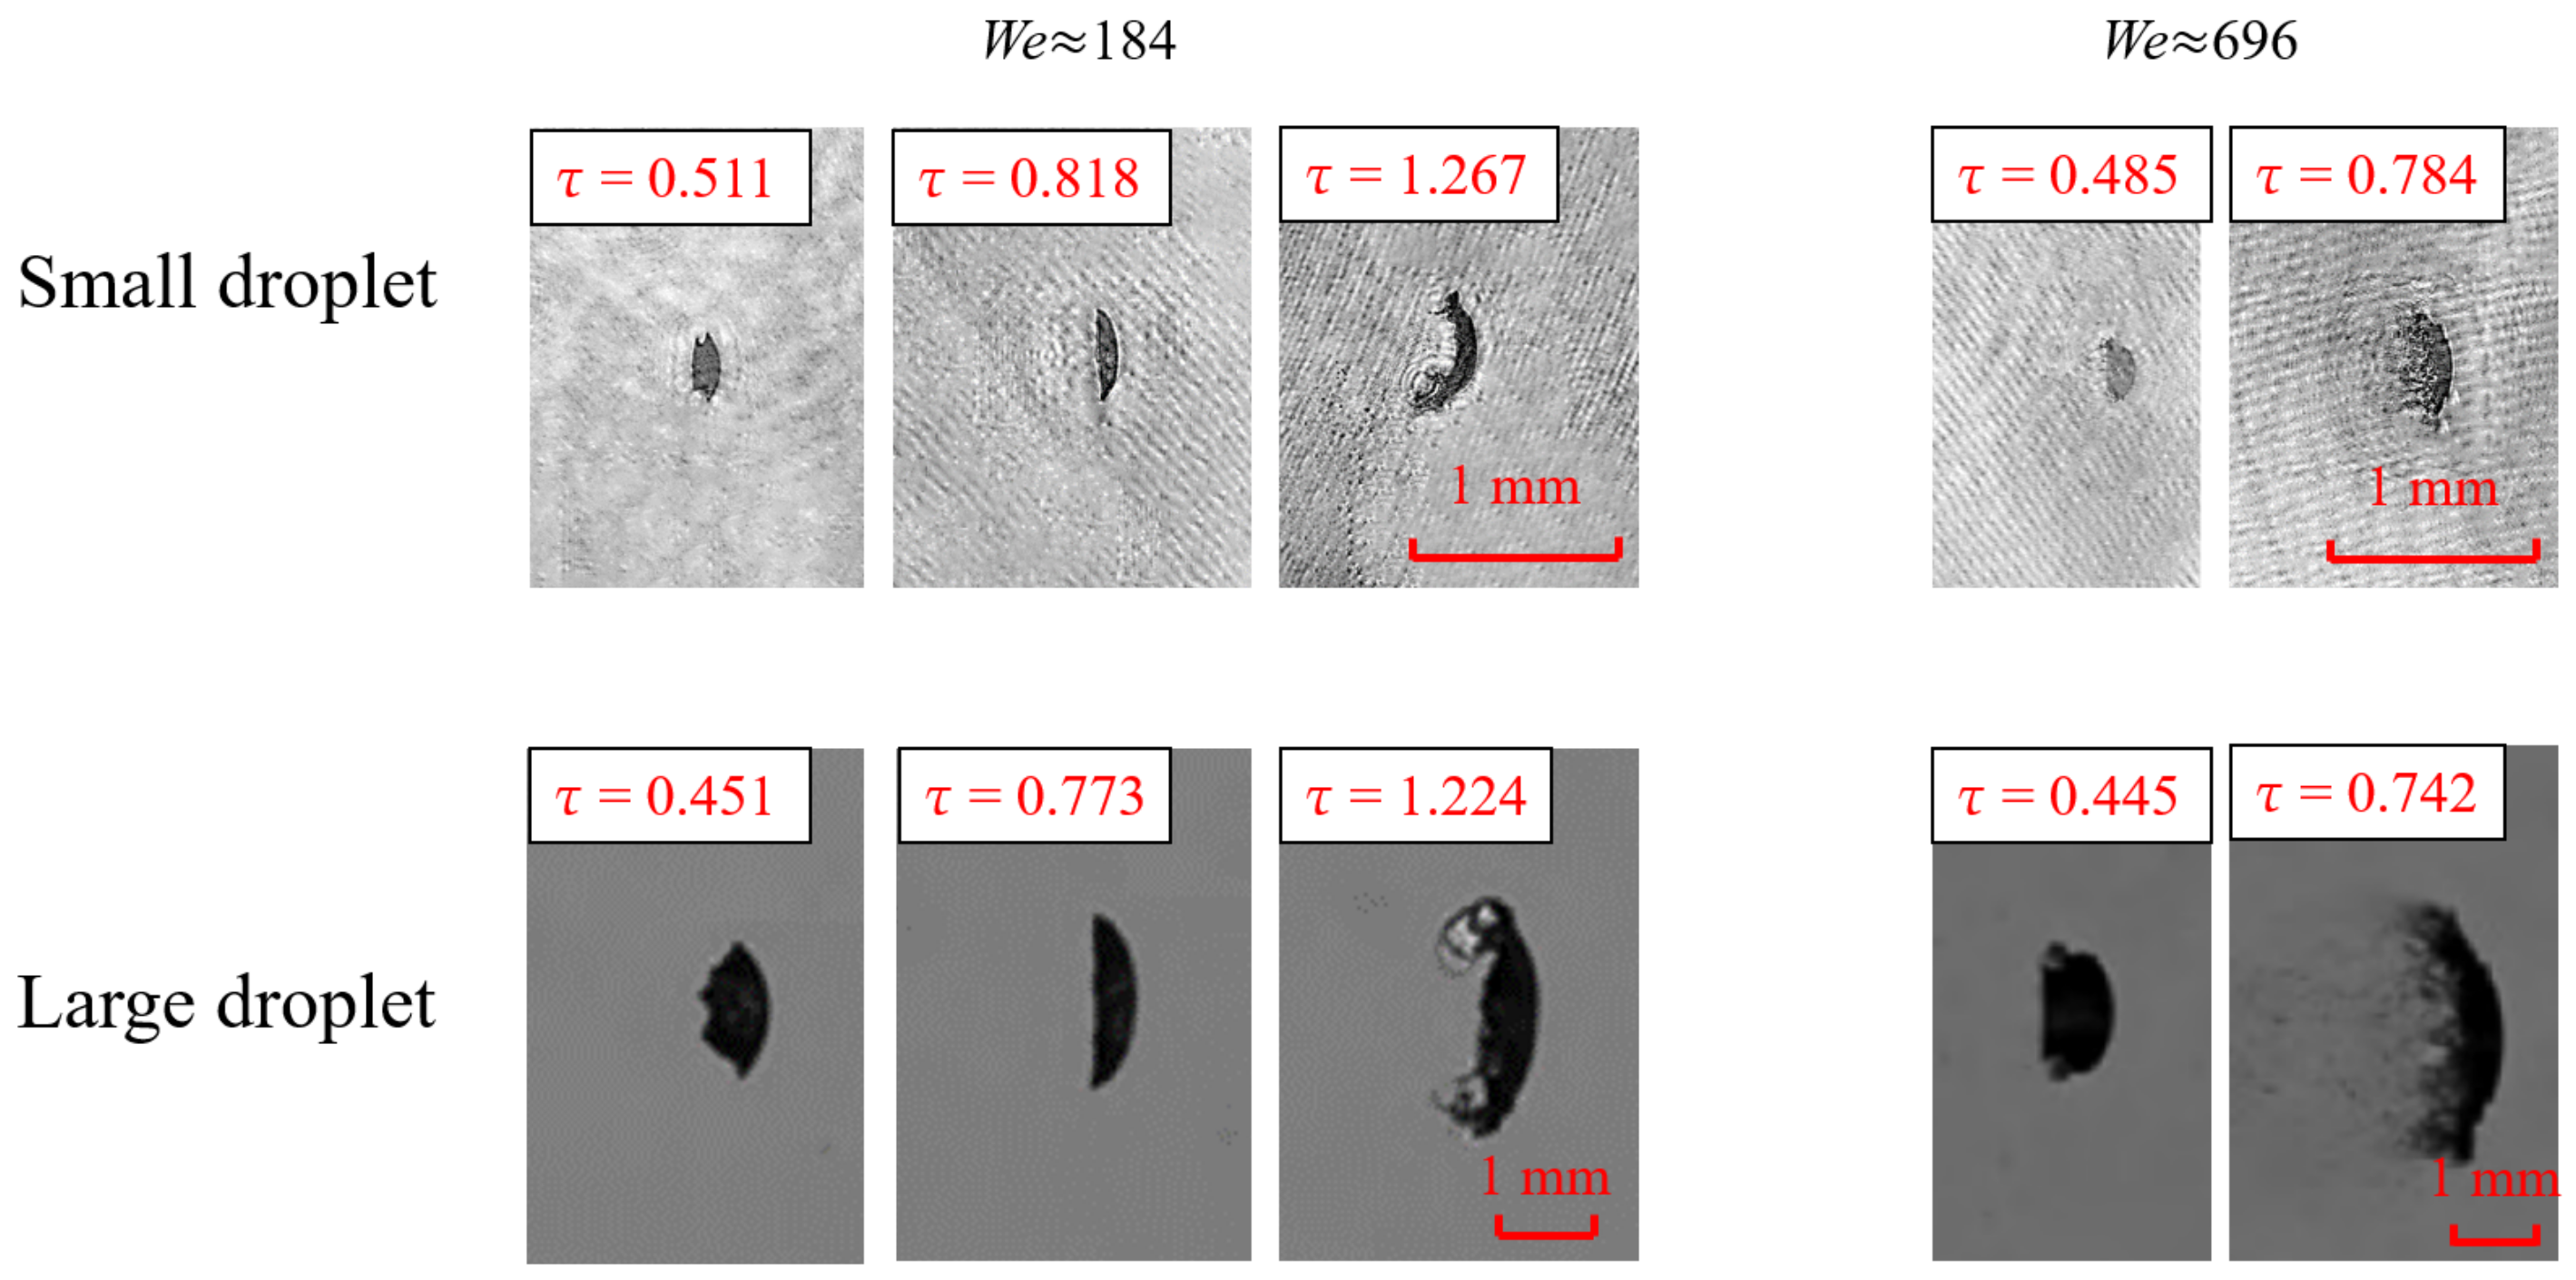
3.2. The High Weber Number Conditions

Under high We conditions, the deformation and breakup behavior of droplets, as well as the underlying physical mechanisms governing these phenomena, will display significant deviations from their low We counterparts.
When We is further increased to 184, the droplet undergoes sheet-thinning breakup, as shown in Figure 7a. In the droplet deformation step (τ = 0~0.818), the droplet continues to shrink toward the center and flattens out. At τ = 0.511, the droplet experiences a simultaneous contraction of the windward and leeward sides towards the center. However, the compression and deformation rate of the leeward side is noticeably greater than that of the windward side. As a result, the tail end of the leeward side evolves into a disk shape, appearing as a straight line on the image, while the curvature of the windward side remains curved. Following this, the windward side of the droplet grows in the direction of the vertical gas flow, wraps the droplet in the direction of the downstream gas flow, and wraps the droplet completely at τ = 0.818. For the breakup step (τ = 0.818~), the “sheet-thinning” mechanism and the development of R–T instability successively dominate the droplet breakup process. During the period of τ = 0.818~1.267, the sheet continuously grows from the edge of the windward side and continues to grow and progressively stretches in the direction of the gas flow. Between τ = 1.267~1.568, the gas flow fractures the sheet and produces liquid ligaments and filaments that then break up into a liquid mist. Concurrently, there is a clear piercing behavior of the gas flow toward the inside of the droplet at the windward edge so that it can be considered R–T instability. As the breakup process continues to progress (τ = 1.568~), the droplet’s windward edge gradually sheds into a dense liquid mist cluster and further breakup. This instability results in the stripping of a significant fraction of the droplet mass, governing the subsequent stages of the breakup process.
Figure 7b illustrates the morphological characteristics of the hundred-micron droplet catastrophic breakup process at We = 696. Compared with the We =184 condition, the similarity in the evolution process is primarily reflected in the following aspects: (1) the windward side remains; (2) the flattening trend of the droplets continues until the generated liquid mist obscures the main body of the droplets; (3) R–T instability exists at the windward edge of the droplets. The differences in the evolutionary process can be reflected in the following aspects: (1) the droplets are broken after experiencing slight compression deformation, and their deformation duration is significantly shortened; (2) the sheet is broken into liquid filaments and ligaments before breakup into small droplets in the We = 184 condition, while the liquid mist is directly dislodged from the liquid surface under the action of shear force; (3) in the droplet breakup step, no folds can be observed on the windward side at We = 184, while at We = 696, the increased air velocity makes the droplets appear as folds on the windward side, and the comparison diagram is shown in Figure 8.
As the front end of the droplet evolves from a smooth surface to a fluctuating state in front of the windward side, there are bumps and fluctuating behaviors, but no obvious piercing behaviors are observed. This suggests that R–T instability is not the dominant factor in the breakup of this region. This is consistent with the experimental findings of Theofanous et al. [6]. It should be noted that Theofanous et al. concluded that R–T instability does not occur at the front end of the windward side (−30~30° region) but did not explicitly state whether R–T instability exists at the windward edge of the droplet.
Regarding the difference between We = 184 and We = 696 conditions in the windward side of the droplet breakup step, it has been analyzed that the interfacial tension can inhibit the development of K–H instability at We = 184 due to a narrower gas–liquid velocity difference. In addition, the droplet first experience compressional deformation at We = 184, and the change of droplet shape led to the reduction of gas flow shear velocity, thus limiting the development of K–H instability. Moreover, at We = 696, the increased gas flow velocity causes the droplet to fold on the windward side.
Reducing the droplet diameter under the same We condition enhances the difficulty of droplet breakup and lengthens the deformation time so that the droplet can experience more deformation behaviors. Figure 9 shows the evolutionary morphology and time scale of small and large droplets (experimental photographs taken by Shi et al. [11]) during deformation under the same We. It can be found that when the droplet diameter decreases, the droplet takes longer to undergo deformation before it breaks up. As the droplet diameter decreases, its curvature increases, making it more difficult to undergo deformation under external forces, leading to the above changes.
The droplet move in the x-axis direction under the action of high-speed gas flow after the shock wave impacts the droplet, and the windward displacement can be a good measure of the droplet deflection. The windward displacement of the droplet is nondimensionalized by Equation (5):
X = S d 0
Here S is the windward displacement of the droplet, and d0 is the initial droplet diameter.
Figure 10 illustrates the windward displacement of a hundred-micron droplet at low We and high We. As We increases, the droplet’s windward displacement growth rate gradually decreases. Still, the droplet’s windward displacement is not simply uniformly accelerated, as depicted in Figure 10a. Under the We = 184 condition, the droplet undergoes bag and stamen breakup at τ = 2.1245. Prior to this event, the windward displacement of the droplet is significantly slower than that of the bag breakup at We = 15, and the gap between them expanded with the deformation of the droplet. After the breakup, the difference in their windward displacement decreases, which indicates that the bag and stamen breakup has faster windward acceleration after the breakup than before. This is because the droplet edge moves much faster than the stamen under the action of R–T instability, and the droplet mass hardly decreases while the droplet area in the vertical gas flow direction increases during the droplet film formation and the gradual development of the bag structure. The stamen needs to maintain the liquid film from breakup under interfacial tension, so the gap between the displacement of the windward of We = 19 and We = 15 increases with the deformation of the droplet. After τ = 2.1245, the droplets are left with only the stamens, which move at a faster acceleration under the action of gas flow. The gas velocity behind the wave of We = 184 and We = 696 are 184.96 m/s and 289.32 m/s, respectively, which are substantial differences. However, we can find from Figure 10b that differences in windward displacement between sheet-thinning breakup and catastrophic breakup are minimal, especially in the deformation step and the early breakup step. This phenomenon corroborates that the K–H instability dominates the droplet breakup physical mechanism under high We conditions (We > 102) when the ambient gas flow plays a much more significant role in shearing than puncturing the droplet’s windward side and overall propulsion.

4. Conclusions

An efficient experimental method was developed to investigate the deformation and breakup of hundred-micron droplets. This method utilizes a combination of shock wave-driven droplet experiments and double-pulse laser holography to obtain large field-of-view high-resolution images. The proposed approach provides an opportunity to simultaneously acquire high spatial and temporal resolution data on the deformation and breakup modes of a hundred-micron droplet under different loading conditions, as well as the distribution of Weber numbers associated with the droplet’s breakup modes. Based on the obtained experimental data, the following results were obtained:
1. At low Weber numbers within the critical range (15 < We < 19), reducing the droplet diameter impacts the count of Rayleigh–Taylor (R–T) waves and triggers a shift in droplet breakup mode. On the other hand, under high Weber numbers (We = 184 and We = 696), the curvature of the droplet increases with decreasing diameter leading to greater difficulty in droplet breakup. Consequently, at the same Weber conditions, the droplet experiences prolonged deformation time resulting in increased deformation behavior.
2. At high Weber numbers, the front end of the windward side of the droplet shows K–H instability-induced folds that become more pronounced as Weber number and time increase. Meanwhile, the leading edge of the droplet experiences R–T instability, which can result in significant droplet mass stripping.
3. The dimensionless windward displacement of a hundred-micron droplet will increase with the increase of this dimensionless time, the droplet’s windward is not uniformly accelerated under the action of gas flow, and its acceleration will change as the deformation and breakup. At high Weber numbers, the effect of gas velocity on the windward displacement of the droplet is small. Instead, the ambient gas flow plays a much more significant role in shearing than piercing the droplet’s windward side and overall propulsion.

Author Contributions

Conceptualization, J.L.; methodology, Y.Z. and J.L.; investigation, Y.Z. and J.L.; writing—original draft preparation, Y.Z.; writing—review and editing, Y.Z.; supervision, J.L., R.D. and H.S. All authors have read and agreed to the published version of the manuscript.

Funding

This research was funded by the National Natural Science Foundation of China (grant number: 11772309), Basic Public Welfare Research Program Project of Zhejiang Province (grant number: LGG19A020002) and China Academy of Engineering Physics Innovation Development Foundation (grant number: CX2019004).

Institutional Review Board Statement

Not applicable.

Informed Consent Statement

Not applicable.

Data Availability Statement

Not applicable.

Conflicts of Interest

The authors declare no conflict of interest.

References

  1. Moses, P.L.; Rausch, V.L.; Nguyen, L.T.; Hill, J.R. NASA hypersonic flight demonstrators—Overview, status, and future plans. Acta Astronaut. 2004, 55, 619–630. [Google Scholar] [CrossRef]
  2. Hinze, J.O. Critical Speeds and Sizes of Liquid Globules. J. Appl. Sci. Res. 1948, 1, 273–288. [Google Scholar] [CrossRef]
  3. Pilch, M.; Erdman, C.A. Use of Breakup Time Data and Velocity History Data to Predict the Maximum Size of Stable Fragments for Acceleration-Induced Breakup of a Liquid Drop. J. Multiph. Flow 1987, 13, 741–757. [Google Scholar] [CrossRef]
  4. Guildenbecher, D.R.; López-Rivera, C.; Sojka, P.E. Secondary Atomization. J. Exp. Fluids 2009, 46, 371–402. [Google Scholar] [CrossRef]
  5. Theofanous, T.G.; Li, G.J. On the physics of aerobreakup. Phys. Fluids 2008, 20, 201. [Google Scholar] [CrossRef]
  6. Theofanous, T.G. Aerobreakup of Newtonian and Viscoelastic Liquids. Annu. Rev. Fluid Mech. 2011, 43, 661–690. [Google Scholar] [CrossRef]
  7. Theofanous, T.G.; Mitkin, V.V.; Ng, C.L.; Chang, C.H.; Deng, X.; Sushchikh, S. The physics of aerobreakup. II. Viscous liquids. Phys. Fluids 2012, 24, 052103–052180. [Google Scholar] [CrossRef]
  8. Theofanous, T.G.; Mitkin, V.V.; Ng, C.L. The physics of aerobreakup. III. Viscoelastic liquids. Phys. Fluids 2013, 25, 032101. [Google Scholar] [CrossRef]
  9. Boiko, V.M.; Poplavskii, S.V. Particle and drop dynamics in the flow behind a shock wave. Fluid Dyn. 2007, 42, 433–441. [Google Scholar] [CrossRef]
  10. Xiong, H.; Liu, J.; Shi, H.; Zhang, L. Experiments on deformation and breakup of water and electronic fluoride droplets in high-speed argon stream. J. Zhejiang Sci-Tech Univ. (Nat. Sci. Ed.) 2017, 37, 409–416. [Google Scholar]
  11. Shi, H.; Shi, S.; Liu, C.; Liu, J.; Dong, R.; Yu, Q. Deformation and fracture patterns of sub-millimeter droplets under supersonic conditions. J. Aerosp. Power 2020, 35, 6–16. [Google Scholar]
  12. Shen, S.; Li, J.; Tang, C.; Liu, J.; Xiao, M.; Wei, F. The viscous effect on the transient droplet deformation process under the action of shock wave. J. At. Sprays 2019, 29, 105–121. [Google Scholar] [CrossRef]
  13. Fakhari, A.; Rahimian, M.H. Investigation of deformation and breakup of a moving droplet by the method of lattice Boltzmann equations. Int. J. Numer. Methods Fluids 2009, 64, 827–849. [Google Scholar] [CrossRef]
  14. Yu, L.; Yuan, S. Investigation of liquid droplet in gas medium using LES/VOF method. J. Aeronaut. Comput. Tech. 2012, 42, 58–61. [Google Scholar]
  15. Meng, J.; Colonius, T. Numerical simulations of the early stages of high-speed droplet breakup. Shock Waves 2014, 25, 399–414. [Google Scholar] [CrossRef]
  16. Meng, J.C. Numerical Simulations of Droplet Aerobreakup. Ph.D. Thesis, California Institute of Technology, Pasadena, CA, USA, 2016. [Google Scholar]
  17. Jalaal, M.; Mehravaran, K. Fragmentation of falling liquid droplets in bag breakup mode. Int. J. Multiph. Flow 2012, 47, 115–132. [Google Scholar] [CrossRef]
  18. Xiang, G.; Wang, B. Numerical study of a planar shock interacting with a cylindrical water column embedded with an air cavity. J. Fluid Mech. 2017, 825, 825–852. [Google Scholar] [CrossRef]
  19. Poplavski, S.V.; Minakov, A.V.; Shebeleva, A.A.; Boyko, V.M. On the interaction of water droplet with a shock wave: Experiment and numerical simulation. Int. J. Multiph. Flow 2020, 127, 103273. [Google Scholar] [CrossRef]
  20. Bijarchi, M.A.; Dizani, M.; Honarmand, M.; Shafii, M.B. Splitting dynamics of ferrofluid droplets inside a microfluidic T-junction using a pulse-width modulated magnetic field in micro-magnetofluidics. Soft Matter 2021, 17, 1317–1329. [Google Scholar] [CrossRef] [PubMed]
  21. Hsiang, L.P.; Faeth, G.M. Near-Limit Drop Deformation and Secondary Breakup. J. Int. J. Multiph. Flow 1992, 18, 635–652. [Google Scholar] [CrossRef]
  22. Zhao, H.; Liu, H.; Li, W.; Xu, J. Morphological classification of low viscosity drop bag breakup in a continuous air jet stream. Phys. Fluids 2010, 22, 114103. [Google Scholar] [CrossRef]
Figure 1. Schematic diagram of the experimental system.
Applsci 13 05555 g001
Figure 2. (a) The structure of the droplet generator, (b) top view of the droplet generator base.
Applsci 13 05555 g002
Figure 3. Image taken by CCD camera. (a) Large field of view images, (b) Partial detail image.
Applsci 13 05555 g003
Figure 4. (a) Static flow field holographic image, (b) broken flow field holographic image, (c) post-processing holographic image.
Applsci 13 05555 g004
Figure 5. Schematic of droplet breakup morphology characteristics. (a) bag breakup, (b) bag and stamen breakup.
Applsci 13 05555 g005
Figure 6. Schematic of droplet breakup morphology characteristics taken by Shi (We = 21).
Applsci 13 05555 g006
Figure 7. Schematic of droplet breakup morphology characteristics. (a) sheet-thinning breakup, (b) catastrophic breakup.
Applsci 13 05555 g007
Figure 8. The windward comparison diagram of sheet-thinning breakup and catastrophic breakup.
Applsci 13 05555 g008
Figure 9. The evolutionary morphology and time scale of small and large droplets (experimental photographs taken by SHI et al.).
Applsci 13 05555 g009
Figure 10. (a) The Windward displacement of low We, (b) the windward displacement of high We.
Applsci 13 05555 g010
Table 1. Experimental operating conditions parameters.
d0/
(mm)
p1/
(Pa)
p2/
(Pa)
Maug/
(m/s)
ρg/
(kg/m3)
Tg/
(K)
WeOh
0.241013251281981.1158.011.41318.915 ± 1 0.00764 ± 0.00018
0.241013251305971.1262.731.44320.619 ± 1 0.00764 ± 0.00018
0.241013252009601.36175.691.93366.1184 ± 13 0.00764 ± 0.00018
0.241013252988471.63289.322.50421.2696 ± 30 0.00764 ± 0.00018
Note: d0 is the initial droplet diameter; p1 is the pressure of the low-pressure chamber of the shock tube; p2 is the gas pressure behind the shock wave; Ma is the propagation Mach number of the shock wave; ug is the gas velocity behind the shock wave; ρg is the gas density behind the shock wave; Tg is the gas temperature behind the shock wave.
Disclaimer/Publisher’s Note: The statements, opinions and data contained in all publications are solely those of the individual author(s) and contributor(s) and not of MDPI and/or the editor(s). MDPI and/or the editor(s) disclaim responsibility for any injury to people or property resulting from any ideas, methods, instructions or products referred to in the content.

