1. Introduction
Traumatic brain injury (TBI) is caused by an external force that disturbs the brain’s function [
1,
2]. Every year 50 to 60 million new cases are reported worldwide, including mild, moderate, and severe cases of TBI with mortality rates as high as 40% for the latter [
3]. Survivors also present disabling outcomes, reducing their life expectancy by six years [
3]. After a traumatic brain injury, cerebral hemodynamics are disrupted, with intracranial pressure (ICP) and cerebral oxygenation as two of the most relevant impaired parameters [
4]. These variables’ alterations occur in the first hours after injury and can usually lead to secondary injuries such as ischemia or hyperemia [
5]. Unfortunately, during this “golden period” of around two hours, doctors know almost nothing of what is happening inside the skull because current techniques to assess TBI are intermittent and invasive. In neurocritical care, TBI monitoring involves invasive measurements of ICP and cerebral oxygenation (PbtO2, StO2) by placing a transducer into the brain tissue through a small hole drilled in the skull, also known as a bolt [
4]. Although guidelines recommend prompt and continuous monitoring of physiological variables soon after TBI, current intracranial monitoring methods are invasive, require specialized medical staff to place the bolt inside the skull, and can only be placed 3 to 4 h after injury [
6]. Moreover, these methods are used only in severe cases due to their association with infection risks. Evidence has shown that access to early monitoring and treatment can decrease the risk of secondary injury, resulting in better outcomes and reduced mortality. Similarly, the integration of multimodal monitoring in patient management has shown better results than treatment guided by one single parameter [
4,
7].
Non-invasive cerebral oxygenation and ICP monitoring would also drastically reduce financial costs and patient risks, including risks from patients being left unmonitored. Even in developed nations and among people with 50% chance of developing raised ICP (people with severe TBI and 2+ clinical risk factors), the ICP monitoring rate is only ~43% [
8]. Non-invasive monitoring could not only dramatically increase monitoring rates in TBI; it could open up monitoring to new patient populations e.g., hydrocephalus (CSF shunt assessment), meningitis, brain tumor, and stroke [
9].
This research proposes to develop a non-invasive, continuous multimodal monitoring system to assess ICP and cerebral oxygenation in TBI patients, with a primary aim to facilitate a timely treatment to decrease the severity of secondary injuries. This non-invasive and portable technology will comprise a multimodal probe and an embedded system to acquire, process, control, and visualize the signals and vital signs (absolute measurements of ICP and cerebral oxygenation), and it will allow a preliminary assessment of TBI-related physiology during the early stages of the injury. The technology will be a tool to be used by paramedics and physicians in and outside the hospital, and, as it is low-risk, it will allow the assessment of every type of TBI severity, hence improving the treatment of patients with mild or moderate TBI.
There is no evidence of any other multimodal, non-invasive technology that uses pulsatile and non-pulsatile optical brain signals to assess ICP and cerebral oxygenation quantitatively and simultaneously in TBI patients. Near-infrared spectroscopy (NIRS) has been broadly used to assess cerebral oxygenation non-invasively [
10,
11,
12,
13,
14,
15]. However, current NIRS devices only provide relative changes of oxy- and deoxyhemoglobin (Hb, HbO2, TOI), utilizing only the non-pulsatile brain signals [
16]. A broad description of arterial and cerebral oxygenation techniques is presented in the background section. However, current NIRS technologies do not measure ICP; hence, they are not routinely used by neurosurgeons.
This research will enable the creation of a new multimodal optical sensor technology by utilizing both the pulsatile (Photoplethysmogram(PPG)) and non-pulsatile components of the backscattered light at visible and infrared wavelengths to assess absolute measurements of ICP and cerebral oxygenation. The system presented in this manuscript includes a probe designed specifically for monitoring the main physiological parameters of interest in TBI patients. In addition to the probe, the researchers developed an instrumentation system for the acquisition and pre-processing of proximal and distal PPG signals at multiple wavelengths. Different source–detector separations and multiple wavelengths are key for the assessment of superficial and deeper tissue layers and provide information to calculate oxygenation parameters such as SpO
2 and TOI. The sensor has the capacity to acquire good quality PPG signals (AC and DC) from the photodiodes and thus enable their implementation in further computational analysis. The functioning of the proposed TBI multimodal sensor is based on the novel analysis of the NIR pulsatile signals acquired from cerebral tissue. Changes in intracranial pressure will affect the morphology of the optical pulse, meaning that rigorous analysis of quantifiable features of the pulsatile signals could enable the development of a computational model to estimate absolute values of intracranial pressure [
17].
2. Background
Pulse oximetry principles rely on light absorbance by different chromophores in blood. For instance, at high blood oxygen saturations (>80%), the red light (600 to 750 nm) is absorbed more than the infrared light (750 to 1000 nm), while at low saturations (<80%), the absorption is inverted. The pulse oximetry technique utilizes the pulsatile (AC) PPG components at both wavelengths to estimate the ratio of absorbances, limiting the use of the DC component for normalization only. The ratio of ratios (
R) is then related to arterial oxygen saturation by empirical curves obtained from controlled hypoxia studies on healthy volunteers. A typical relation of
R and
SpO2 is shown in Equation (1) [
18,
19].
Equation (1): Oxygen saturation (SpO2), Ratio of ratios (R), pulsatile component of the red wavelength (ACR), non-pulsatile component of the red wavelength (DCR), pulsatile component of the infrared wavelength (ACIR), and non-pulsatile component of the infrared wavelength (DCIR).
NIRS does not include the pulsatile component of the signal and focuses on the analysis of the slow-changing DC components. Following the modified Beer–Lambert law (), changes in chromophores absorption coefficients () can be calculated from changes in light attenuation () and the differential path length (). Due to , change in light attenuation allows the calculation of changes in chromophores concentrations once the light travelling path () is known.
However, the modified Beer–Lambert law method measures only the changes in concentrations from an arbitrary point. Therefore, spatially resolved spectroscopy (SRS) is implemented to measure an absolute tissue oxygenation index. The Tissue Oxygenation Index (TOI) is expressed in percentage and represents the hemoglobin oxygenation saturation of the sampled volume of tissue. This method calculates the relative chromophores concentrations by measuring the relative change in light attenuation (A) along the distance (). In NIRS, two distal photodetectors are employed—close together (8 mm), and far from the light source, so that the measurement is less affected by the head geometry or surface non-uniformity. Moreover, due to the small distance between the photodetectors (<10 mm), the change of A along can be assumed linear, which is a prerequisite for SRS. Furthermore, the multi-distance approach makes SRS less susceptible to the superficial structures within the light path.
The value of
is measured by the probe as the change of light attenuation along the photodetectors’ distance. Light attenuation is related to light intensity (voltage measurements) by applying the Beer–Lambert Law as follows:
Equation (2): Specific wavelength ( change of light attenuation along the photodetectors’ distance (), light intensity at each photodetector (), and source-detector distance of each photodetector ().
By solving the diffusion approximation for a highly scattering medium (
), the value of
is related to the relative absorption coefficient of the specific wavelength as follows:
Equation (3): Unknown constant for scattering in the near-infrared region (K), absorption coefficient (, specific wavelength ( normalized slope of along (h), change of light attenuation along the photodetectors’ distance (), and mean emitter-detectors distance ().
Where
h is invariable among tissues and subjects,
h = 6.3 × 10
−4 (mm
−1/nm) is used [
20]. Furthermore, it is possible to calculate the relative concentrations of both chromophores by solving the following equations system for at least two wavelengths (770 nm and 880 nm). Where
are the extinction coefficients of
i = ,
and
j =
λ1,
λ2.
Equation (4): Unknown constant for scattering in the near-infrared region (K), oxyhemoglobin concertation ([), deoxyhemoglobin concentration ([), absorption coefficient (, and specific wavelength (
These concentrations are used to find the total oxygenation index (
TOI).
Equation (5): Total oxygenation index (TOI), unknown constant for scattering in the near-infrared region (K), oxyhemoglobin concertation ([), and deoxyhemoglobin concentration ([).
3. Materials and Methods
This section presents the description of the probe design and development, the instrumentation and acquisition system, and the circuits implemented in each of them. Finally, the performance tests, using both the probe and the system to detect PPG and non-pulsatile signals from the cerebral arteries of a head phantom, are presented.
3.1. Probe
The sensor’s probe design considered, as many other optical modalities (Photoplethysmography (PPG), NIRS, among others), light emitters to shine into the tissue and photodetectors to acquire the backscattered light. The quantity of these optical components, their topology, and their placement, were defined based on the sensor’s application and the anatomy location. Firstly, the sensor’s application is to interrogate non-invasively the brain using light and to estimate changes in ICP and cerebral oxygenation. Secondly, the sensor’s location is on the right or left side of the forehead, avoiding the midline sinuses. Implementing NIRS principles to PPG measurements opens up great opportunities for extending the capabilities of both techniques. By doing so, the same sensors and technology can be used to obtain parameters relating to tissue oxygenation and intracranial pressure. Therefore, in this research, four wavelength emitters and three photodetectors were used in a reflectance mode probe to apply photoplethysmography and NIRS physical principles.
3.1.1. Optical Parts
Four light-emitting diodes (LEDs), also known as sources, were carefully chosen to interrogate specific information from the brain. The wavelengths used are 660 nm, 770 nm, 810 nm, and 880 nm. The 810 nm wavelength, also known as the isosbestic wavelength, has the unique characteristic of being absorbed to the same extent by both oxy- and deoxy-hemoglobin [
18]. Therefore, it is an optimal wavelength to record an optical signal which is independent of blood oxygenation and could be correlated to intracranial volumetric changes.
Wavelengths at 660 nm and 880 nm were also included in order to assess extracerebral oxygen saturation. The utilization of these wavelengths in pulse oximetry (SpO
2) is widely reported [
18]. Likewise, NIRS commercial devices generally use at least two infrared wavelengths (750–1000 nm) to calculate cerebral oxygenation parameters. These two wavelengths are usually selected on opposite sides with respect to the isosbestic point of the hemoglobin absorption spectra (810 nm). Accordingly, LEDs of 770 nm and 880 nm were included in the probe to implement spatially resolved spectroscopy (SRS) measurements.
Previous evaluation of infrared light and cerebral tissue interaction at different source-detector (S-D) separations showed that higher S-D separation increases the penetration depth, but it also causes a decrease in the overall signal quality due to high absorption [
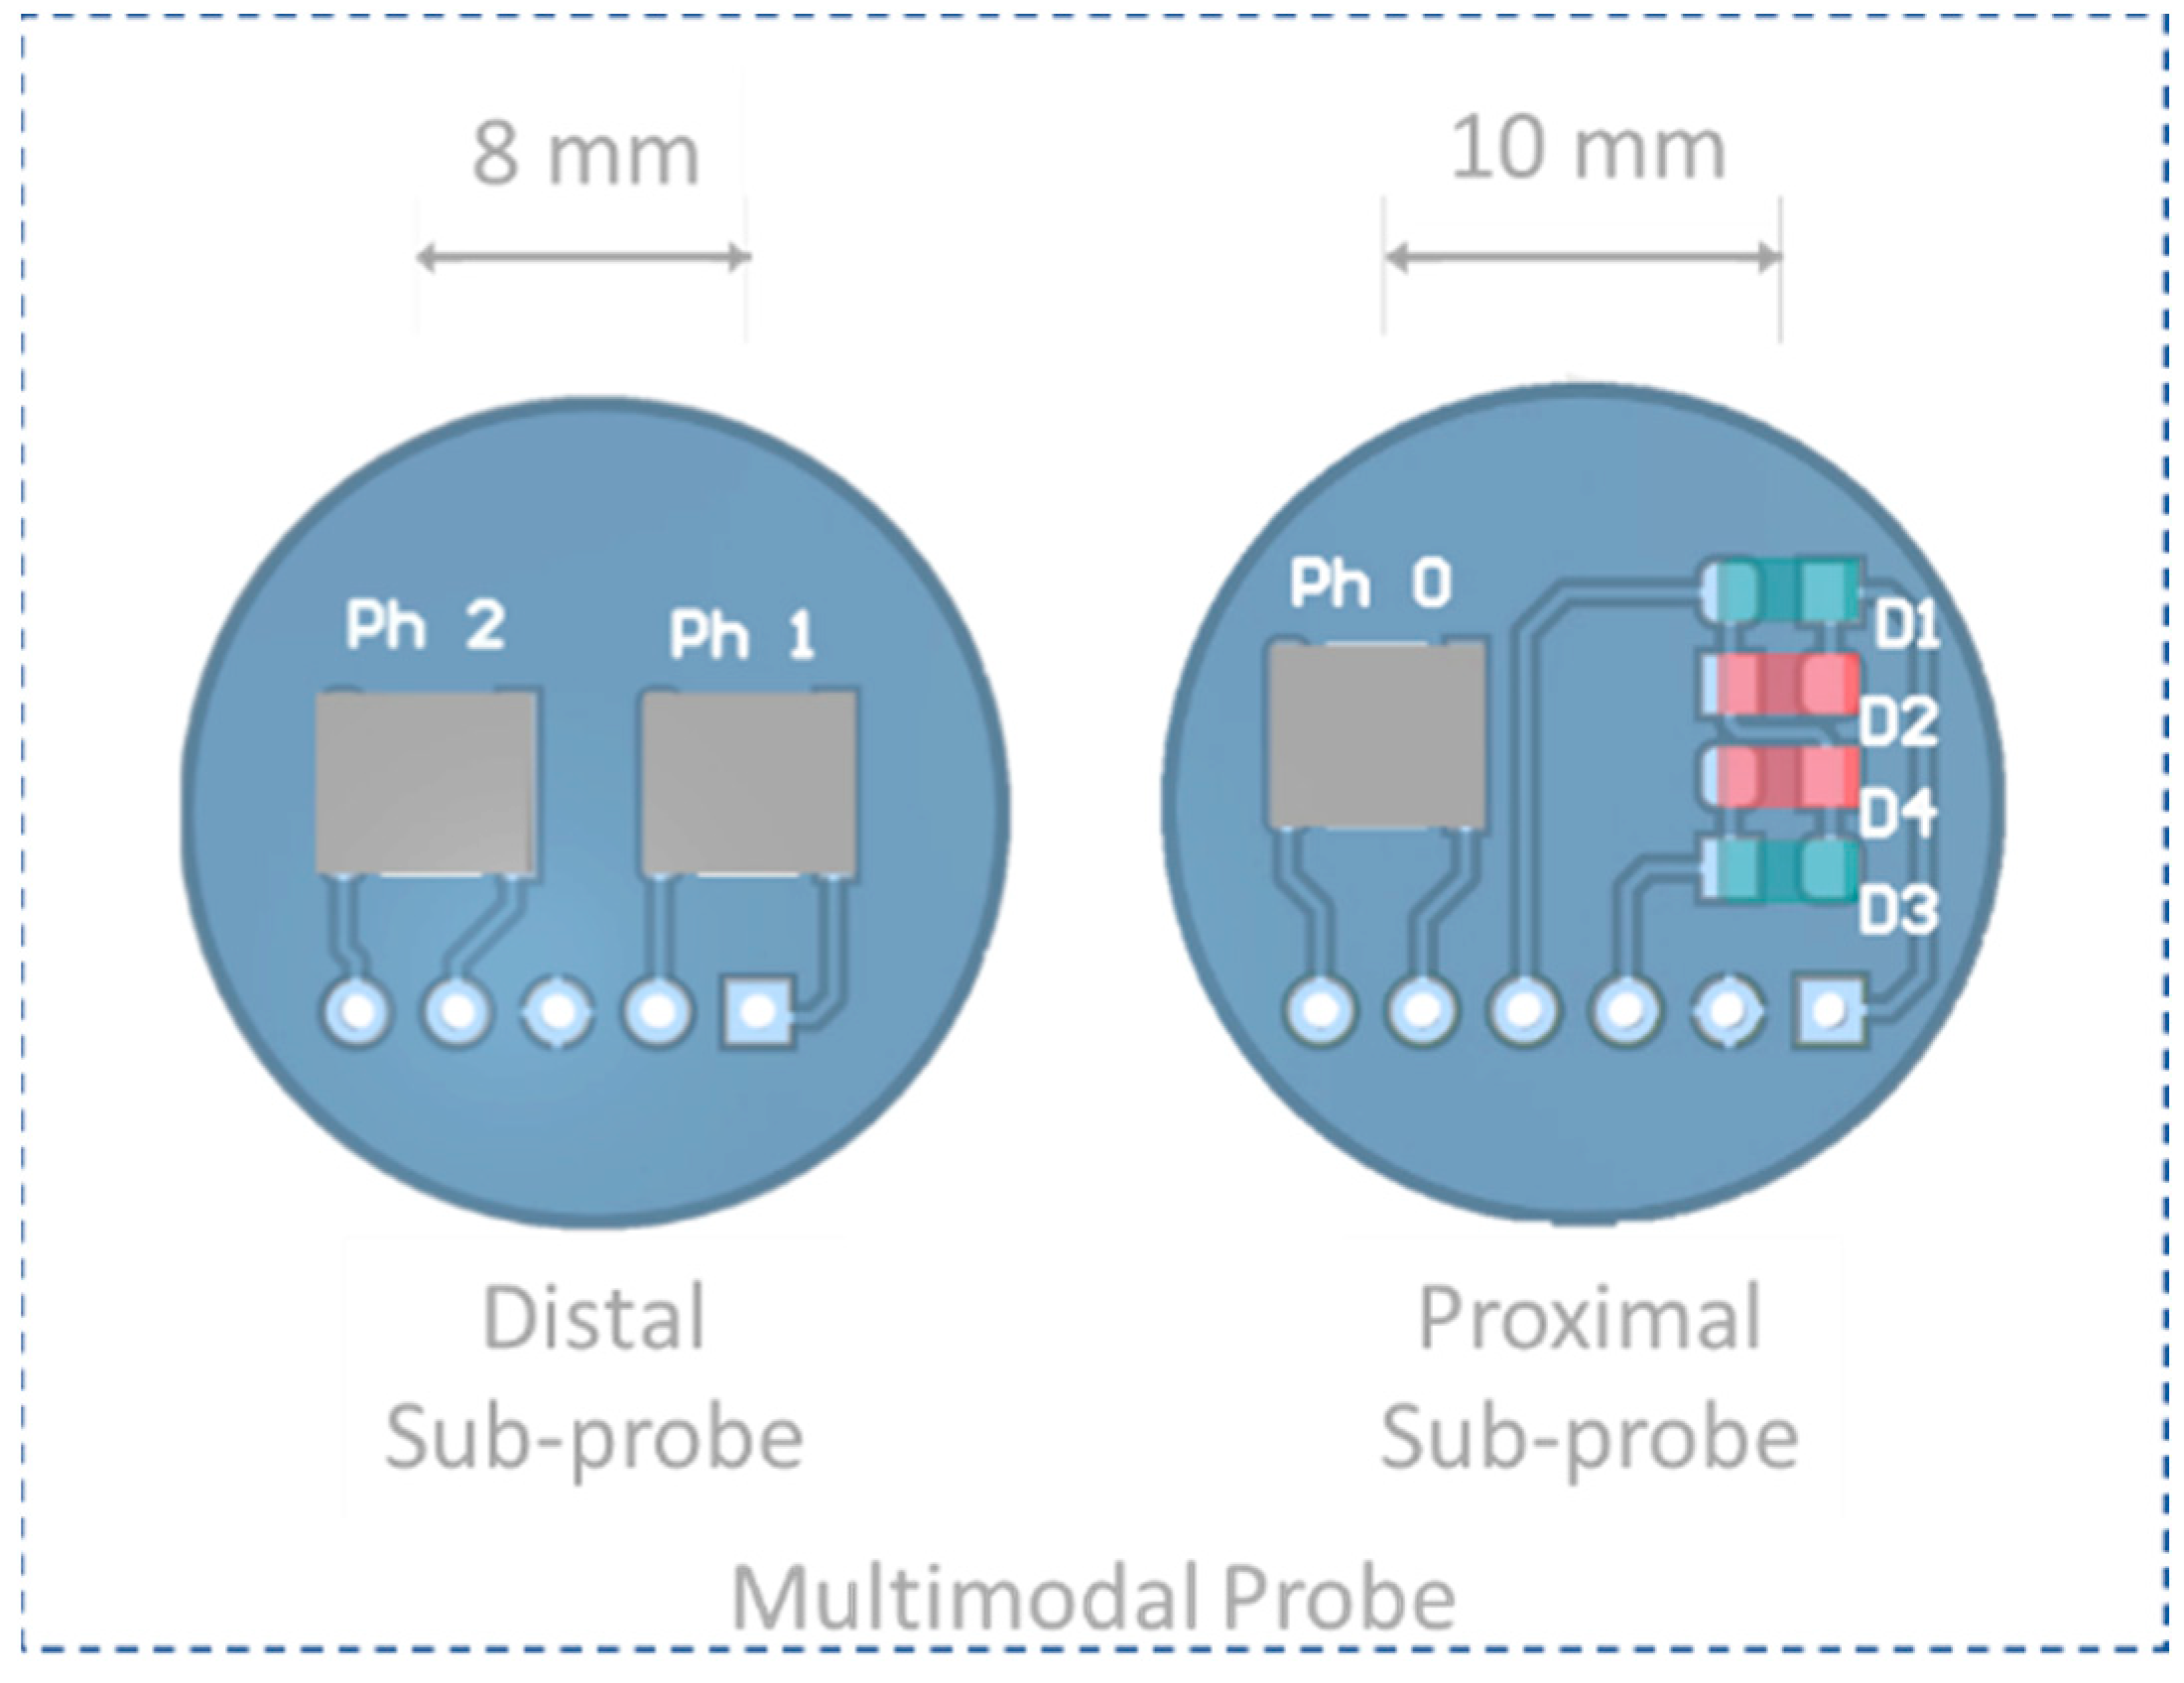
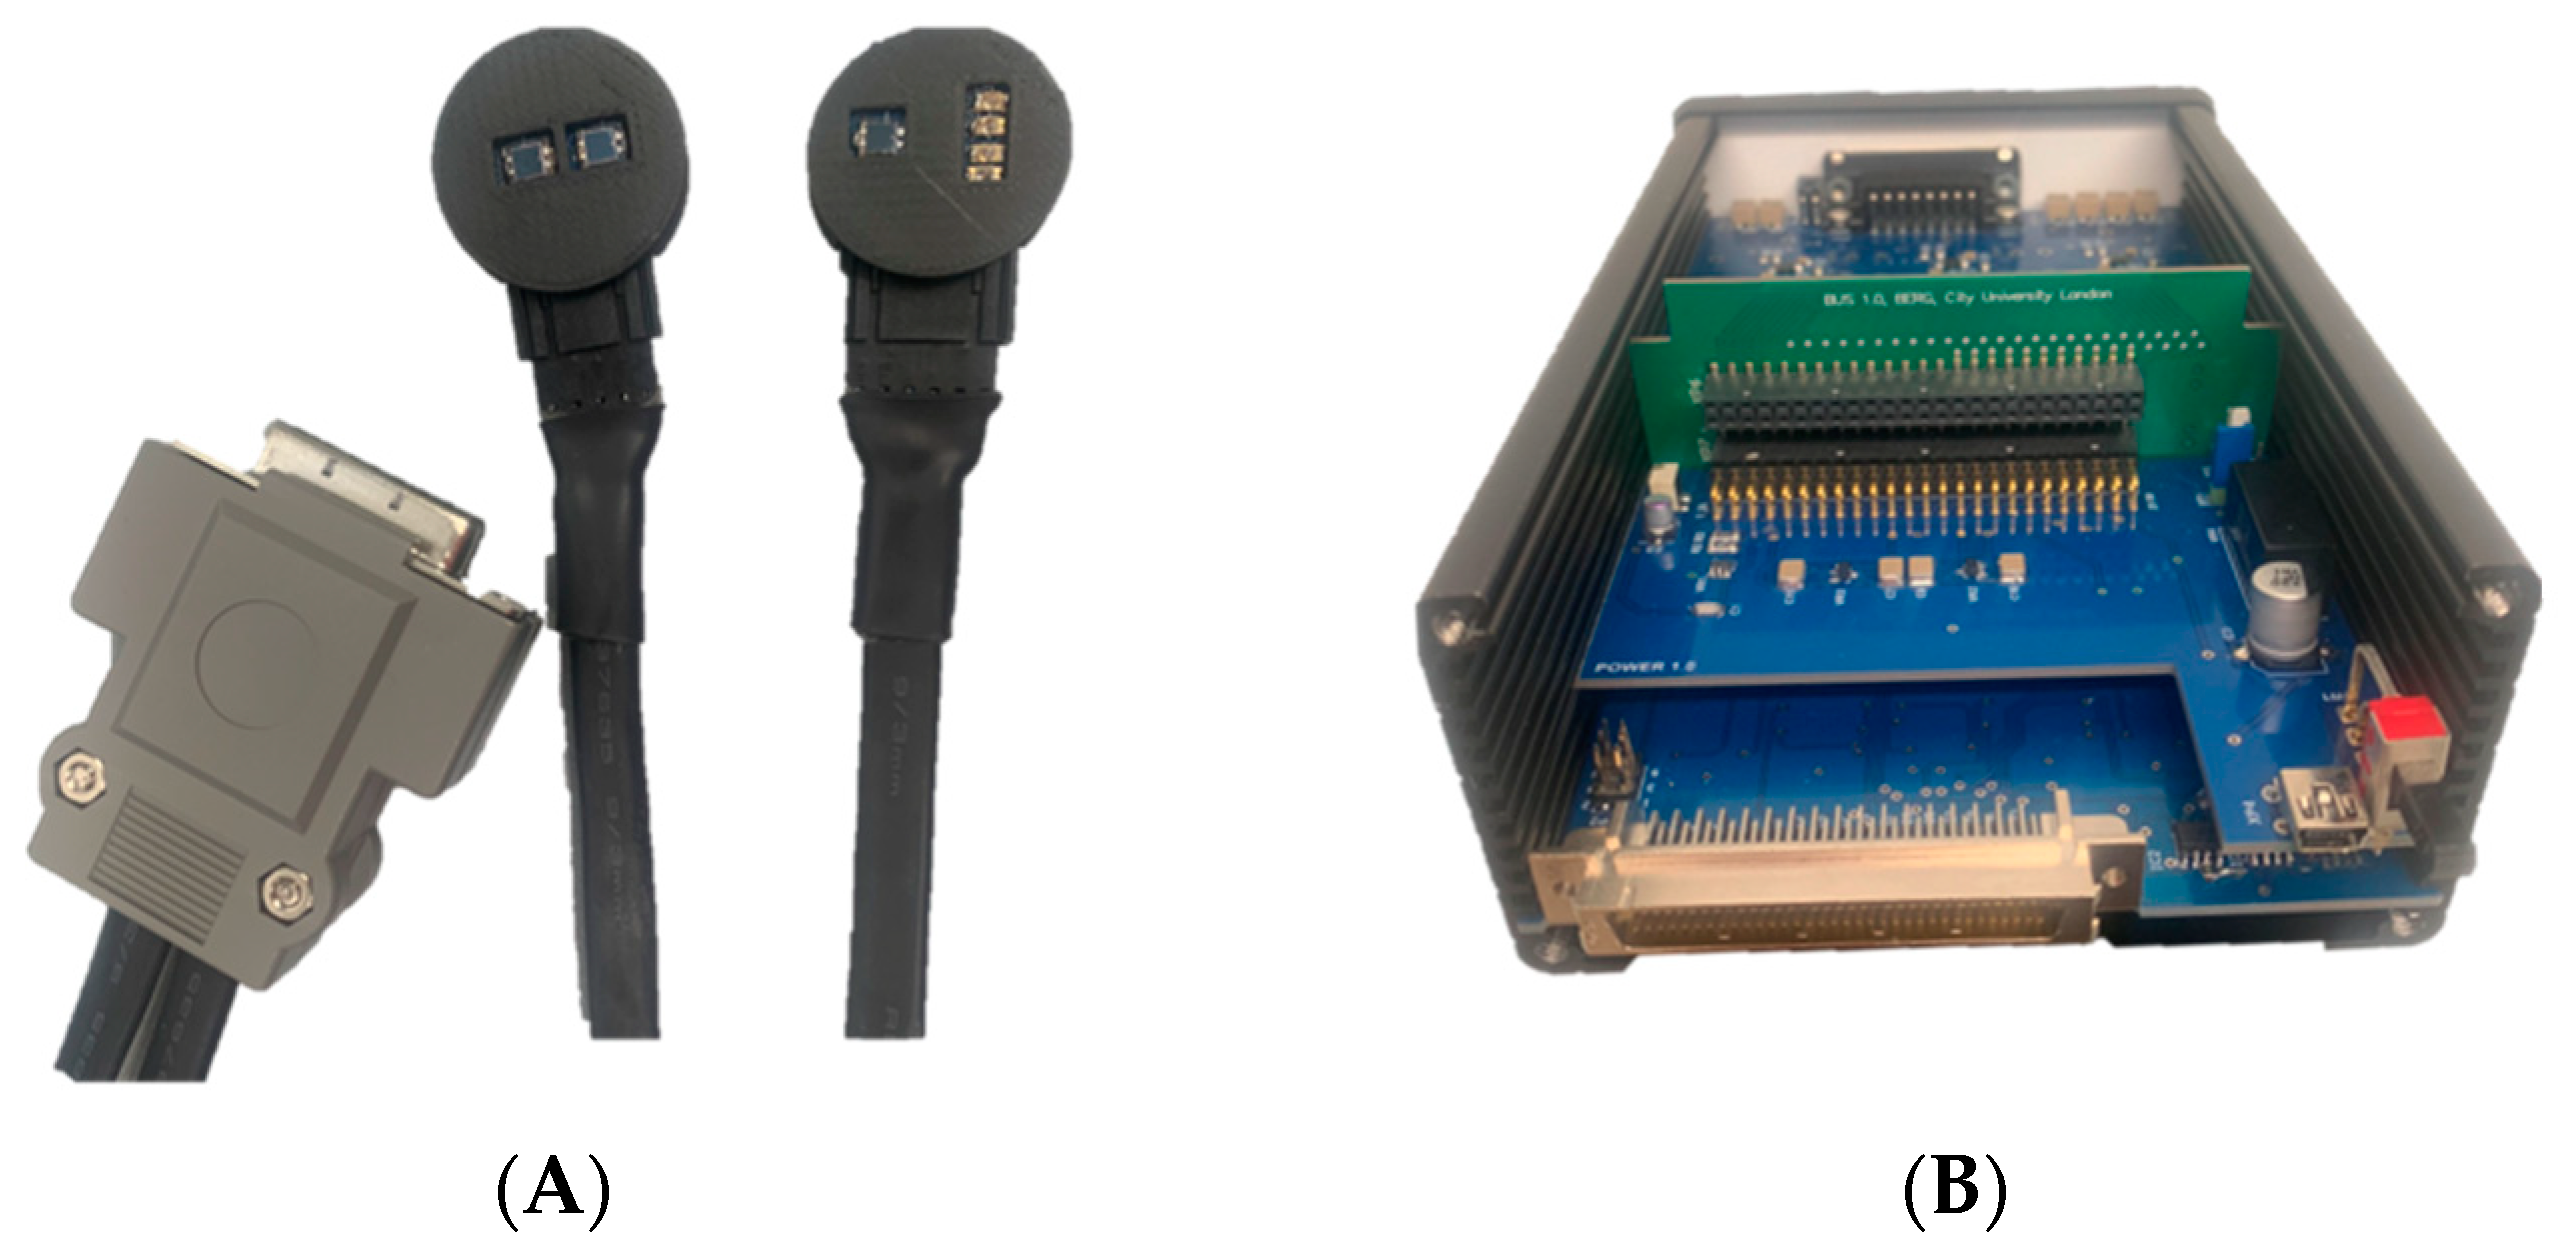
21]. Accordingly, the probe design was subdivided into two individual sub-probes called proximal probe and distal probe (
Figure 1). As this is a research probe, the proposed configuration will enable the flexibility to investigate the effect of S-D on optical signals on demand.
The proximal sub-probe consists of the four LEDs (D1–D4), and one photodiode (Ph 0) placed 10 mm from the sources to detect the backscattered light from superficial tissues, which will allow arterial oxygen saturation (SpO2) measurements. The distal sub-probe includes two photodiodes (Ph 1 and Ph 2) to detect the backscattered light from cerebral tissues, which can be separated from the proximal probe between 25 and 50 mm. The sources and distal photodiodes will allow the evaluation of cerebral oxygenation parameters through SRS.
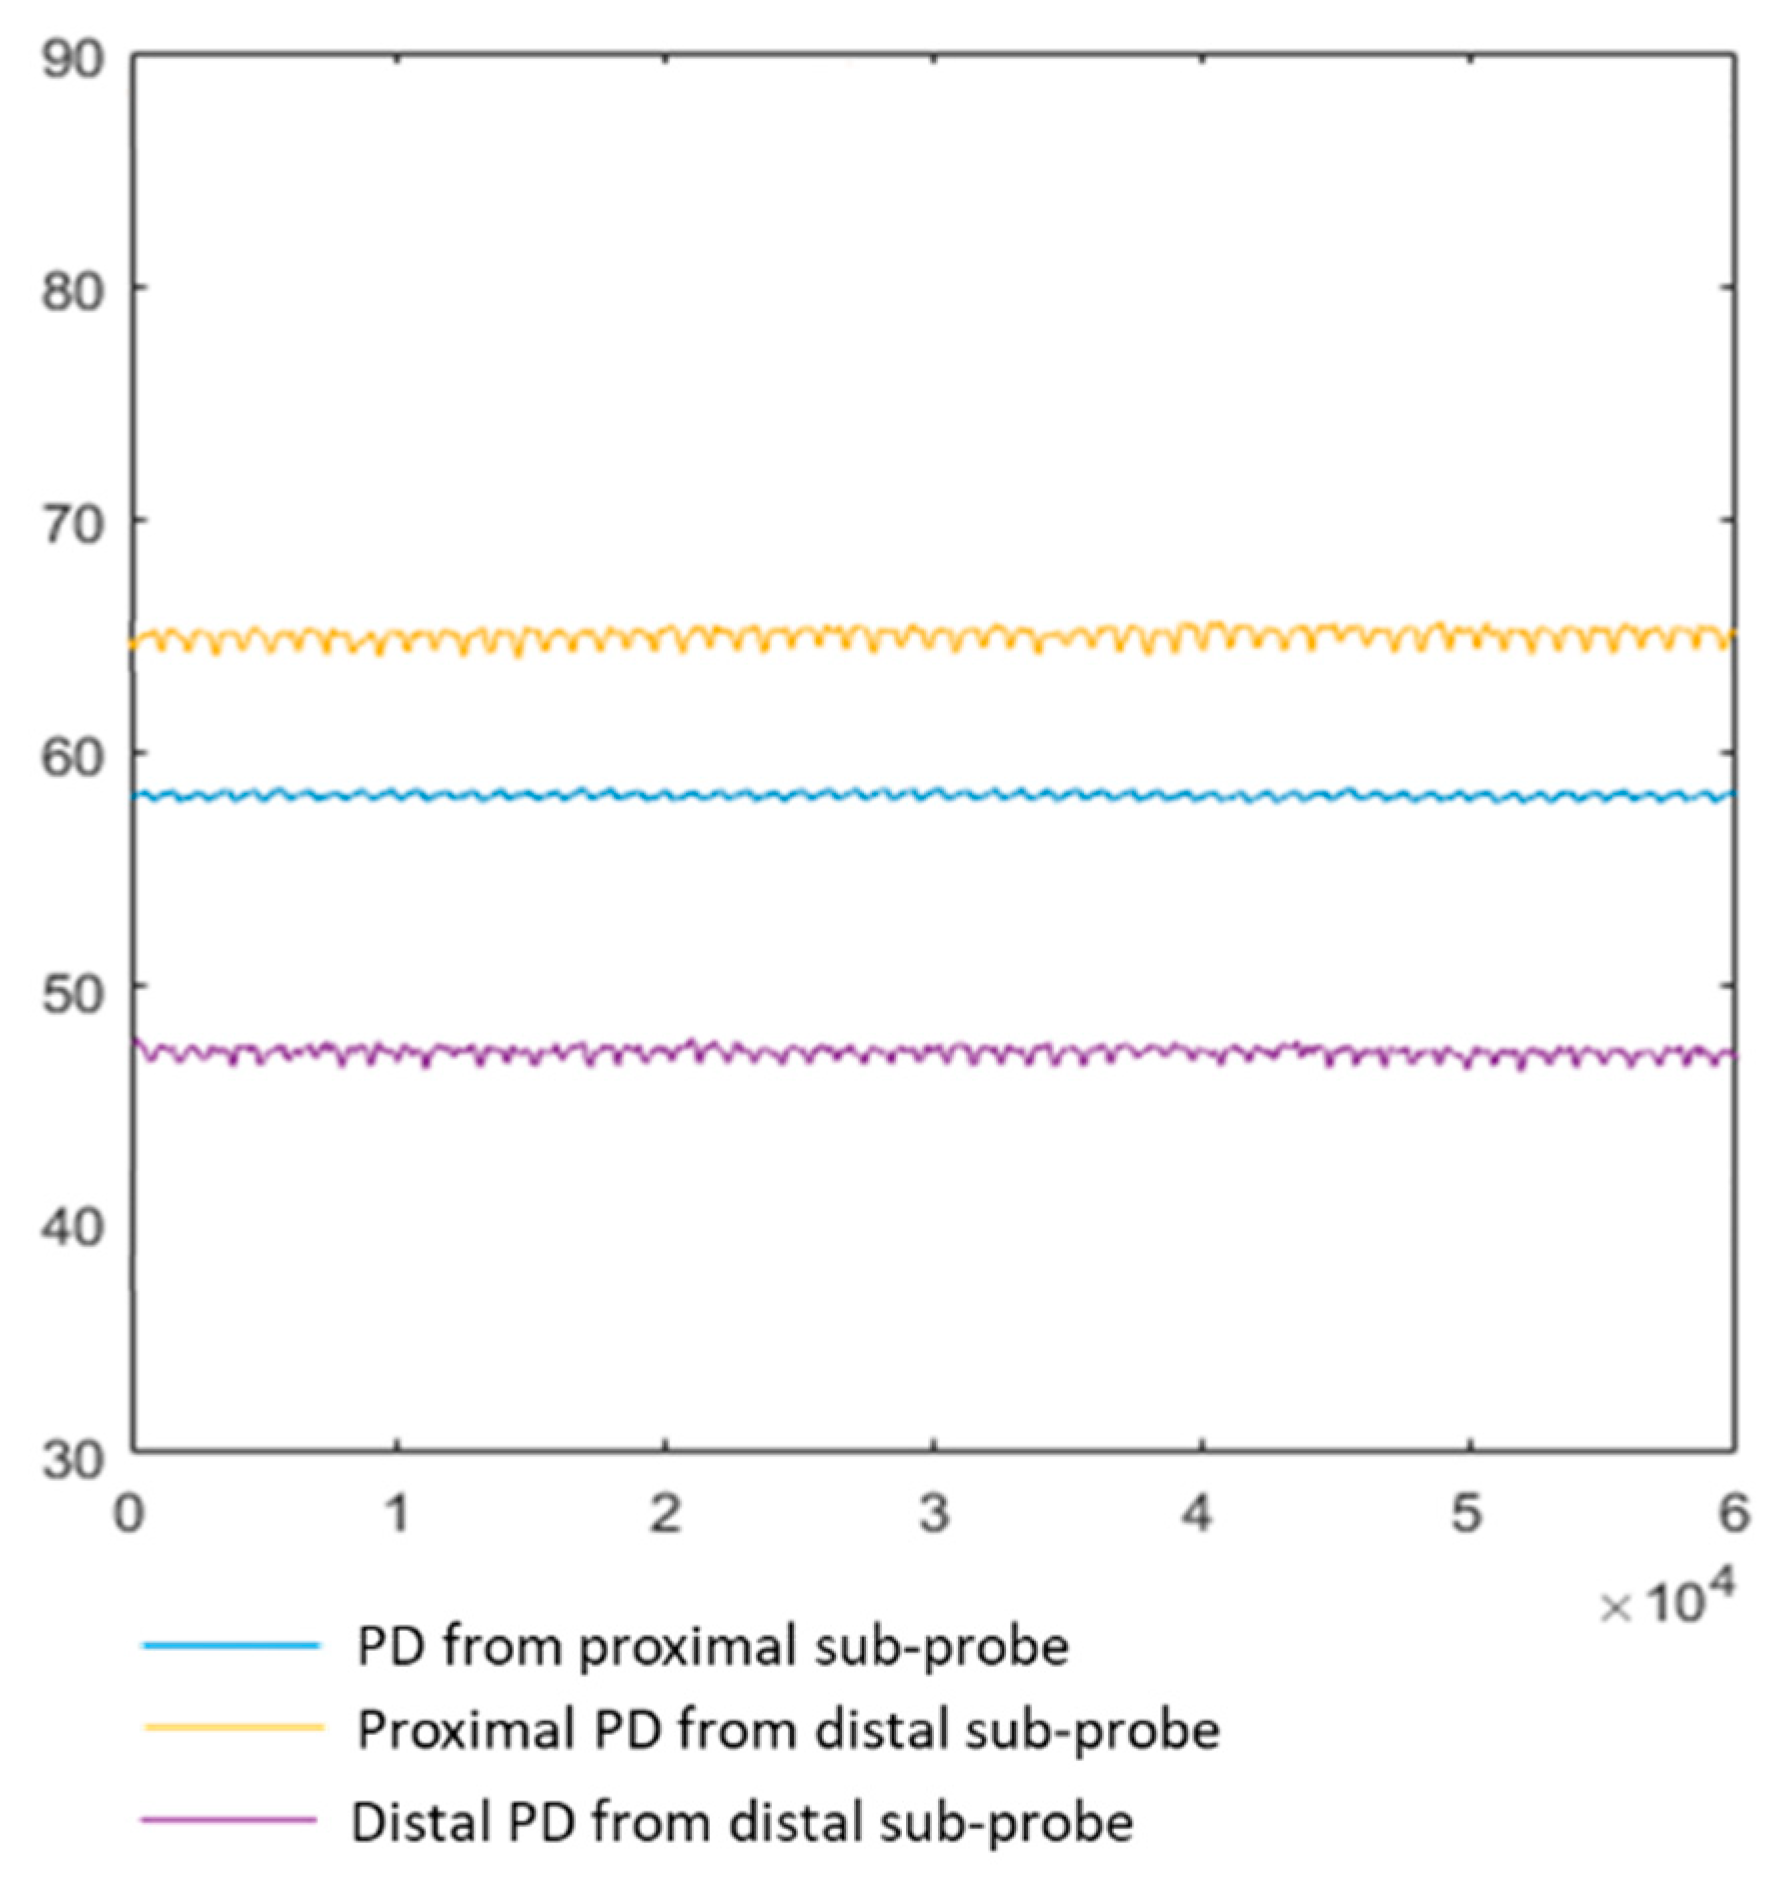
Photoplethysmograms (PPG) from one of the distal photodiodes are acquired to obtain volumetric information from the cerebral tissue. However, due to the spatial sensitivity profile of a reflectance probe, it is likely that the signals are contaminated by extracerebral information. Therefore, extracerebral volumetric signals are also acquired by the proximal photodiode in order to subtract them from the contaminated brain signals. The latter should result in the acquisition of only cerebral pulsatile signals for the further estimation of ICP from changes in their morphological features.
Table 1 describes the optical and electrical characteristics of the optical components selected to build the proposed multimodal probe.
3.1.2. Printed Circuit Board (PCB) Design
The PCBs for the probe and the processing system were designed using an electronic design automation software package known as Altium Designer (Altium Limited, Sydney, Australia) and were manufactured using a Computer Numeric Control machine (Elecrow, Shenzhen, China). Each sub-probe PCB has a circular shape, with a diameter d = 21 mm and boards of 1.6 mm thickness, in order to facilitate good contact with the forehead.
The four LEDs were placed in the proximal probe in a two-pairs configuration. Each pair of LEDs was connected antiparallel; this configuration permits the intermittent switching of the four LEDs when connected to the processing unit. The photodiodes were positioned over the middle horizontal axis of the sub-probes, aligned with each other.
3.1.3. Probe Case Design
Since the probe needs to be in contact with the skin, the optical components and PCBs are required to be isolated and protected to avoid short circuits, shunting (i.e., light reaching the photodiode without passing through the tissue), skin burns, or marks. Additionally, without an appropriate case, the photodiodes can be reached by ambient light, increasing dark currents and interference noise. Therefore, the following mechanical structure aimed to shield the optical components and facilitate the contact of the sensor on the skin. The probe case was designed in a 3D CAD design software (Solidworks 2021, Cambridge, UK) and 3D printed using a Formlabs black resin (Somerville, MA, USA). The design of each sub-probe case comprises a compartment and a cover. The two parts were designed and separately manufactured in order to enclose the PCB. Moreover, the cover of the proximal and the distal probes have different designs according to the optical components involved in them. A clip system at the back of each sub-probe case allows the attachment of the sub-probes to a snug-fitting headband. The band fits a range of sizes and has multiple marks to slide the sub-probes to different S-D distances. Both cases are detachable.
3.2. Instrumentation and Acquisition System
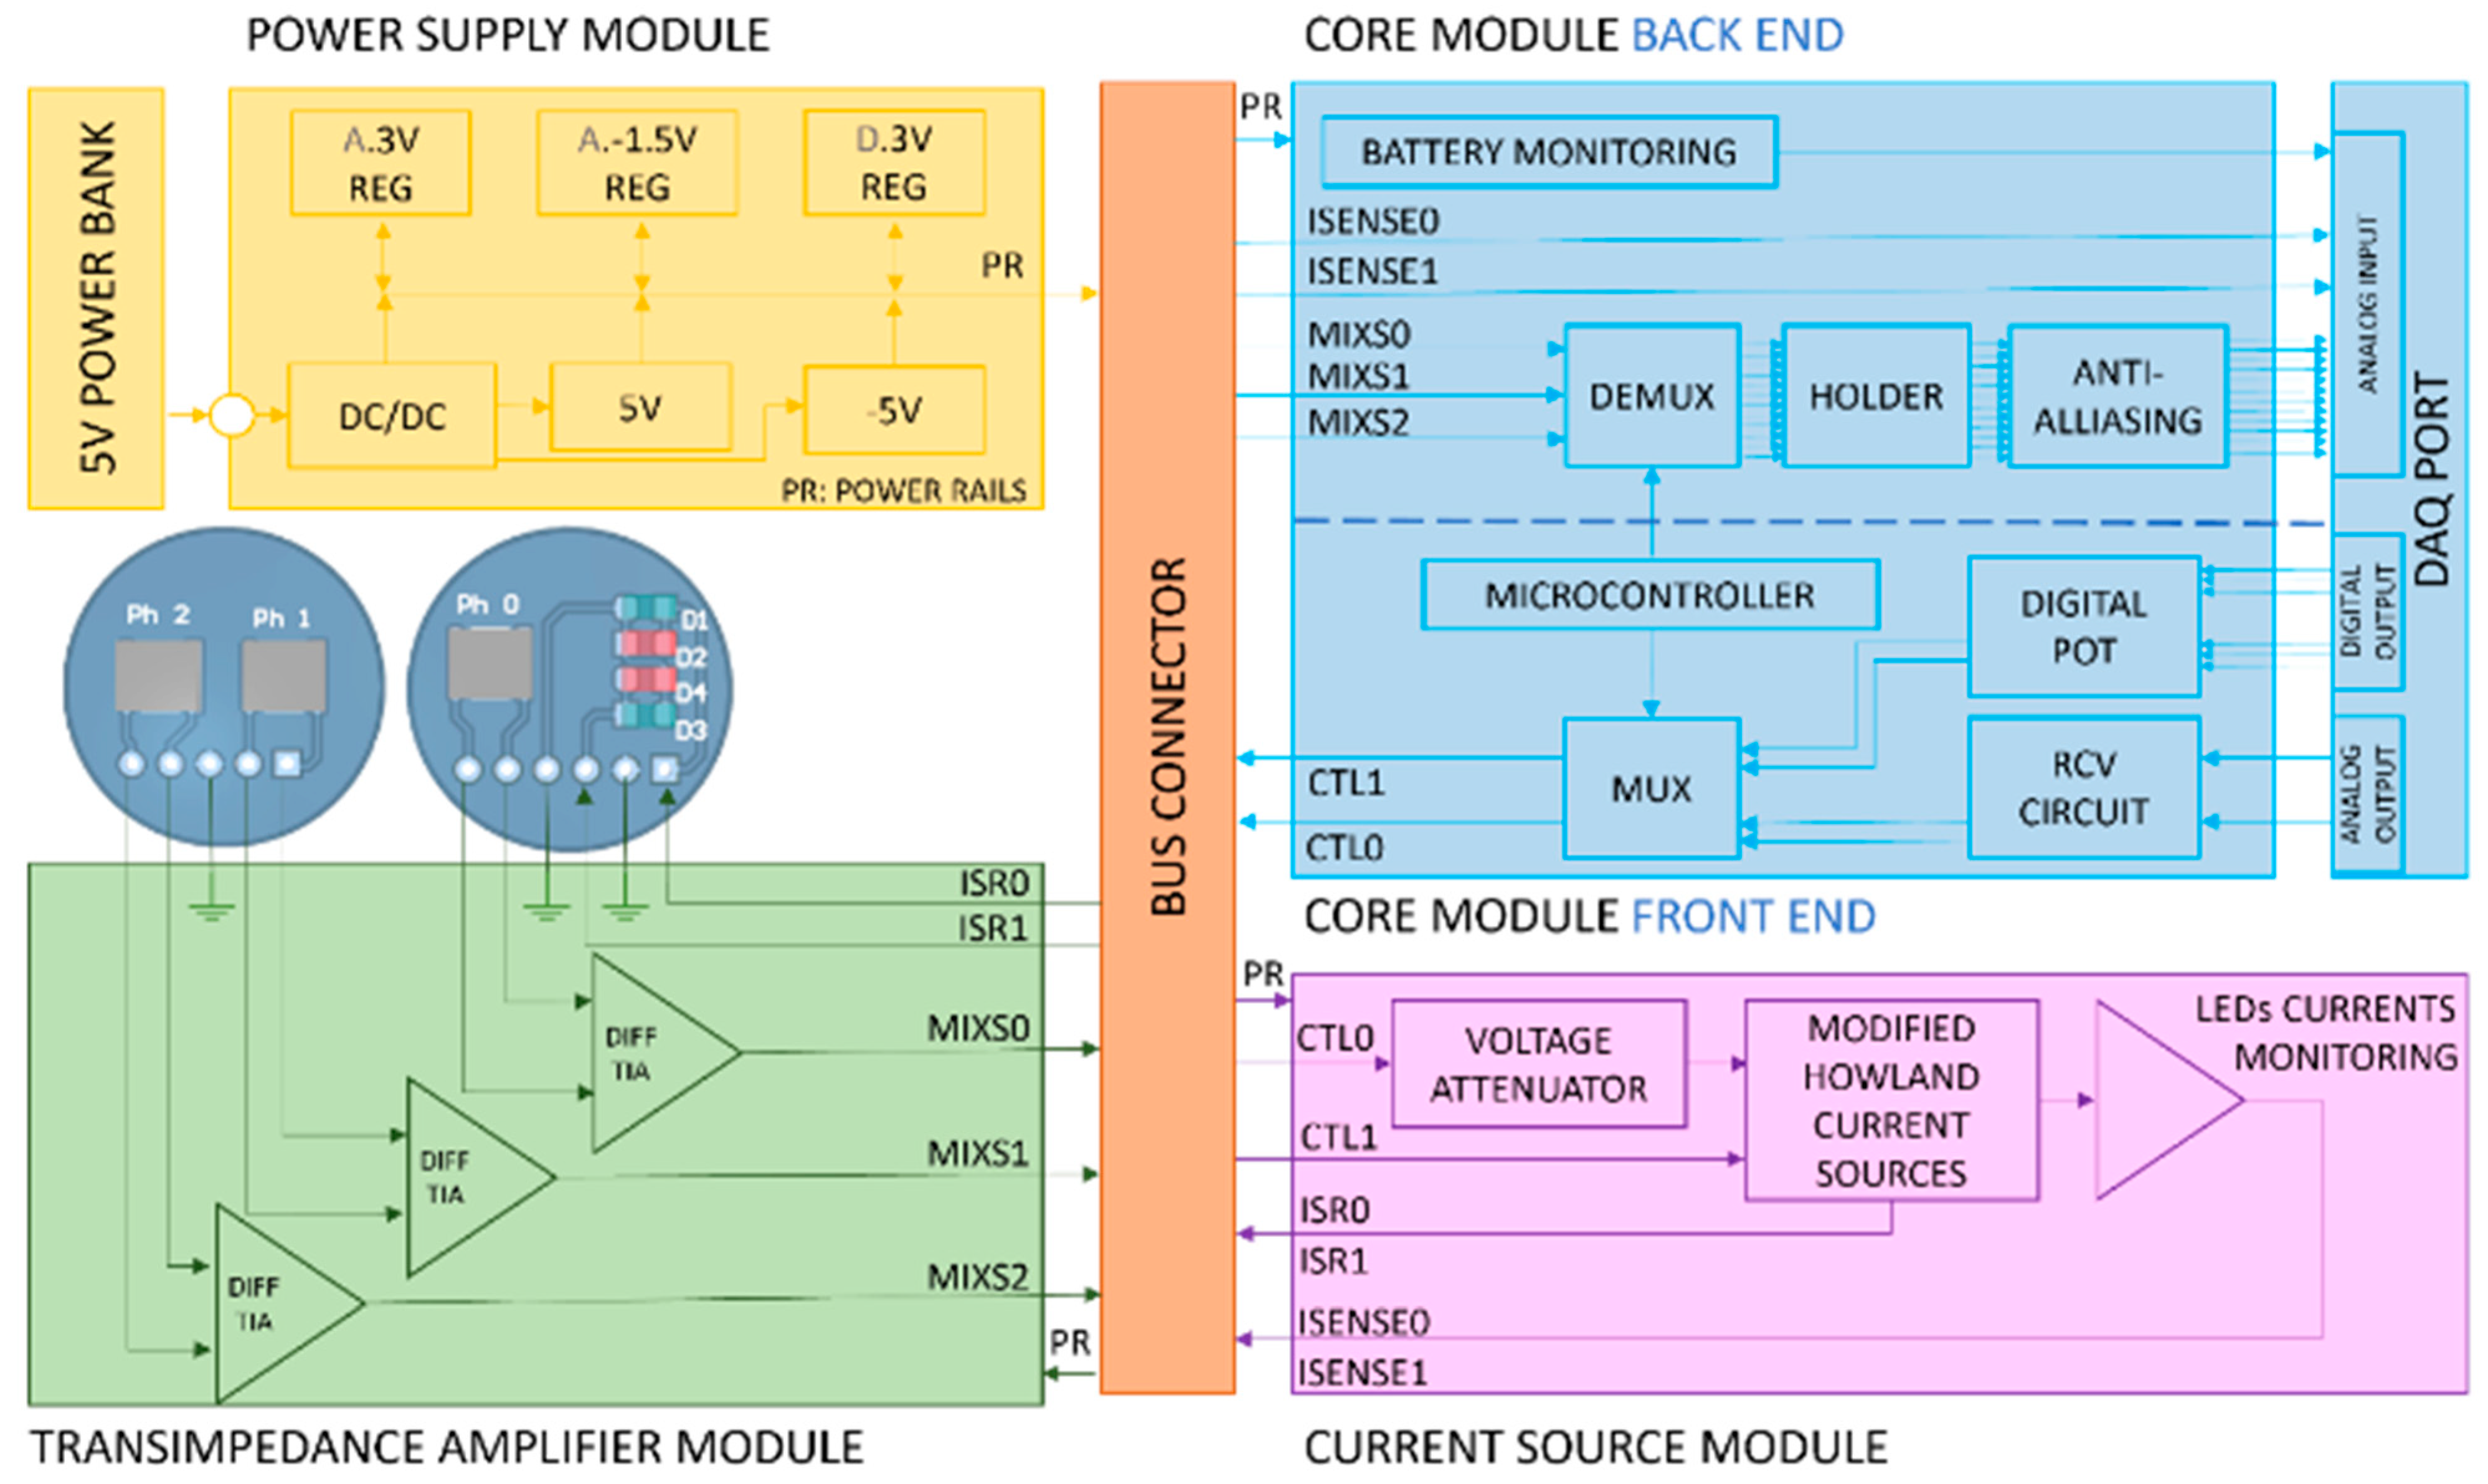
The processing system described in this section is called ZenTBI and consists of a four-wavelength, three-channel research PPG system composed of five independent and interchangeable subsystems. Moreover, three external devices are connected to the ZenTBI, namely, a 5 V power bank (RavPower, Shenzhen, China), a NI data acquisition card (DAQ) (National Instruments, Austin, TX, USA), and the probe.
Figure 2 shows the architecture of the ZenTBI. The dimensions of all the modules are 100 × 80 × 1.6 mm, except for the current source module and the bus connector. The dimensions of these two boards are 100 × 60 × 1.6 mm and 100 × 48 × 1.6 mm, respectively. All modules are double-sided copper-clad boards with a HASL surface finish that is generally preferred for hand-soldering.
3.2.1. Bus Connector
This allows the connection between a maximum of six modules, three at each layer. The modules are connected to receptacle 50-way surface mount connectors in which every pin at each connector corresponds to the same pin in all other connectors. Every pin has been assigned an unalterable net to ensure the transmission of the voltages and signals between boards.
3.2.2. Power Supply Module
This module is connected through a micro-USB port to a 5 V power bank with a capacity of 26,800 mAh (RavPower, Shenzhen, China). The board consists of the circuitry required to regulate the USB power supply into multiple DC power rails. The initial power bank supply (PS) passes through an isolated point-of-load DC–DC converter (ITX0505S), regulating the initial voltage to IPOS (5 V) and INEG (−5 V). This dual source powers the microchips on the Current source module and the multiplexers and demultiplexers included in the Core module. The DC power supply from the dual source is regulated down to APOS (3.3 V) and ANEG (−1.5 V) in order to power the remaining microchips on the processing system. However, from the DC-DC converter output, a separate digital power line is regulated down to DPOS (3.3 V) and has its own digital ground (DGND). The later power line supplies the microcontroller to avoid additional digital noise in the analogue signals.
3.2.3. Core Module Front End
The front end is responsible for the intermittent light switching control that allows the sampling of four wavelengths simultaneously. This part of the core board hosts four independent controls to set the emitters’ currents and a multiplexing circuit. Previous studies on reflectance PPG demonstrated that acceptable signal quality could be guaranteed without exceeding 50 mA LEDs driving currents [
22]. Accordingly, each current control was designed to allow a maximum drive current of 100 mA. The first and second controls are the DAQ analogue outputs (A0 and A1) connected to voltage attenuator circuits (RCV). Thus, from LabVIEW, A0 is set between 0 V and 5 V, while A1 can be defined between −5 V and 0 V. Both outputs were then attenuated down to 0 V to 1 V and −1 V to 0 V, respectively, using voltage dividers and op-amp buffers. These controls pass through a second attenuation phase at the beginning of the Current source module to finally obtain 0 to 100 mV and −100 mV to 0 V, respectively. Due to the limited number of analogue output channels on the DAQ card, the third and fourth controls consist of 10 K digital potentiometers (X9C103SIZT1) configured into two independent voltage dividers. One of them is supplied with 3.3 V and configured with a fixed resistor of 23 K, allowing changes between 0 and 1 V. The other is supplied with −1.5 V and configured with a fixed resistor of 5 K, creating the last output of −1 to 0 mV. Each digital potentiometer is controlled from LabVIEW, where three digital signals are generated to activate (CS) the chip, toggle the INC pin to move the wiper, and either increment or decrement the counter in the direction indicated by the logic level on pin U/D.
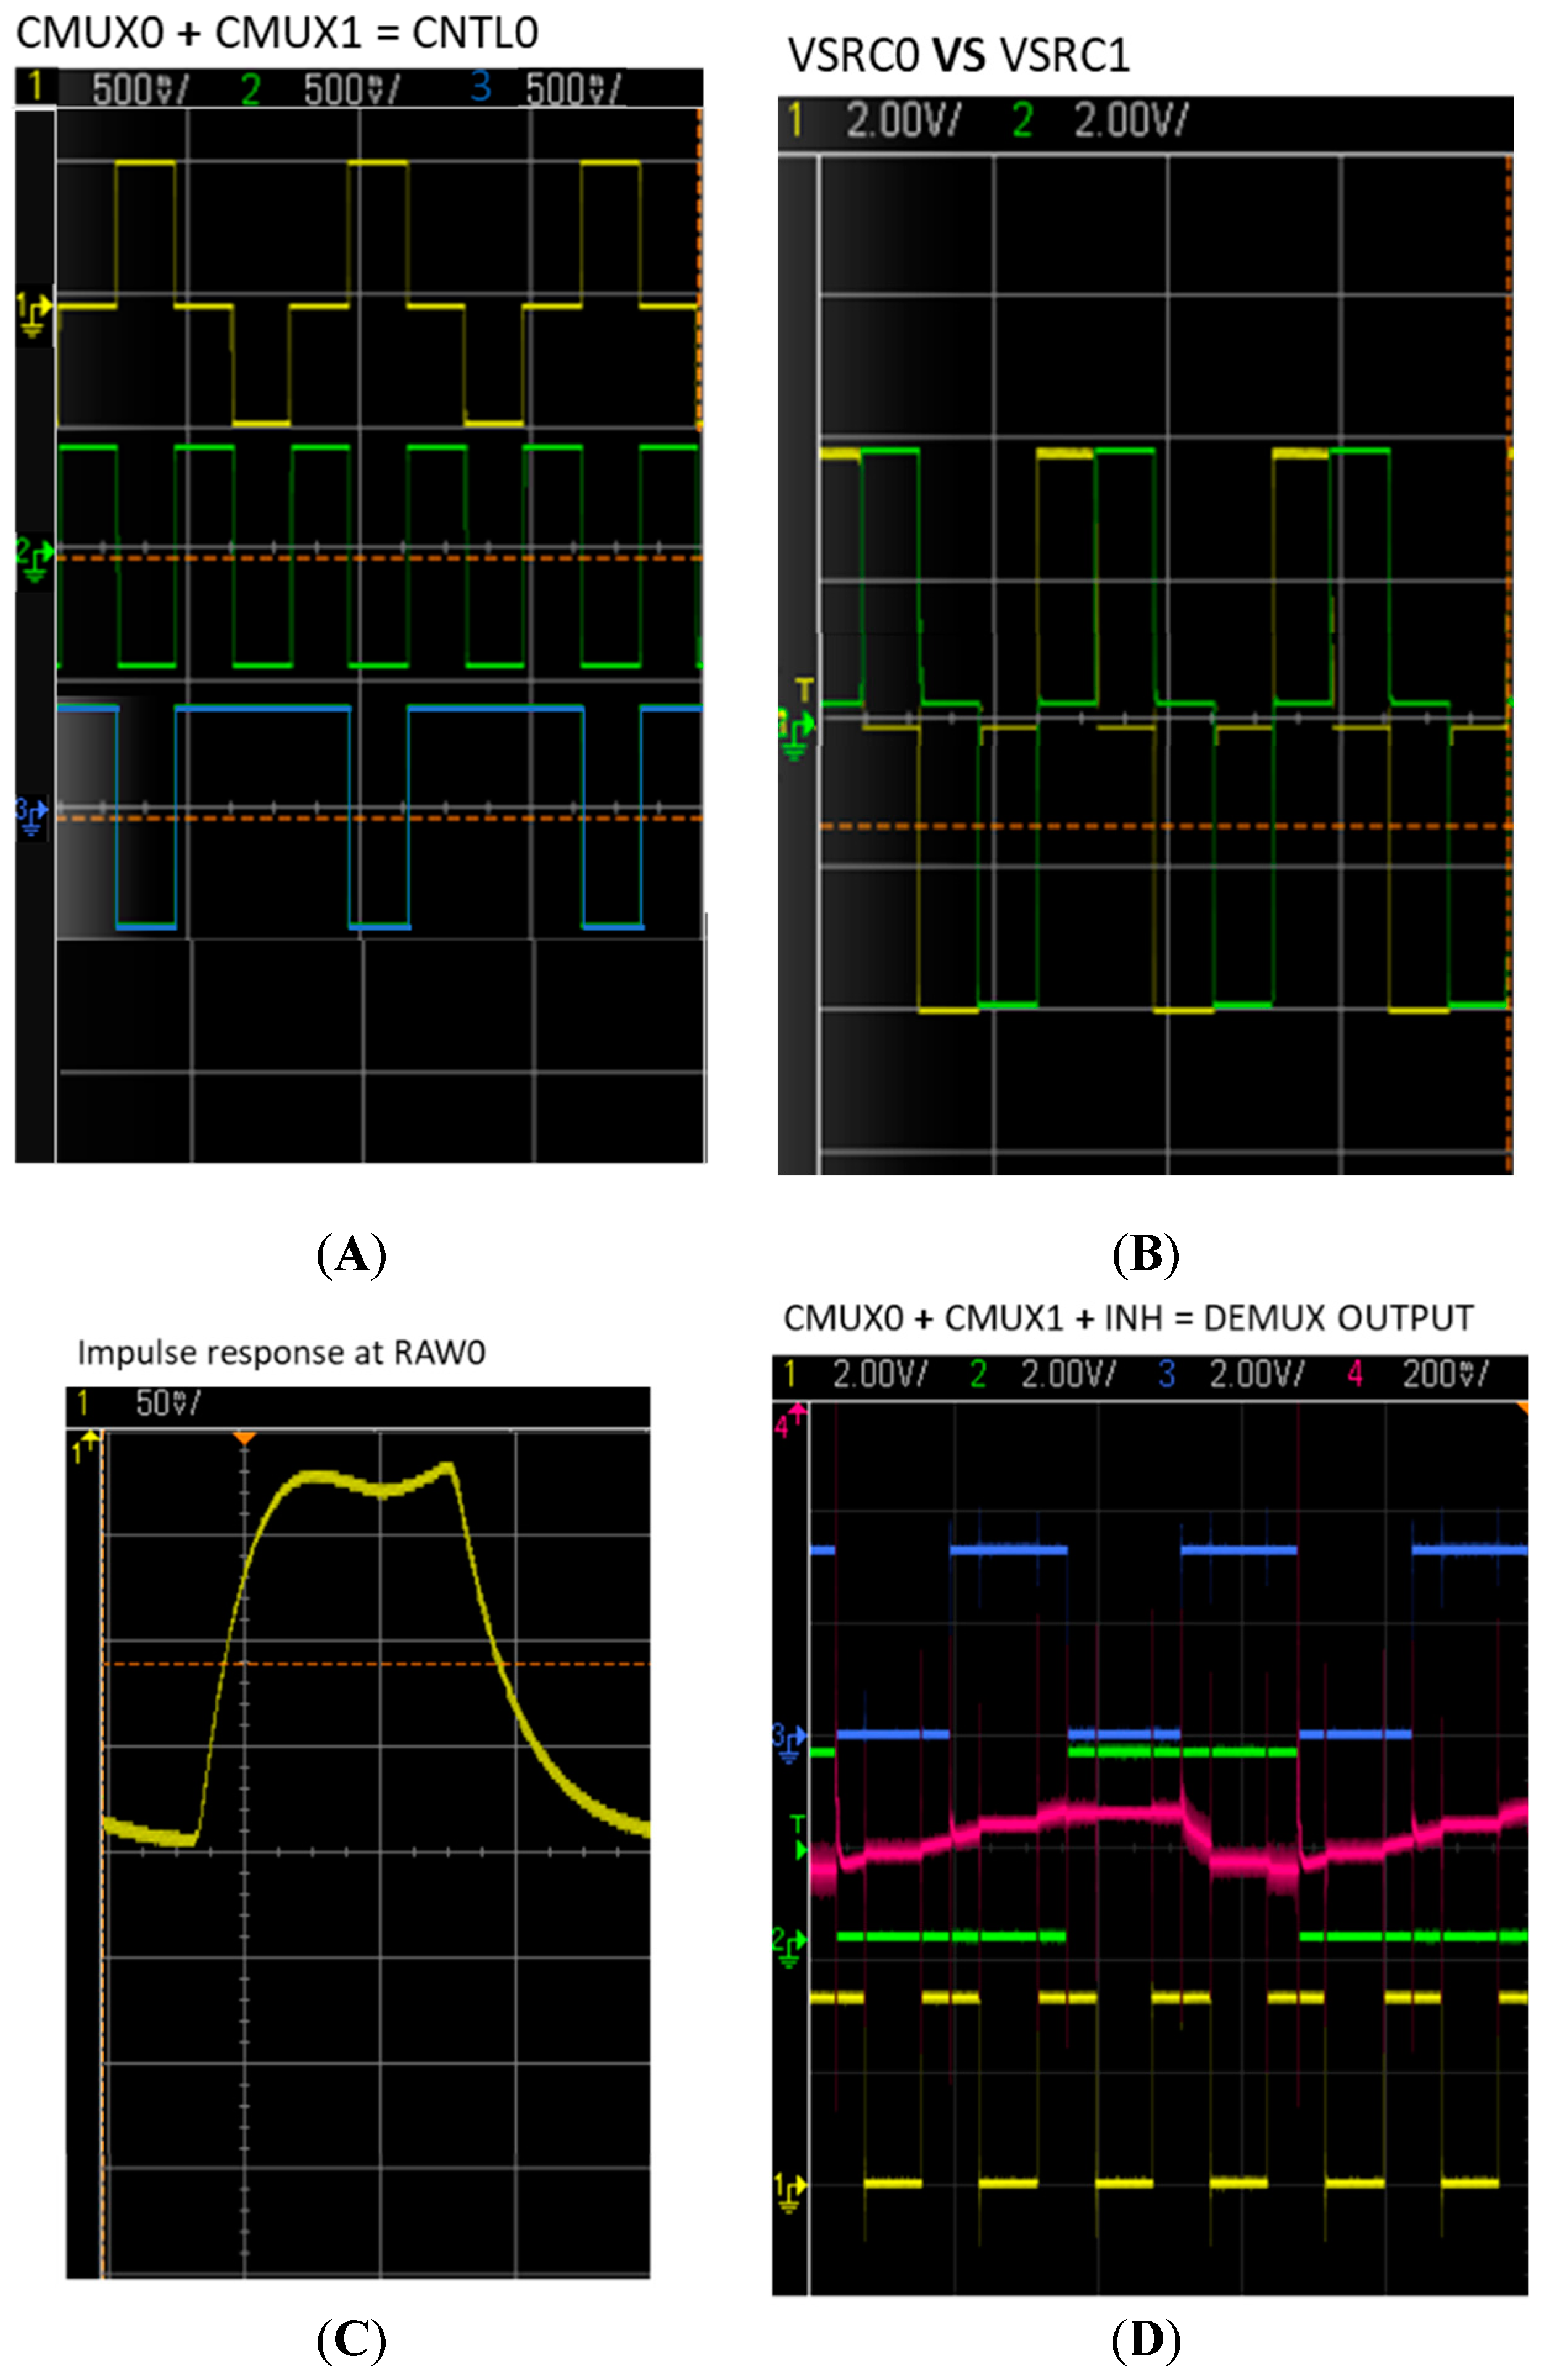
The multiplexing circuit generates timed switching signals used to turn on one LED at a time, which allows the independent sampling of light at each wavelength by photodetectors. All four current controls and the analogue ground (0 V) are connected to a double-pole four-throw multiplexer (MC14052BD). Each multiplexor pole selects one of the three input voltage signals (either positive or negative or ground) and outputs the selected input into a single line, producing two control lines called CTL0 and CLT1. Each control line switches a pair of LEDs. When CTL0 is either positive or negative, CTL1 output is ground (0 V), and vice versa. Due to the antiparallel position of the LEDs in each pair, when one of the control lines is positive, only one LED of the pair, controlled by that control line, is switched “ON,” and when negative, the other LED of the same pair is switched “ON.” The multiplexer switching time is controlled by an 8-bit Atmel ATtiny 2313–20SU microcontroller unit (MCU) (Atmel Corp, San Jose, CA, USA) at a frequency of 1 kHz. A byte data sequence is created using the multiplexer’s truth table and is written on port-D of the MCU.
The two control lines of the multiplexer are passed through the bus connector into the current source module, where the voltage is converted into the current required to power the LEDs. The duration time of each LED “ON” is calculated by Equation (6). Having a sampling frequency of 1000 Hz, three photodiodes, and four wavelengths, each emitter turns “ON” every 2.5 ms.
Equation (6): Duration time of each LED “ON” (t), sampling frequency (Fs), number of photodiodes (), and number of wavelengths ().
3.2.4. Current Source Module
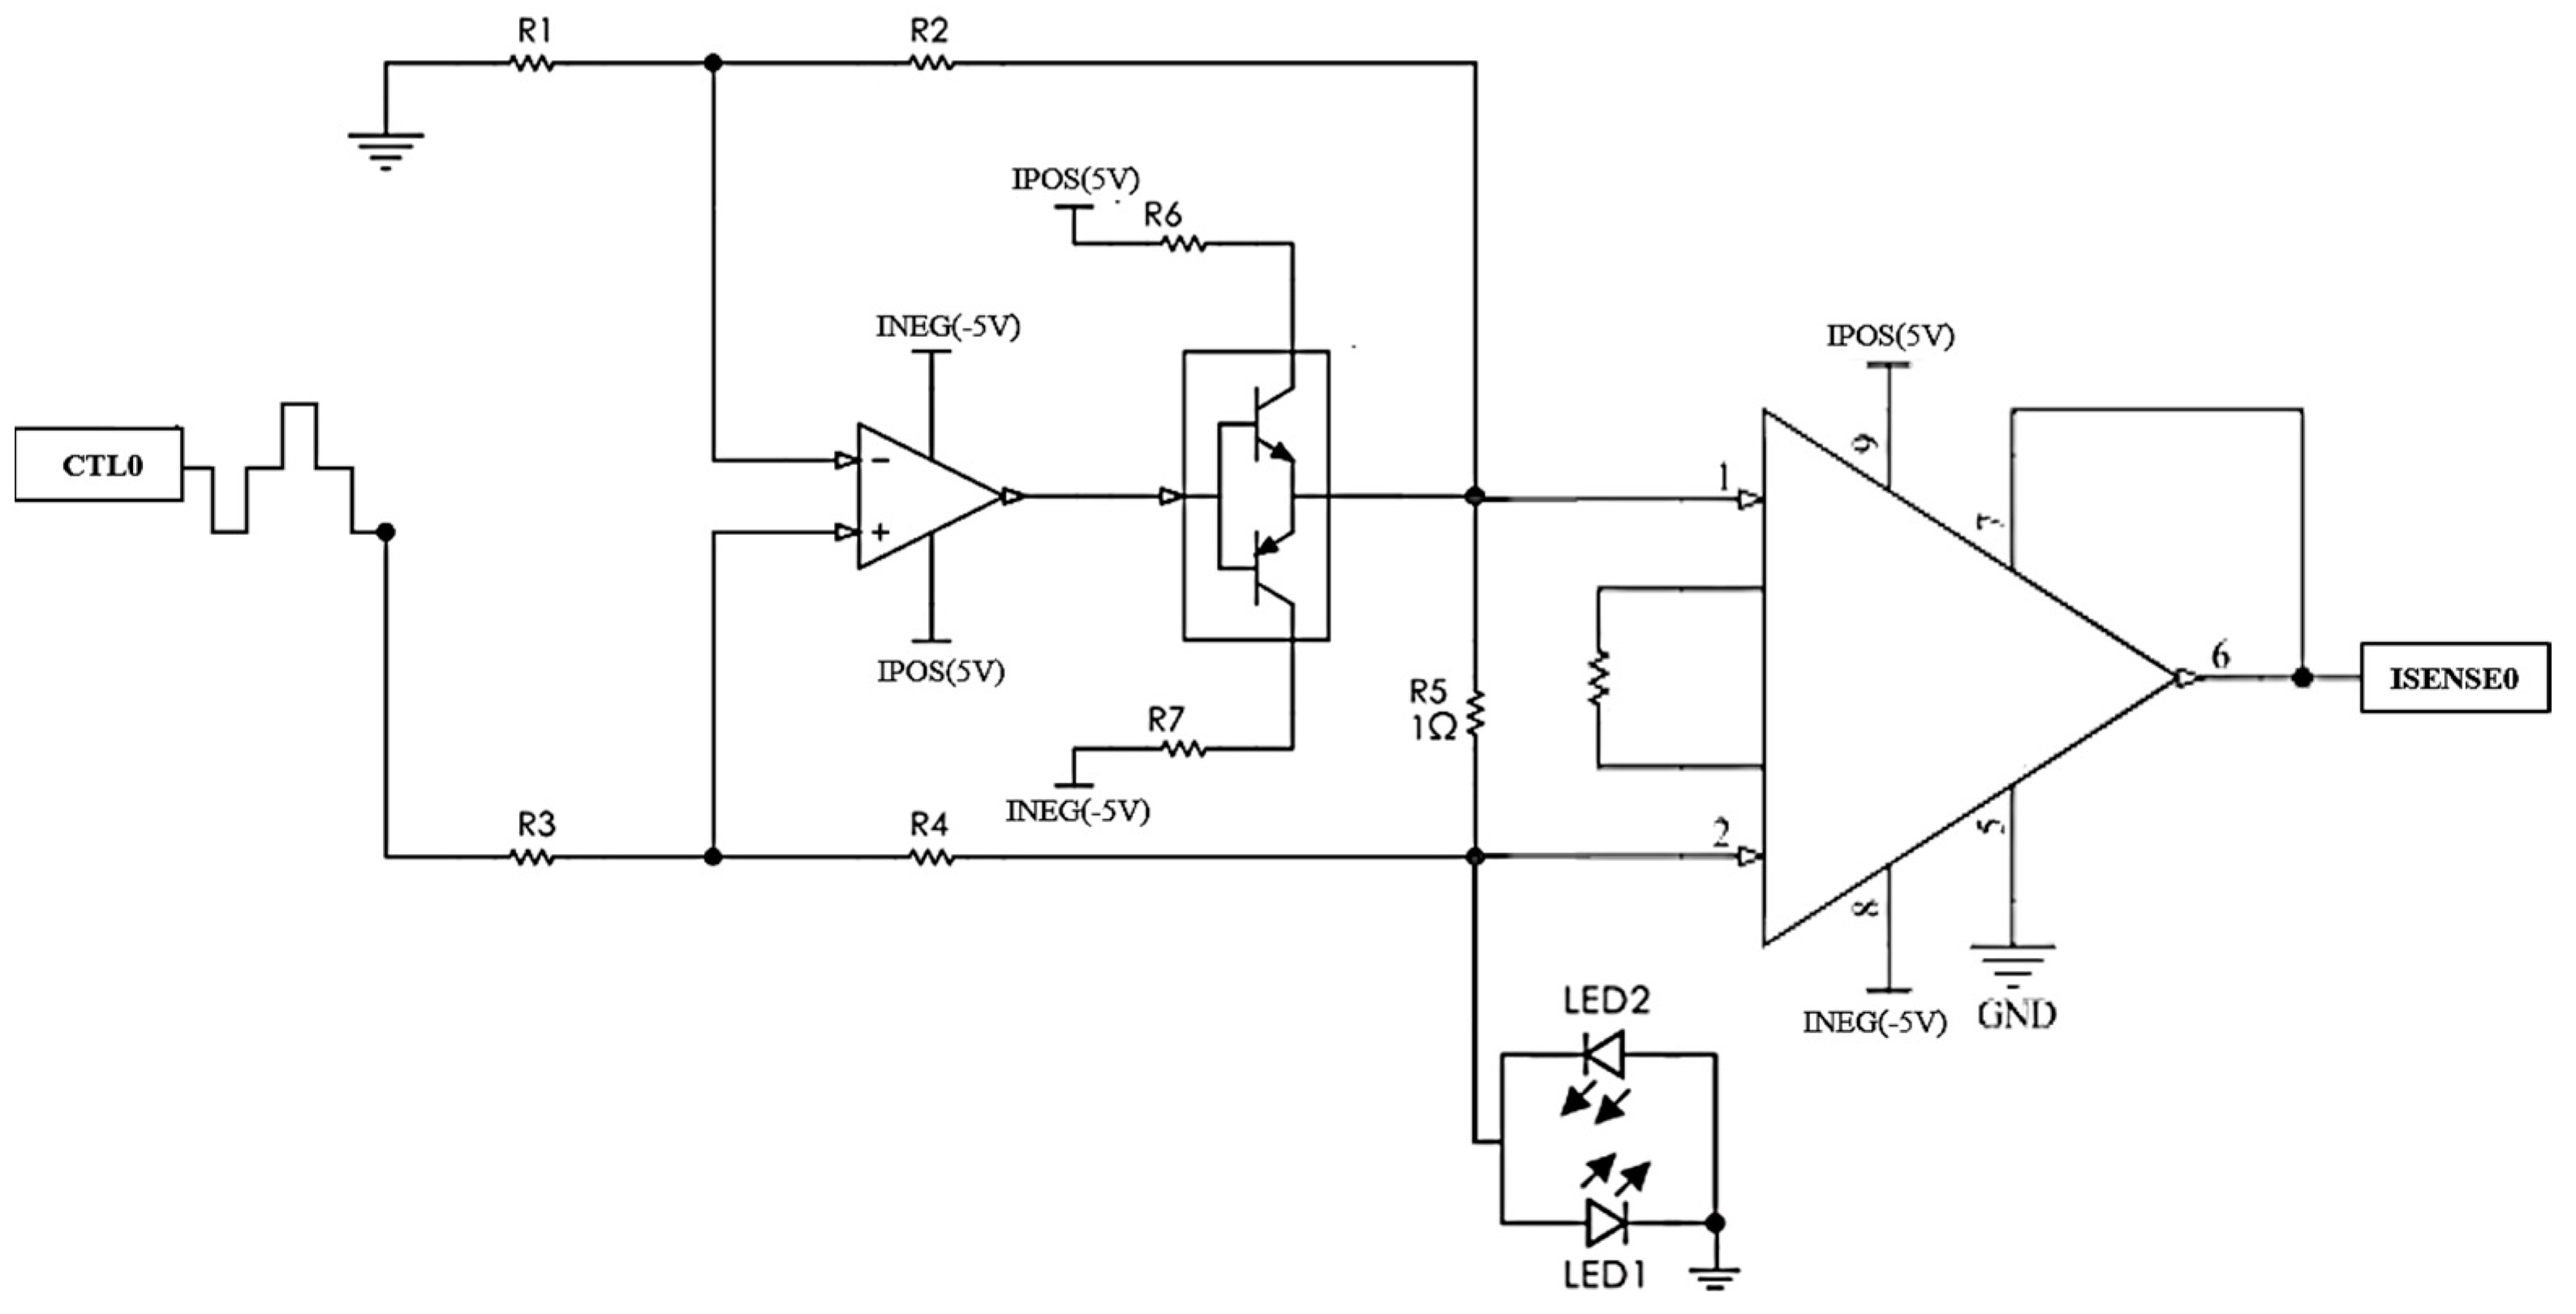
This module has two main functions: (1) to limit the current driven through the LEDs to a maximum of 100 mA, avoiding damages in the probe and causing potential skin burns for overheating the emitters; and (2) To measure the current across each LED, providing feedback to control the LED currents. In order to accomplish the first function, the module involves two identical and improved Howland current sources followed by a push–pull (npn-pnp) transistor switch. The Howland is unique and interesting because it has both positive and negative feedback paths, as is shown in
Figure 3. When the array of resistance balances the feedback paths (R2/R1 = R4/R3), the operational amplifier behaves as a linear voltage-controlled current source [
23].
The input voltage is thus proportionally converted into the current to supply the emitters. The amplifier plays a key role in the Howland pump, especially as it is controlled by a high-frequency switching dual input with interleaved grounds. Therefore, the Current source module of the Zen TBI involved a high slew-rate op-amp (AD8058 SR: 1000 V/µs.) to ensure precise emitters’ switching. However, op-amps cannot deliver sufficient current to power the LEDs, so a push–pull (npn-pnp) transistor switch is connected to the output of the Howland operational amplifier.
In this circuit, when the current source driving voltage is positive, the npn transistor is active and switches one emitter “ON” and, when the driving voltage is negative, the pnp transistor is active, switching the other emitter “ON”. The maximum current supplied to the LEDs can be limited by resistors R6 and R7 when the transistor is saturated. Finally, the module included two identical instrumentation amplifiers to accomplish the second function of this board, measuring the current across the LEDs. The voltage drop across R5 is measured by the differential input of the instrumentation amplifier. According to Ohm’s law, the current that flows through R5 is equal to the voltage divided by the resistance, as R5 has a value of 1 ohm, the current that powers the LEDs is equal to the output of the instrumentation amplifier (ISENSE).
3.2.5. Transimpedance Amplifier (TIA) Module
The transimpedance amplifier (TIA) module converts the photons detected by the photodetectors into mixed voltage signals from multiple wavelengths. The module hosts one female DB15 connector for interfacing with the TBI probe. For the ZenTBI, three identical differential TIA circuits were implemented, one per photodiode. In this particular TIA topology, the photodiode is connected between the negative inputs of two operational amplifiers, each with a gain resistor in a negative feedback configuration. Their outputs are driven into a differential amplifier, allowing the common-mode rejection of coupled noise. For PPG applications, it is important to use op-amps with large bandwidth and open loop gain, as well as include a phase compensation capacitor to provide stability to the circuit [
18]. Accordingly, the TIA circuits use an OPA2380 (bandwidth = 90 MHz and open loop gain = 130 dB), that includes a carefully calculated compensation capacitor (2.9 pF).
Moreover, the signal amplification is manually adjusted by two external resistors that are connected to the differential amplifier INA331. The gain of this specific op-amp is described in its datasheet as G = 5 + 5 · (R2/R1), and since the common noise is cancelled before signal amplification, the detection of small amplitude PPG becomes easily possible. The equal gain of the distal photodiodes transimpedance circuits is key to ensure linearity; therefore, R1 and R2 are trimmers that allow a precise gain configuration. The DC outputs of both photodiodes were compared using a homogeneous phantom to set equal gains.
3.2.6. Core Module Back End
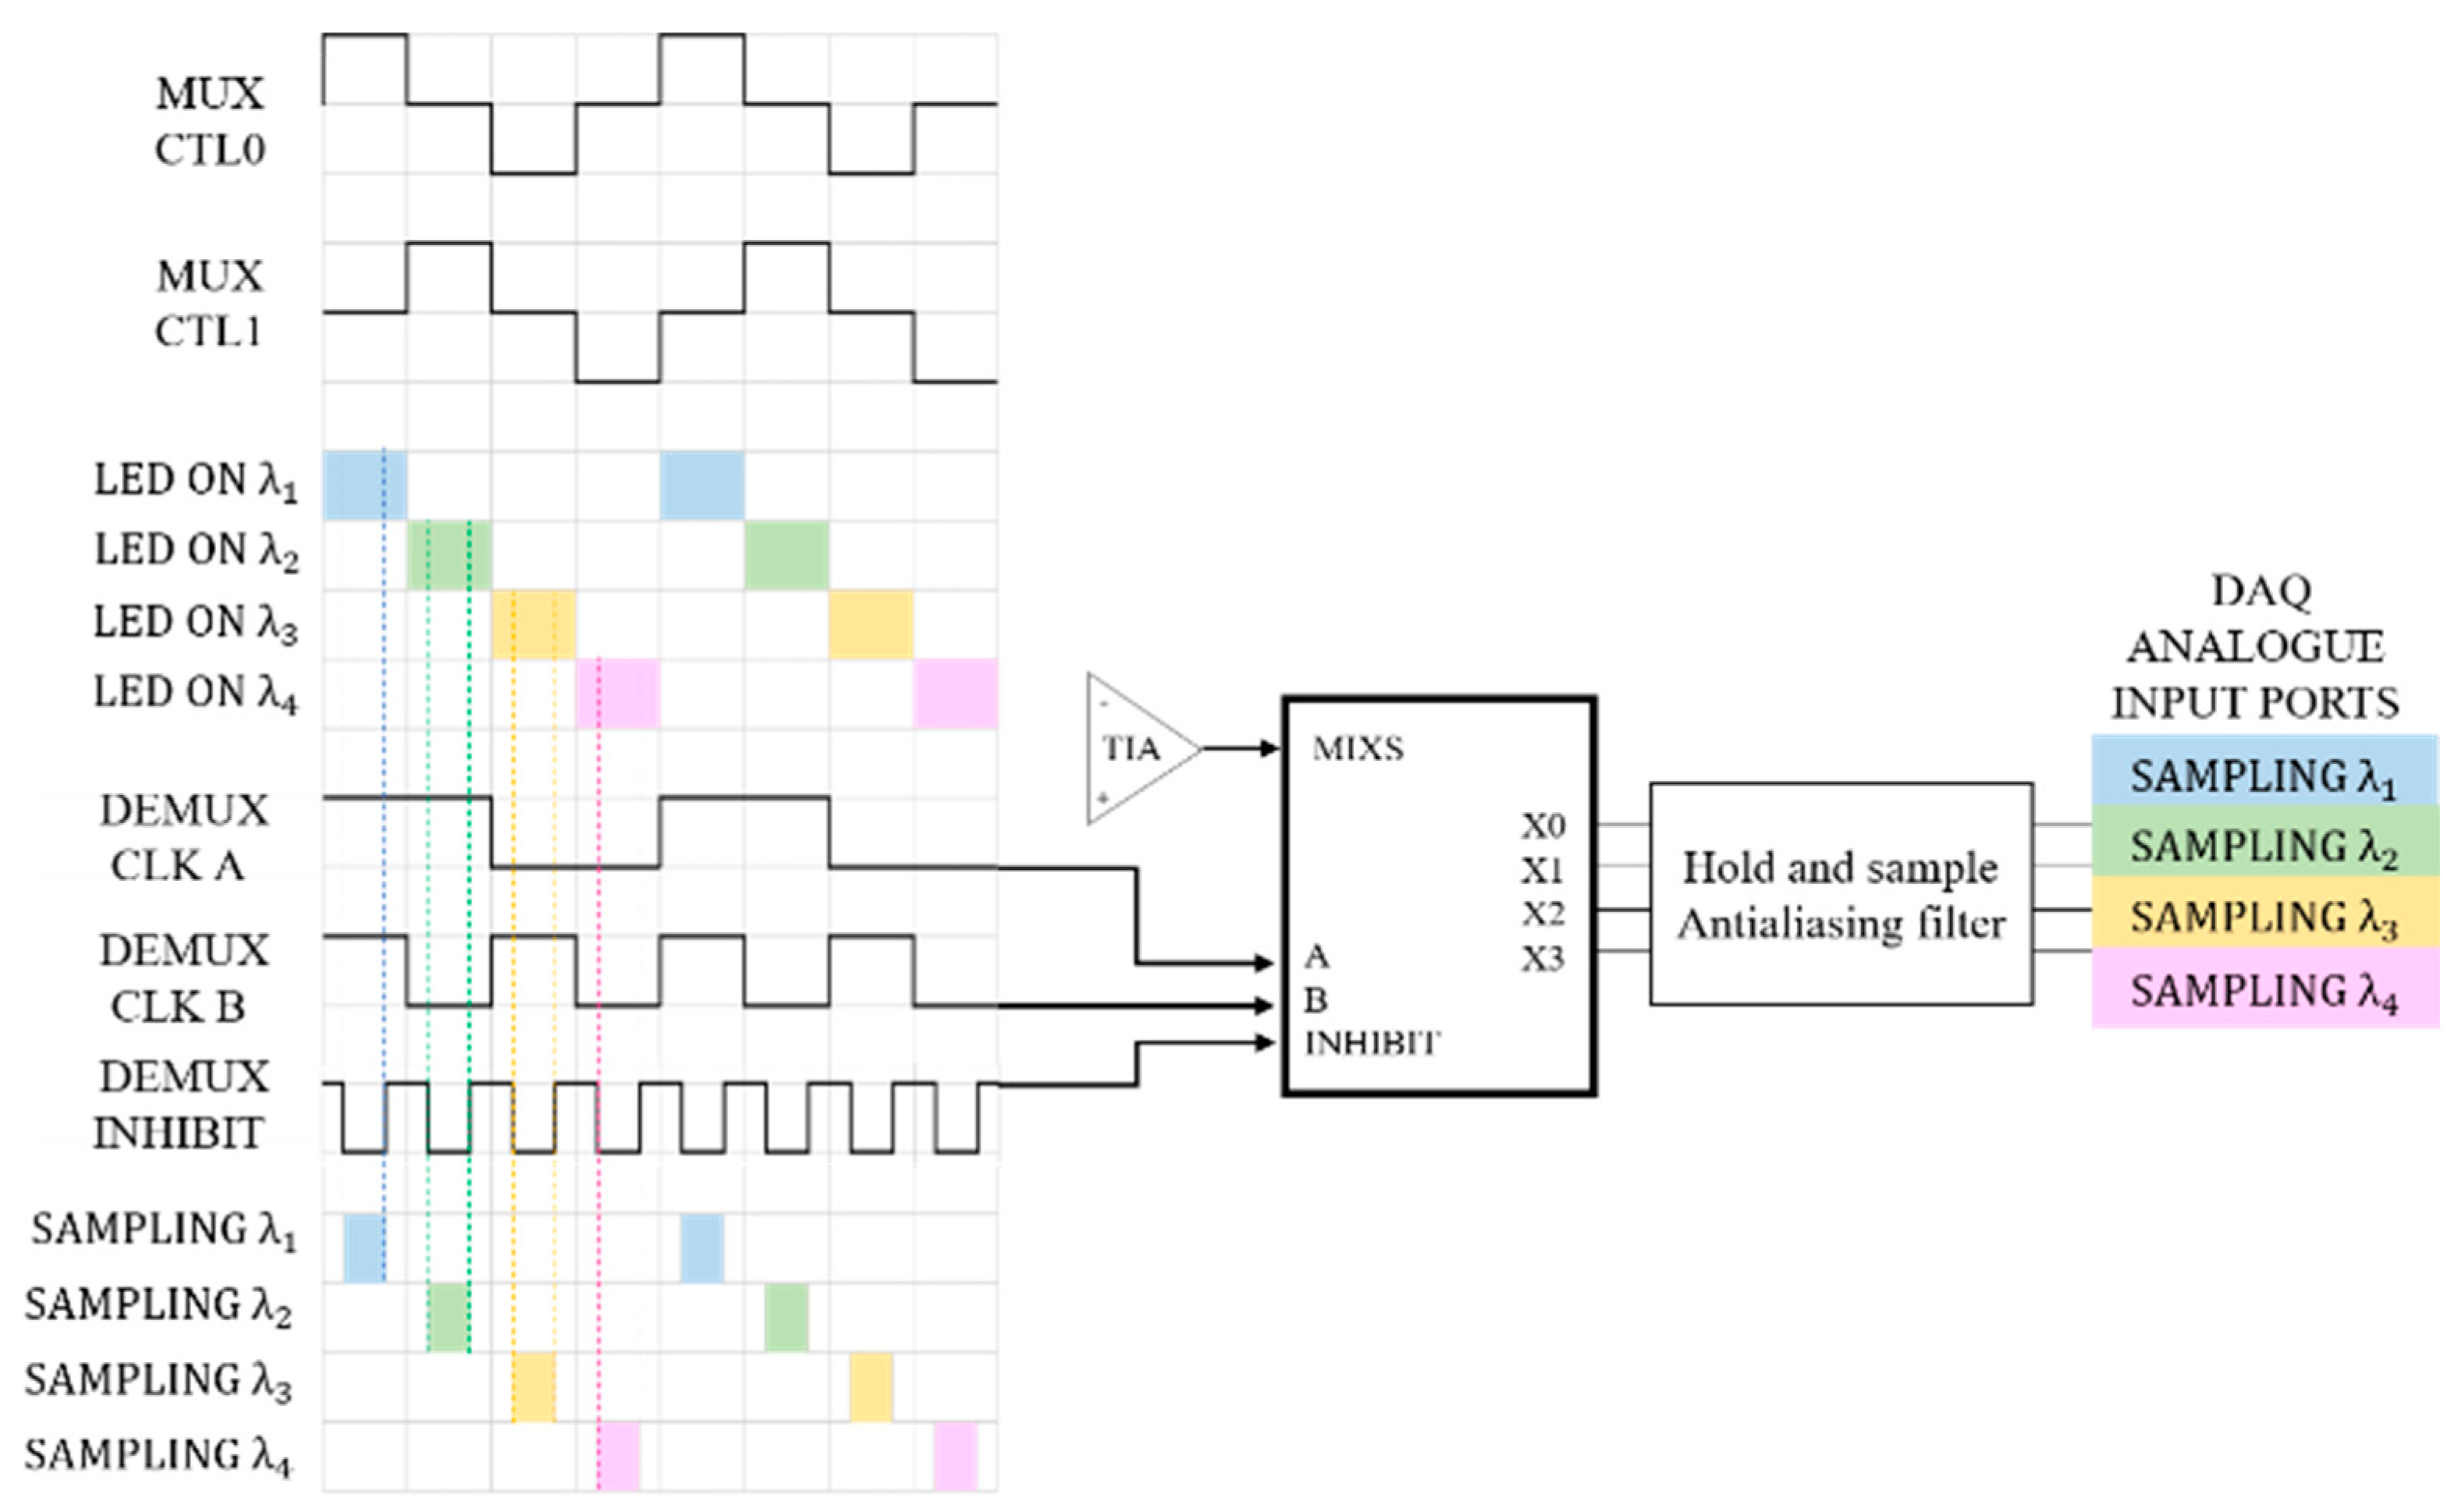
The core module back end is mainly responsible for separating the mixed signals from each TIAs output into four independent raw signals containing information at specified wavelengths. As mentioned earlier, the port-D of the microcontroller is used to generate four clocks for multiplexing the LEDs. However, port-B of the MCU is programmed to output another three clocks used for synchronizing the demultiplexer, which separates the mixed signals into independent wavelength components. Clocks A and B control the internal switches of the demultiplexer to separate the mixed signal into four outputs. As the clocks of both ports D and B are synchronized, it is possible to sample a specific wavelength at each demux output. However, when an LED is switched from one state to the other (ON/OFF), there is a slight delay between the transitions, called the transient response of a diode. Therefore, by sampling the entire LED activation period, the switching noise is also sampled. To overcome this problem, the demultiplexer inhibits control and is activated during these transitions, limiting the sampling period only to the middle of the signal, where it is expected that the signal has enough time to settle before sampling (
Figure 4).
Moreover, it is necessary to ‘hold’ the sampled voltage until the next clock pulse triggers a new acquisition. Accordingly, a hold capacitor is placed at the output of the demux ports, followed by a buffer circuit that offers a high impedance to the hold capacitor to keep the held voltage from discharging prematurely. Previous studies have tested different hold capacitors for PPG signal sampling, establishing that a 220-nF capacitor provides an optimal performance [
18].
After the hold buffer, individual antialiasing filters with a cut-off frequency of 80 Hz were implemented. These passive RC filters limit the bandwidth of the signals and stop the high-frequency switching noise from corrupting them. Every low-pass filter output is the input of an op-amp buffer before the signals are passed onto the NI DAQ card for digitization and further analysis. The raw signals are sampled at 2 kHz and contain both AC and DC components, which are later separated digitally using LabView digital filters.
Finally, the core module back end also allows the digitalization of the battery’s state and LED’s current monitoring, which are displayed on the LabVIEW interface to give the user an indication of the battery’s state of charge and to adjust the LED’s intensity on demand.
3.3. Technical Evaluation
The technical evaluation consisted of three sections. Firstly, the input and output of each of the ZenTBI modules were evaluated using an Oscilloscope. Secondly, the power consumption was calculated by measuring the voltage over a 1-ohm resistor placed in series between the battery and the ZenTBI supply input. According to Ohm’s law, the voltage measured with a digital multimeter corresponded to the current consumption (I = V/R).
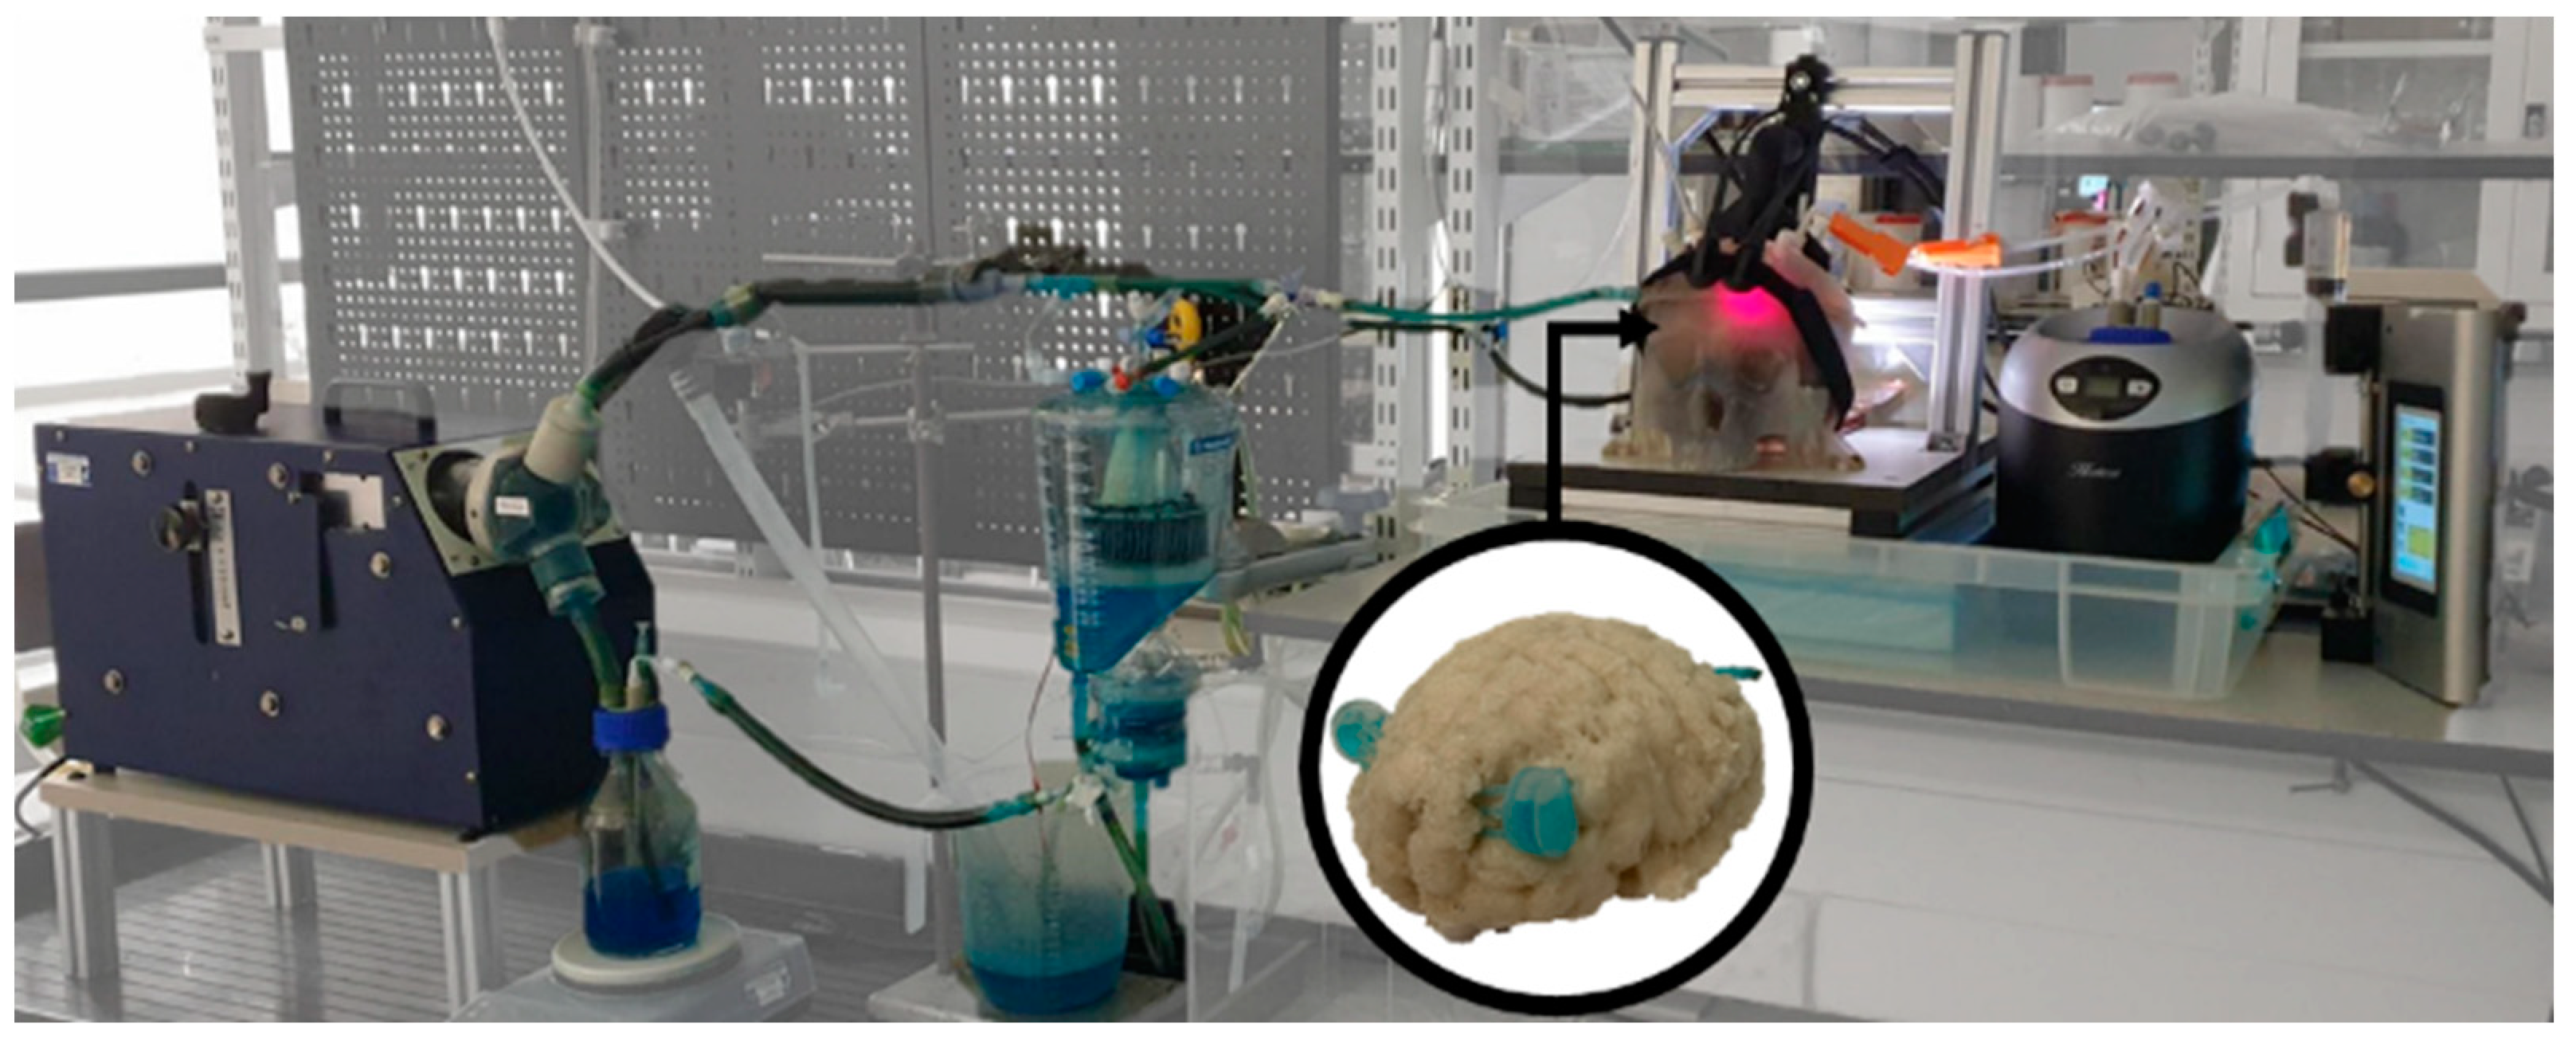
Finally, a quality evaluation of the optical signals was conducted in MATLAB to demonstrate the functionality of all the components of the system. A head phantom was used to simulate pulsations on the cerebral arteries that could be measured by the optical sensor [
24], as is shown in
Figure 5. The use of a head phantom rather than a human head allows the control of multiple parameters such as the oxygen levels and the intracranial pressure. Moreover, the lack of scalp or extracerebral circulation ensures the acquisition of signals only from the cerebral arteries, reducing this confounding factor. Moreover,
Table 2 presents the parameters of the setup.
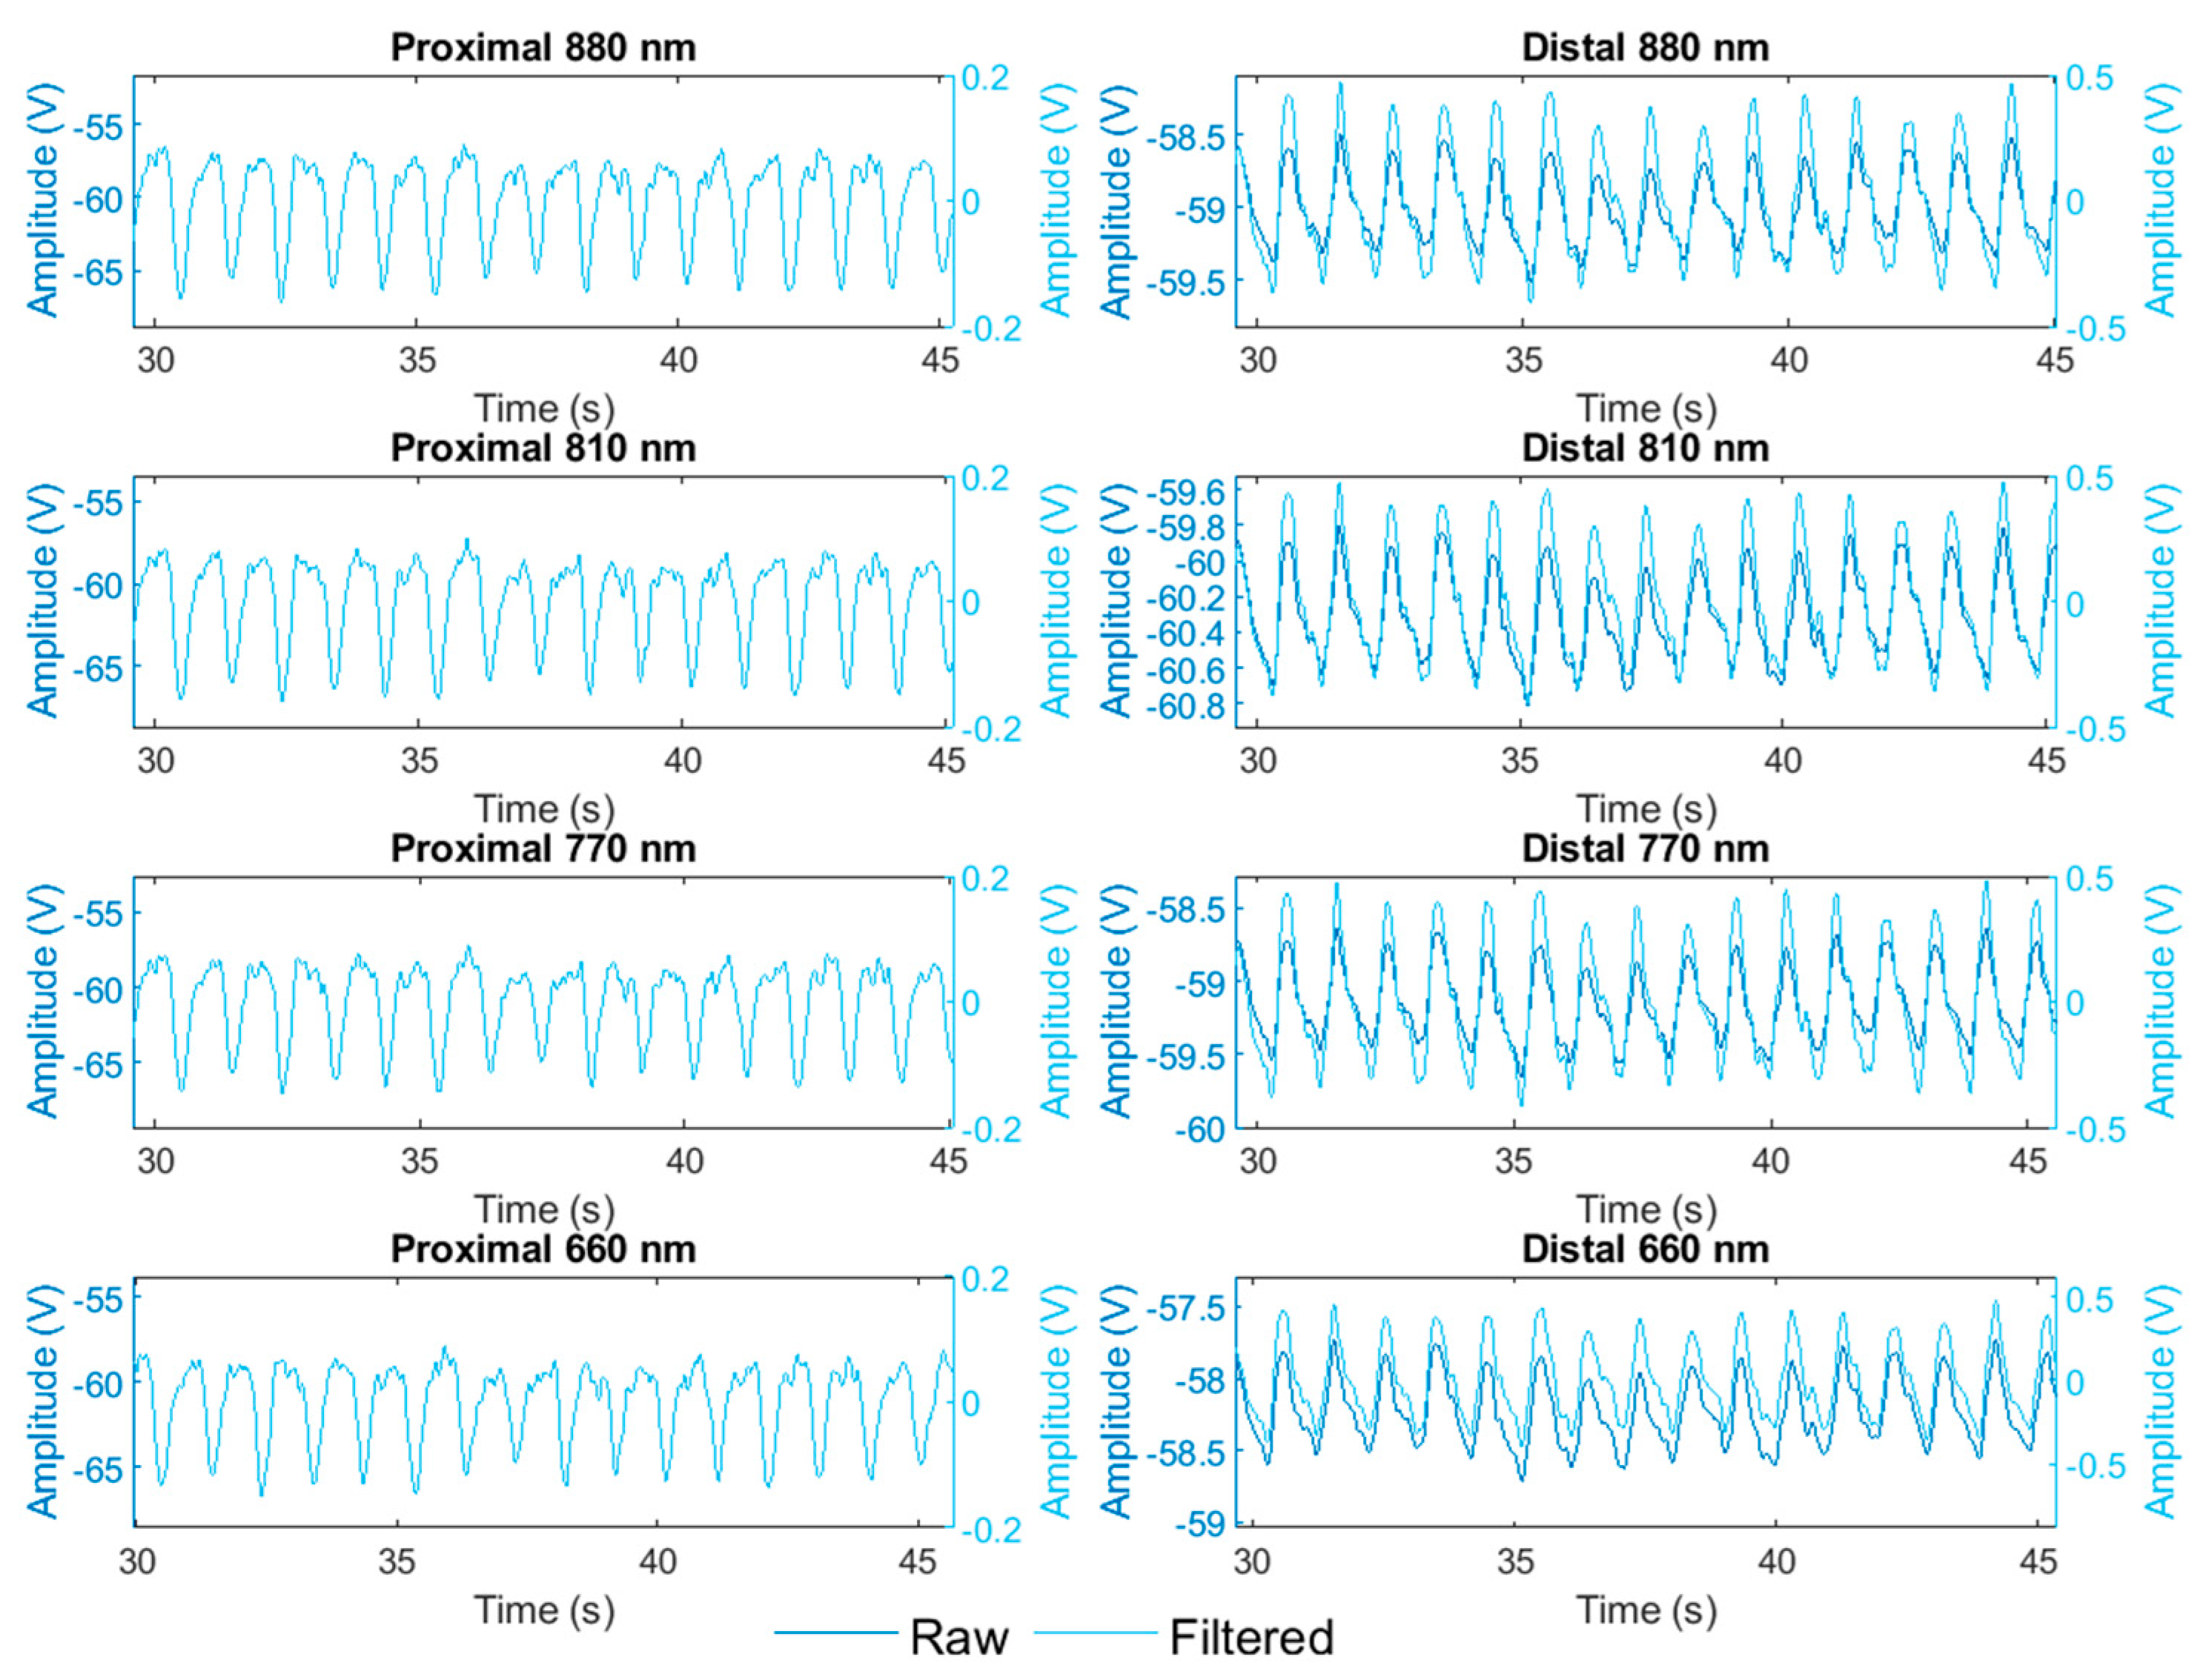
The analysis included a pre-processing step, where the signals from all wavelengths and both proximal and distal photodetectors were filtered using a Butterworth bandpass filter of order 3 (fc: 0.5 to 8 Hz). Then, a 60-s recording was segmented into 5-s windows, where nine different signal quality indices were calculated based on the literature [
25,
26]. The list of indices is perfusion, kurtosis, skewness, kurtosis in the frequency domain, skewness in the frequency domain, entropy, zero-crossing rate, signal-to-noise-ratio (SNR), and relative power. Outliers were replaced by the median in all the indices. Finally, the comparison of proximal and distal signal quality at all wavelengths was made by a non-parametric ANOVA (Kruskal–Wallis), considering a confidence level of 95%.


