Article

Luminous Flux Utilization of Static Birefringent Fourier Transform Imaging Spectrometer with Zoomable Spectral Resolution

1
Key Laboratory for Physical Electronics and Devices of the Ministry of Education and Shaanxi Key Laboratory of Information Photonic Technique, Xi’an Jiaotong University, Xi’an 710049, China
2
Non Equilibrium Condensed Matter and Quantum Engineering Laboratory, The Key Laboratory of Ministry of Education, School of Physics, Xi’an Jiaotong University, Xi’an 710049, China
*
Author to whom correspondence should be addressed.
These authors contribute equally to this work.
Appl. Sci. 2023, 13(8), 5132; https://doi.org/10.3390/app13085132
Submission received: 22 March 2023 / Revised: 9 April 2023 / Accepted: 18 April 2023 / Published: 20 April 2023
(This article belongs to the Topic Optical and Optoelectronic Materials and Applications)

Abstract

:
The optical displacement calculation formula for the dual Wollaston prism is derived for any incident plane and angle using the wave normal tracing method. The validity of the calculation is confirmed by comparing it with captured photographs. The relationship between the maximum incident aperture, incident angle, and incident surface angle is given when plane and spherical waves incident on the prism group. The aperture utilization of a novel static birefringent Fourier transform imaging spectrometer based on dual Wollaston prisms is also analyzed. The relationship of aperture utilization with the incident surface angle, incident angle, and prisms’ air gap thickness is given. The results provide a theoretical foundation for fully describing the optical transmission characteristics of the dual Wollaston prism group and developing a high-performance spatio-tempo hybrid modulated birefringent spectral zoom Fourier transform imaging spectrometer.

1. Introduction

Since the 1980s, Fourier transform imaging spectroscopy (FTIS) has gained attention internationally for its high accuracy and robustness, which can be classified into three types: tempo-modulated, spatio-modulated, and spatio-tempo hybrid modulated. The tempo-modulated type involves moving a mirror to acquire a time series of optical path differences (OPD). The spatio-modulated type includes a slit in the front telescope system to limit the imaging range, enabling the acquisition of complete interferogram information for ground elements along the slit direction with a single exposure. The spatio-tempo hybrid modulated type eliminates the need for slit and moving parts, allowing for the acquisition of a complete image with a single exposure. The spectral component of tempo-modulated type mostly employs Michelson interferometers, which require high-precision mirror drive systems and exhibit poor real-time performance, rendering them unsuitable for fast-changing spectral measurements. The latter two types are, generally, Sagnac interferometers [1,2,3,4], Mach-Zehnder interferometers [5,6], or birefringent crystal interferometers. Of these, the static birefringent Fourier transform imaging spectrometer (SBFTIS) [7,8,9,10,11,12,13,14,15] has gained attention for its compact size, low cost, superior stability, and high energy utilization. However, traditional SBFTIS has slit-limited luminous flux and a fixed spectral resolution, which restricts its applicability.
Compared to the spatio-modulated type, the spatio-tempo hybrid modulated type is slit-free, which leads to a relatively higher light flux. In our previous work [16,17], a novel spatio-tempo hybrid modulated SBFTIS with an adjustable spectral resolution based on the dual Wollaston prism (DWP) group with an adjustable air gap has been proposed, which greatly reduces the size of spectral image data [18,19], while improving the luminous flux. However, the luminous flux is still affected by the clear aperture [20], which greatly limits the system’s applicability. The clear aperture is a crucial parameter of an SBFTIS, as it directly corresponds to the selection of the aperture stop, which is a significant parameter in determining the system’s maximum field of view (FOV), the range of spectral resolution zooming, and the size of the CMOS (Complementary Metal-Oxide-Semiconductor) camera chip. The exit aperture plane plays a crucial role in determining a clear aperture. When only one of the two linearly polarized lights is emitted from the DWP correctly, which is separated by the beam splitter DWP, it is impossible to form neither an interferogram nor a high-quality imaging on the detector. Despite its importance, there are few reports on the research of the clear aperture of DWP, with approximate processing methods being predominantly employed, which ignore the impact of crystal birefringence on a clear aperture. This is mainly due to the complexity of the laws of light propagation in wedge-shaped birefringent crystals. Therefore, it is necessary to analyze the relationship between the system’s aperture and light flux.
In this paper, based on a brief introduction to SBFTIS, we focus on the theoretical derivation and simulation analysis of the change in the clear aperture and the luminous flux utilization caused by the birefringence phenomenon of the DWP. The wave normal tracing method [21,22,23] is employed to accurately calculate the light displacement and offset of DWP under any incident direction, validating the effectiveness of the calculation by comparing it with experimental results. The problems of the aperture and luminous flux are not systematically studied and analyzed in the SBFTIS with a zoomable spectral resolution. The maximum aperture is analyzed, and the relationship of luminous flux utilization with FOV and air gap thickness is obtained. The results are useful for designing and developing a spatio-tempo hybrid modulated static birefringent crystal Fourier transform imaging spectrometer with an adjustable spectral resolution. The restrictive relationship between aperture and luminous flux utilization, FOV, and spectral resolution is also given, which provides meaningful guidance for the use of the system.

2. Theoretical Calculation

2.1. System Structure

The schematic of the spatio-tempo hybrid modulated SBFTIS with a zoomable spectral resolution is shown in Figure 1, which consists of a polarizer P, an analyzer A, and a dual-Wollaston prism group DWP. A DWP is formed by two identical Wollaston prisms WP1 and WP2, with an adjustable air gap of width s between them. A Wollaston prism is composed of two uniaxial wedge-shaped crystals with mutually perpendicular optical axes, characterized by the structure angle β and the plate thickness t. Take WP1 as an example, the left crystal’s optical axis lies in the plane of the paper and is parallel to the positive z-axis, while the right crystal’s optical axis is perpendicular to the paper and parallel to the y-axis.
A wave separates into two waves with orthogonal polarization directions and parallel propagation directions after passing through the DWP. The wave, which is ordinary in the first crystal, becomes extraordinary in the second and vice versa, and the two waves are designated as the oeeo and eooe waves, respectively. The two waves are then converted into two linearly polarized waves with the same polarization direction by the analyzer A. After passing through the imaging lens, they intersect on the detector, forming an interference pattern and a target image. The spectral information of the incident light can be obtained by Fourier transforming the interference pattern.
When collecting data with a spatio-tempo hybrid modulated SBFTIS, all target elements within a certain area enter the FOV each time. Each target element enters the SBFTIS system at different incident angles simultaneously, but only one interference datum (corresponding to one incident angle) can be obtained for each target element in an interference pattern. To obtain the complete interference information of each target element, it is necessary to move the system relative to the target, so that the incident angle of each target element changes relative to the previous position and the interference pattern records the interference information of each target element at the new incident angle when the system moves to a new position. The incident angle is the angle between the incident light and the normal to the crystal surface. By repeating this process as the imaging system moves over the entire area, the incident angles of each target element traverse the process of the positive maximum incident angle, zero, and negative maximum incident angle, and a data cube is obtained, completing the process of the path difference sampling and acquisition of the target elements, as shown in Figure 2. Extracting and reorganizing all interference information belonging to the same target element from different frame images can obtain the complete interference information of the target element. This process is necessary to complete the data collection with the spatio-tempo hybrid modulated SBFTIS.

2.2. Calculation of Displacement and Offset

Both the oeeo wave and the eooe wave undergo displacement in the y and z directions. Due to the limited size of the prism, when the incident angle is too large or the incident point is too close to the edge of the prism, the wave may not exit correctly from the rear surface of the prism group, which can significantly limit the system’s aperture utilization and luminous flux. Therefore, in order to ensure the maximum utilization of the DWP aperture, the light should be emitted from the edge of the prism, as shown in Figure 3a.
Figure 3b is an enlarged view of the DWP part in Figure 3a, showing in detail the propagations of the eooe and oeeo waves passing through the DWP, where O is the incident point; A, B, C, D, and E are the intersection points of the eooe wave at each interface; and A′, B′, C′, D′, and E′ are the intersection points of the oeeo wave. In our previous work [24], the equation of the wave normal was obtained using the wave normal tracing method, which can be used to calculate the intersection coordinates.
To analyze the aperture of the system, it is necessary to calculate the horizontal and vertical displacements Δ of the wave normals of eoee and oeeo, respectively. Δ is defined as the difference between the y and z coordinates of E and E′ and point O, and the expressions are:
Δ y e = sin ω tan r e 1 ( t l e ) + sin ω e tan r e 2 ( t + l e ) + s sin ω e tan r e 2 ,
Δ y o = sin ω tan r o 1 ( t l o ) + sin ω o tan r o 2 ( t + l e ) + s sin ω o tan r o 2 ,
Δ z e = cos ω tan r e 1 ( t l e ) + cos ω e tan r e 2 ( t + l e ) + s cos ω e tan r e 2 ,
Δ z e = cos ω tan r o 1 ( t l o ) + cos ω o tan r o 2 ( t + l e ) + s cos ω o tan r o 2 ,
where
l e = t cos ω e 2 tan r e 2 + s cos ω e 2 tan r e 3 cot β cos ω e 2 tan r e 2 ,
l o = t cos ω o 2 tan r o 2 + s cos ω o 2 tan r o 3 cot β cos ω o 2 tan r o 2 ,
In the above expression, t is the thickness of the WP1 and WP2; s is the thickness of the air gap; and β is the structural angle of the prisms. re1 and ro1 are the refraction angles of eooe and oeeo waves in the left crystal of WP1 and the right crystal of WP2. re2 and ro2 are the refraction angles of the two waves in the right crystal of WP1 and the left crystal of WP2; and ωe1 and ωo1 are the incident plane angles of the two waves at the same position. Re3 and ro3 are the refraction angles of the two waves in the air gap; and ωe2 and ωo2 are the incident surface angles of the two waves in the air gap. The expressions of all angles can be found in reference [24].
Equations (1)–(6) do not incorporate any positional coordinate information from the incident point. Hence, the displacement of the prism group is solely dependent on the incident direction of the incident light and the thickness of the air gap and is not related to the position of the incident point. The difference between the y and z coordinates of points E and E′ represents the offset amount (d) of the two rays in the y and z directions, and its expression is:
d y = Δ y e Δ y o ,
d z = Δ z e Δ z o ,
d t o t a l = d y 2 d z 2 ,
where dtotal is the transverse offset amount of the prism group, and its physical meaning is the distance between the outgoing two parallel light.

3. Analysis and Experimental Verification

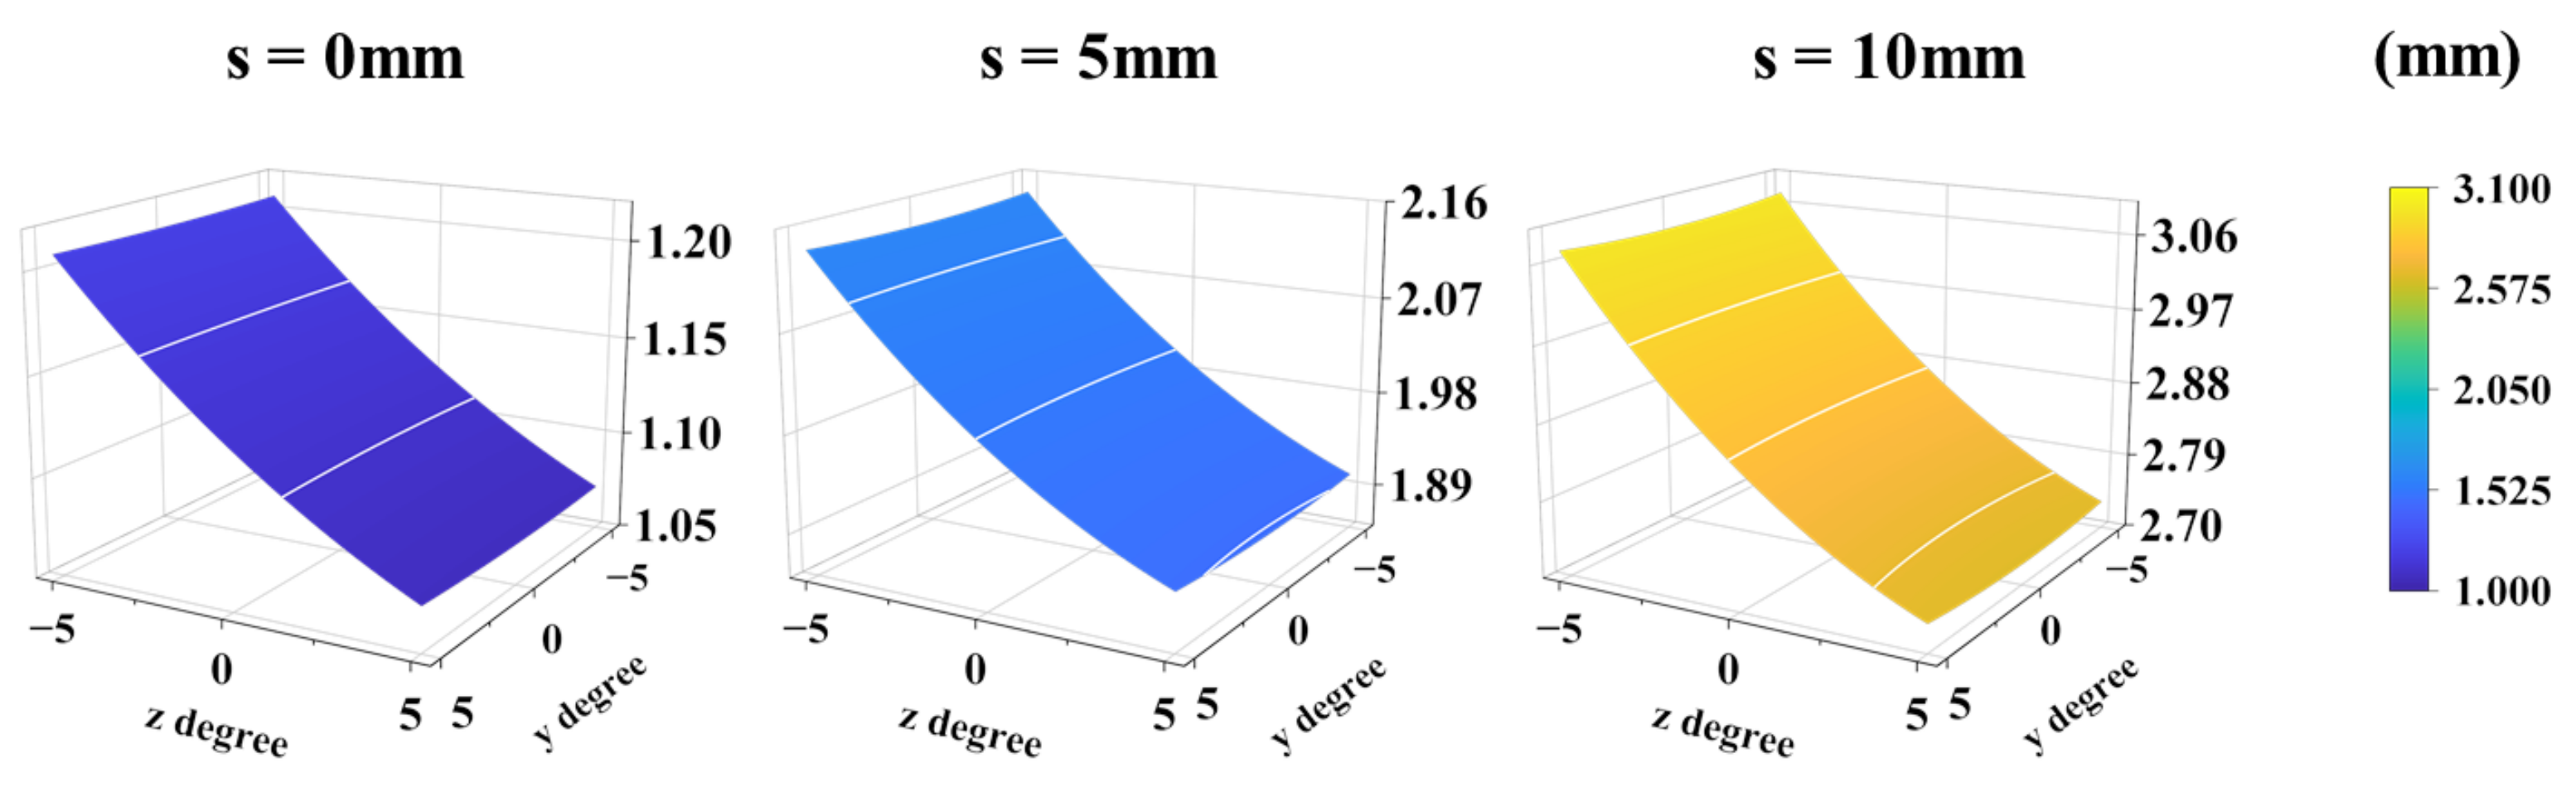
3.1. Analysis of Displacement and Offset

According to Equations (1)–(9), the displacement Δ and the offset amount d of the two waves at any incident direction can be calculated, and their spatial distribution is shown in Figure 4. The row and column direction coordinates correspond to the angles in the y and z directions. The calcite prism used in the simulation calculation has a structure angle β = 27.15°, a thickness t = 10.2 mm, and a corresponding FOV = 10°.
According to Figure 4, Δy increases as the angle in the y direction increases, and Δz decreases as the angle in the z direction increases. dy is approximately 0, which proves that the two waves basically do not offset in the y direction, which is consistent with the physical structure of the prism because the structure of the prism in the y direction does not change. dz also decreases with increasing angle in the z direction but remains essentially unchanged in the y direction. dz accounts for the main part of dtotal; thus, the following approximate relationship can be used in subsequent calculations:
d t o t a l d z .
A separate analysis was made for two special cases, namely, the cases where the incidence angle i and incidence plane angle ω were constants, which represented two special incident modes of light. When ω is a constant, taking ω = 0° as an example, the law of Δ and d changing with i is shown in Figure 5:
In the main section, Δy = 0, which proves that the two waves do not shift at all in the y direction, which is consistent with the physical properties of birefringent crystals because the wedge plane is perpendicular to the main section. Δz decreases linearly with the increase in i, from 0.60225 to −1.62831 for eooe waves and from 1.80883 to −0.55791 for oeeo waves. The range and rate of change in the oeeo wave are slightly larger, which is determined by the birefringence of calcite. While dy = 0, dz decreases linearly from 1.20658 to 1.0704. As the change in dz is small, and the rate is slow, it can be approximated as a constant.
When i is a constant, taking i = ±5° as an example, the law of Δ and d with ω is shown in Figure 6:
When i is fixed, the incident ray is in a conical surface at this time. According to the y-axis direction of the incident light direction vector, the incident angle is positive if the y component is positive. If i > 0° as ω increases, Δy increases approximately sinusoidally, from −1.14089 to 1.14089 for eooe light and from −1.14138 to 1.14138 for oeeo light. Δz approximates a cosine convex, increases from 0.61682 to 1.80883, and then decreases to 0.61682 for the eooe wave, and then it increases from −0.5107 to 0.60225 and decreases to −0.5107 for the oeeo wave. If i < 0° as ω increases, Δy decreases approximately sinusoidally, from 1.14089 to −1.14089 for the eooe light and from 1.14138 to −1.14138 for the oeeo light. Δz approximates a cosine concave, decreases from −0.5107 to −1.62832, and then increases to −0.5107 for eooe wave, and decreases from 0.61682 to −0.55792 and then increases to 0.61682 for the oeeo wave. dy ≈ 0, which proves that the two waves hardly produce relative displacements in the y direction under any circumstances. The variation in dz is small and can be approximated as a constant.

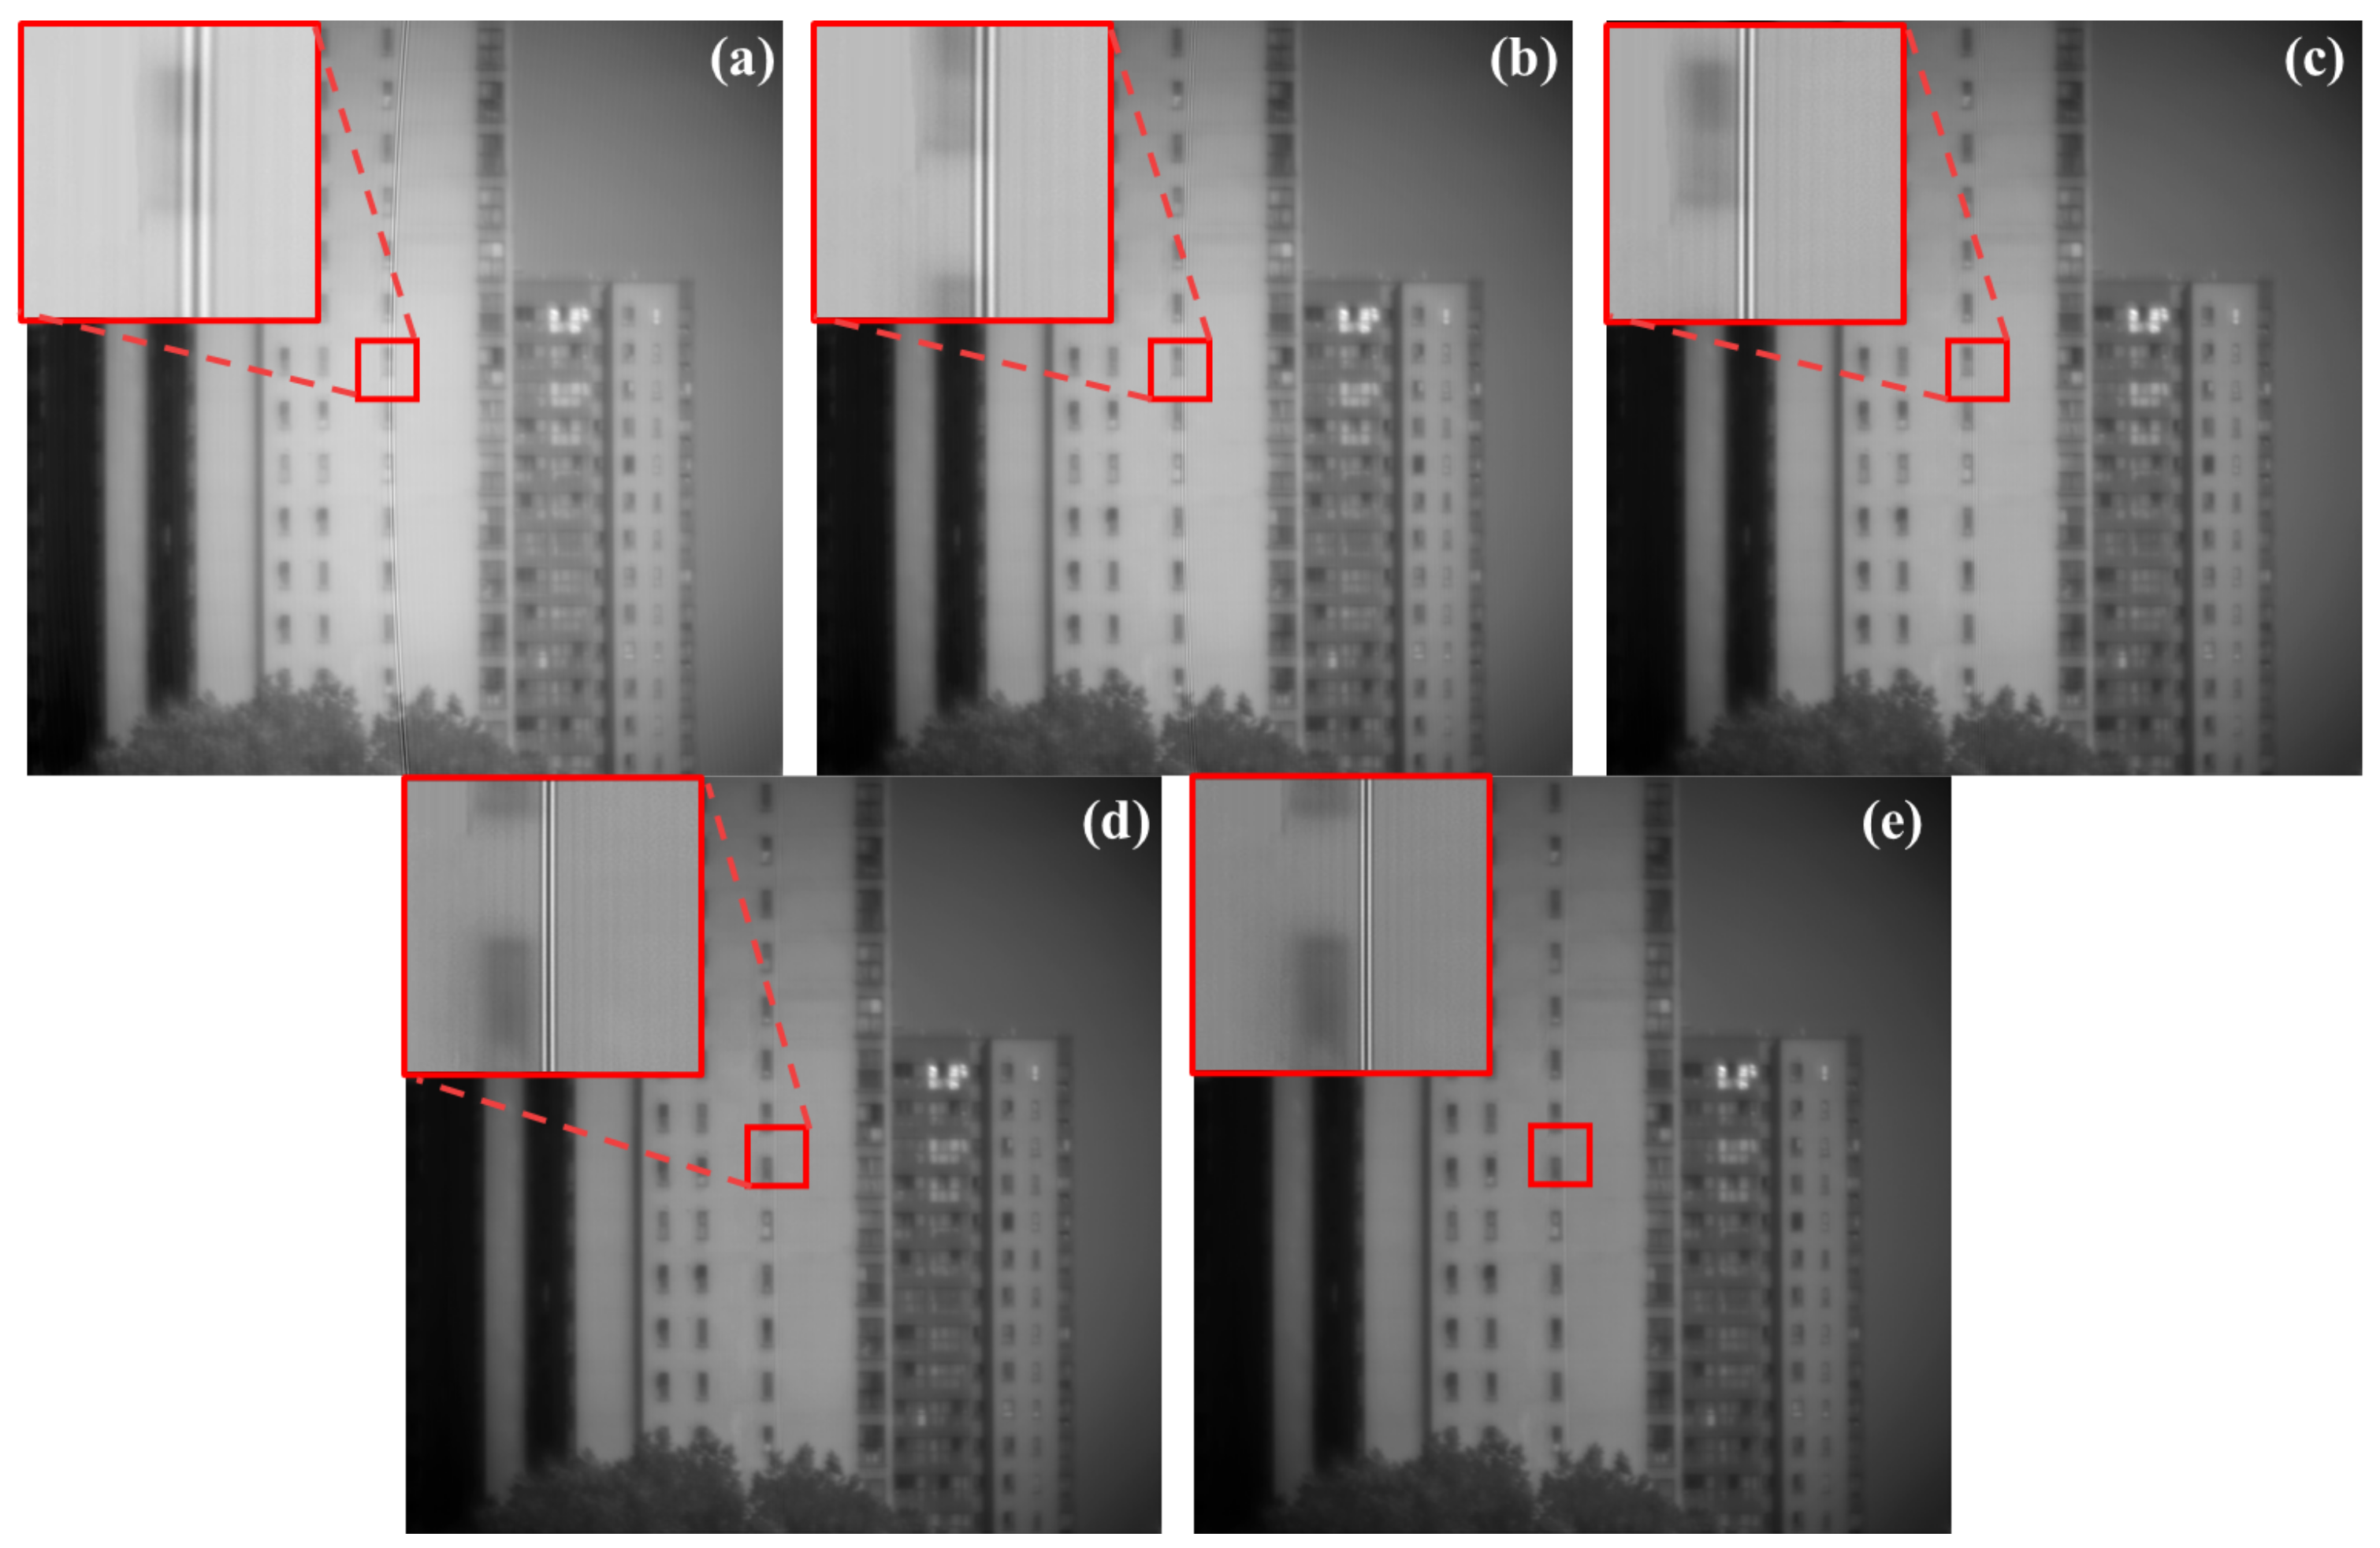
3.2. Experimental Verification

The SBFTIS prototype is shown in Figure 7, which mainly includes a DWP, a 50 mm imaging lens L, a polarizer P, an analyzer A, and a CMOS detector (4024 × 3036 pixels, with a single pixel diameter of 1.85 μm). A typical interferogram captured by SBFTIS is shown in Figure 8, which contains both intensity patterns and interference fringes.
The air gap is controlled by a stepper motor and an optical switch, enabling direct adjustments to the wave offset and indirect adjustments to the spectral resolution. The relationship between the offset and s is shown in Figure 9. As s increases, the offset also increases. The offset is directly related to the OPD of the system. The larger the offset, the larger the OPD. Therefore, the OPD of the system can be controlled by controlling the air gap, thereby adjusting the spectral resolution of the system.
Since the luminous flux was related to the system aperture, and the aperture was determined by the offset, it was necessary to verify the accuracy of the calculated offset, and the experiments were conducted to directly observe the offset amount. The Wollaston prisms were the same as the above calculation. The target (Figure 10a) was 1 m away from the lens. Since the target was not at infinity, when the target light was split by the DWP, two images were formed on the CMOS. The distance between the images was αdtotal, where α was the magnification of the lens, which could be determined by [25]:
x x = f f ,
α = f x ,
The width of a single pixel was l = 3.45 μm; therefore, in the captured picture, the pixel spacing between the images should be d = α d t o t a l l , as shown in Figure 10b–d, which display target images captured at different air gap thicknesses (s = 0 mm, 5 mm, and 10 mm). The pixel spacings were 31 pixels, 54 pixels, and 79 pixels in the horizontal direction, which corresponded to the z-direction. The calculated results were in good agreement with the experimental results, demonstrating the accuracy of the calculated offset of the SBFTIS.
The theoretical calculations based on Formulas (10)–(12) demonstrated a linear relationship between pixel spacing and air gap thickness. The comparison between experimental and theoretical values indicated good agreement, as shown in Figure 11. The red dots in the figure were the experimental results.

4. Analysis

4.1. Restricted Conditions of Luminous Flux

Due to the existence of displacement, the light incidents from the front surface may not all exit from the rear surface. Although this part can be correctly imaged, the interference pattern cannot be generated correctly, resulting in the limitation of the luminous flux of the system. Figure 12 is the captured incorrect interferogram, and the interference fringes are evidently missing at the edge.
The maximum incident range that allows light to exit completely from the rear surface is the aperture stop of the system. Taking the prism used in the prototype as an example, its size can be expressed as:
S max = [ ( 10 max ( Δ z e ) ) ( 10 min ( Δ z o ) ) ] × [ ( 10 max ( Δ y e ) ) ( 10 min ( Δ y e ) ) ] ,
The luminous flux of SBFTIS is determined by the size of its aperture stop. Therefore, aperture utilization can be used in order to measure the luminous flux utilization. The aperture utilization rate is the ratio of the aperture stop to the surface area S0 of the Wollaston prism, denoted as η. When the prism parameters have been determined, a higher value of η indicates higher luminous flux.
According to the calculation, the luminous flux utilization is related to the direction of the incident light, which is determined by two parameters: the angle ω between the incident surface and the main section of the crystal and the incident angle i. When s = 0 mm, in the case of constant ω, taking light propagating in the main section as an example within the range of i = ±5°, the continuous variation in η with i is shown in Figure 13:
Due to the geometric relationship between the relative positions of the two lights, η changes linearly with i in a three-stage manner: firstly, an increase from 90.96% to 94.20%, followed by a slight increase to 94.52%, and, finally, a decrease to 91.86%, and the minimum area of the clear aperture of the DWP Smin = 363.84 mm2. This is due to the change in the relative position of the oeeo wave and the eooe wave: when the incident angle is large and positive, the eooe light limits the aperture; when the incident angle is large and negative, the oeeo light limits the prism aperture; and when the incident angle is small, the two beams of light jointly limit the prism aperture.
Similarly, when keeping the incident angle constant at i = ±5°, in the range of ω = ±90°, the continuous variation relationship of η with ω is shown in Figure 14, respectively.
As shown in Figure 14, η varies from 96.99% to 89.72%. In order to ensure that the light always propagates in the crystal during the rotation of ω and exits from the rear surface, and when the incident plane angle ω = ±45° and i is less than 0°, the luminous flux utilization rate of the prism group is the smallest, and the minimum area of the clear aperture of the DWP Smin = 358.88 mm2.

4.2. Analysis of Luminous Flux Utilization

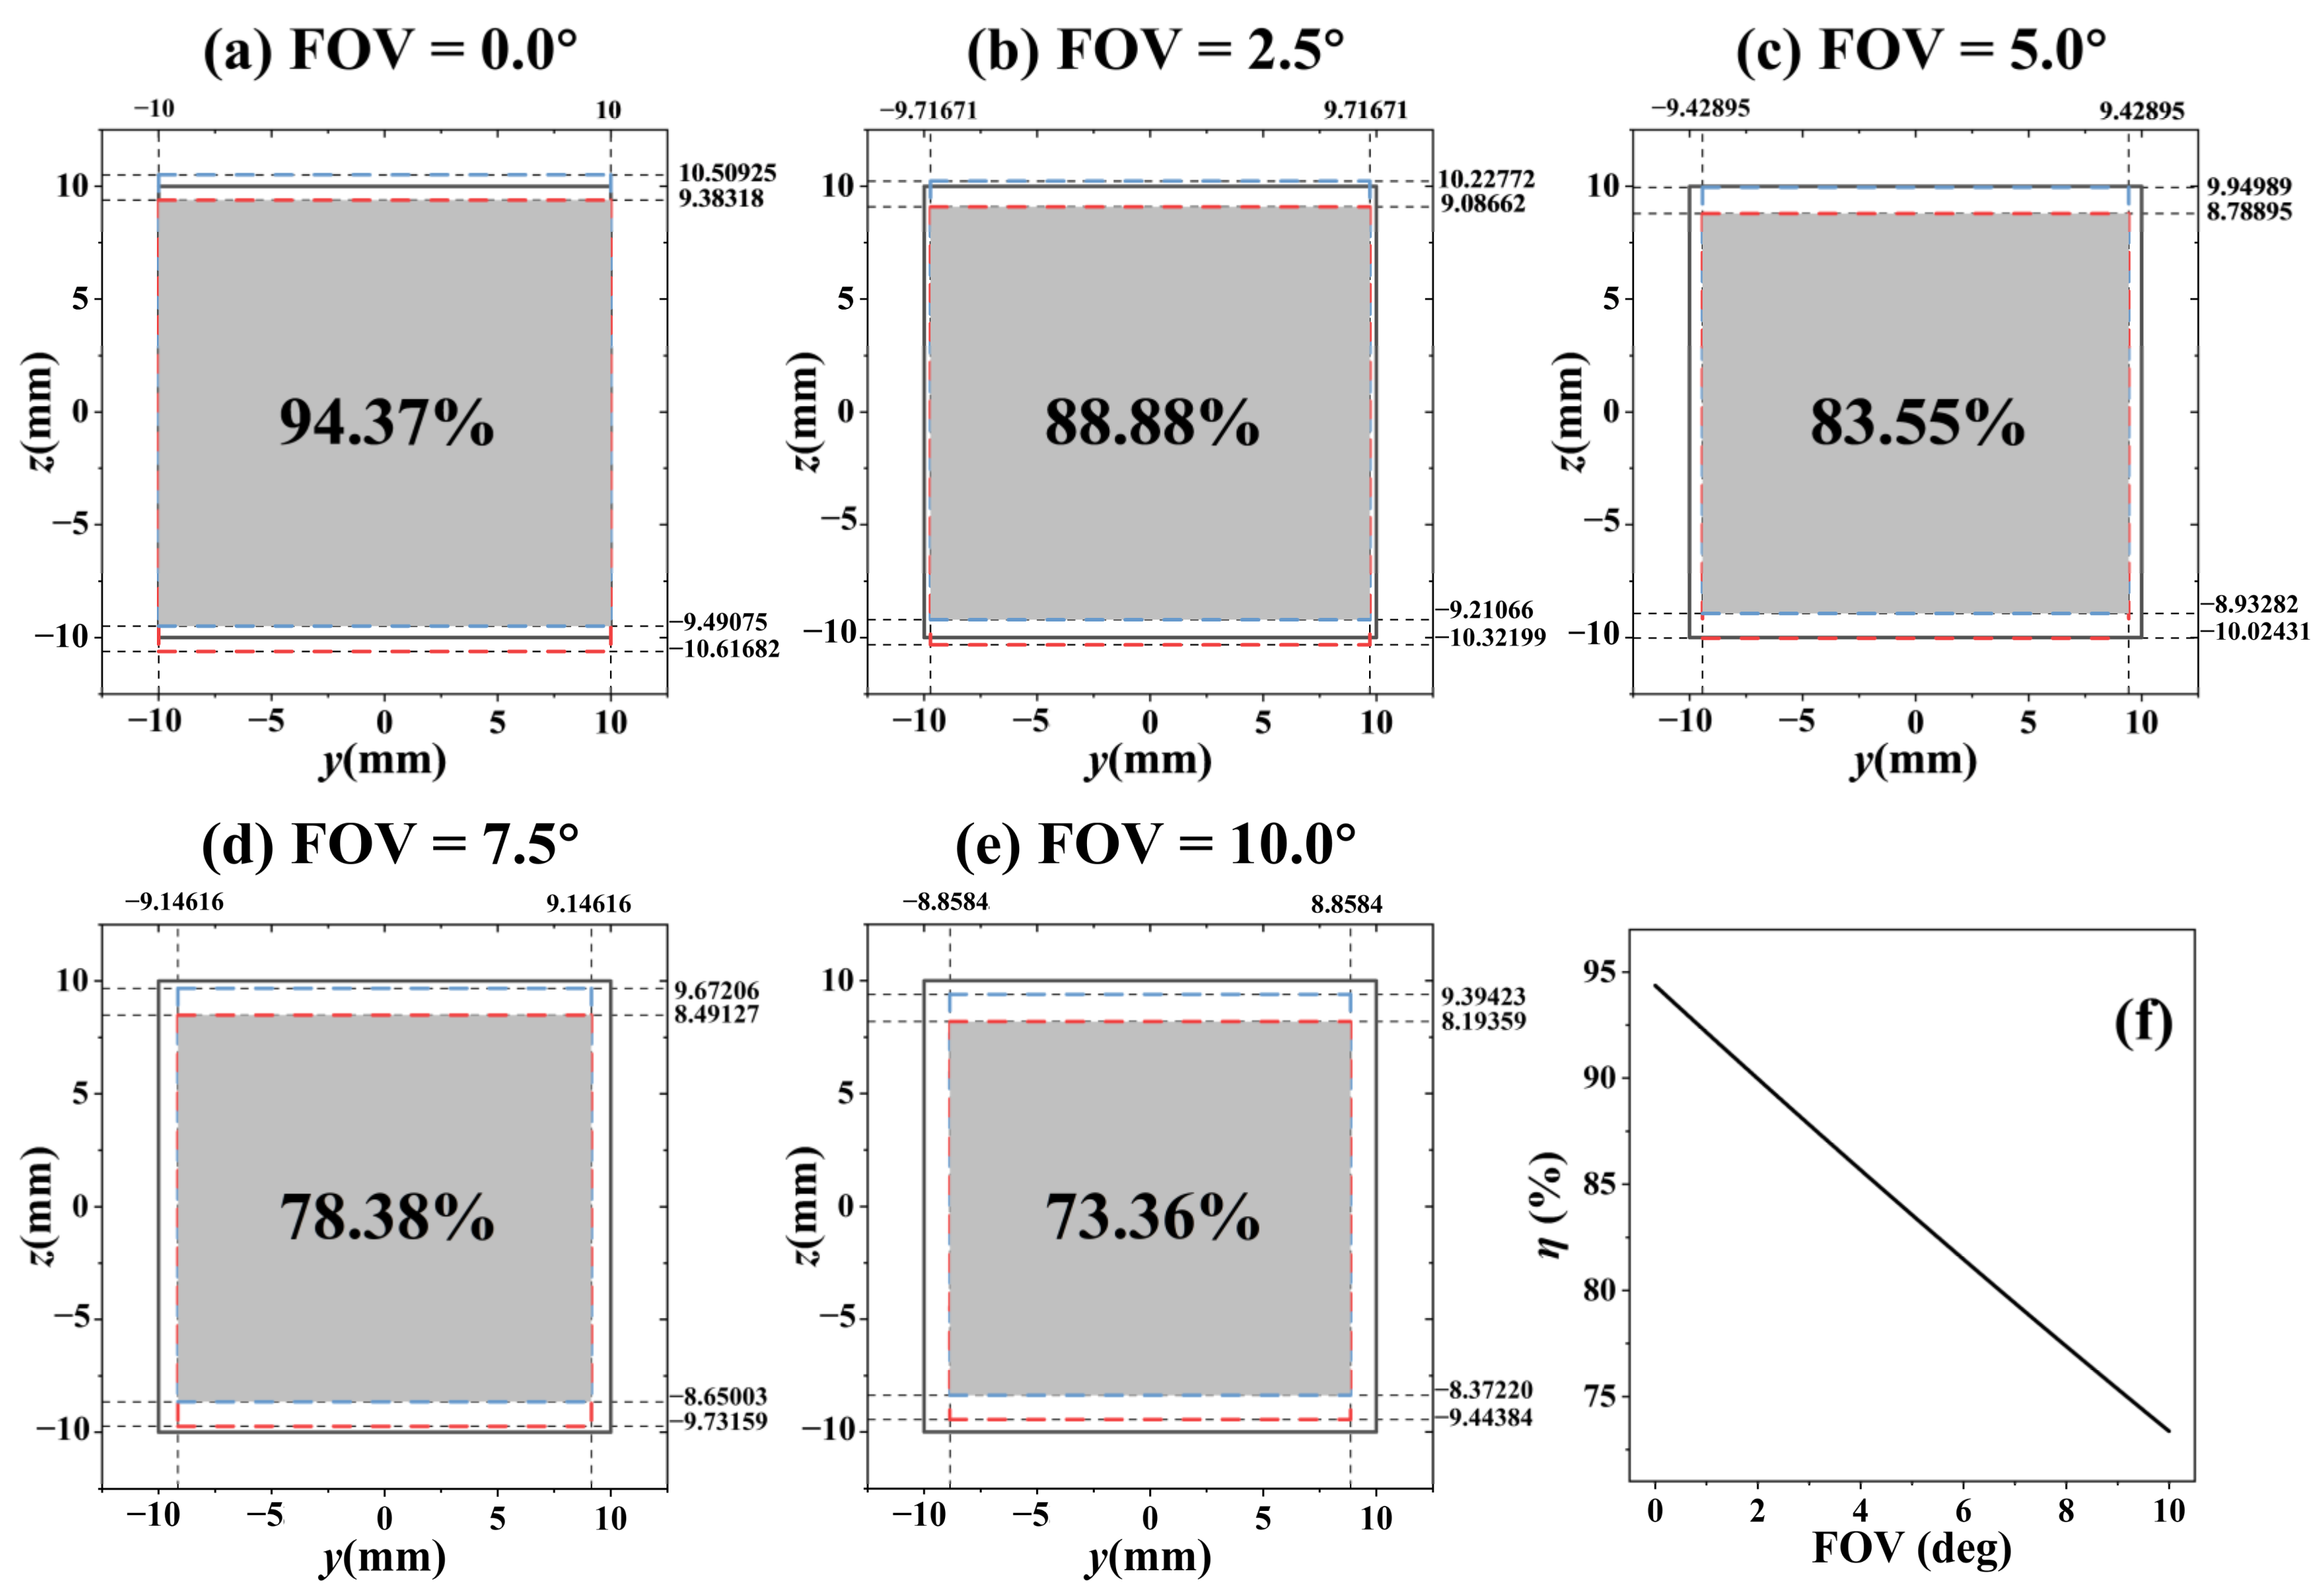
4.2.1. Effect of FOV

In applications, the incident light in SBFTIS is typically composed of spherical waves, with the maximum allowable incident angle being the FOV of the system. The aperture stop of the SBFTIS is dependent on the FOV, and thus the luminous flux is limited by it. For different FOVs, the aperture stop varies, leading to different luminous flux utilizations.
To determine the aperture stop size and luminous flux utilization for different FOVs, calculations were performed using a point source of spherical waves positioned on the vertical line of the prism surface, with a fixed prism spacing of s = 0 mm. The spherical waves were then simulated for different FOVs ranging from 0° to 10°, such that the outgoing light just exits from the edge of the rear surface of the DWP. The range of the aperture stop of the system under different FOVs is depicted in Figure 15.
In Figure 15a–e, the black solid line rectangle represents the size of the prism, and the red dotted line rectangle and the blue dotted line rectangle represent the aperture stops of the eooe and oeeo lights, respectively, while the gray solid rectangle in the figure shows the total aperture stop of the system. As the FOV increases from 0° to 10°, the aperture stop size reduces from 377.48 mm2 to 293.44 mm2, and, consequently, η exhibits a linear decrease from 94.37% to 73.36%, as depicted in Figure 15f.
To experimentally verify the results, interferograms of various FOV were captured, and the FOV was limited to a range of 5–10° due to structural constraints of the optical system. Interferograms were captured for FOVs of 5°, 7.5°, and 10° with s = 0 mm, as shown in Figure 16.
As the FOV increases from 5° to 10°, the aperture decreases slightly, and its utilization decreases by 10.19%, but the amount of light entering the system doubles. Therefore, for the same exposure time, a larger FOV means a higher luminous flux. As a result, the brightness of the captured picture is increased, and the contrast of the interference fringes is improved. It should be noted that the interference fringes will be seriously bent if the FOV is too large, and the polarization information of the target may be affected by the telescopic system, which will affect the spectral restoration; thus, the FOV cannot be increased without limit.

4.2.2. Effect of the Air Gap

The SBFTIS relies on adjusting s to achieve the desired spectral resolution. However, it is important to note that changes in the air gap thickness also influence the wave’s propagation trajectory, which, consequently, affects the aperture stop and luminous flux of the system. Hence, it is crucial to maintain a balance between achieving the desired spectral resolution and optimizing the luminous flux.
To determine the aperture stop size and luminous flux utilization for a different s, calculations were performed using a point source of spherical waves with a fixed FOV of 10°. Using spherical waves to calculate under different air gap thicknesses (s = 0 mm, 2.5 mm, 5 mm, 7.5 mm, 10 mm), the aperture stop and luminous flux utilization ratio of the prism at different spectral resolutions are shown in Figure 17:
The meanings of the rectangles in Figure 17 are the same as those in Figure 15. As the air gap s increases, the aperture stop of the system (the gray part in the figure) shrinks, and η also decreases. When FOV = 10°, as s increases from 0 mm to 10 mm, the aperture stop area decreases from 293.44 mm2 to 207.68 mm2, as Figure 17a–e shows, and η decreases linearly from 73.36% to 51.92%, as Figure 17f shows. Combining Figure 15f and Figure 17f, the change rate of η with s is greater than that with FOV, indicating that the luminous flux is more affected by the air gap thickness.
To experimentally verify the results, interferograms of various air gap thickness were captured, and s was limited to a range of 0–10 mm due to the sampling law. Interferograms were captured for s values of 0, 2.5, 5, 7.5, and 10 mm with an FOV = 10°, as shown in Figure 18.
It should be noted that the total energy of light entering the system remained constant as the FOV was kept constant. Thus, as s increased from 0 mm to 10 mm, the aperture utilization of the system decreased by 21.44%, resulting in a decrease in the luminous flux. Therefore, for the same exposure time, a larger air gap thickness resulted in darker interferograms. The minimum aperture (Smin = 207.68 mm2) was still larger than the size of the camera photosensitive chip (Schip = 145.41 mm2), and the interferogram had no error. While the spectral resolution of the system improved with increasing s, the brightness of the whole picture was gradually dimmed due to the decrease in luminous flux, and thus the signal-to-noise ratio of the interference fringes decreased. As a result, the system noise increased, which directly affected the accuracy of the system’s restored spectrum, reduced the availability of the system in complex environments, and limited the scope of the application of the system. Therefore, a balance needed to be maintained between spectral resolution and luminous flux in complex environments.

5. Conclusions

In this paper, the wave normal tracing method was used to accurately calculate the displacement and offset of light incident on the SBFTIS at any direction, and the spatial distribution of the displacement and offset was obtained. An experimental verification of the offset was conducted under different air gap thicknesses, and the obtained results were in good agreement with the theoretical results, thereby establishing the validity of the calculation. The aperture stop’s size and luminous flux utilization of the SBFTIS under different FOVs and air gap thicknesses were analyzed. The proposed research filled the gap in the literature by providing a systematic study and analysis of the aperture and luminous flux in the SBFTIS, which had not been done before.
The results indicated that the eooe light and oeeo light were mainly displaced in the z direction and had almost no displacement in the y direction. The displacement was verified by experiments, and the calculated results were in good agreement with the experimental results. As the FOV of the incident wave increased, the luminous flux utilization showed a linear decrease, ranging from 94.37% (FOV = 0°) to 73.36% (FOV = 10°) at s = 0 mm. Similarly, as the air gap thickness s increased, the luminous flux utilization linearly decreased, ranging from 73.36% (s = 0 mm) to 51.92% (s = 10 mm) at FOV = 10°. The impact of the air gap thickness on the aperture stop size and luminous flux utilization was more pronounced. The experimental findings indicated that an increase in FOV from 5° to 10° led to a slight decrease in aperture but a doubling of the amount of light entering the system. Thus, a larger FOV resulted in higher luminous flux for the same exposure time. On the other hand, as s increased from 0 mm to 10 mm, the aperture utilization of the system decreased, leading to a reduction in luminous flux. As a result, a larger air gap thickness led to a darker interferogram, higher spectral resolution, and lower signal-to-noise ratio of the interference fringes for the same exposure time. Therefore, in complex environments, it is crucial to maintain a balance between spectral resolution and luminous flux.
The aperture stop of the SBFTIS indirectly affects its spectral resolution adjustment range and FOV, while directly affecting its luminous flux utilization; hence, it is important to consider the aperture and maintain a balance between the various parameters. The application of the proposed research is to guide the design and development of a spatio-tempo hybrid modulated static birefringent crystal Fourier transform imaging spectrometer with adjustable spectral resolution. The obtained results, such as the relationship between aperture and luminous flux utilization, FOV and air gap thickness, and the restrictive relationship between aperture and luminous flux utilization, FOV and spectral resolution, provide meaningful guidance for the use of the system.

Author Contributions

Conceptualization, X.Z.; methodology, X.Z.; validation, X.Z.; formal analysis, X.Z.; writing—original draft preparation, X.Z.; writing—review and editing, X.Z., Y.Z., H.W., F.G. and L.H.; visualization, X.Z. and J.D.; supervision, X.Z.; project administration, J.Z.; funding acquisition, J.Z. All authors have read and agreed to the published version of the manuscript.

Funding

This research was funded by National Natural Science Foundation of China, grant numbers 61890961, 62127813, 62001382, and 62201568; Key R&D project in the Shaanxi Province of China, grant number 2020GY-274; Shaanxi Natural Science Basic Research Program, grant numbers 2018JM6008 and 2022JQ-693.

Institutional Review Board Statement

Not applicable.

Informed Consent Statement

Not applicable.

Data Availability Statement

All data are contained within the article.

Conflicts of Interest

The authors declare no conflict of interest.

References

  1. Sellar, R.G.; Rafert, B. Effects of aberrations on spatially modulated Fourier transform spectrometers. Opt. Eng. 1994, 33, 3087–3092. [Google Scholar] [CrossRef]
  2. Barducci, A.; Guzzi, D.; Lastri, C.; Marcoionni, P.; Nardino, V.; Pippi, I. Theoretical aspects of Fourier Transform Spectrometry and common path triangular interferometers. Opt. Express 2010, 18, 11622–11649. [Google Scholar] [CrossRef] [PubMed]
  3. Li, J.; Bai, C.; Shen, Y.; Xu, D. Optical path squeezing interferometry: Boosting the resolution for Fourier transform imaging spectrometers. Opt. Lett. 2016, 41, 5329–5332. [Google Scholar] [CrossRef] [PubMed]
  4. Li, J.; Qu, W.; Wu, H.; Qi, C. Broadband snapshot complete imaging polarimeter based on dual Sagnac-grating interferometers. Opt. Express 2018, 26, 25858–25868. [Google Scholar] [CrossRef] [PubMed]
  5. Fu, Q.; Xiangli, B.; Lv, Q.; Jing, J. Design of a Dual-Channel Mach-Zehnder Lateral Offseting Interferometer for the Large Aperture Static Imaging Spectrometer. Spectrosc. Spect. Anal. 2012, 32, 553–557. [Google Scholar]
  6. Zhang, N.; Zhu, J.; Zhang, Y.; Zong, K. Snapshot broadband polarization imaging based on Mach-Zehnder-grating inter-ferometer. Opt. Express 2020, 28, 33718–33730. [Google Scholar] [CrossRef]
  7. Oka, K.; Saito, N. Snapshot complete imaging polarimeter using Savart plates. Proc. SPIE 2006, 6295, 629508. [Google Scholar]
  8. Qizhi, C.; Chunmin, Z.; Edward, D. Snapshot imaging polarimeter using modified Savart polariscopes. Appl. Opt. 2012, 51, 5791–5796. [Google Scholar]
  9. Ren, W.; Zhang, C.; Jia, C.; Mu, T.; Li, Q.; Zhang, L. Precise spectrum reconstruction of the Fourier transforms imaging spec-trometer based on polarization beam splitters. Opt. Lett. 2013, 38, 1295–1297. [Google Scholar] [CrossRef]
  10. Cao, Q.; Zhang, J.; DeHoog, E.; Zhang, C. Demonstration of snapshot imaging polarimeter using modified Savart polariscopes. Appl. Opt. 2016, 55, 954–959. [Google Scholar] [CrossRef]
  11. Zhang, N.; Zhu, J.; Zhang, Y.; Zong, K. Broadband snapshot polarimetric imaging based on dispersion-compensated Savart plates. Opt. Commun. 2019, 457, 124607. [Google Scholar] [CrossRef]
  12. Li, J.; Zhu, J.; Wu, H. Compact static Fourier transform imaging spectropolarimeter based on channeled polarimetry. Opt. Lett. 2010, 35, 3784–3786. [Google Scholar] [CrossRef]
  13. Bai, C.; Li, J.; Shen, Y.; Zhou, J. Birefringent Fourier transform imaging spectrometer with a rotating retroreflector. Opt. Lett. 2016, 41, 3647–3650. [Google Scholar] [CrossRef]
  14. Li, J.; Qu, C.; Wu, H.; Qi, C. Spectral resolution enhanced static Fourier transform spectrometer based on a birefringent retarder array. Opt. Express 2019, 27, 15505–15517. [Google Scholar] [CrossRef]
  15. Li, Q.; Lu, F.; Wang, X.; Zhu, C. Low crosstalk polarization-difference channeled imaging spectropolarimeter using dou-ble-Wollaston prism. Opt. Express 2019, 27, 11734–11747. [Google Scholar] [CrossRef]
  16. Li, J.; Zhu, J.; Qi, C.; Zheng, C.; Gao, B.; Zhang, Y.; Hou, X. Compact static imaging spectrometer combining spectral zooming capability with a birefringent interferometer. Opt. Express 2013, 21, 10182–10187. [Google Scholar] [CrossRef]
  17. Li, J.; Zhu, J.; Zhang, Y.; Liu, H.; Hou, X. Spectral zooming birefringent imaging spectrometer. Acta Phys. Sin. 2013, 62, 261–268. [Google Scholar]
  18. Sellar, R.G.; Boreman, G.D. Classification of imaging spectrometers for remote sensing applications. Opt. Eng. 2004, 44, 13602–13603. [Google Scholar]
  19. Chen, B.; Wang, M.R.; Liu, Z.; Yang, J.J. Dynamic spectral imaging with spectral zooming capability. Opt. Lett. 2007, 32, 1518–1520. [Google Scholar] [CrossRef]
  20. Li, Q.; Zhang, C.; Wei, Y.; Chen, Q. Analysis of the clear aperture of Savart plates in polarization interference imaging spec-trometer. Acta Phys. Sin. 2015, 64, 167–176. [Google Scholar]
  21. Françon, M.; Mallick, S. Polarization Interferometers/Application in Microscopy and Macroscopy; Wiley-Interscience: Hoboken, NJ, USA, 1973; pp. 5–8, 140–143. [Google Scholar]
  22. Lv, M.; Wang, P. Ray tracing in Rochon prisms with absorption. Opt. Express 2017, 25, 14676. [Google Scholar] [CrossRef] [PubMed]
  23. Hu, X.; Ai, J.; Kong, Z.; Gao, P.; Zhang, S.; Wang, X. Research on the optical axis of the birefringent crystal rotating in the three dimensional space. Optik 2019, 181, 786–795. [Google Scholar] [CrossRef]
  24. Zhang, X.; Huang, L.; Zhu, J.; Zhang, N.; Zong, K.; Zhai, L.; Zhang, Y.; Cai, Y.; Wang, H. Exact optical path difference and complete performance analysis of a spectral zooming imaging spectrometer. Opt. Express 2022, 30, 39479–39491. [Google Scholar] [CrossRef] [PubMed]
  25. Conrady, A.E. Applied Optics and Optical Design; Dover Publications: Mineola, NY, USA, 1985; pp. 66–68. [Google Scholar]
Figure 1. The schematic of the SBFTIS.
Applsci 13 05132 g001
Figure 2. The schematic of the spatio-tempo hybrid modulate.
Applsci 13 05132 g002
Figure 3. (a) Waves’ propagation and displacement in SBFTIS (b) Waves’ propagation and displacement in DWP (For calcite WP, projected on the OXZ plane).
Applsci 13 05132 g003
Figure 4. Spatial distribution of offset and displacement.
Applsci 13 05132 g004
Figure 5. Offset and displacement as function of i when ω = 0°: (a) Along y direction; (b) Along z direction.
Applsci 13 05132 g005
Figure 6. Offset and displacement as function of ω when i = ±5°: (a) Along y direction; (b) Along z direction.
Applsci 13 05132 g006
Figure 7. The SBFTIS prototype.
Applsci 13 05132 g007
Figure 8. A typical interferogram.
Applsci 13 05132 g008
Figure 9. Spatial distribution of displacement with different s.
Applsci 13 05132 g009
Figure 10. Verification experiment of the beam splitting effect of DWP (a) Target; (b) Image of s = 0 mm; (c) Image of s = 5 mm; (d) Image of s = 10 mm.
Applsci 13 05132 g010
Figure 11. Variation in d’ with s.
Applsci 13 05132 g011
Figure 12. A typical incorrect interferogram.
Applsci 13 05132 g012
Figure 13. Luminous flux utilization as a function of i when ω = 0°.
Applsci 13 05132 g013
Figure 14. Luminous flux utilization as a function of ω when i = ±5°.
Applsci 13 05132 g014
Figure 15. When s = 0 mm, FOV = 0–10°: (ae) Effective incident aperture of DWP; (f) Variation in luminous flux utilization with FOV.
Applsci 13 05132 g015
Figure 16. Captured interferograms (a) FOV = 5°, (b) FOV = 7.5°, (c) FOV = 10°.
Applsci 13 05132 g016
Figure 17. When FOV = 10°, s = 0–10 mm: (ae) Aperture stop of DWP at different s; (f) Variation in luminous flux utilization with s.
Applsci 13 05132 g017
Figure 18. Captured interferograms (a) s = 0 mm, (b) s = 2.5 mm, (c) s = 5 mm, (d) s = 7.5 mm, (e) s = 10 mm.
Applsci 13 05132 g018
Disclaimer/Publisher’s Note: The statements, opinions and data contained in all publications are solely those of the individual author(s) and contributor(s) and not of MDPI and/or the editor(s). MDPI and/or the editor(s) disclaim responsibility for any injury to people or property resulting from any ideas, methods, instructions or products referred to in the content.

