Article

Adaptive Driver Face Feature Fatigue Detection Algorithm Research

1
College of Electrical and Control Engineering, North China University of Technology, Beijing 100144, China
2
School of Artificial Intelligence and Manufacturing, Hechi University, Hechi 546300, China
3
College of Information Science and Technology, North China University of Technology, Beijing 100144, China
*
Author to whom correspondence should be addressed.
Appl. Sci. 2023, 13(8), 5074; https://doi.org/10.3390/app13085074
Submission received: 22 March 2023 / Revised: 10 April 2023 / Accepted: 12 April 2023 / Published: 18 April 2023
(This article belongs to the Special Issue Computation and Complex Data Processing Systems)

Abstract

:
Fatigued driving is one of the leading causes of traffic accidents, and detecting fatigued driving effectively is critical to improving driving safety. Given the variety and individual variability of the driving surroundings, the drivers’ states of weariness, and the uncertainty of the key characteristic factors, in this paper, we propose a deep-learning-based study of the MAX-MIN driver fatigue detection algorithm. First, the ShuffleNet V2K16 neural network is used for driver face recognition, which eliminates the influence of poor environmental adaptability in fatigue detection; second, ShuffleNet V2K16 is combined with Dlib to obtain the coordinates of driver face feature points; and finally, the values of EAR and MAR are obtained by comparing the first 100 frames of images to EAR-MAX and MAR-MIN. Our proposed method achieves 98.8% precision, 90.2% recall, and 94.3% F-Score in the actual driving scenario application.

1. Introduction

With the continuous development of railroad mileage and the number of cars all over the world, cars have brought speed and convenience to people’s lives, while at the same time traffic accidents occur frequently. Fatigued driving is one of the main causes of traffic accidents. According to the China Statistical Yearbook 2021, in 2021, 61,700 people were killed in traffic accidents in China, and about 250,000 people were injured in traffic accidents in China. Among traffic accidents, those caused by fatigued driving account for 20–30% of traffic accidents, especially on highways, where more than 30% of accidents occur due to fatigued driving. Therefore, it is crucial to detect the fatigued driving status and issue the corresponding warning.
Fatigue driving refers to the muscle relaxation and mental fatigue that occur after a long period of intense driving, as well as the decrease in hand and foot reaction ability and anticipation ability, which results in slow movements. Lal et al. [1] defined fatigue driving as an excess change from the arousal to the sleep state that occurs when the fatigue state does not change.
The identification of fatigued driving status necessitates the use of several disciplines, including medicine, psychology, optics, communication, and computers. As a result, experts and scholars both at home and abroad have concentrated their efforts on detecting fatigued driving.
Currently, the most popular form of detection in China is the technique for detecting the fatigue state in a driver’s facial features. By observing the driver’s eyes movement and head changing positions, the degree of fatigue can be detected [2]. However, because these algorithms frequently fail to take into account the driver’s individual traits, they are not reliable and robust.
In this paper, we suggest a novel detection technique for individual driver differences in complex situations to address the aforementioned problems. The following are the creative points:
(1) The enhanced ShuffleNet V2K16 convolutional neural network is used to create a driver facial feature point monitoring architecture. YawDD [3], an open-source dataset, is also used to train the network. The enhanced ShuffleNet V2K16 algorithm improves facial recognition precision, simplifies the network mechanism, decreases computation time, and is simpler to port to mobile devices than other algorithms such as PFLD [4] and PafPif [5].
(2) The lightweight network structure of ShuffleNet can quickly and accurately gather the driver’s facial feature point information to obtain the feature values for assessing the fatigue state by combining ShuffleNet V2K16 with Dlib.
(3) The MAX-MIN fatigue detection technique is suggested. The majority of the detection algorithms now in use are based on the MAR and EAR values and employ the driver’s eye and mouth feature point thresholds as judgment features to assess whether or not the driver is weary. Based on the analysis of 2000 images from the YawDD dataset, it was observed that the sizes of drivers’ eyes and mouths varied. Additionally, the degree of mouth aperture during yawning also exhibited variation. The tiredness level is established by choosing the fatigue threshold that is unique to each driver by comparing the EAR and MAR acquired after 100 frames with the corresponding EAR-MAX and MAR-MIN values. In comparison to earlier detection methods, this method is more accurate and adaptive.
This paper is divided into five main sections, as follows:
The first part mainly introduces the research background and the significance of fatigue driving detection and briefly describes the current research status of fatigue state detection at home and abroad. In view of the shortcomings of the existing research, a new algorithm for fatigue state recognition is proposed in this paper. Finally, the innovation of the proposed algorithm is introduced.
The second part describes the existing work related to fatigue detection. Three ideas for fatigue detection solutions are detailed.
The third part discusses the study’s associated methodologies. It basically covers the detection of the driver’s face using ShuffleNet V2K16, integration with Dlib, the feature point localization computation, and the related MAX-MIN technique provided in this work.
The fourth part is the experimental analysis. Firstly, the experimental environment and dataset are introduced, and then different networks are used to extract feature points for the driver’s face. Then, the MAX-MIN calculation method is used for the driver’s eyes and mouth to perhaps calculate the fatigue detection threshold. Finally, the fatigue detection algorithm designed in this paper is evaluated in terms of both precision and real-time performance.
The fifth part is the conclusion. It summarizes the main work of this paper, the shortcomings of the system design, the aspects that need to be improved, and finally proposes the future optimization direction and outlook of the fatigue detection algorithm.

2. Related Works

Fatigue driving recognition methods based on deep learning have received a lot of attention from many industries, but the majority of these appeared one after another only after 2015 and were basically divided into three model design ideas. The first research line is to identify different drivers by using image classification models. Y. Hu et al. [6] proposed a multi-stream CNN model, designed three shallow volumes and networks with different sensory fields, and realized multi-scale exchange by a feature map fusion strategy. The model was tested on the publicly available State Farm dataset with a precision of 86.4%. W. Xiang et al. [7] obtained information from multiple channels, such as grayscale, gradient, and optical flow from the input frames, and extracted the temporal and spatial information contained in the feature maps by 3D convolution. The feature maps were fed to the attention mechanism module, and the feature weights were optimized. The SVM (Support Vector Machine) classifier output was used to determine the driving state. The paper also carried out some research on protecting the driver’s facial privacy and security. The recognition rate could reach 95% on the self-built dataset (SBD). Image classification models usually take specific frames as input and are trained end-to-end to determine different driver behavior classes directly. The advantages of this type of model are its simple and clear network structure and fast computation. The drawbacks of this type of model are that it does not utilize dynamic information between frames and has slightly lower precision, which is suitable for embedded platforms. Shahzeb Ansari et al. [8] used a motion capture system to detect the driver’s head posture motion to measure whether the driver was fatigued or not. The second line of research is to use target detection models to localize specific targets and achieve person-to-person discrimination. H. Jia et al. [9] proposed a fatigue driving detection algorithm based on deep learning and driver facial multi-metric fusion, using an improved multi-task cascaded convolutional neural network (MTCNN) to quickly and accurately locate the face and detect the key points of the face, fusing the study closure rate, mouth expansion rate, and head non-positive face rate features to determine whether the driver is fatigued or not. The proposed algorithm based on the homemade dataset of H. Han et al. [10] collected actual eye movement parameters from 36 drivers using an “eye-tracking device” and used a driving simulator to simulate the actual eye movement parameters. PERCLOS, combined with the SSS table, was used to determine the fatigue level threshold for different monotonic driving scenarios. Finally, a deep learning method based on LSTM (long short-term memory) was used to build recognition models for drivers with different fatigue levels to detect their actual levels. The recognition rate of the established fatigue recognition model can reach 97.8% for the total recognition rate of drivers, which is higher than the recognition precision of traditional machine learning methods. The third research idea is to identify different driver behaviors using video classification models. N. Moslemi et al. [11] used the I3D model to extract spatiotemporal representations from video sequences to discriminate driver behaviors. T. Zhu et al. [12] proposed a TCDCN deep-learning-based multifaceted feature fusion fatigue detection algorithm that introduces a new face-tracking algorithm to improve precision. Using EAR, MAR, and PERCLOS and setting the weights, the threshold to determine the fatigue status can be found. It can identify driver drowsiness and yawning in real time. In contrast to image classification models and target detection models, the input to video classification models is a video sequence. These models effectively use inter-frame motion information and can extract spatiotemporal representations of driver behavior with higher precision than the first two types of models. They are also more computationally intensive and suitable for general-purpose computing platforms.
Based on the provided literature, we adopt the idea of a target-detection-model-based localization of specific targets with the calculation of the relevant parameters to determine the driver fatigue status, aiming to reduce the computational complexity while improving the detection precision. This is shown in the following section.

3. Materials and Methods

This work is divided into four sections: face detection and feature point localization, EAR-MAX and MAR-MIN calculations, MAX-MIN calculations, and fatigue state assessment. This paper first used ShuffleNet V2K16 combined with Dlib to detect the driver’s face and locate 68 points combined with Dlib to determine whether fatigue is determined by EAR/EAR-MAX and MAR/MAR-MIN parameters to make a judgment. Then, using front-end video frames, it calculates the EAR-MAX and MAR-MIN values of various drivers, compares the values to the EAR and MAR values in back-end frames, and finally decides. Figure 1 depicts the overall organizational structure of this paper.

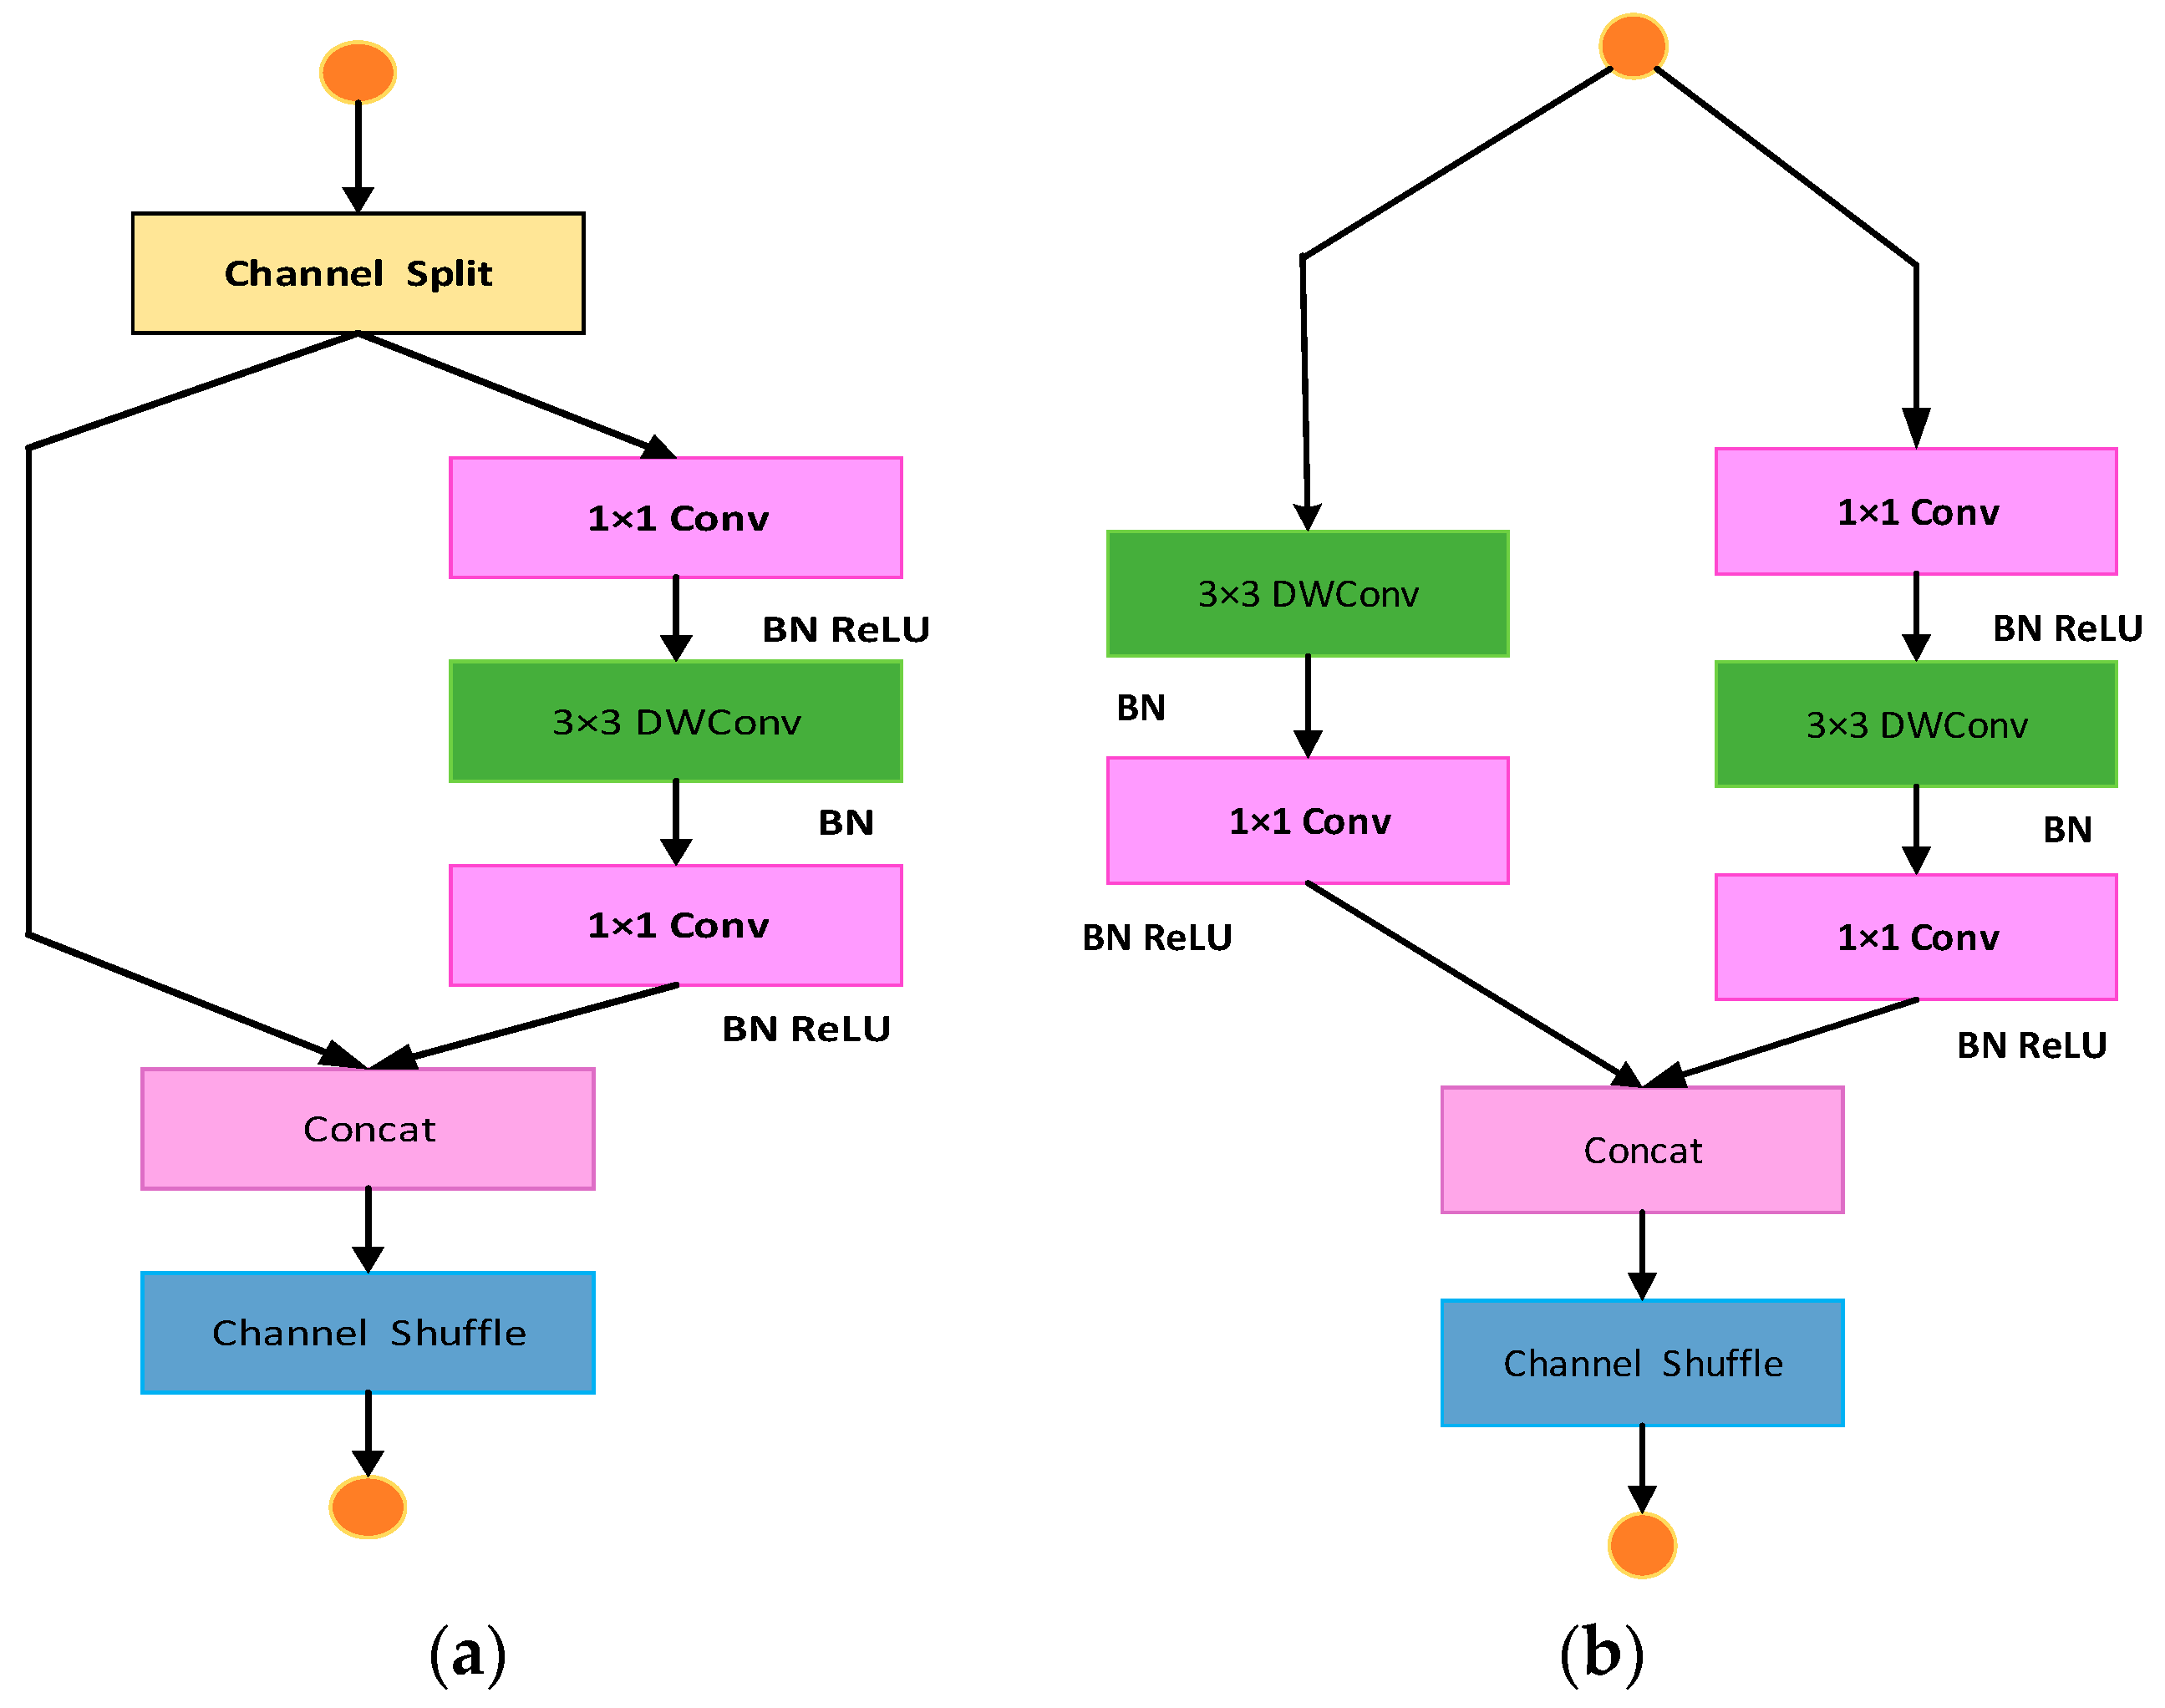
3.1. Face Detection and Special Point Localization

Face feature point detection is an important step in fatigue recognition. The 68 feature locations on the human face identify specific facial regions, such as the mouth, brows, and eye regions. ShuffleNet V2K16 was used in this paper to locate the key points on the face. Net employs group convolution as well as channel reorganization. As shown in Figure 2, each group of channels is averaged and then reconstructed into a new feature map in order by ShuffleNet.
Two channels are recombined in Figure 2, and GConv represents group convolution: (a) represents two stacked convolution layers with the same number of groups, and each output channel is only related to the input channel in the group for a crossover; (b) represents the recombination of two channels, and the output is 68 coordinate points and background information for a total of 69 class outputs.
In comparison to other versions, the upgraded ShuffleNet V2K16 is quicker and significantly more accurate. Channel splitting is a new operation that has been introduced. When the output channel is equal to the input channel, the MAC consumption of ShuffleNet V2 is lowest; as a group of group convolutions rises, the MAC also increases; as network fragmentation increases, network speed decreases; and as operation between elements decreases [13]. The network architecture is depicted in Figure 3. At the start of the unit, the input feature map is split into two branches (each with half as many channels). The right branch performs three convolutions with a step size of one, using the same number of input and output channels, whereas the left branch remains unchanged and changes continuously. The 3 × 3 convolution is a deep convolution inside a deep separable convolution, while the two 1 × 1 convolutions are regular convolutions. After the convolution is completed, the two branches are concatenated, the channel numbers are added, the features are combined, and the channel shuffle is used to transfer information between various groups. Then, all of the channels are fused together. Figure 3b differs from Figure 3a in that there is no initial channel split, and the feature maps are sent directly to the two branches. Using 3 × 3 deep convolution with a step size of 2, the length (H) and width (W) of the feature map are reduced in both branches, reducing the computational load on the network. The two branch outputs are then subjected to the concatenation procedure, yielding a channel count that is double that of the initial input. This doubles the number of channels without noticeably increasing the FLOPs, widens the network, and enhances feature extraction. The same channel is then mixed and washed in order to realize the information exchange between many channels.

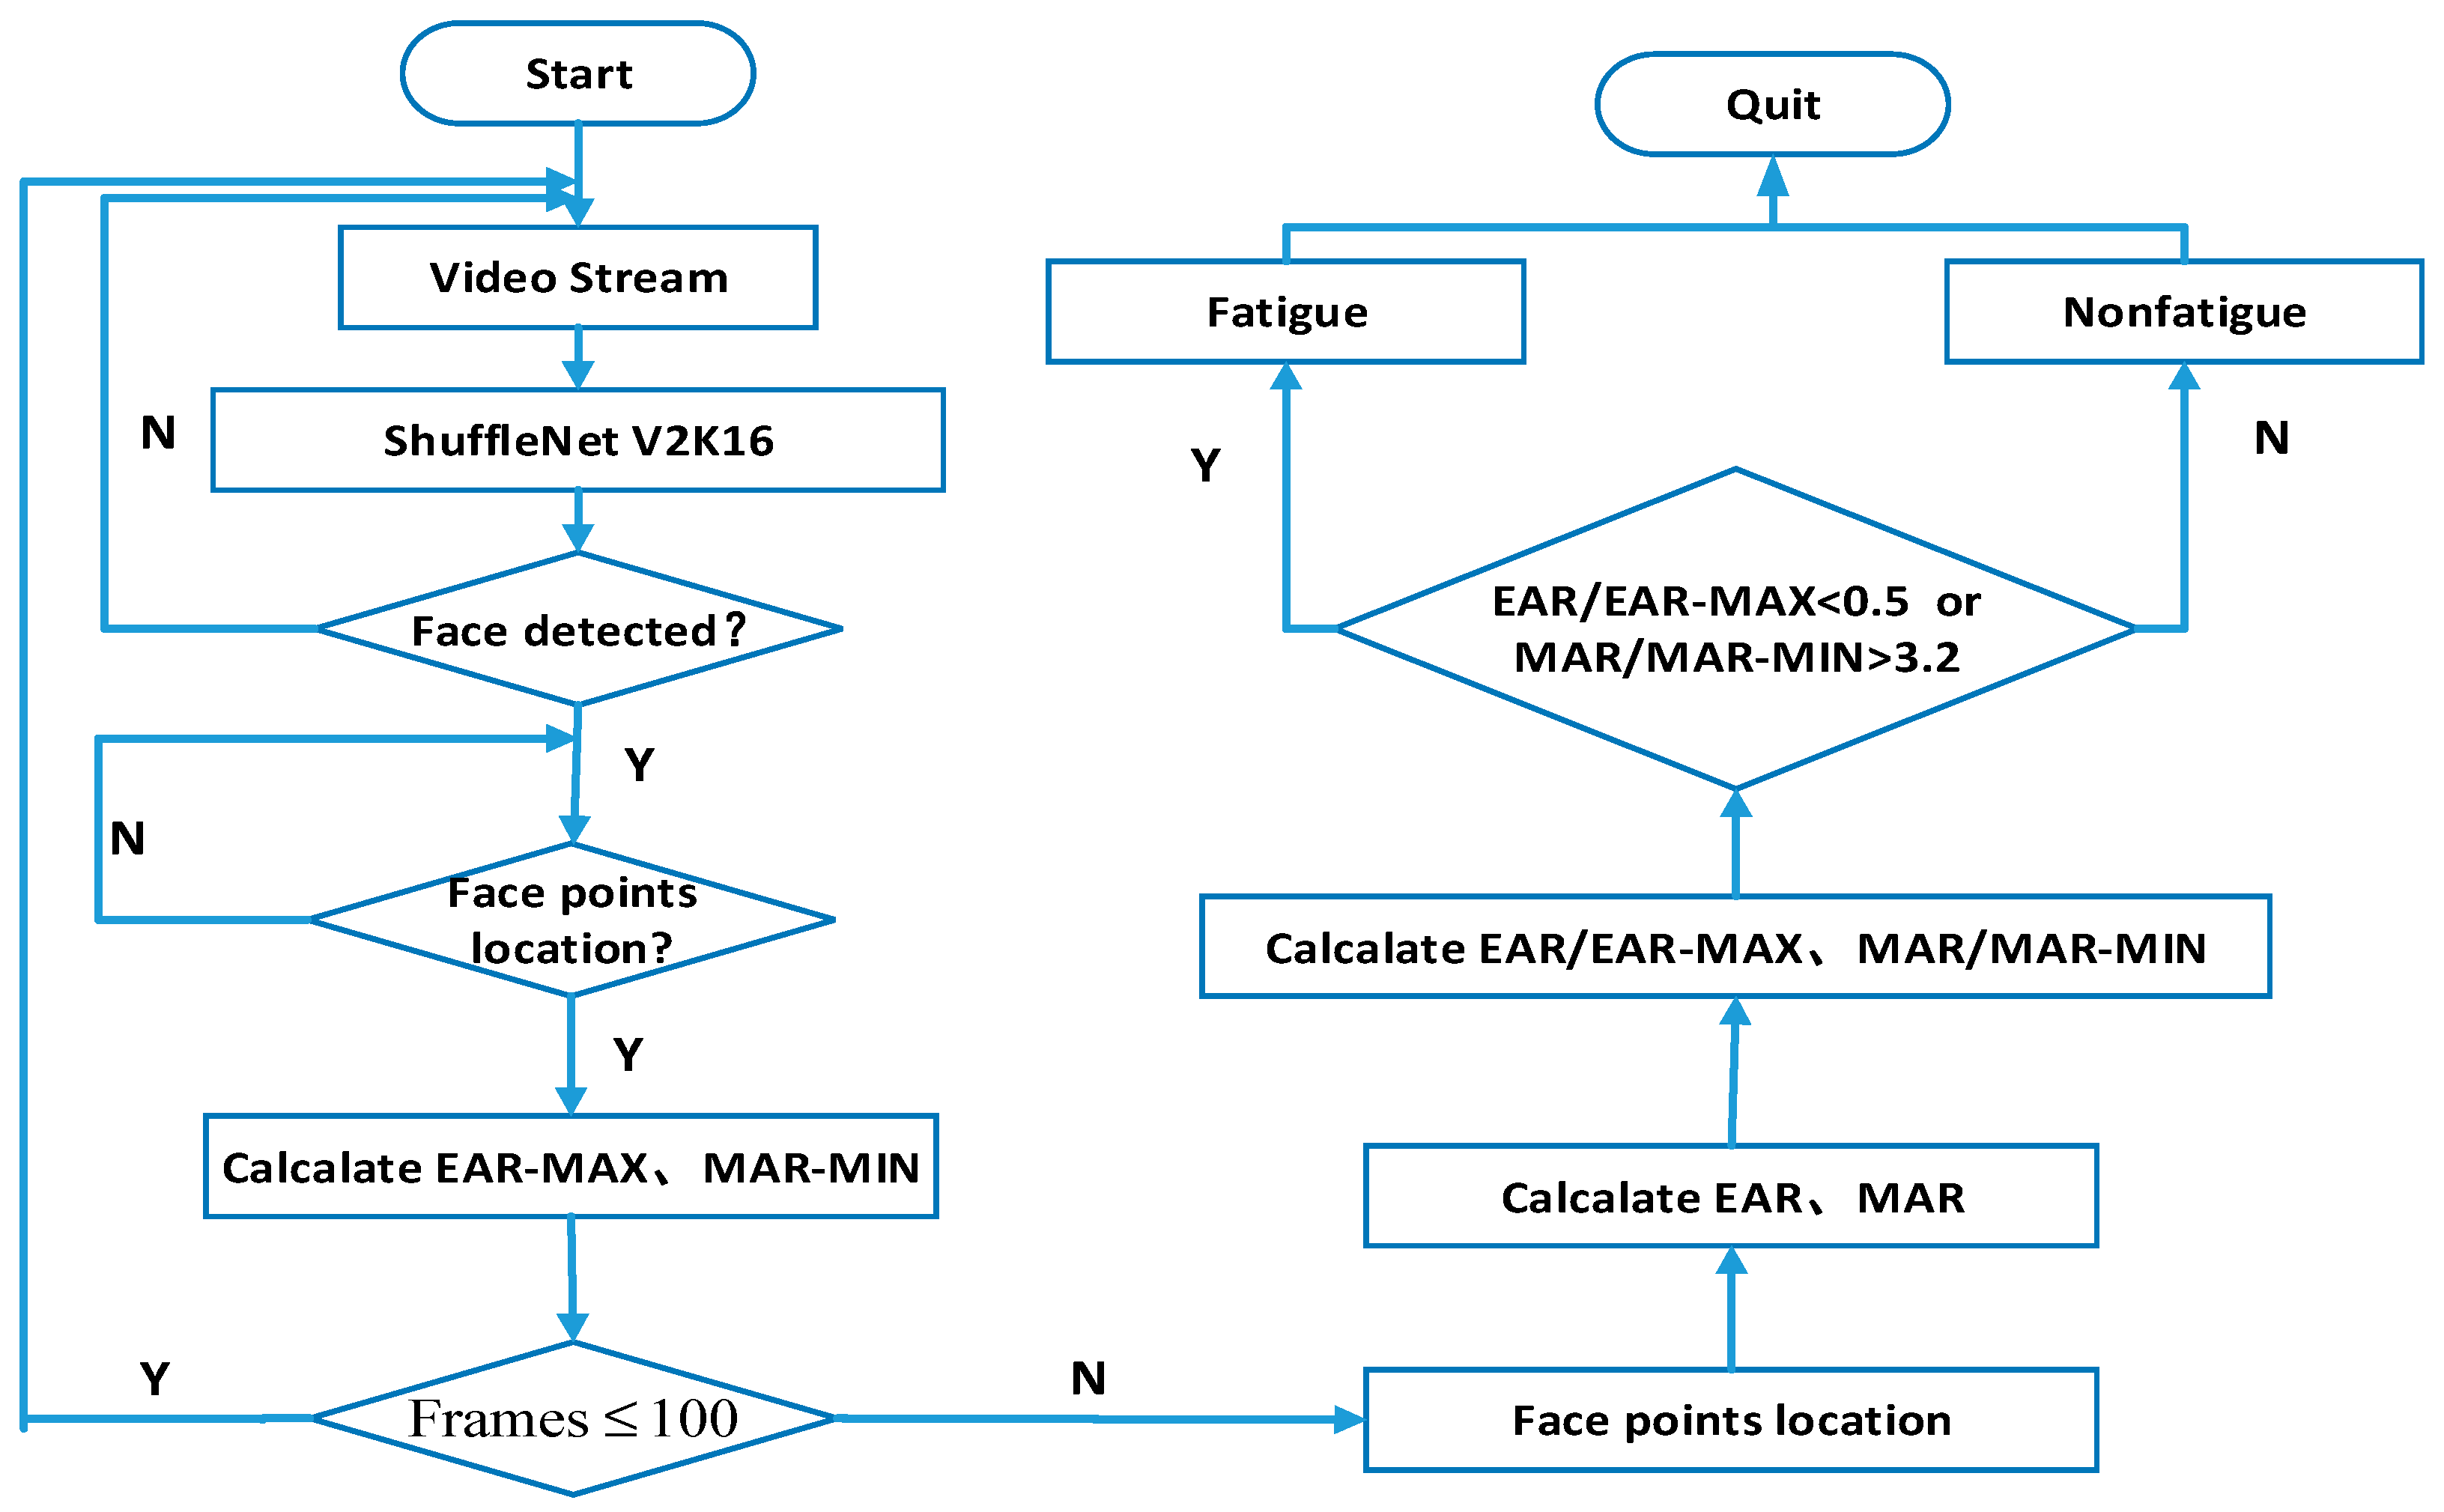
3.2. The MAX-MIN Algorithm

The condition of the driver’s eyes and lips can be used in tiredness detection to identify whether or not the driver is fatigued. The face structure is located to acquire the facial features; the precise image is given in Figure 4 [14].

3.2.1. Eye Condition Evaluation Index

The distance between the upper and lower eye feature points changes somewhat when the eyes are opened and closed. The EAR is obtained by using the relative distances between the eye feature points. The coordinates of the left and right eye points are 60–65 and 66–71, respectively, as can be seen in Figure 4.
E A R = P 61 P 65 + P 62 P 64 2 P 60 P 63
The formula for the right eye is similar.

3.2.2. Mouth Condition Evaluation Index

When a driver yawns, the mouth opens and closes similarly to the eyes, and some scholars use the key points of the outer lip for detection. The MAR value is obtained by calculating the relative distance between the feature points of the mouth. From Figure 4, it can be seen that the key points of the mouth are 72–88.
The formula for calculating MAR is as follows:
M A R = P 73 P 83 + P 77 P 79 2 P 72 P 78
The numerator part of the expression represents the Euclidean distance between the vertical feature points, and the denominator subscripts represent the Euclidean distance between the horizontal feature points of the eyes and the mouth.

3.2.3. The MAX-MIN Algorithm Evaluation Metrics

Driving while fatigued is a complex psychological and physiological condition that occurs in real-world driving situations. The findings of the detection are easily influenced by different settings. In this paper, the MAX-MIN algorithm is indeed suggested. Based on the EAR and MAR formulas, this method performs a new calculation. In actuality, the driver’s eyes and mouth differ due to individual differences, and in many old studies, the EAR and MAR were typically calculated as a fixed value to evaluate whether or not the driver was fatigued, neglecting the variations between individual drivers. Figure 5 illustrates that each driver’s eyes and lips are not the same sizes in reality. As a result, the EAR and MAR values may differ. The first 100 frames of each movie in the dataset are used to calculate the EAR-MAX and MAR-MIN values in this paper. Additionally, new values a and b are assigned once the EAR and MAR values of each succeeding frame are compared to the EAR-MAX and MAR-MIN values.
a = E A R E A R M A X b = M A R M A R M I N
Finally, Figure 6 shows the flow diagram for the driver fatigue detection system based on the MAX-MIN algorithm.

4. Experiment and Analysis

In order to confirm the algorithm’s efficacy, in this study, we trained the adaptive driver facial feature fatigue detection algorithm using a public dataset, and then we evaluated the method using a self-built dataset (SBD) to ensure that it is practical.

4.1. Simulation Environment

Table 1 displays the setup of the computer hardware used in this experiment. The experiments in this work were performed with Python 3.7, an Intel(R) Core(TM) i7-10870H CPU, and an NVIDIA GeForce RTX 4090 GPU in a Windows 10 environment for model training.

4.2. The Datasets

In this research, two primary types of datasets were used for experiments to test the efficacy of the proposed MAX-MIN algorithm in the driver fatigue detection task. The model and algorithm were used to test the driver’s yawning and closed eyelids. For eye and mouth detection, the first class chooses the publicly accessible YawDD video dataset; videos of many drivers behind the wheel can be found there. The movies are split into two sections: one was recorded from the camera mounted beneath the rearview mirror of the vehicle and measured the driver; the other was recorded from the camera mounted above the dashboard and faces the driver, capturing a 30-frame-per-second frontal image of the driver. Each driver had three to four videos taken. The generalizability of the model was tested using this dataset. The dataset’s frontal portion was used in this paper. There are 322 films in this dataset showing drivers of various races, including men and women, wearing and not wearing eyeglasses and sunglasses. Figure 7 displays a few examples of the YawDD dataset. The second dataset is our own SBD. To collect data for our study, six healthy drivers (three men and three women, aged 20 to 40 years) were recruited to participate in the SBD real-world driving environment. Participants were required to possess a valid driver’s license and log more than 1000 km annually. Each driver recorded approximately 8 min of their driving behavior while adhering to instructions that prohibited mobile phone use, smoking, conversing with passengers, yawning while dozing off, or closing their eyes. The driving conditions were sunny, with clear roads and safe traffic, providing an optimal day for data collection. The data were collected between 8:00 and 17:00. The video footage captured various realistic scenarios of driving behavior, such as yawning, conversing, and closing one’s eyes. Figure 8 displays an example scenario of a driver yawning in the video. In addition to the real-world data, we also included a 30 s video of simulated fatigue as part of our experimentation for detection purposes. It is important to note that all participating drivers were in excellent physical health and had no relevant illnesses.

4.3. Training and Evaluation Index for Target Detection

The training dataset was the YawDD dataset. The learning rate was set to 0.01 for the first 20 iterations and 0.001 for the final 20. The training procedure was iterated 50 times.
The evaluation metrics selected in the experiments include precision, recall, and F-score.
(1) Precision
Equation (4) illustrates the formula which is used to gauge the precision of recognizing driver weariness.
P r e c i s i o n = T P T P + F P
The phrase TP represents how many times the motorist was correctly identified as being exhausted, while FP indicates how many times the driver was incorrectly identified as being fatigued.
(2) Recall
The recall rate serves as a barometer for fatigue detection. Equation (5) gives the formula for this quantity, which displays the rate of missed driver fatigue detection by the system.
R e c a l l = T P T P + F N
The FN in the calculation represents the number of times the system mistakenly interprets the driver’s state as non-fatigue when in fact the driver is in a state of fatigue.
(3) F-Score
The F-score is a comprehensive index designed to measure the performance of the system for detecting driver tiredness more thoroughly while balancing the influence of the precision and recall rates. The greater the F-score, the better the performance; the expression is shown in Equation (6). It is a way of combining the precision and recall of the model, and it is defined as the harmonic mean of the model’s precision and recall.
F S c o r e = 2 × P r e c i s i o n × R e c a l l P r e c i s i o n + R e c a l l

4.4. Fatigue Testing Experiments

The experimental data used for detecting weariness were YawDD videos. Each video depicts various signs of exhaustion, including yawning and closed eyes. Figure 9 displays the detection results. The tiredness condition was assessed using the EAR-MAX and MAR-MIN assessment indices, respectively. A number of experiments were carried out to confirm the efficacy of the proposed individual-differences-based fatigue detection method. When several drivers blinked and yawned while driving, the level of weariness was assessed based on the feature values of the eyes and lips [12].

4.4.1. MAX-MIN Threshold Setting

In this experiment, 12 videos of YawDD drivers were chosen, including both male and female drivers, as well as drivers with and without spectacles. The 12 videos of drivers acquired in the driving environment were used as the basis for defining the MAX-MIN threshold. These videos featured a lot of awake and exhausted phases.
Furthermore, the parameters undetected and false detections were established for optimization in order to reduce the MAX-MIN threshold value’s error rate. False detection is the opposite of undetected, which indicates that the system wrongly believes the driver is fatigued even if they are not. Undetected refers to a situation when the driver is exhausted, but the system is unable to detect it.
As demonstrated in Figure 10, the threshold value of EAR/EAR-MAX is 0.5, which corresponds to the lowest false detection rate and failure rate of driver tiredness detection. The lowest rates of false detection and non-detection of driver weariness occur when MAR/MAR-MIN is 3 or 4. The mouth opens and shuts while driving much less frequently than the eyes do. As a result, in the actual experiment, the mouth was more susceptible to influence than the eyes. As a result, eye detection likewise has a much higher proportion of false positives than mouth detection. The threshold value of EAR/EAR-MAX is set lower, and the threshold value of MAR/MAR-MIN is set higher in order to reduce false detections and missed detections in eye detection. When considered together, the threshold-setting scheme is as follows:
(1) The driver is in a fatigued driving state if the ratio of EAR/EAR-MAX is less than 0.5.
(2) The motorist is deemed to be operating their vehicle while fatigued if the MAR/MAR-MIN score is higher than 3.2.
Precision, recall, and F-score evaluation measures were utilized to gauge the MAX-MIN algorithm’s superiority and confirm the scheme’s precision. The findings demonstrate that the MAX-MIN algorithm used in this paper’s driver fatigue state detection has a detection precision of 98.8%, a recall rate of 90.2%, and an F-score of 94.3%.

4.4.2. Fatigue Testing and Comparison Experiment

Two sets of comparison experiments were carried out in the same experimental environment to fully demonstrate the effectiveness of MAX-MIN proposed in this paper: (1) the first set of comparison experiments used EAR and MAR for driver fatigue detection; (2) the second set of comparison experiments used the MAX-MIN algorithm to obtain the values of EAR/EAR-MAX and MAR/MAR-MIN, respectively, and used the MAX-MIN values to determine whether the driver is fatigued or not. The methods were tested on the same dataset and evaluated in three ways: precision, recall, and F-score.
Figure 11 demonstrates the thresholds at which the values of EAR, EAR/EAR-MAX, MAR, and MAR/MAR-MIN fluctuate when the driver is yawning or has closed their eyes. This study can correctly identify the tired states of closed eyes and yawning, according to the proposed algorithm.

4.4.3. The MAX-MIN Algorithm Fatigue State Detection Experiments

As the test dataset for fatigue state detection, a self-made dataset (SBD) was used. There were eight videos in the test data. The dataset contains four types of driver states: eyes open, eyes closed, mouth open, and mouth closed. After processing the videos, a total of 24,325 images were obtained. There were 3800 images with open eyes, 2264 images with closed eyes, 12,046 images with open mouths, and 6215 images with closed mouths. According to the 7:2:1 rule, the dataset was divided into three parts: training, testing, and validation. Table 2 displays the results of the MAX-MIN algorithm test.

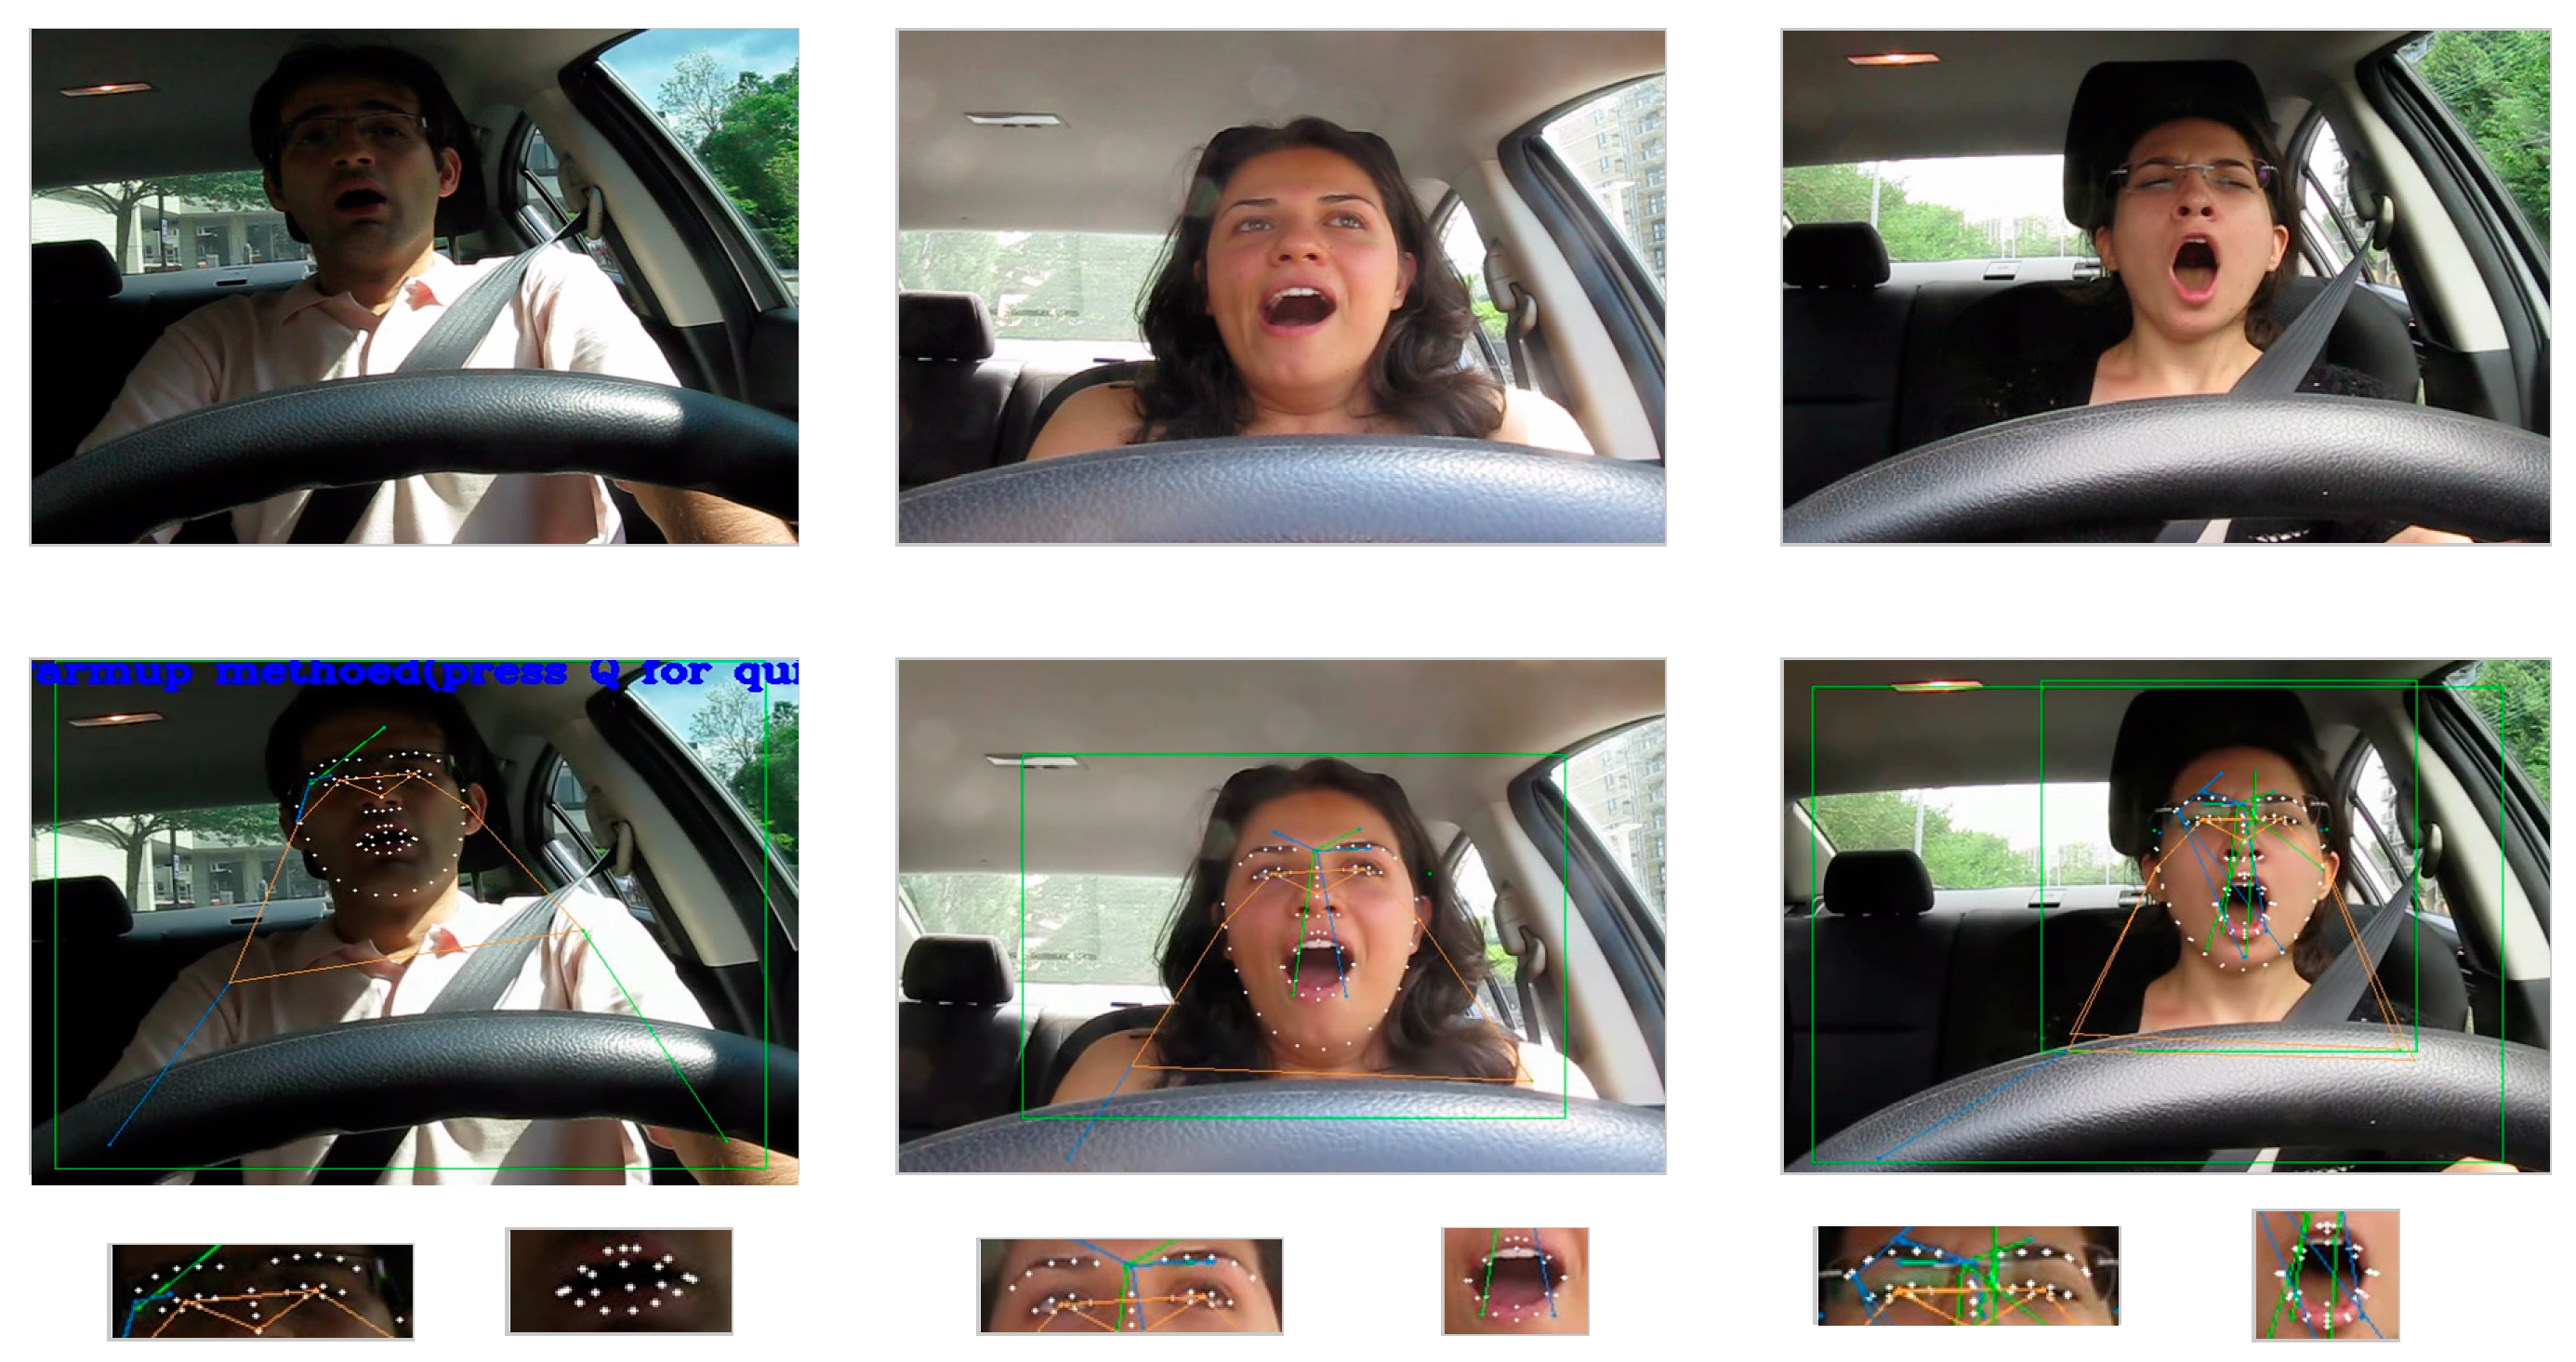
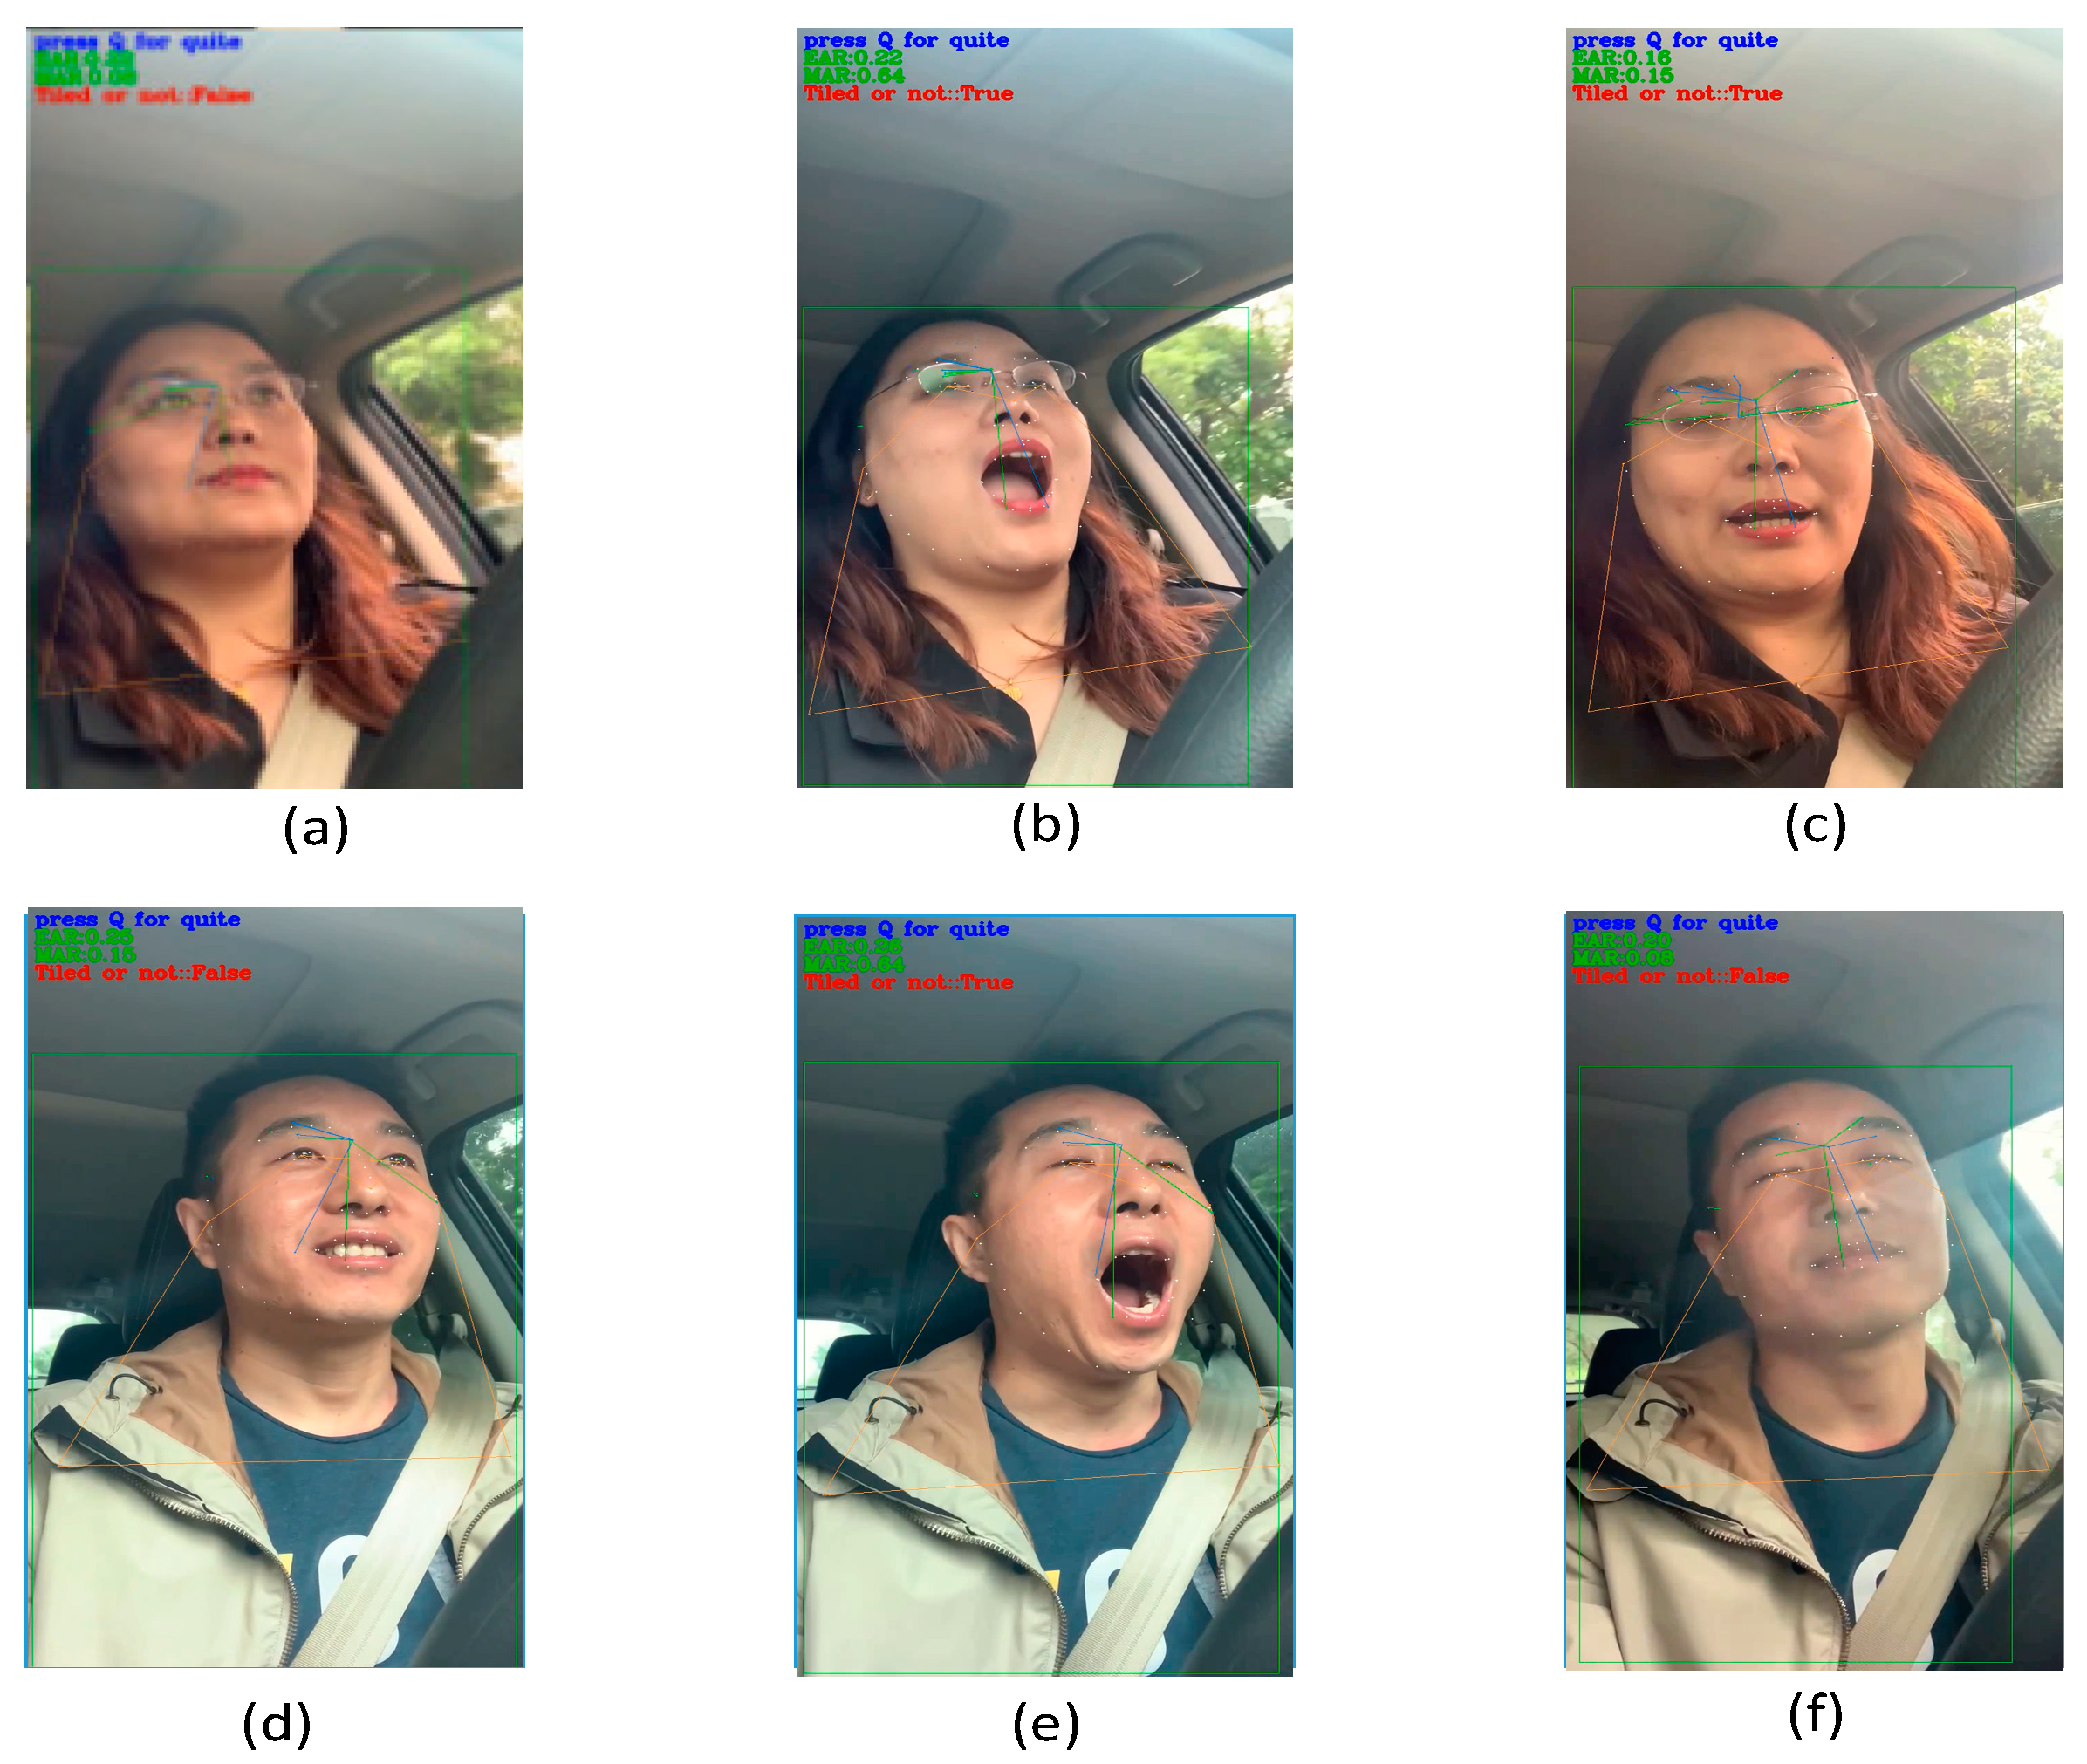
4.5. Actual Scene Detection Experiment

Six healthy car drivers were also chosen to record roughly 8 min of driving videos in a genuine driving environment for detection in order to confirm the efficacy of the MAX-MIN algorithm developed in this work for driver fatigue state detection in realistic circumstances. The drivers can be seen in the films conversing, yawning, and performing other real-life activities. For the test, a simulated tiredness video lasting 30 s was chosen at random. In a real-world scenario, Figure 12 shows the fatigue detection technique employing a single EAR and MAR. Figure 13 shows the MAX-MIN proposed in this paper’s approach for detecting driver weariness under comparable circumstances.
In this paper, testing was carried out using the open dataset YawDD and the custom-built dataset SBF. Male and female test results were adopted, respectively. Table 3 displays the comparative outcomes.
The above table shows that the algorithm in this paper can accurately and quickly determine the driver’s fatigue status. Table 4 shows the results of a comparison of the MAX-MIN algorithm proposed in this paper with other algorithms.
The experiments show that the proposed MAX-MIN algorithm outperforms other algorithms in the literature. The precision of driver fatigue detection using the proposed algorithm in this paper is 98.8%, the recall rate is 90.2%, and the F-score is 94.3%. The results show that the algorithm proposed in this paper can accurately determine the driver’s fatigue state.

5. Conclusions

The goal of this paper was to investigate the method of detecting driver fatigue. ShuffleNet V2K16 was used in conjunction with Dlib to locate feature points and compute feature values for the driver’s face. By comparing the EAR and MAR of the first 100 frames, the EAR-MAX and MAR-MIN values were calculated. The MAX-MIN algorithm was used in this paper to calculate the feature points of the driver’s mouth and eyes. It was tested in YawDD and on a dataset created by the author (SBD). The experiment’s precision was 98.8%, its recall was 90.2%, and its F-score was 94.3%. The problem is that the thresholds cannot be standardized due to individual differences in the size of the driver’s eyes and mouth. To address the aforementioned issues, a MAX-MIN algorithm based on the features of the eyes and mouth is proposed in this paper. It significantly improves the detection of driving fatigue. Experiments show that the proposed algorithm can significantly improve driving fatigue detection precision under a variety of driving conditions. We will concentrate our future research efforts on the following areas:
(1) Carry out the aforementioned research on the car to further study the recognition effect under similar night driving conditions;
(2) Investigate the improvement in the recognition effect under driver head posture movement;
(3) Increase the experimental sample and the number of drivers in the dataset as well as further research the impact of diverse driving environments on the detection of driver fatigue. The MAX-MIN algorithm’s performance and applicability for real-world detection will be improved.

Author Contributions

Conceptualization, H.Z. methodology, H.Z.; software, H.Z.; validation, H.Z.; formal analysis, H.Z.; investigation, H.Z.; resources, H.Z.; data curation, H.Z.; writing—original draft preparation, H.Z.; writing—review and editing, Y.W.; visualization, X.L.; supervision, Y.W.; project administration, Y.W.; funding acquisition, Y.W. All authors have read and agreed to the published version of the manuscript.

Funding

This research is supported by the National Natural Science Foundation of China (72271006) and the National Key Research and Development Program of China (2018YFB601003). This research is supported by the Guangxi First-class Discipline Construction Project Electronic Information (Hechi University), and this research is supported by the Key Laboratory of AI and Information Processing (Hechi University), Education Department of Guangxi Zhuang Autonomous Region.

Institutional Review Board Statement

Not applicable.

Informed Consent Statement

Not applicable.

Data Availability Statement

Not applicable.

Conflicts of Interest

The authors declare no conflict of interest.

References

  1. Lal, S.; Craig, A. A critical review of the psychophysiology of driver fatigue—ScienceDirect. Biol. Psychol. 2001, 55, 173–194. [Google Scholar] [CrossRef]
  2. He, J.; Chen, J.; Liu, J.; Li, H. A Lightweight Architecture For Driver Status Monitoring Via Convolutional Neural Networks. In Proceedings of the 2019 IEEE International Conference on Robotics and Biomimetics (ROBIO), Dali, China, 6–8 December 2019; IEEE: Piscataway, NJ, USA, 2019. [Google Scholar]
  3. Abtahi, S.; Omidyeganeh, M.; Shirmohammadi, S.; Hariri, B. YawDD: A yawning detection dataset. In Proceedings of the 5th ACM Multimedia Systems Conference, Virtual Event, China, 20–24 October 2014; pp. 24–28. [Google Scholar]
  4. Guo, X.; Li, S.; Yu, J.; Zhang, J.; Ma, J.; Ma, L.; Liu, W.; Ling, H. PFLD: A practical facial landmark detector. arXiv 2019, arXiv:1902.10859. [Google Scholar]
  5. Kreiss, S.; Bertoni, L.; Alahi, A. Pifpaf: Composite fields for human pose estimation. In Proceedings of the IEEE/CVF Conferaence on Computer Vision and Pattern Recognition, Long Beach, CA, USA, 15–20 June 2019; pp. 11977–11986. [Google Scholar]
  6. Hu, Y.; Lu, M.; Lu, X. Driving behavior recognition from still images by using multi-stream fusion CNN. Mach. Vis. Appl. 2019, 30, 851–865. [Google Scholar] [CrossRef]
  7. Xiang, W.; Wu, X.; Li, C.; Zhang, W.; Li, F. Driving Fatigue Detection Based on the Combination of Multi-Branch 3D-CNN and Attention Mechanism. Appl. Sci. 2022, 12, 4689. [Google Scholar] [CrossRef]
  8. Ansari, S.; Naghdy, F.; Du, H.; Pahnwar, Y.N. Driver mental fatigue detection based on head posture using a new modified reLU-BiLSTM deep neural network. IEEE Trans. Intell. Transp. Syst. 2021, 23, 10957–10969. [Google Scholar] [CrossRef]
  9. Jia, H.; Xiao, Z.; Ji, P. Fatigue driving detection based on deep learning and multi-index fusion. IEEE Access 2021, 9, 147054–147062. [Google Scholar] [CrossRef]
  10. Han, H.; Li, K.; Li, Y. Monitoring driving in a monotonous environment: Classification and recognition of driving fatigue based on long short-term memory network. J. Adv. Transp. 2022, 2022, 6897781. [Google Scholar] [CrossRef]
  11. Moslemi, N.; Azmi, R.; Soriano, M. Driver distraction recognition using 3d convolutional neural networks. In Proceedings of the 2019 4th International Conference on Pattern Recognition and Image Analysis (IPRIA), Tehran, Iran, 6–7 March 2019; IEEE: Piscataway, NJ, USA, 2019; pp. 145–151. [Google Scholar]
  12. Zhu, T.; Zhang, C.; Wu, T.; Ouyang, Z.; Li, H.; Na, X.; Ling, J.; Li, W. Research on a real-time driver fatigue detection algorithm based on facial video sequences. Appl. Sci. 2022, 12, 2224. [Google Scholar] [CrossRef]
  13. Ma, N.; Zhang, X.; Zheng, H.T.; Sun, J. ShuffleNet V2: Practical Guidelines for Efficient CNN Architecture Design. In Proceedings of the European Conference on Computer Vision, Munich, Germany, 8–14 September 2018; Springer: Cham, Switzerland, 2018. [Google Scholar]
  14. Jin, S.; Xu, L.; Xu, J.; Wang, C.; Liu, W.; Qian, C.; Ouyang, W.; Luo, P. Whole-Body Human Pose Estimation in the Wild. In Proceedings of the Computer Vision–ECCV 2020: 16th European Conference, Glasgow, UK, 23–28 August 2020; Springer International Publishing: Berlin/Heidelberg, Germany, 2020. [Google Scholar]
  15. Akrout, B.; Mahdi, W. A novel approach for driver fatigue detection based on visual characteristics analysis. J. Ambient. Intell. Humaniz. Comput. 2021, 14, 527–552. [Google Scholar] [CrossRef]
  16. Fatima, B.; Shahid, A.R.; Ziauddin, S.; Safi, A.A.; Ramzan, H. Driver Fatigue Detection Using Viola Jones and Principal Component Analysis. Appl. Artif. Intell. 2020, 34, 456–483. [Google Scholar] [CrossRef]
  17. Chen, L.; Xin, G.; Liu, Y.; Huang, J. Driver Fatigue Detection Based on Facial Key Points and LSTM. Secur. Commun. Netw. 2021, 2021, 5383573. [Google Scholar] [CrossRef]
Figure 1. General organizational structure.
Applsci 13 05074 g001
Figure 2. Structural characteristics diagram. (a) two stacked convolution layers with the same number of groups. (b) input and output channels and fully related when GConv2 takes data from different groups after GConv1.
Applsci 13 05074 g002
Figure 3. ShuffleNet V2 architecture diagram. (a) the basic ShuffleNet V2 unit; (b) ShuffleNet V2 unit for spatial downsampling (2×).
Applsci 13 05074 g003
Figure 4. Face positioning with 68 points.
Applsci 13 05074 g004
Figure 5. Shows various mouth and eye sizes: (a) variety of mouth sizes; (b) variety of eye sizes.
Applsci 13 05074 g005
Figure 6. Flow chart of the fatigue detection algorithm.
Applsci 13 05074 g006
Figure 7. YawDD dataset: (a) Images of male drivers. (b) Images of female drivers.
Applsci 13 05074 g007
Figure 8. SBD dataset. (a) Images of male drivers. (b) Images of female drivers.
Applsci 13 05074 g008
Figure 9. Face localization, key point detection, and detection of the eyes and mouth.
Applsci 13 05074 g009
Figure 10. Wrong and missed detection experiments for different ratios: (a) shows the wrong and missed detection images under the different EAR and EAR-MAX, and (b) shows the wrong and missed detection images under different MAR and MAR-MIN.
Applsci 13 05074 g010
Figure 11. Comparison experiments between the conventional algorithm and the MAX-MIN algorithm: (a) shows the fatigue state detection comparison between EAR and EAR/EAR-MAX, and (b) shows the fatigue state detection comparison between MAR and MAR/MAR-MAX.
Applsci 13 05074 g011
Figure 12. The effect of the original detection method on the actual scene. (a) Female normal driving; (b) Female driver yawning; (c) Female drivers close their eyes; (d) Male normal driving; (e) Male driver yawning; (f) Male drivers close their eyes.
Applsci 13 05074 g012
Figure 13. The effect of the actual scene MAX-MIN detection method. (a) Female normal driving; (b) Female driver yawning; (c) Female drivers close their eyes; (d) Male normal driving; (e) Male driver yawning; (f) Male drivers close their eyes.
Applsci 13 05074 g013
Table 1. Hardware configuration.
TypeParameter
CPUInter (R) Core(TM)i7-10870H CPU
GPUNVIDIA GeForce RTX 4090
CUDA versionCUDA 10.1
System environmentWindows 10
Table 2. Precision of detection of different states based on MAX-MIN algorithm.
GenderCategoryNumberThe Precision of MAX-MIN Algorithm
FemaleEye Open203298.7%
Eye Closed125898.5%
Mouth Open586299.0%
Mouth Closed268498.6%
MaleEye Open176898.6%
Eye Closed100698.7%
Mouth Open618499.1%
Mouth Closed353198.4%
Table 3. Performance metrics of the MAX-MIN algorithm for detection in YawDD and SBD datasets.
DatasetGenderPrecisionRecallF-Score
YawDDFemale99.1%89.7%94.2%
Male98.7%90.2%94.3%
SBDFemale98.8%90.3%94.4%
Male98.6%90.6%94.4%
Average 98.8%90.2%94.3%
Table 4. A comparison of our results with those in the literature.
AlgorithmPrecisionRecallF-Score
3D head pose estimation [15]98.19%97.3%97.74%
SVM + Adaboost [16]85.28%NANA
TCDCN + KNN [12]95.1%NANA
MTCNN + LSTM [17]93%NANA
3D-CNN + Attention [7]95%95%95%
Proposed98.8%90.2%94.3%
Disclaimer/Publisher’s Note: The statements, opinions and data contained in all publications are solely those of the individual author(s) and contributor(s) and not of MDPI and/or the editor(s). MDPI and/or the editor(s) disclaim responsibility for any injury to people or property resulting from any ideas, methods, instructions or products referred to in the content.

