1. Introduction
The use of electric vehicles is rising in many cities around the world, underpinned by the urgent need to reduce the levels of air and noise pollution and tackle the ever-growing energy-related greenhouse gas (GHG) emissions from conventionally fueled vehicles. Research conducted on large city air pollution metrics indicates that the highest contribution comes from the transportation system, where multiple internal combustion engines work with diesel fuel and spark-ignition engines mainly work with petrol [
1]. Electric vehicles (EVs) promise high efficiency, energy savings, low noise, and zero emissions; however, the lack of supporting charging infrastructure is holding back their prompt and widespread adoption. Although EV charging infrastructure is being installed in several countries, most of them have not been able to install the required number of EV charging stations, except in some states. The world’s highest charging station density (19–20 charging stations per 100 km) appears in the Netherlands, while China is the second-best performing country with 3–4 charging stations per 100 km, and the UK will have approximately 3 charging points per 100 km by 2030 [
2]. Low or almost zero station deployment levels reduce EV adoption. For that reason, it is imperative to support the deployment of an extended network of charging stations to attract private or public vehicle drivers to use EVs. This is a prerequisite to solving efficiently the facility allocation problem, meaning that the number and location of the charging stations composing the respective network should be optimized first while considering certain constraints (budget limitation, charging station capacity, dispersion of the charging demand, etc.). Finding the optimal location for a charging station is a decision that may require considering various and potentially contradictory factors such as driver satisfaction with charging, operator concerns about economics, fleet losses from power outages, grid safety issues, and traffic problems in the transportation system [
3]. Also, electric vehicles’ battery status is a factor that should be taken into account when considering such problems, as the competitive relationship between charging time and performance degradation may render the battery’s optimal fast charging challenging [
4], thus preventing the high adoption of EVs even if the respective infrastructure has been enhanced. In [
5], the researchers have proposed a model for deciding the location and capacity of the EV fast charging stations, along with the optimal multistage expansion of the distribution network to cope with future load growth. This is formulated in three interconnected layers (Layer 1: optimal locations of FCS, Layer 2: optimal numbers of FCSs and CPs, and Layer 3: optimal planning of DN expansion), with a sub-layer of optimal assignment of EVs at FCSs. The solution is carried out along with validation using different metaheuristic methods (Differential Evolution, Symbiotic Organism Search, Arithmetic Optimization Algorithm) and integer linear programming. As emphasized in [
6], the EV charging station placement problem requires the charging network to be pervasive enough such that an EV can easily access a charging station within its driving range and also widely spread so that EVs can compete to displace internal combustion engine (ICE) vehicles.
2. Background
To improve EV charging efficiency, researchers have been working on the Electric Vehicle Charging Station (EVCS) distribution problem, investigating different perspectives in order to reach an optimal allocation scheme. In terms of planning scenarios, several factors and targets have been considered, including the optimal location, number, service type, and capacity of each EVCS to satisfy the user’s needs and ultimately the growth of EV penetration. In terms of solution algorithms, the global research effort has developed a variety of methods and algorithms in order to solve the charging station sizing and placement problem [
7]. In particular, the formulated optimization problems for the placement of EVCS can form a single or multi-objective, linear or nonlinear, convex or concave assembly. According to the used variables, the formulated problem can be continuous, integer, discrete, or combinatory [
8]. The most frequently used algorithms in existing studies can be divided into two types: heuristic/meta-heuristic and mathematical algorithms. Heuristic algorithms are relatively more popular than mathematical ones due to their ability to find a global or near-global optimum solution even in complex problems.
Several studies have attempted to estimate the optimal location of the EVCS by examining alternative distribution scenarios based on a predefined set of candidate EVCS sites. The work in [
9] develops a bi-level mathematical model to optimize the location of charging stations for EVs with consideration of the driving range. The upper level is to maximize the flows served by charging stations, while the lower level depicts route choice behavior given the location of the charging station. Genetic Algorithms have also been employed in [
10] and [
11] to calculate the necessary number of charging stations and best placement positions to satisfy the clients’ demand using origin–destination (OD) data of conventional vehicles and real-world driving data of 196 battery EVs. The research in [
12] uses an intelligent multi-objective optimization method to handle the problem by integrating a multi-objective particle swarm optimization (MOPSO) process to obtain a set of Pareto optimal solutions and an entropy weight method-based evaluation process to select the final solution from the Pareto optimal solutions. The effort in [
13] develops an optimization model of charging station location that considers the waiting time for EVs in the queue for charging as an influencing factor. The minimization of the time cost to EV drivers is performed with the utilization of the hybrid evolutionary algorithm SCE-UA. Another work in [
14] presents a case study for planning the locations of public electric vehicle charging stations with the employment of three different classic facility location models (set covering model, maximal covering location model, and
p-median model) to test the model’s effectiveness. The optimal positioning of EVCS in an urban area is analyzed in [
15] by introducing weighting maps (cost values, distance) for managing different social requirements into the optimization process while utilizing evolutionary algorithms (Particle Swarm Optimization (PSO), Genetic Algorithms (GA), Biogeography-based Optimization (BBO), and Social Network Optimization (SNO)). The proposed solution to the deployment problem applies a greedy approach that consists of placing all the CS, one at a time, such that each one is locally optimal and is tested through various scenarios with a different predefined number of EVCS to appoint. A multi-period optimization problem is proposed in [
16] for EVCS placement, in which the distribution of charging demand is modeled with a combination of node-based and flow-based approaches, so as to model the needs of EVs to recharge on intermediary stops on long-haul travels. For this problem, a mixed-integer linear programming (MILP) formulation is considered. The research in [
17] applies a Geographic Information System (GIS)-based Multi-Criteria Decision Analysis process using the analytical hierarchy process (AHP) to address the electric vehicle charging station site selection in light of 15 environmental, economic, and urbanity criteria. A hierarchical optimization model, integrating three levels of analysis, is also developed in [
18] to assist city planners with charging station location selection and system design. In this work, 10 different locations were considered for EVCS deployment, consisting of shopping malls and cultural centers. A study on expanding existing EVCS networks is realized in [
19], following two different expansion strategies to choose additional sites for charging station placement, with the candidate locations being based on real-world data on charging station utilization and correlation with places of common interest.
Other research studies integrate into the EVCS allocation problem the optimization of its sizing by assigning the optimal charging piles per infrastructure deployed. The work in [
20] examines the optimal EV charging infrastructure location and capacity determination problem, assuming charging queuing behavior with finite queue length constraints. The GA is used to minimize the total cost, which considers charging queuing behavior with finite queue length and various siting constraints in a small-scale case study (20 EVCS candidate locations). The effort in [
21] utilizes Genetic Algorithms to solve the fast-charging station location-and-sizing problem to maximize EV charging station owner profits across a region for BEV owners who wish to charge
en route, taking into consideration elastic demand, station congestion, and network equilibrium. The research in [
22] proposes a multi-criterion-oriented optimization approach to determine the optimal charging station placement and charging piles assignment under multiple constraints, such as recharging demand and cruising range, by employing two different algorithms, the Lazy Greedy with Direct Gain (LGDG) and Lazy Greedy with Effective Gain (LGEG), both based on the greedy method. Public trajectory data collected from the taxi cabs have been utilized for building up and verifying the research work based on the hypothesis that the traveler/driver behavior remains unchanged when switching to driving/taking electric vehicles. The work in [
23] develops a model based on an artificial immune algorithm to identify the optimal solution considering the overall user satisfaction: charging convenience, charging cost, and charging time. In [
24], the planning and sizing model is established to minimize the annual cost of the charging station under multiple constraints that consider the actual load, charging power, and charging distance through the utilization of a neighborhood mutation immune clone selection algorithm. The Analytic Hierarchy Process (AHP) is adopted in [
25] to rank 10 EVCS alternative locations in a large city district by assigning relative weights as input for the mathematical model to determine the number of charging stations to install and their relevant capacities.
In the context of optimal EVCS placement planning, the charging facility type is used to build up the optimization objectives in several research studies. In the study [
26], three typical kinds of charging facilities have been considered: slow-charging facility (SCF), normal-charging facility (NCF), and fast-charging facility (FCF). The resulting optimization model employs mixed-integer second-order cone programming (MISOCP) and aims to minimize the annualized social cost of the whole EV charging system (investment cost of EVCSs, grid reinforcement cost, O&M cost of EVCSs, network losses cost). The research in [
27] establishes a GIS-based multi-objective Particle Swarm Optimization model aiming at minimizing the total cost of charging station investment and maximizing the service coverage. Four types of charging stations are considered, each with different specifications, characteristics, and costs (AC, DC, rated voltage, etc.). The research in [
28] searches for locations, capacity options, and service types for EV charging stations, after estimating charging demand from GPS trajectory data. To solve the corresponding mixed-integer linear programming (MILP) model, a hybrid evolutionary algorithm that combines the non-dominated sorting genetic algorithm-II (NSGA-II) with linear programming (LP) and neighborhood search is proposed. The method adopted in [
29] addresses the EVCS distribution problem through an approach in which, apart from the optimal location, the number of the required charging stations is calculated to cover charging needs. The EVCS placement is estimated through the employment of Genetic Algorithms that estimate the EVCS longitudes and latitudes.
In summary, existing research generally considers optimization models that develop the optimal placement of charging stations upon a predefined set of candidate sites (facility-to-location configuration). Also, the number of stations composing the network is generally considered fixed, with the exception of the research studies in [
20] and [
29], in which the optimization variables include the number of charging stations, with [
20] formulating the problem as a facility-to-location one. This paper aims to fill these gaps by developing an optimization model that determines the optimal number and placement of charging stations freely within the application area (facility-to-site formulation) to cover the distributed EV charging demand. The problem is developed in a bi-objective model with two objectives: minimizing the total cost for the charging station deployment (construction, operational, and maintenance costs) and maximizing service quality by minimizing the average traveling distance (and thus, cost) between demand spots and station locations, while considering any station capacity constraints. This analysis intends to enrich previous research efforts in several directions, in terms of both numerical and practical considerations. The work includes a number of case studies and numerical applications to assess the capability, applicability, and scalability aspects of the model. Overall, the present research aims at an in-depth study and better understanding of the problem characteristics and the quality and practicality of the solutions in a real-life environment.
The rest of the paper is organized as follows.
Section 3 presents the problem description and the proposed model formulation. In
Section 4, 10 case studies are developed and run with the corresponding results presented and commented on.
Section 5 provides a brief discussion of the obtained results and the main conclusions of the study.
3. Proposed Model
Research findings show that EV adoption requires deploying charging infrastructure (in terms of number and location) in a manner that is financially feasible as an investment and also manages to satisfy demands and overcome EV users’ range anxiety. To support this goal, a bi-objective model is introduced for deploying EV charging stations for minimizing the total charging station network cost and maximizing the service quality/user satisfaction by reducing travel distance.
The problem of charging station allocation in space falls within the general class of the Quadratic Assignment Problem (QAP). There are two general methods for dealing with this problem, the facility-to-location and the facility-to-site approach. In the first case, a number of potential sites for facility placement are predefined and the optimization algorithm seeks among them the best placement of the required facilities (stations). In the latter case, the algorithm freely assigns the facility to the solution space aiming at developing the best outcome based on the objective parameters and function. In the present formulation, the facility-to-site approach is primarily employed as it is difficult and rather impractical to predefine a reasonable number of potential station locations, except perhaps a few spots with known high charging demand (e.g., city downtown, shopping malls, etc.) or to exclude certain spots from the solution space if station deployment is infeasible (e.g., area topology, grid restrictions) or experience very low EV demand around it. The main shortcoming (and risk) of the facility-to-location approach is that, by selecting certain points for station deployment, one can omit other points that can potentially lead to better outcomes. In contrast, the facility-to-site approach can search all possible solutions but generally at the expense of higher computation effort. For the purpose of comparison, the problem has also been formulated as a facility-to-location one, based on grid discretization size, and the merits and demerits of both approaches are explored in Case Study 8 below.
In this model development, an area of interest (A) is considered to represent a city or a neighborhood. Within this area, a number of charging stations (either predefined or open to the optimization process) are to be spatially allocated. In its general form, the model seeks two outcomes, the optimal number of stations and their spatial location to best serve the existing EV demand. Two cost (fitness) functions are considered, one for station deployment (f1) and the other for EV users traveling from each origin to its nearest station (f2), which is proportional to the traveling distance. As the decision for station placement is a one-time decision in advance of the operational phase, Euclidean distances have been considered in this formulation. The actual distances as well as the traffic conditions are rather dynamic and may be more effectively considered at the later stage of EV distribution to stations analysis.
The mathematical form of the module is as follows. The demand points are set at predetermined coordinates (DPx, DPy). The decision parameters are the coordinates (CSx, CSy) of the charging stations. Two cost functions f1 and f2 are calculated as indicated in Equations (1) and (2).
where C
station is the total cost for station deployment, comprising the construction (C1), operational (C2), and maintenance (C3) costs, and Si is the number of stations. Although the above parameters have been taken here with fixed values in most of the analyses, it is easy to extend the problem structure to differentiate the costs depending on the size and deployment area of each station, as, for instance, in Case Study 4.
where
dij is the distance between the demand point
j and its closest charging station
i for each of the
N demand points.
The objective function has the form:
where f1 and f2 are the station deployment and user traveling costs, respectively, and wi’s are the weights of the sub-objectives.
There are no major constraints in the model other than constraining the search area within the city bounds. If there are infeasible zones within the search area, these zones are excluded by considering an extremely high station deployment cost (Case Study 10). Some additional constraints are introduced as part of specific case studies that are described in the next section. For instance, constraints on station capacity may be introduced to avoid large deviations in station utilization.
The optimal solution is sought via the application of Genetic Algorithms. These algorithms have been proven consistent and efficient in solving a wide range of NP problems, such as the one of electric vehicle charging station deployment. They rely on bio-inspired operators, including selection, crossover, and mutation across decision variable values (
Figure 1). The chromosome consists of two parts: a string of the (
x, y) coordinates of the charging stations and a string of binary values indicating whether a specific station is going to be deployed or not. For the latter part of the chromosome, if a station gets a value of 1, it is ordinarily evaluated based on its proximity to the demand points; otherwise, it is artificially excluded from evaluation either by using the “if” command or by assigning an additional high transport cost (penalty) to any demand assigned to this station. In each algorithm iteration, the distances from each station to all demand spots are calculated, and each spot is assigned to the nearest station. In this model, parents are chosen using a linear ranking-based mechanism. Then, 10% of the fittest members of the population are carried over to the next generation without any changes (crossover or mutation) to them (elitism). This offers a smoother selection probability curve and prevents good organisms from completely dominating evolution at an early point. The crossover process is implemented using a uniform crossover routine, meaning that instead of chopping the list of variables in a given scenario at some point and dealing with each of the two blocks (“single-point” or “double-point” crossover), two groups are formed by randomly selecting items to be in one group or another. The uniform crossover method is considered better at preserving and generating any schema from the two parents when compared to traditional x-point crossovers that could bias the search with the irrelevant position of the variables. The mutation process is performed by looking at each variable individually. A random number between 0 and 1 is generated for each of the variables in the organism, and if a variable gets a number that is less than or equal to the mutation rate (for example, 0.1), that variable is mutated. Mutating a variable involves replacing it with a randomly generated value (within its valid min-max range).
Part of the analysis is the fine-tuning of the algorithm parameters for the specific problem to achieve better convergence within a reasonable computation time. In particular, the genetic algorithm is parameterized to use 50 chromosomes to form the initial population with crossover and mutation rates of 0.5 and 0.1, respectively. An iterative procedure of 200,000 trials, or 60 min of runtime, is used for all the scenarios that have been tested. Due to the stochastic nature of the GA, the algorithm was run a number of times (typically three or five) in each specific scenario, and the solution with the best fitness value was recorded. The result deviations were also recorded to provide an indication of the solution variability. The implementation has been done with commercial GA software (Palisade Evolver Version 8.3.2), which runs as an add-in to the Excel program. The employment of commercial software is considered adequate at this development stage, which mainly aims to set up the problem while providing more accessibility for practical use. Further, the current evaluation indicates that the solution surface is quite smooth without notable local minima; therefore, the software may be capable of reaching near-optimal solutions. Finally, the employment of the Excel software facilitates the problem setting and test-case configuration.
4. Case Study Development and Results
To illustrate the algorithm application and demonstrate the contribution of the proposed model to the electric vehicle charging station (EVCS) deployment, a case study consisting of a 200-EV fleet is considered. The area of interest in which the EVCS network is deployed is a square one, extending from −50 to 50 in a coordinate system in which 1 length-unit may indicatively represent 100 m to simulate a medium-sized city of 100 km
2. The charging demand has been pseudo-randomly distributed all over the area of interest, while some specific sites concentrate a higher charging demand, representing places of different levels of interest. This type of allocation develops a balance between the necessary scattered distribution and some variation in demand concentration from point to point. In particular, there are 100 demand spots where 1, 2, or 3 EVs have been randomly allocated (
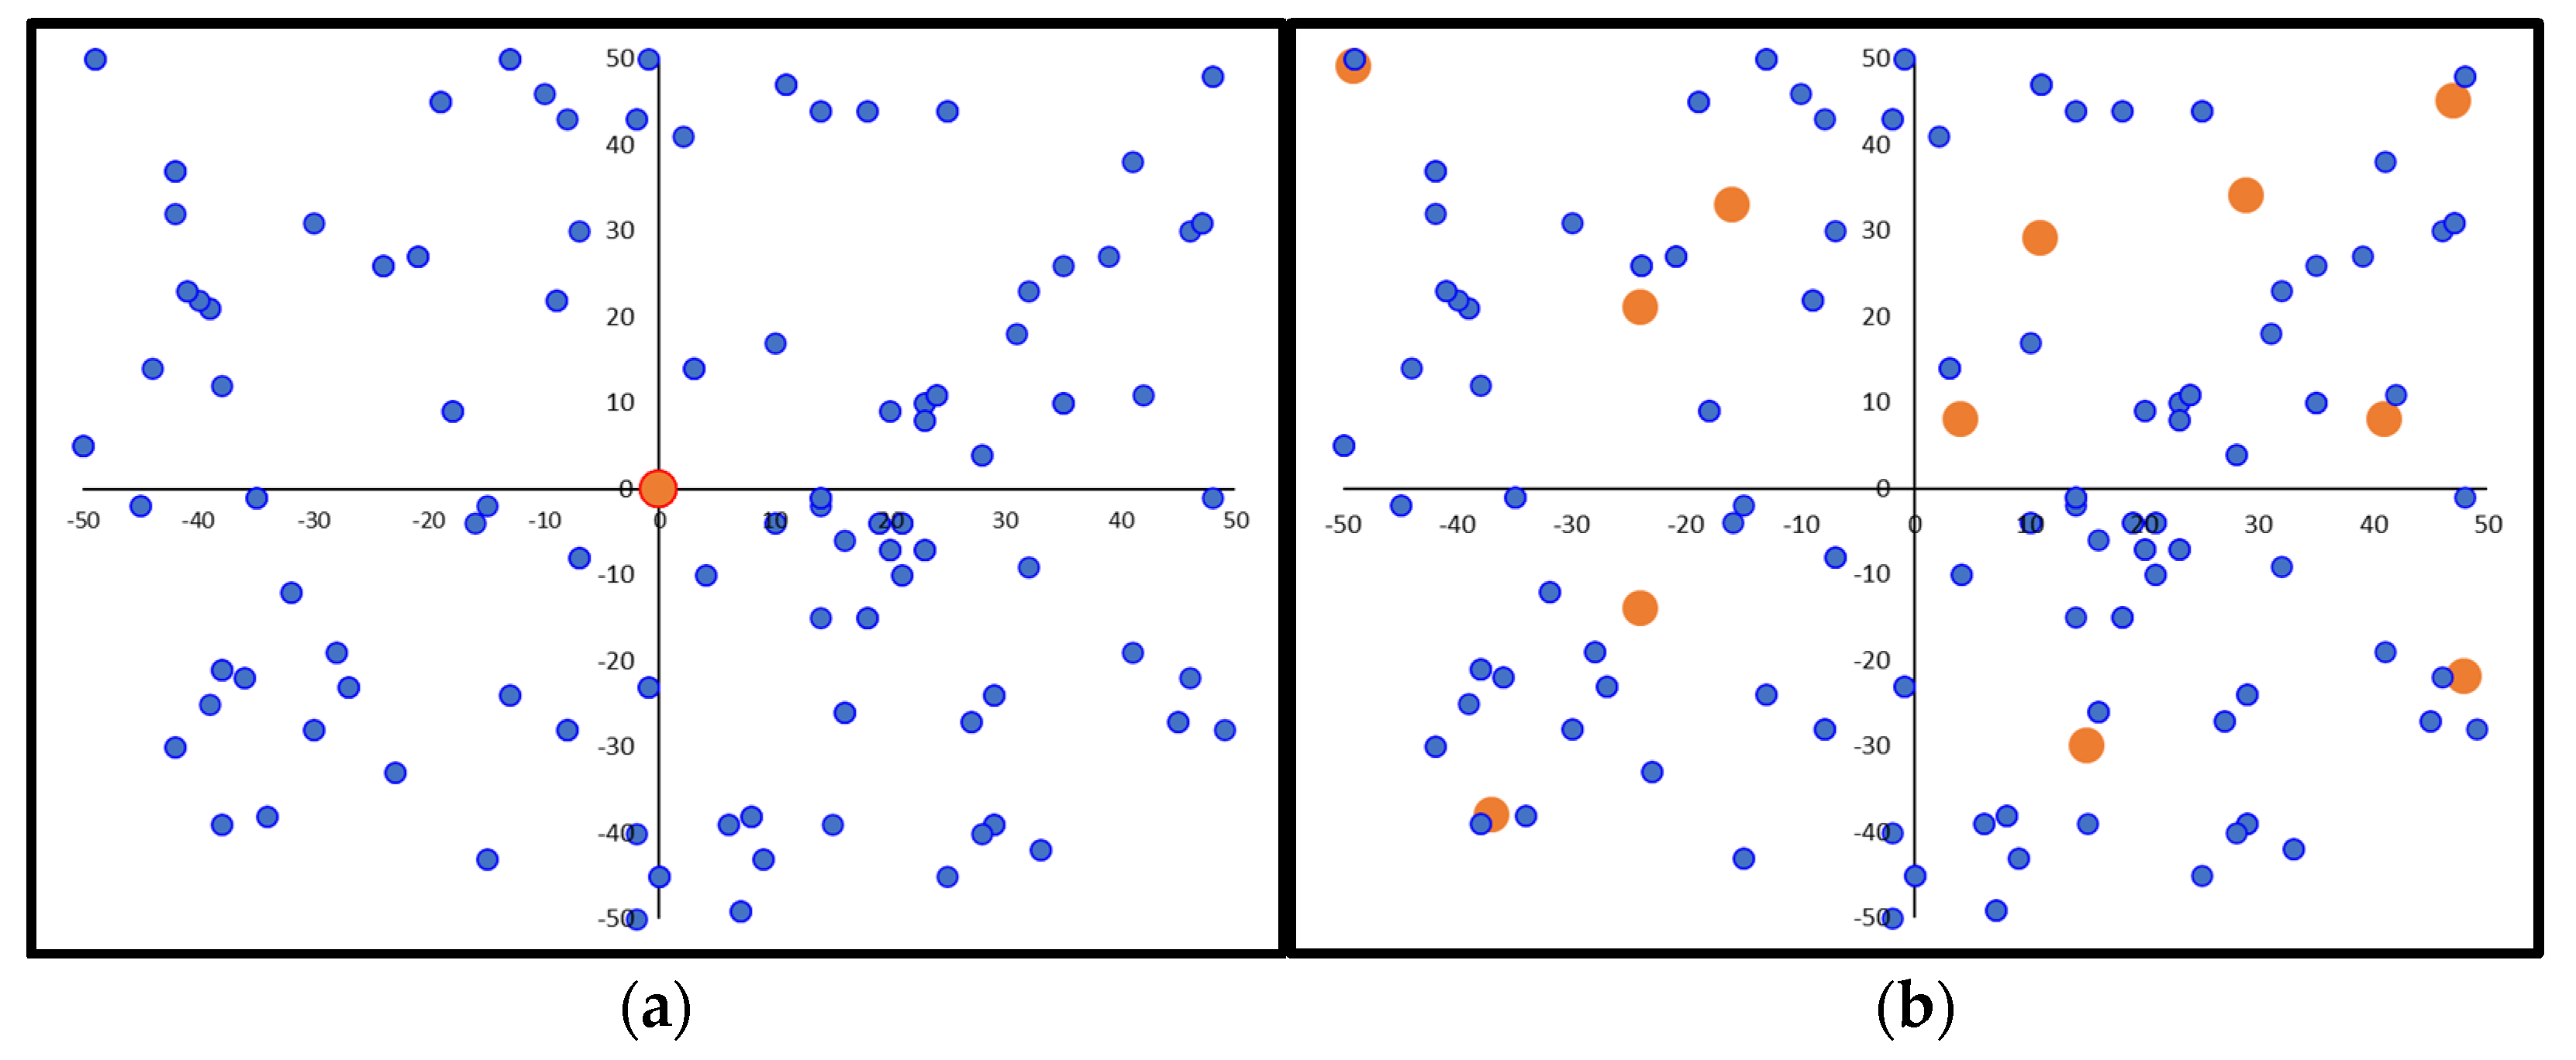
Table S1). The number of charging stations varies from 1 to 25 in the core analysis, while larger numbers of stations are examined as part of a case study. The initial station allocation for the optimization deployment can be anyone, starting from the case of all stations coinciding at the center coordinates (this alternative is mostly used), progressing to a symmetrically scattered positioning within the application space, up to fully random placing in the area (
Figure 2).
The efficiency of the proposed model has been tested through a number of case studies that are summarized in
Table 1 and described in the following subsections. The aim of the analysis is to provide insight and evidence of the algorithm capability in terms of both the mathematical solution vigor and its response potency to practical considerations. In each case, multiple runs have been made (usually three) to account for the result variability due to the probabilistic nature of the genetic algorithm. Different values of the GA parameters (initial population size, crossover, mutation rates, finishing criterion) have been analyzed and appropriately set.
4.1. Case Study 1: Station Allocation for EV Traveling Distance (Cost) Minimization at Different Numbers of Stations
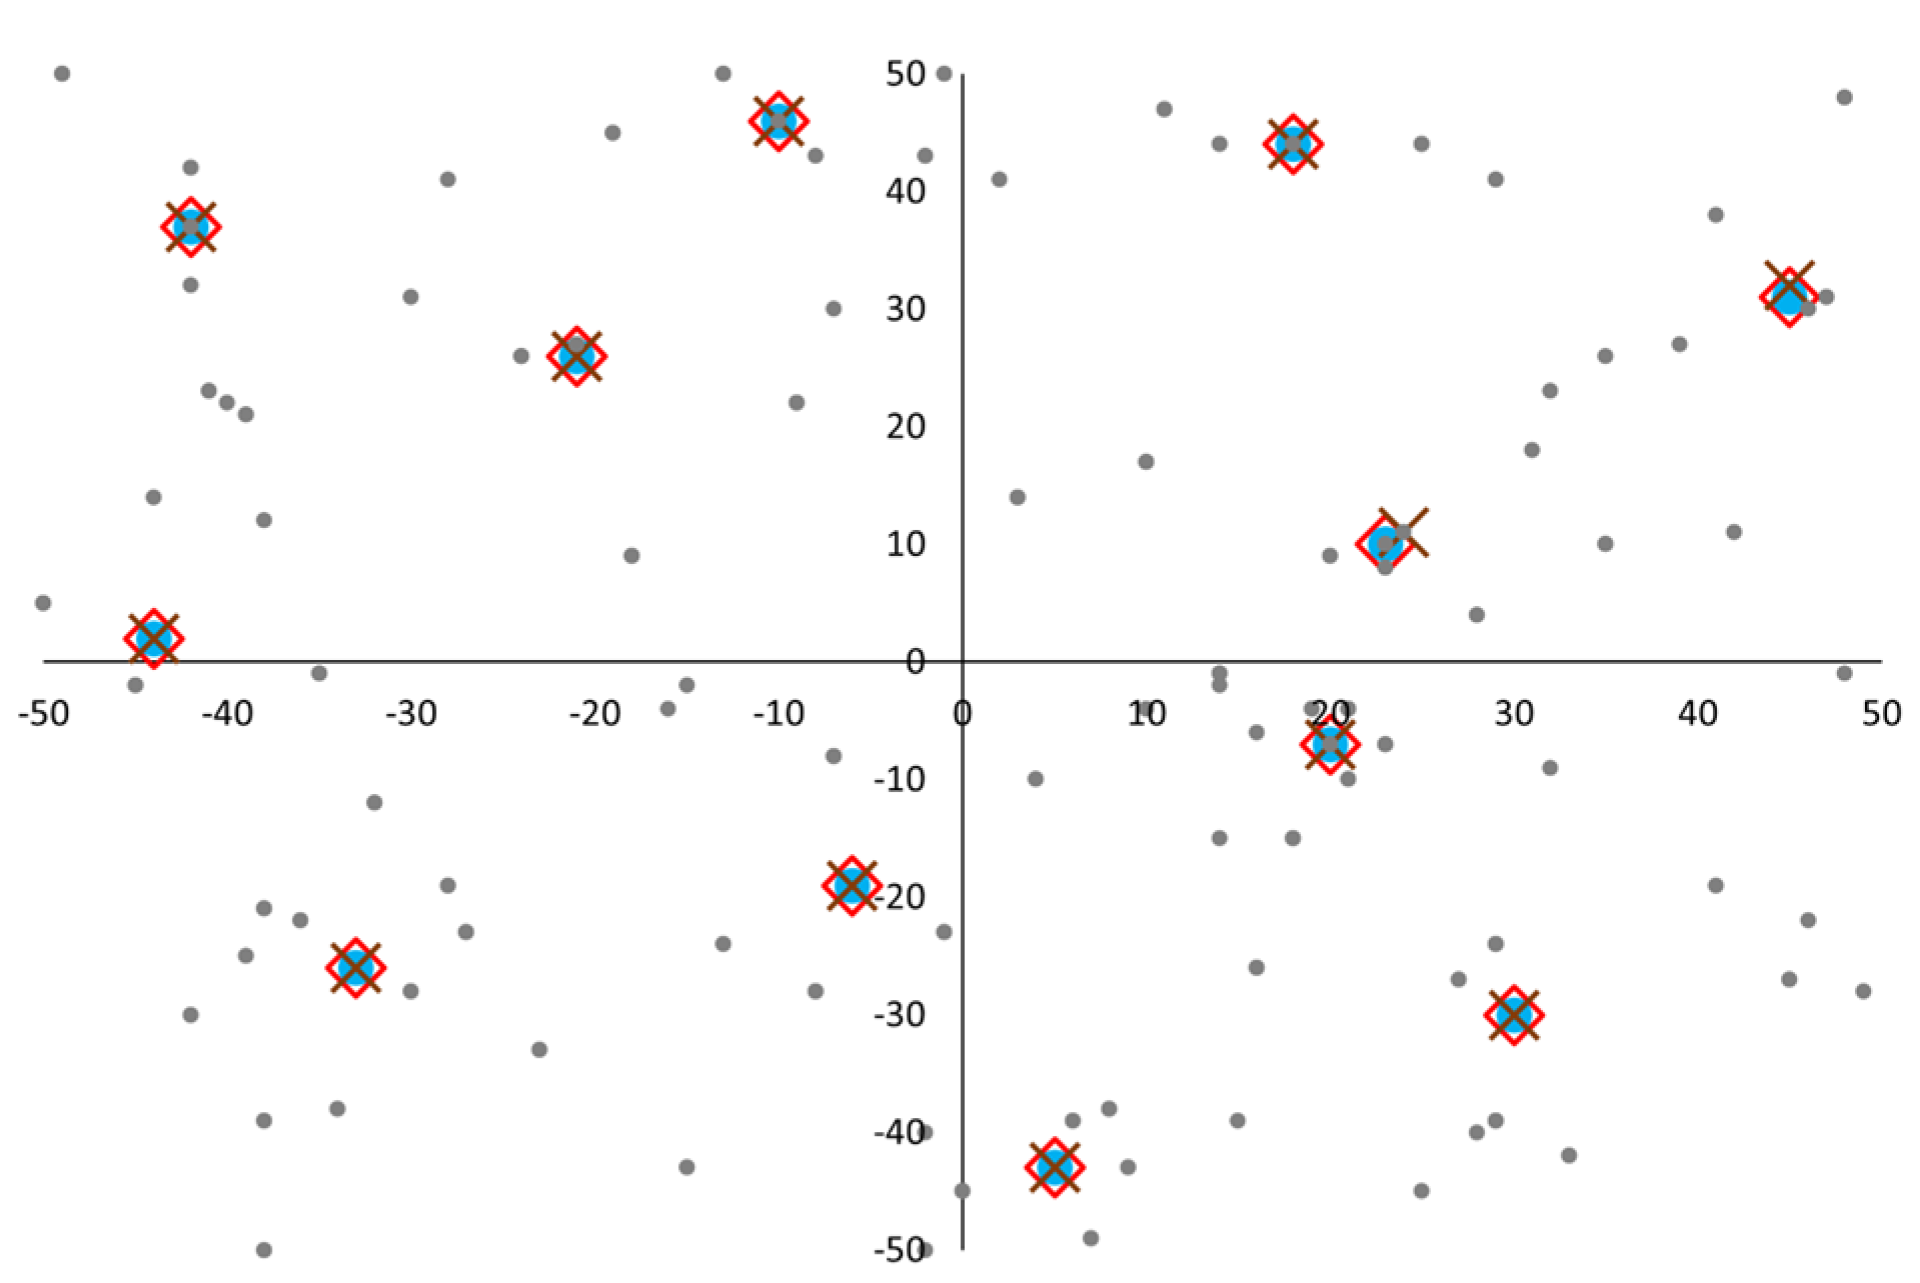
Initially, an exhaustive investigation of all scenarios representing the number of charging stations, from 1 to 25, was performed to develop the best station allocations (i.e., the lowest cumulative traveling distance of all EVs) at every number of stations. There are alternative configurations of station allocation that lead to approximately the same travel cost.
Figure 3 presents three of them being developed by an initial station placement at the center of the area, a symmetrical initial station positioning, and a fully random initial station distribution within the analysis area. It appears that the algorithm converges to virtually the same station settlement regardless of the initial station distribution.
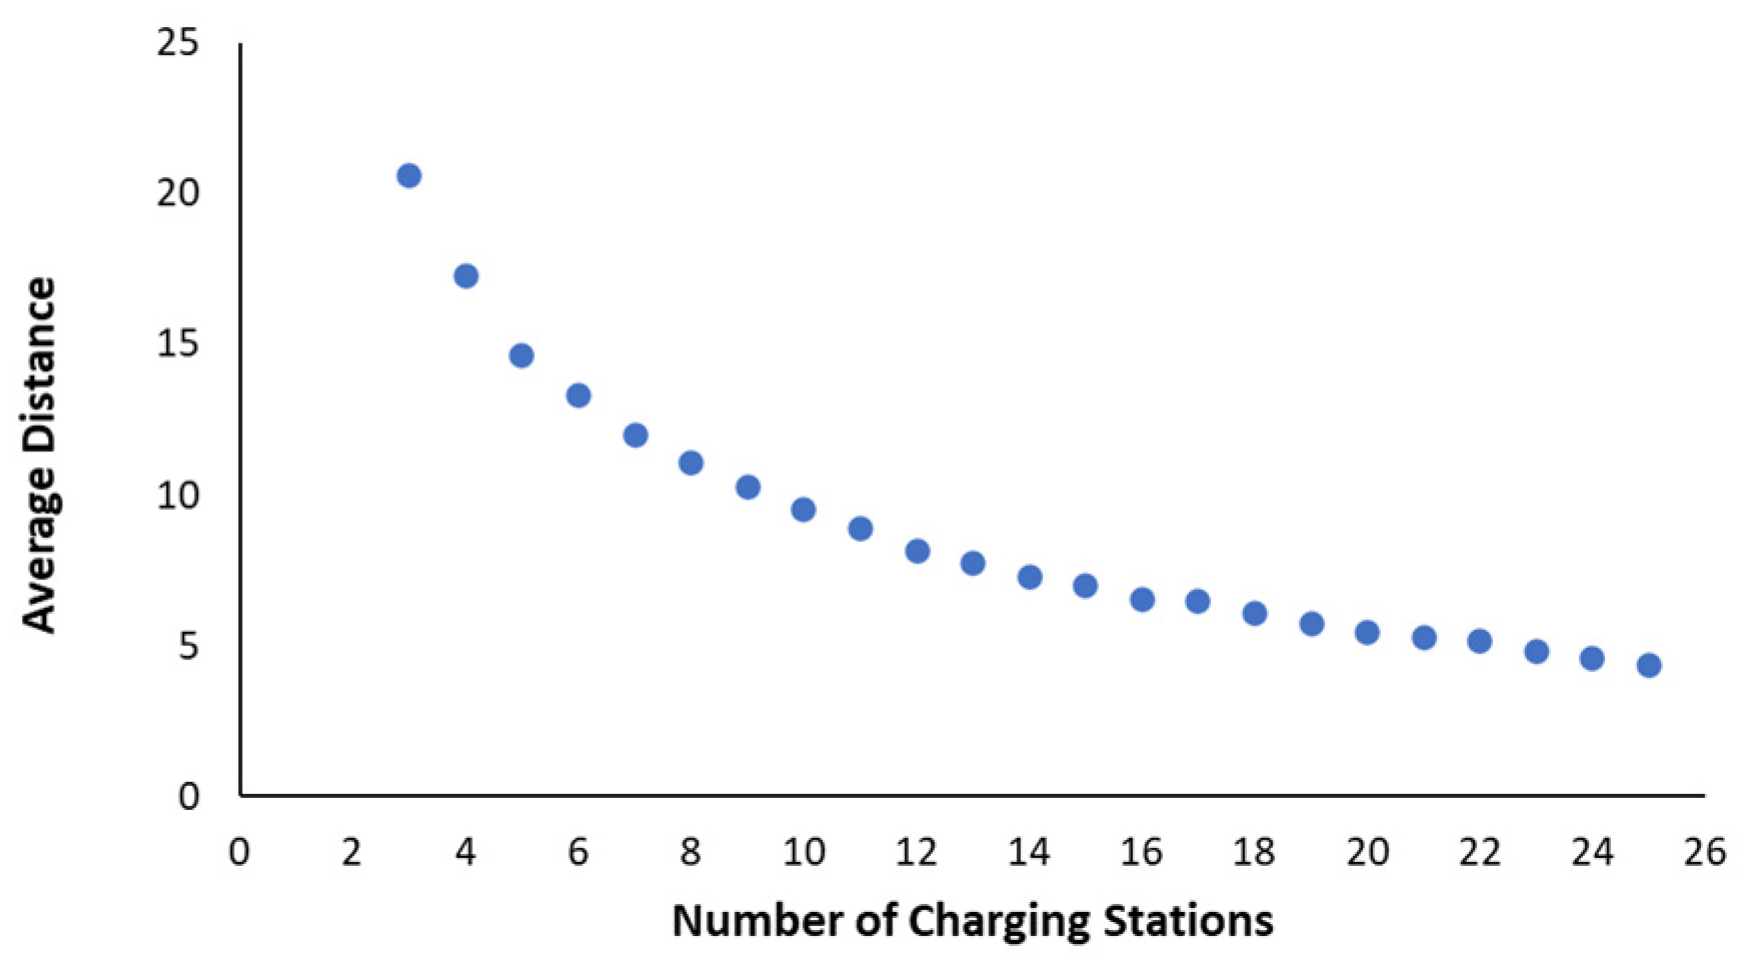
Obviously, as the number of stations increases and the network becomes denser, the EV user can find a nearby station to charge and therefore reduce the travel distance.
Figure 4 presents the average travel distance per EV, depending on the number of stations. The distance ranges from 4.4 to 20.6 for 25 and 3 stations, respectively (these numbers increase radically for 1 or 2 stations, not shown in the diagram).
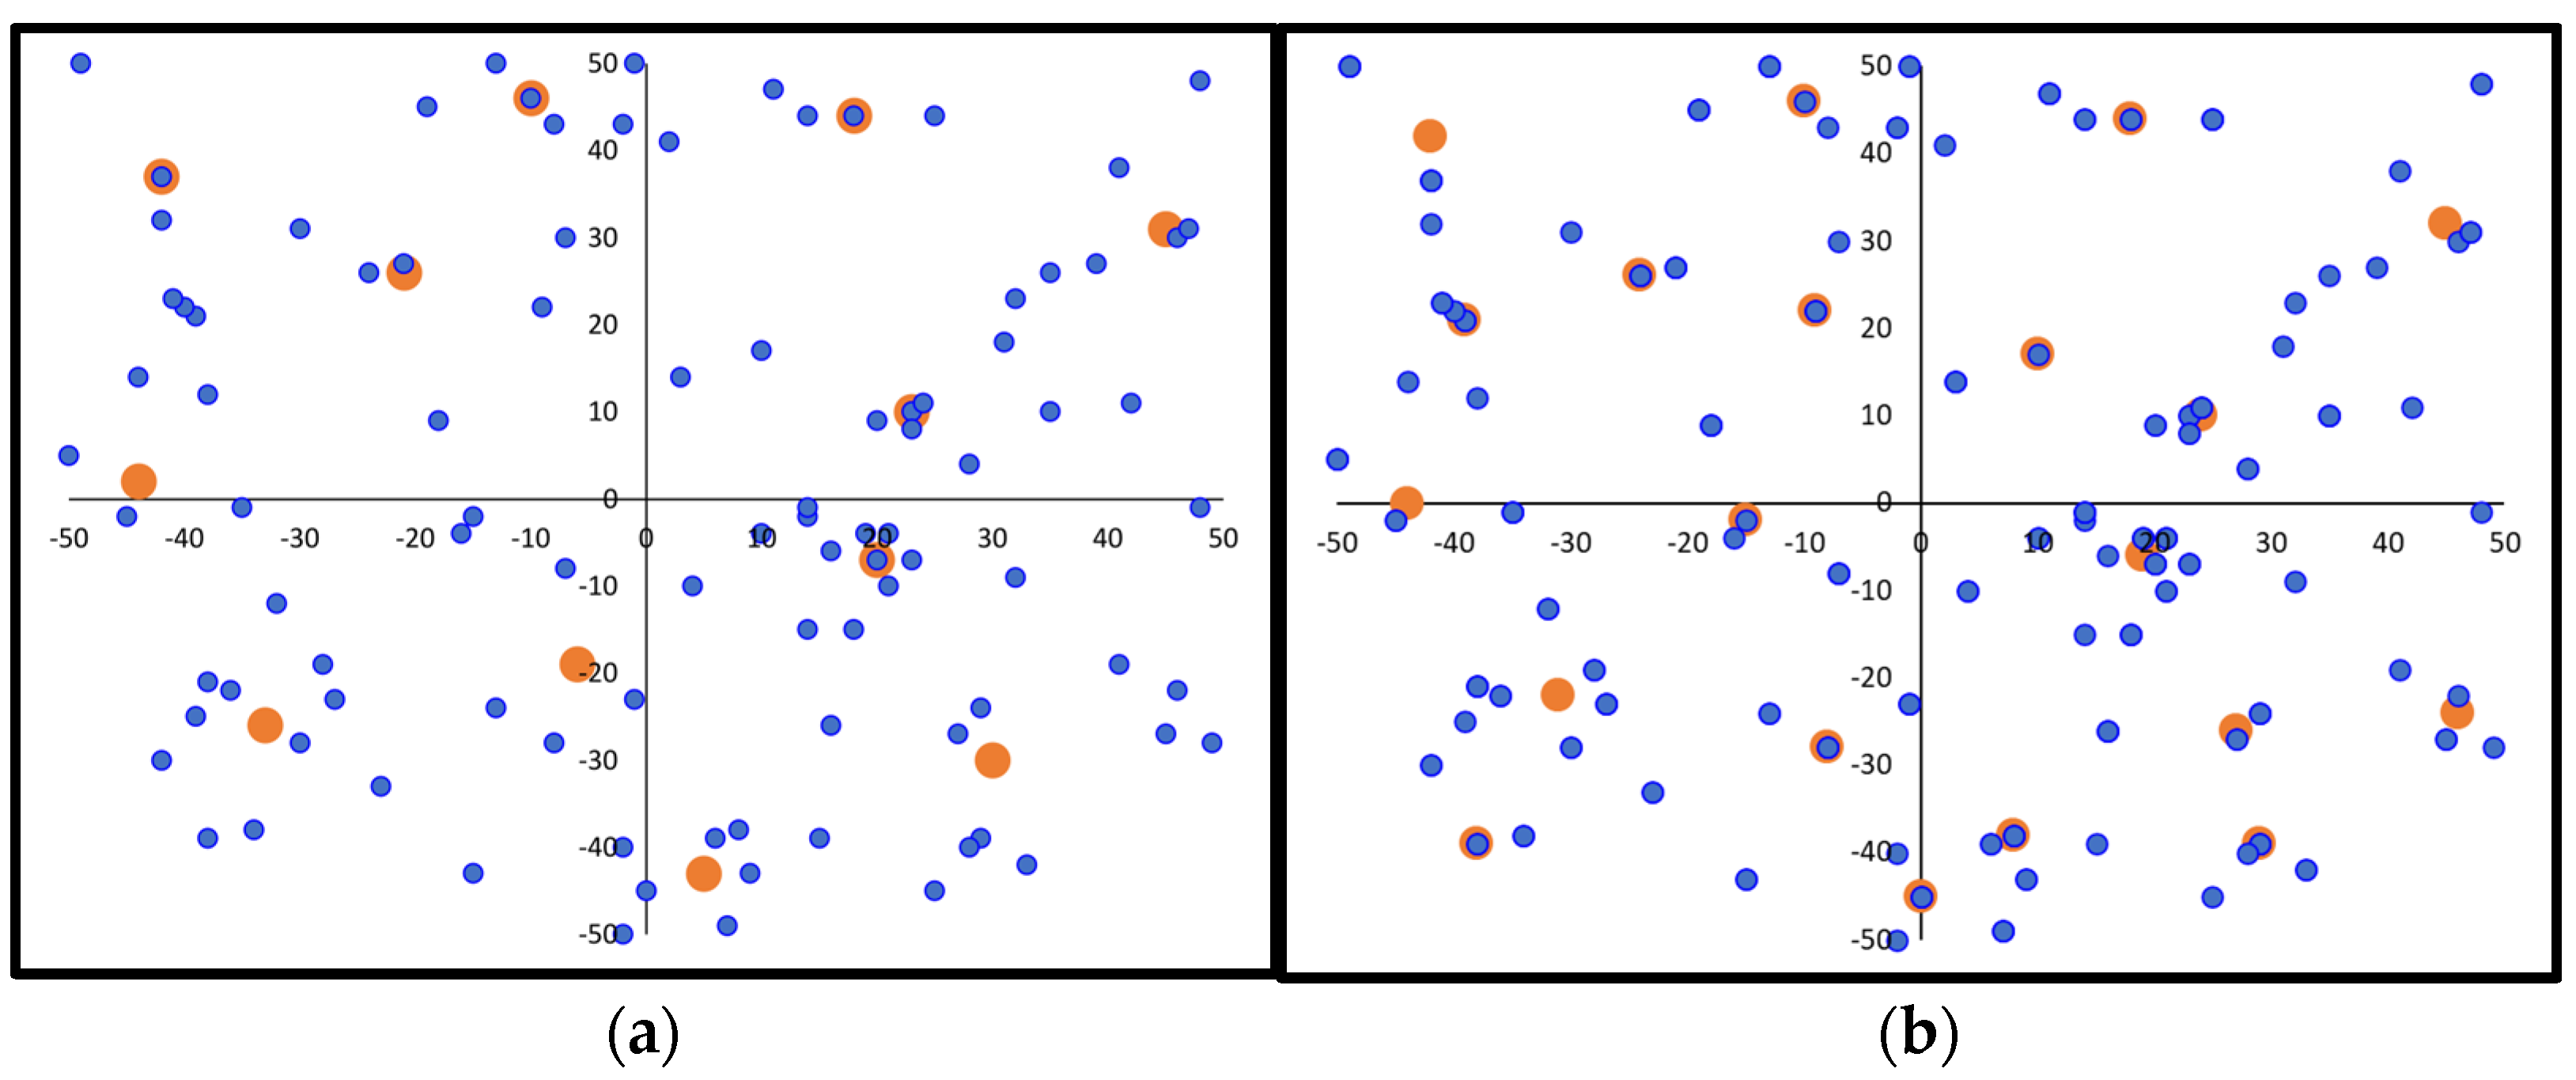
Figure 5 depicts 2 indicative networks deployed through Case Study 1 applications, which consist of 12 and 20 stations, respectively. To provide a rough indication of the required computational time, the algorithm requires on a typical laptop computer 90, 150, 350, and 1100 s for 10, 15, 20, and 25 station networks, respectively.
4.2. Case Study 2: Station Allocation for EV Travel Distance (Cost) Minimization at Different Station Capacity Levels
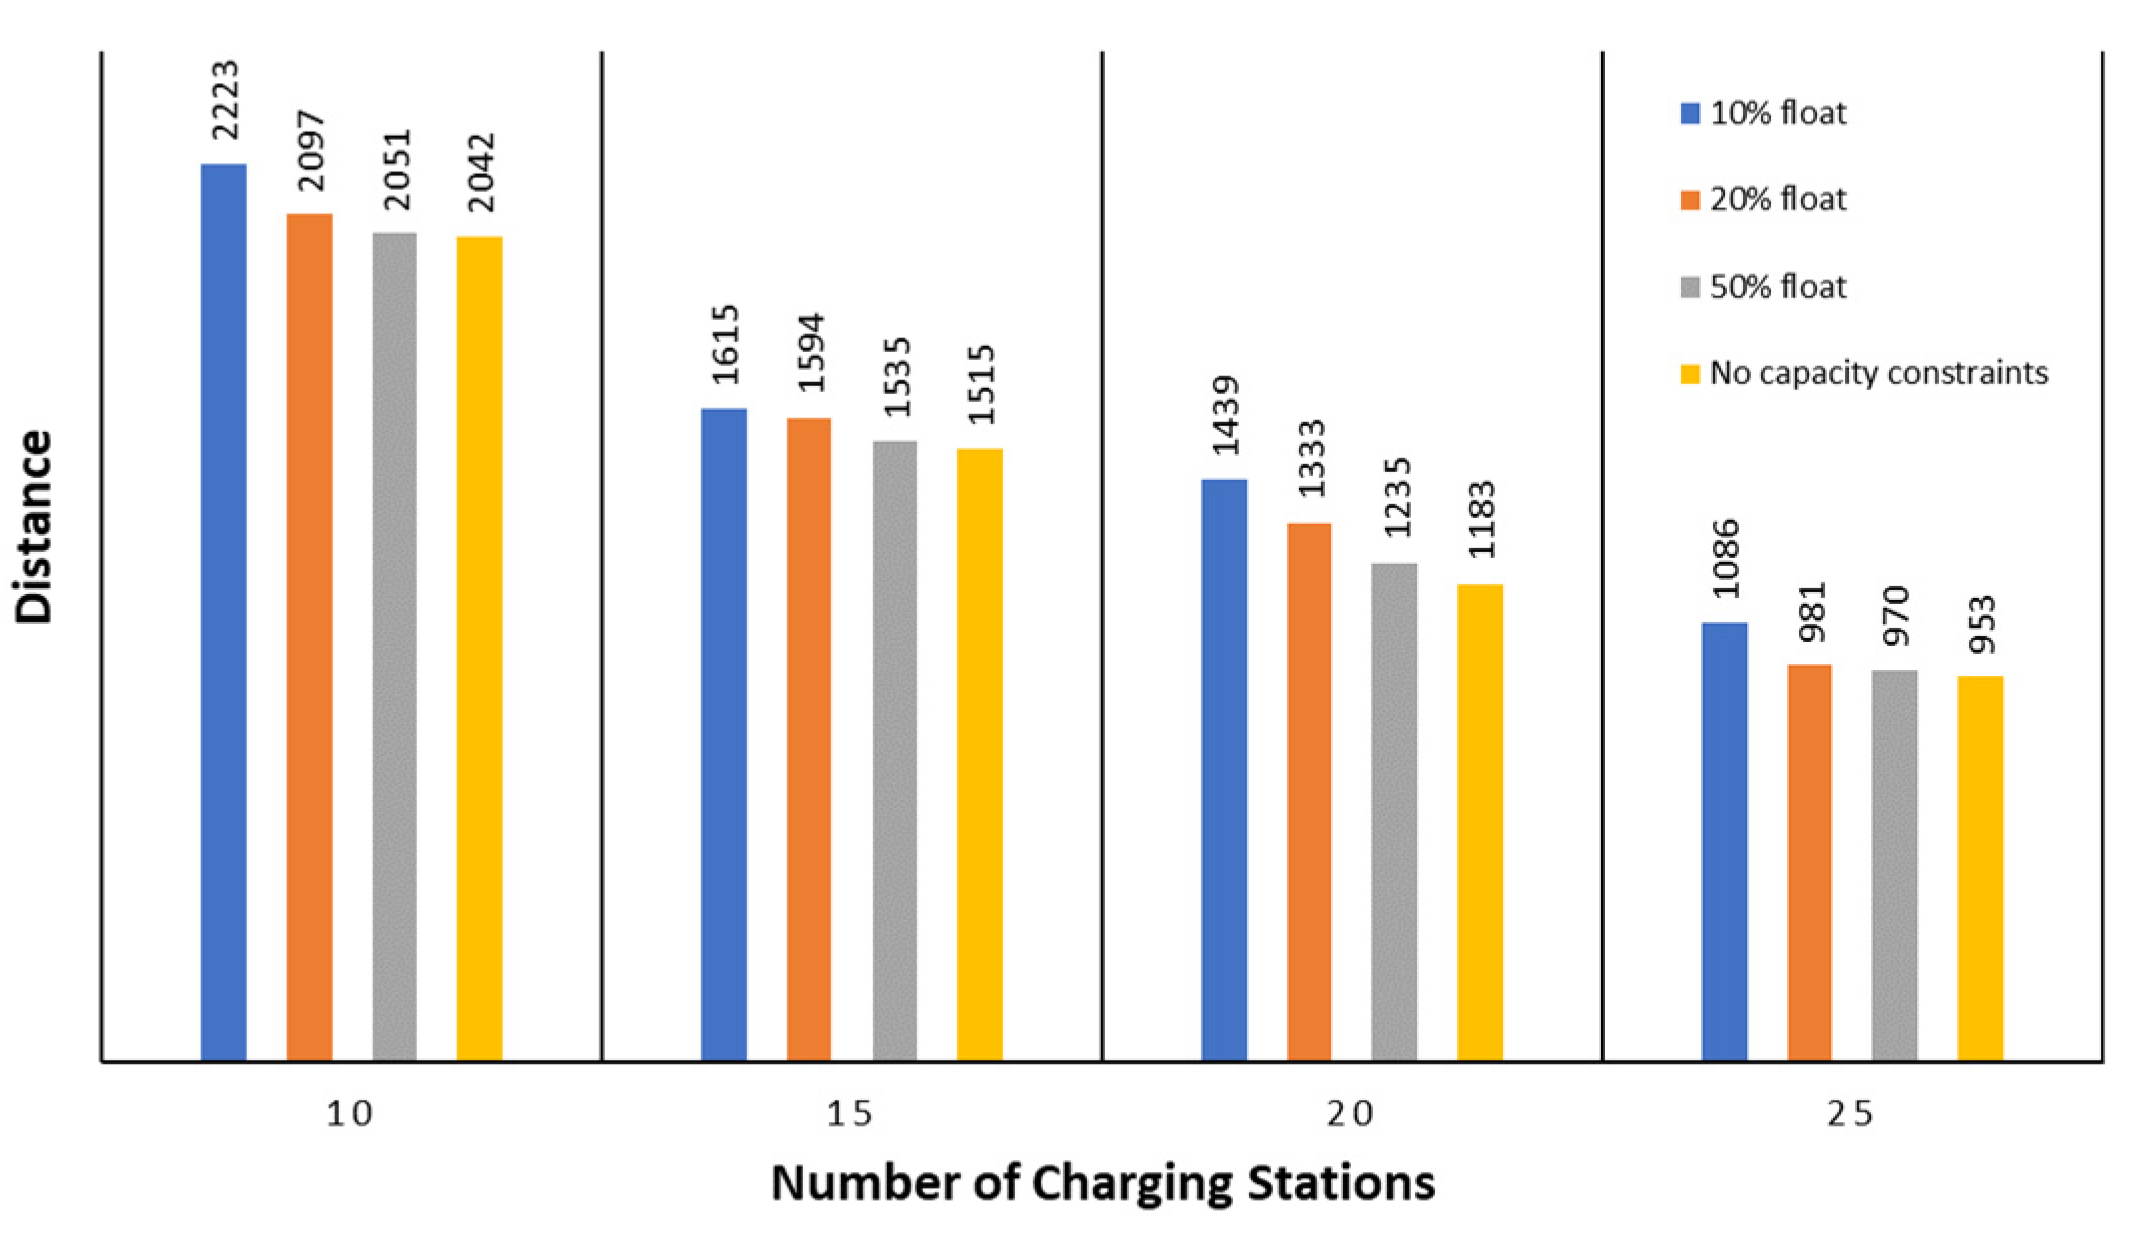
The proposed methodology focuses on charging station allocation based on the minimum travel distance of the participating EVs. In every case, the assignment of each EV is given to its closest station. In this way, however, there may be cases where some stations can be loaded with high charging demand while others may serve very few EVs. Both cases may present adverse financial consequences. For this reason, in the present case study, the algorithm is expanded with constraints about station capacity, i.e., the maximum number of EVs that can be served (a similar analysis can be done for the minimum number of EVs). The result of such a constraint is that some EVs may need to travel to another station but the closest one, if the capacity of the latter is exceeded. The objective of the optimization, in this case, is to assign the extra EV to the second-closest station, if the capacity level permits.
In this analysis, the average number of EVs per charging station is considered (depending on the number of stations). Next, a station capacity tolerance (float) above the average value is assumed as a percentage increase. The results of the investigation are portrayed in
Figure 6 for four indicative numbers of charging stations. As expected, the stricter the station capacity level, the longer the total (and average) distance traveled. The distance increases from the fully free EV allocation to a very restrictive station capacity of 10% above average, ranging between 7% and 21% without a specific pattern along the number of stations.
4.3. Case Study 3: Optimization of Station Number and Allocation Based on Station Deployment Cost and EV Travel Cost
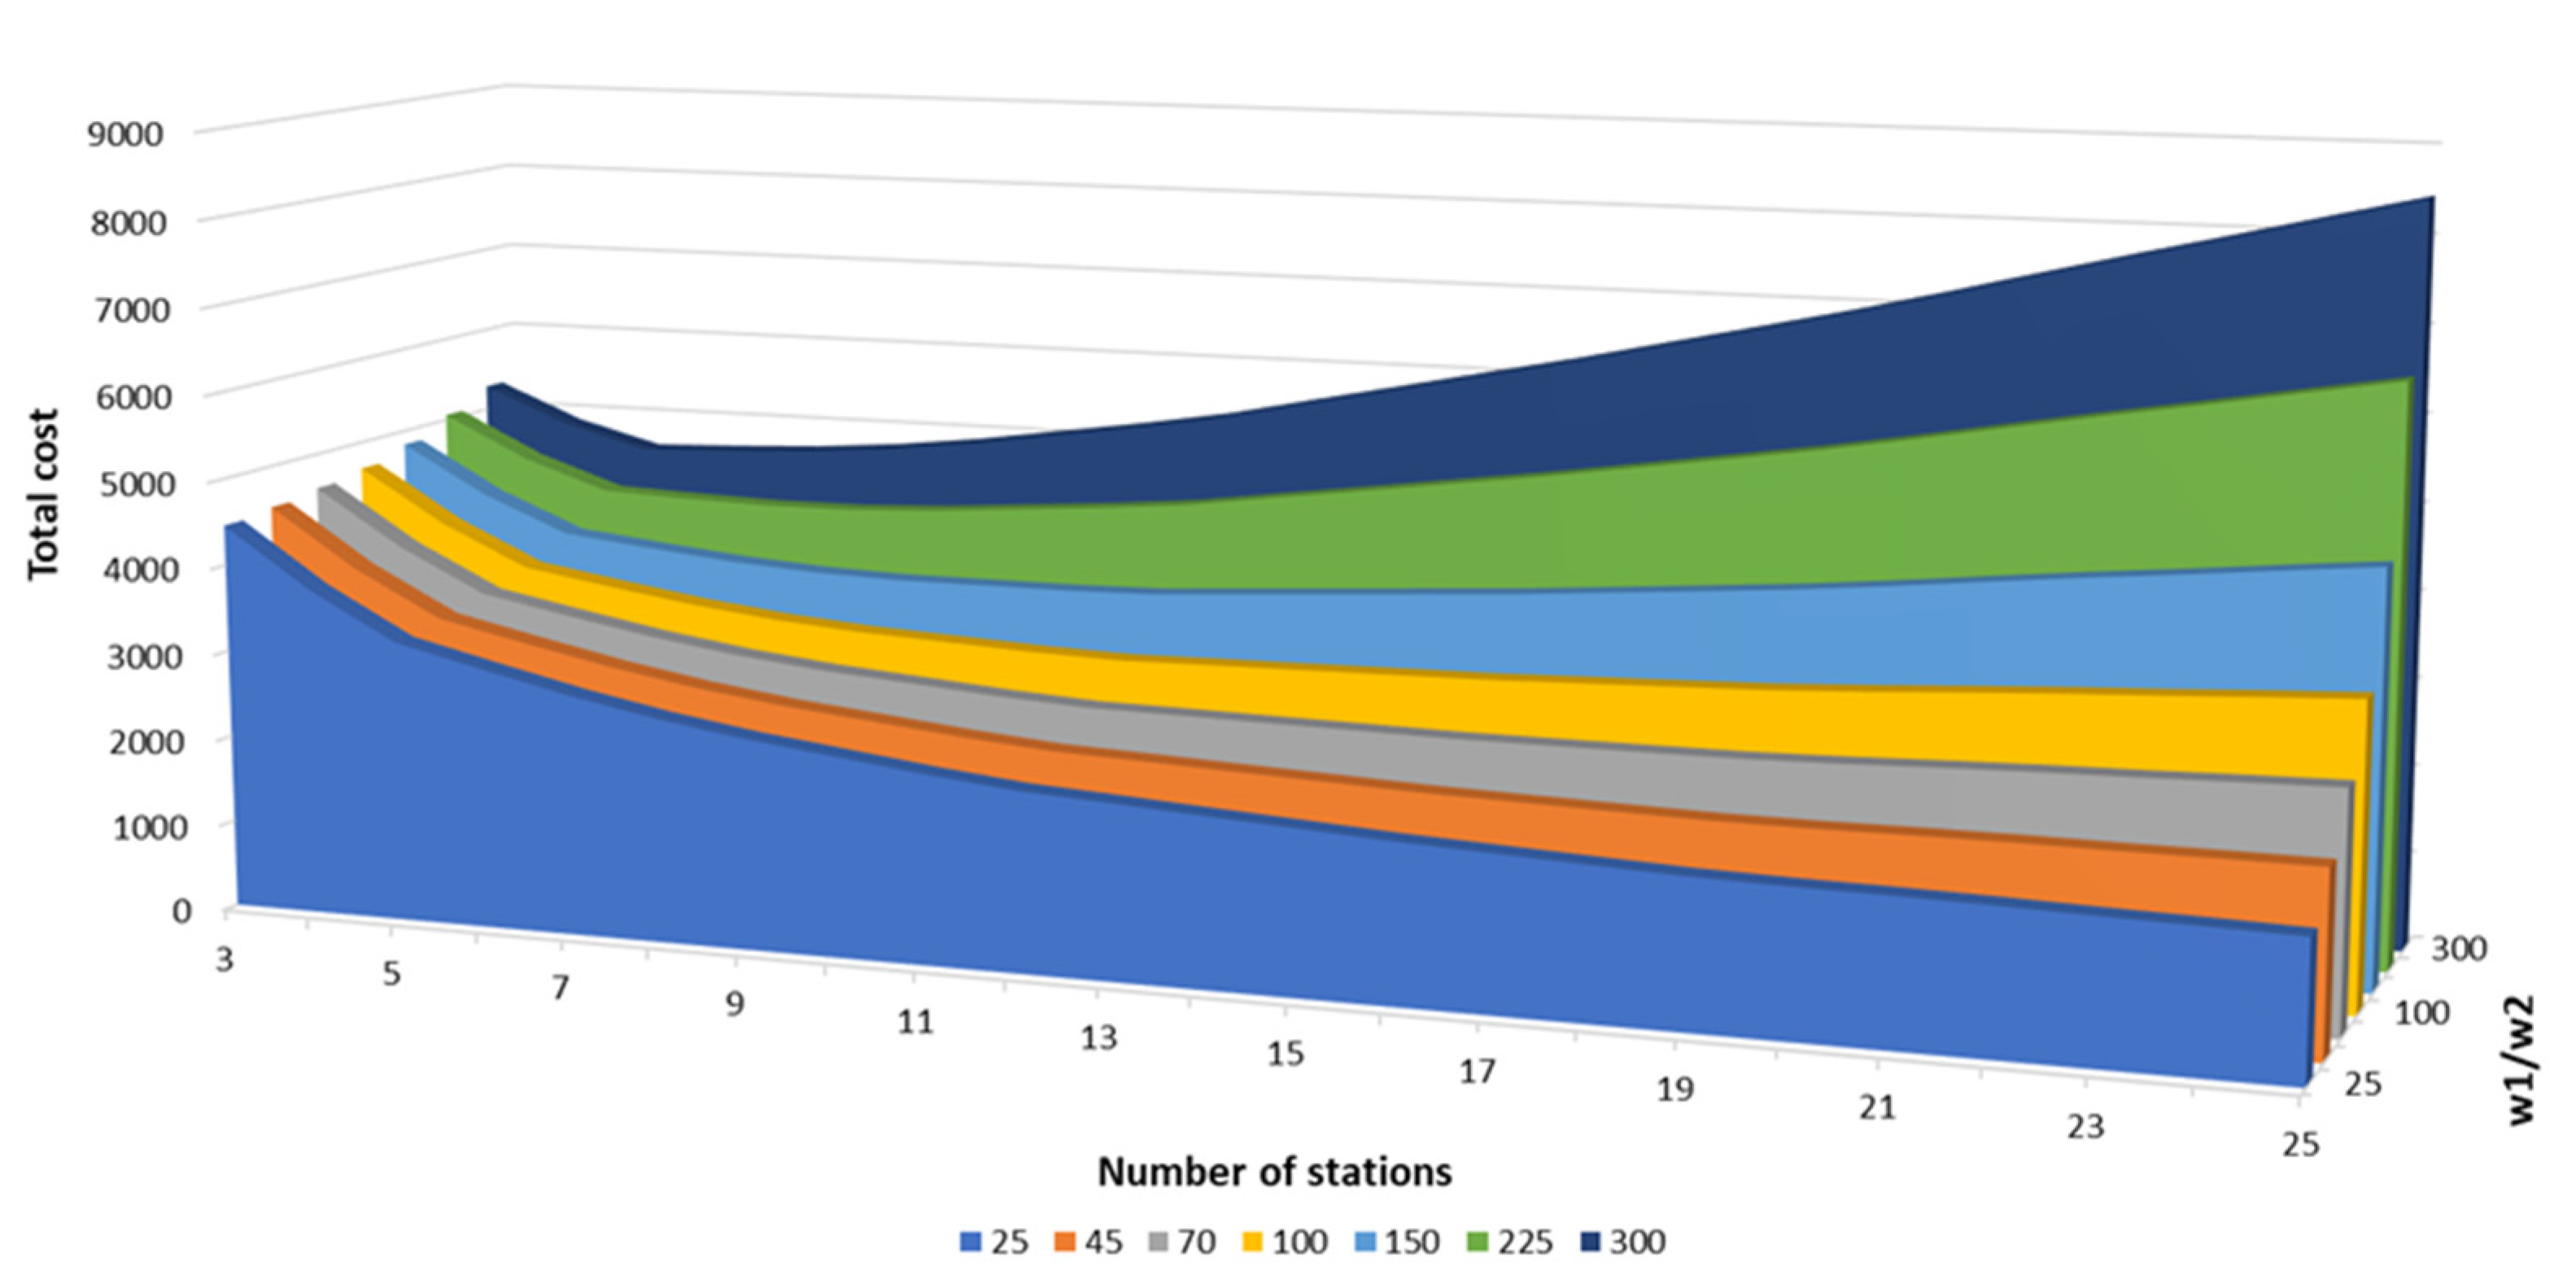
Unlike most previous studies that solely focused on charging station allocation, the present algorithm can simultaneously handle the multi-objective problem of obtaining the optimal number of stations along with their optimal placement. This problem follows the classical trade-off between the cost of the charging station development, which relates to the number of stations and their construction cost, and the cost of EV total travel distance, which decreases with the number of charging stations. This means that as the EVCS network becomes denser, the EV user can more easily find a nearby available station to charge at and, therefore, reduce the daily travel distance. However, the number of charging stations should be determined and kept at a certain level, based on the charging demand, the size of the area of interest/service coverage, as well as any budget availability constraints. A number of runs have been made for different values of the w1/w2 ratio of Equation (3) (i.e., the relative weights of the model objective function). For instance, with w1/w2 = 100, the optimal number of stations is 12 (based on repetitive runs). The full picture of this investigation is depicted in
Figure 7. At a low value of w1/w2 = 25, the optimal number of stations is 25, while at w1/w2 = 300, a network of 5 stations provides the best solution. The wi’s are the input values representing each specific charging station deployment area and provide the appropriate number of stations that better serves the tradeoff between deployment cost and EV travel cost. In terms of computational effort, the multi-objective configuration requires more time (as it solves a more complex problem), which, compared to the single-objective travel distance problem, presents an increased time by an order of 1.3 to 1.5 times in average values.
4.4. Case Study 4: Station Allocation for EV Travel Distance (Cost) Minimization for Different Station Deployment Cost Zones
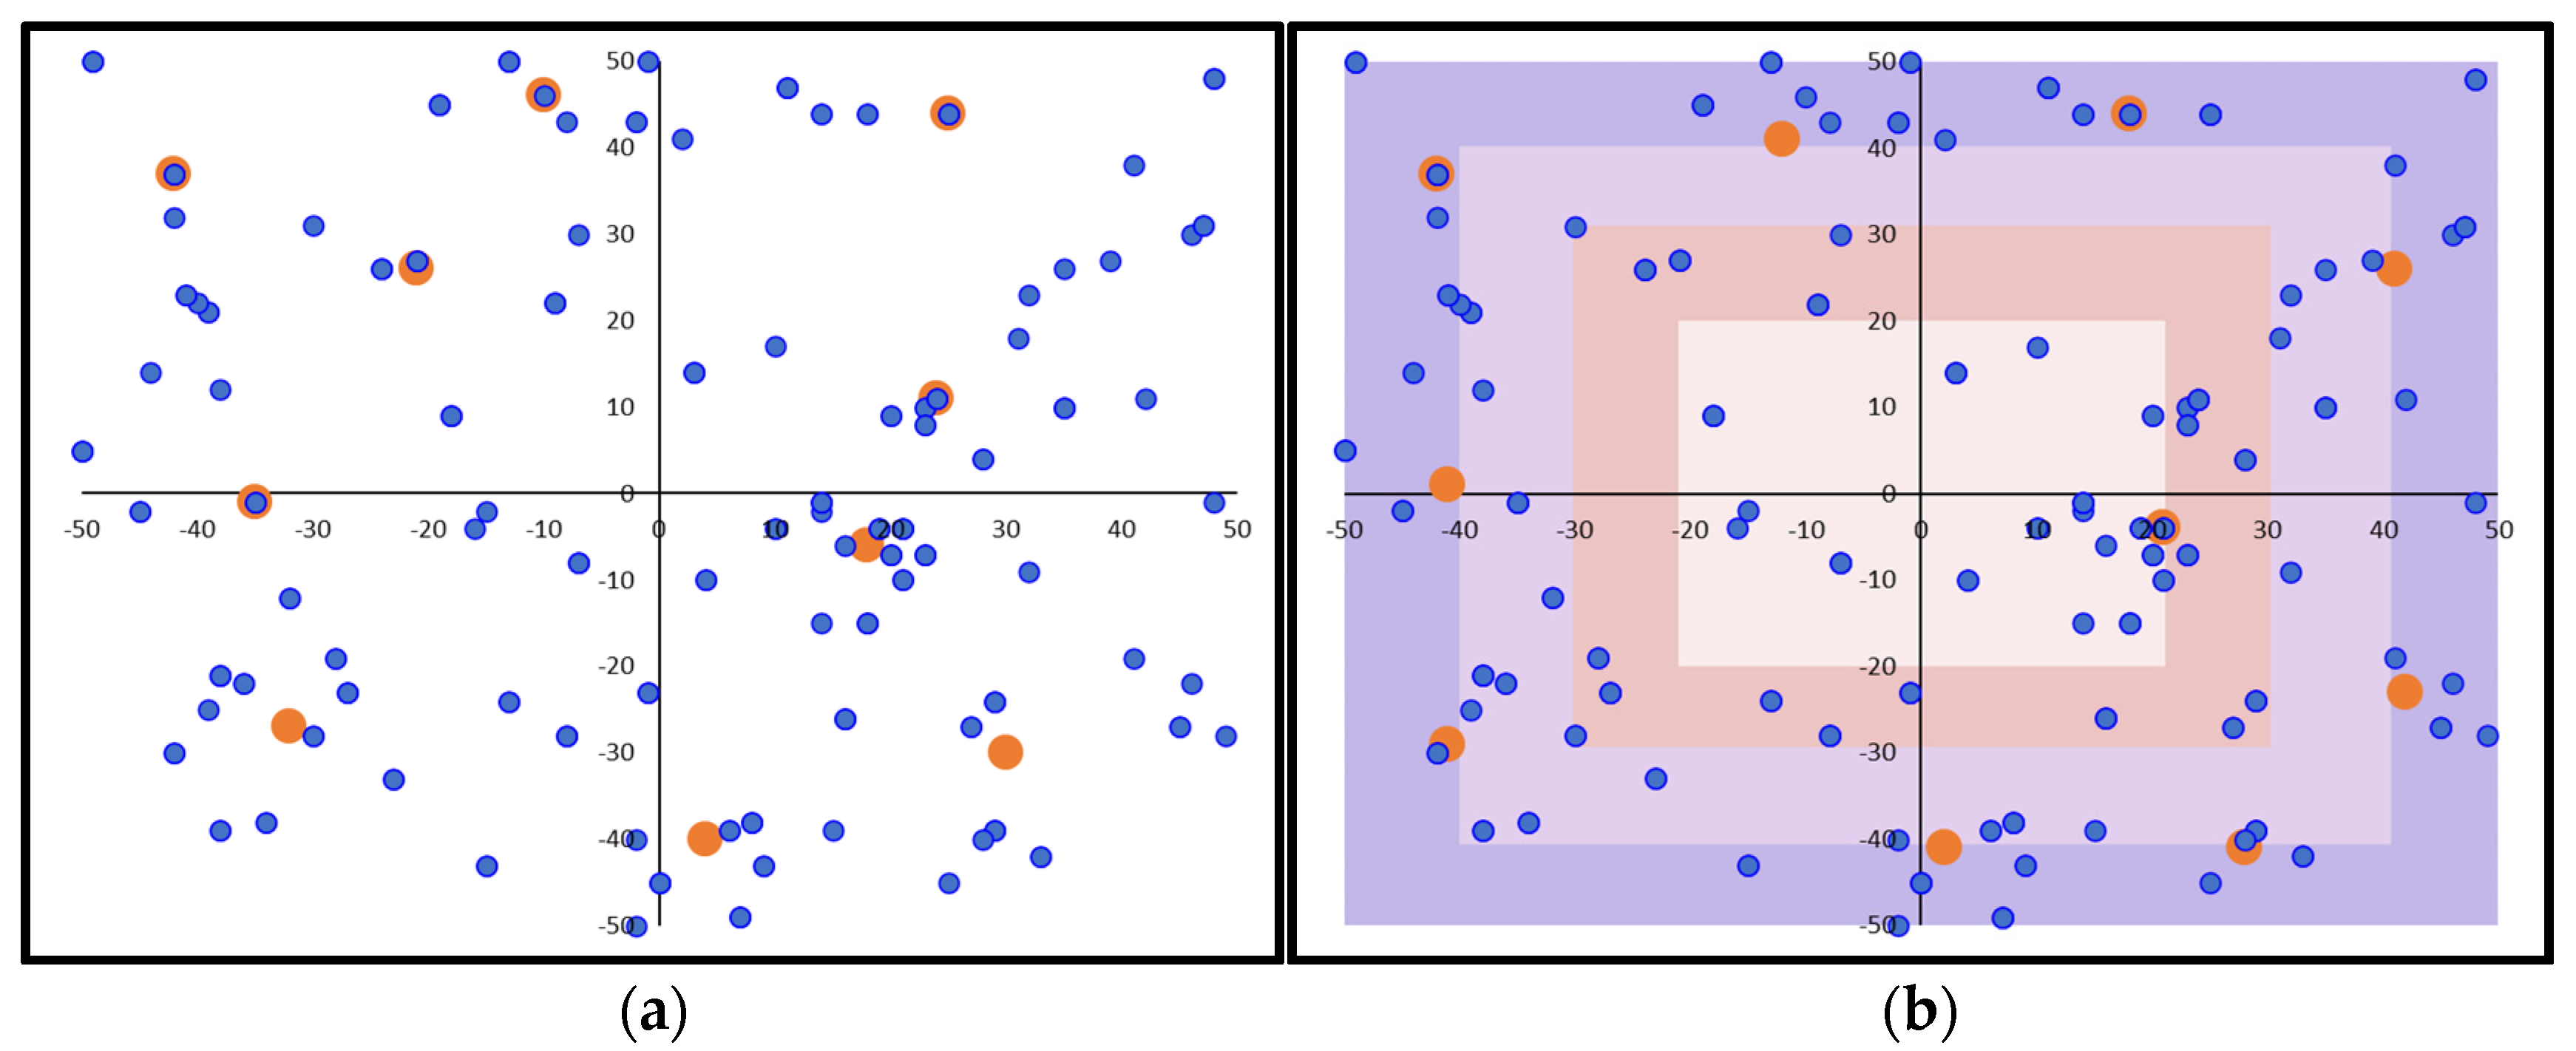
The previous analyses assume the same cost for deploying all charging stations within a scenario. However, it is known that different land uses and human activity concentrations create different cost zones within a city. To account for such cost variances, the present analysis considers four different cost zones in the form of inner to outer rectangles, with the cost being the highest in the inner zone and decreasing outward. Another parameter that plays a role in the charging station allocation is the cost rate among zones. As part of this study, different zone cost sets have been analyzed, with the expected result of station construction toward the cheaper zones, especially if the cost proportions are high. A representative allocation solution for this case is presented in
Figure 8.
4.5. Case Study 5: Station Allocation for EV Travel Distance (Cost) Minimization for Highly Unequal Demand Dispersion
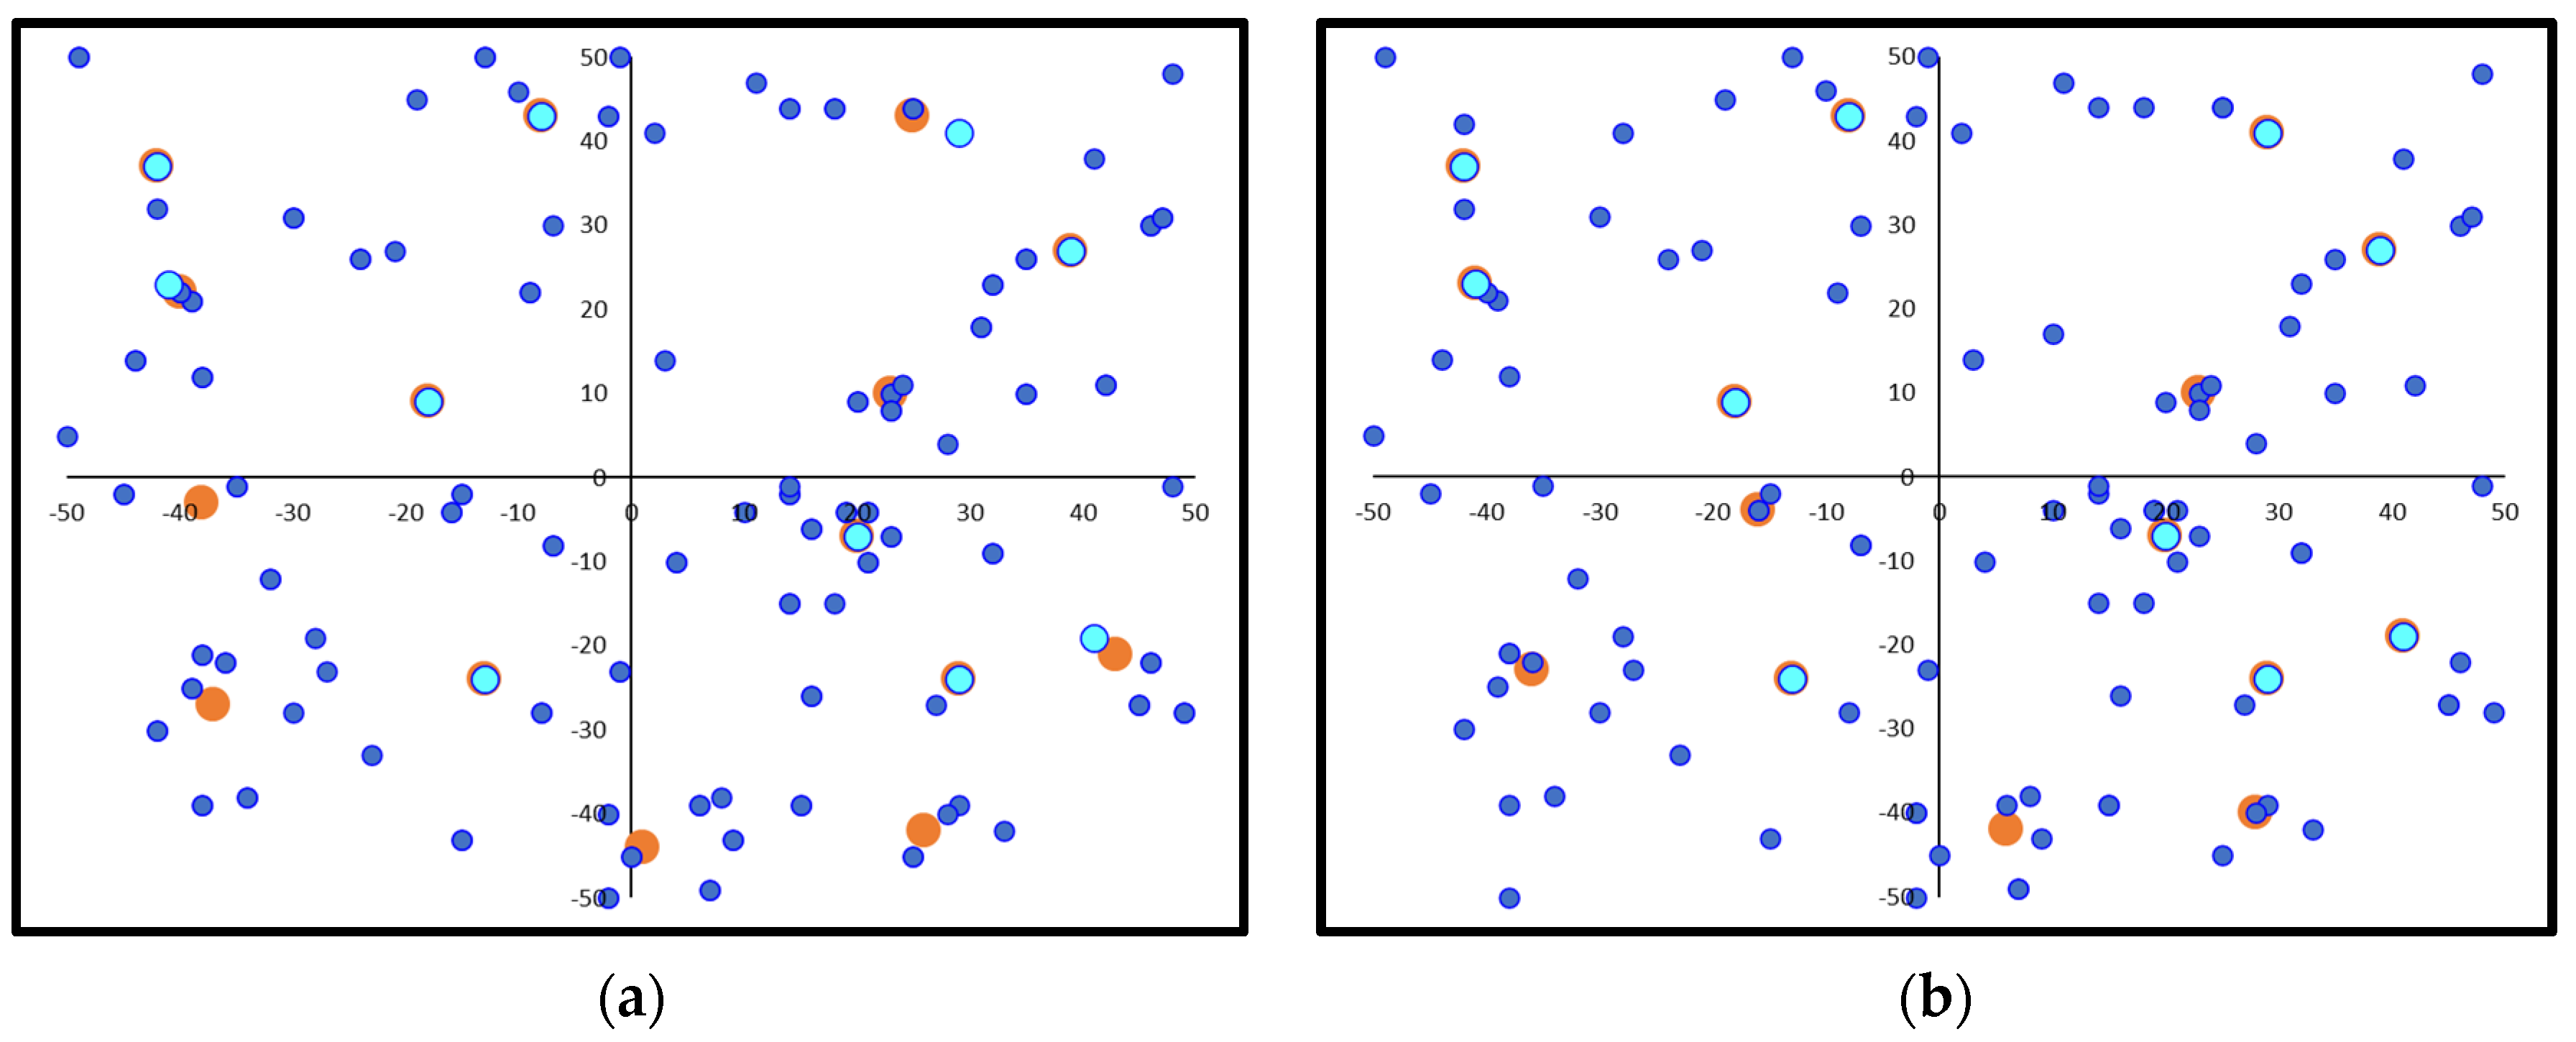
The demand distribution is quite unequal in certain cases. For example, places of high interest (e.g., downtown premises, shopping malls, sport arenas, etc.) may attract a high charging demand. This may be modeled by a disproportionally increased demand at specific sites. To deal with this case, an example is formulated based on the original input data but considering 10 random locations having 5 or 10 times higher demand than all other spots. Here, 15 charging stations are considered for serving the EV demand. The station allocation results are indicated in
Figure 9. The dark blue dots indicate low-demand spots, the light blue ones are high-demand spots, and the orange circles indicate station places. It can be seen that 10 out of 15 stations are placed exactly on or close to high-demand spots, while the other 5 stations are optimally placed to cover the sparse demand.
4.6. Case Study 6: Station Allocation for EV Travel Distance (Cost) Minimization for Irregular Service Area Shape
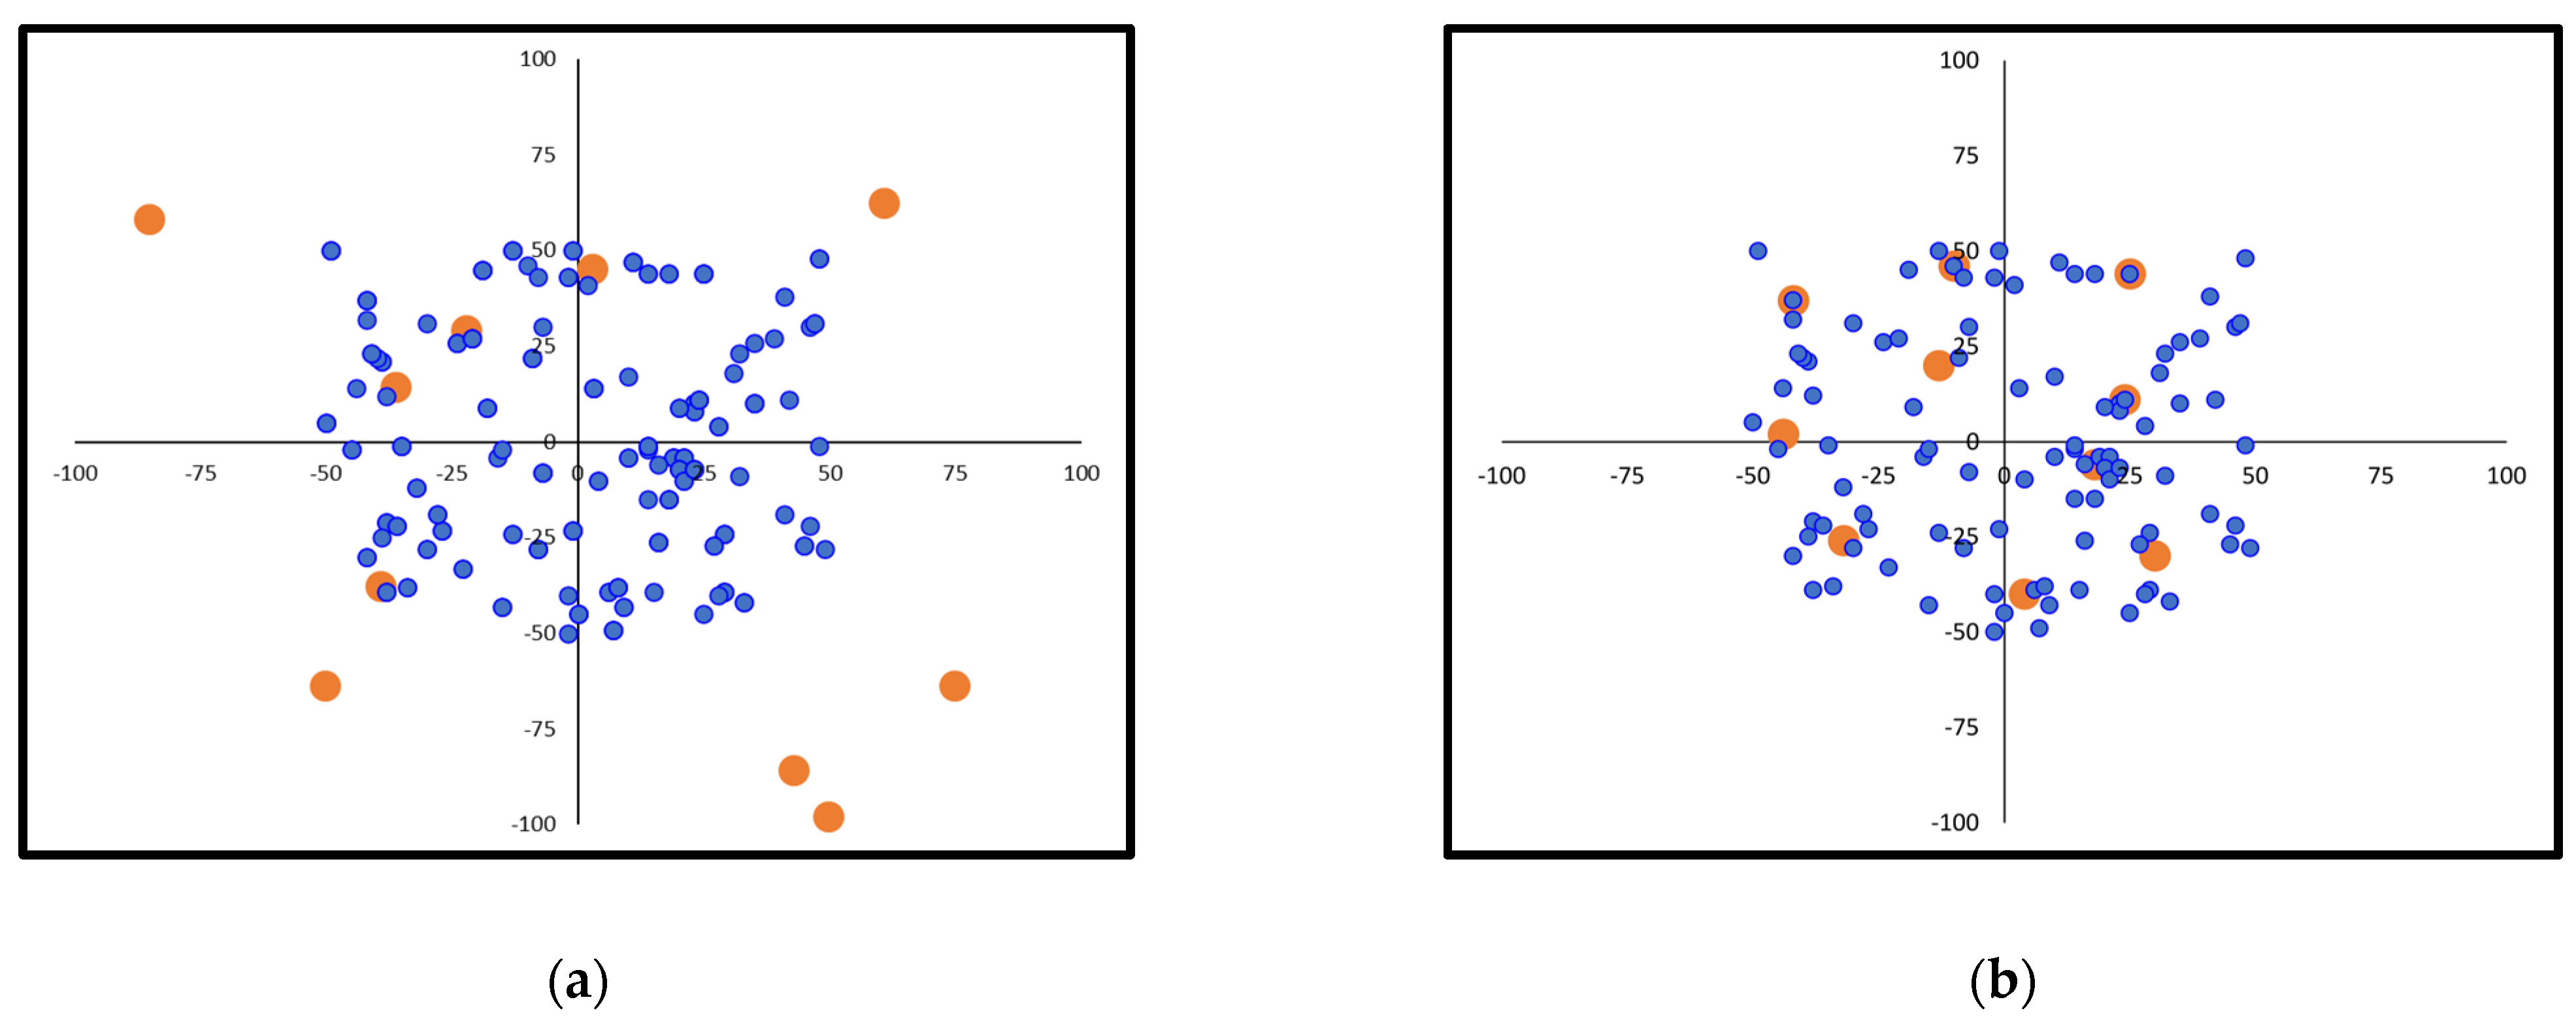
An interesting research question with practical importance is the adjustment of the solutions to the uneven shape of a typical city or neighborhood area. There are two ways to deal with this issue, either consider the city shape as it is or develop a square (or rectangle) that surrounds the city shape. In the first case, the solution space is reduced to the city shape; however, a large number of constraints should be added to model the city limits. In the latter case, the solution space increases, but the simplicity of the algorithm in terms of constraints is retained. As part of this analysis, the solution space of the basic scenario was extended, considering solution space dimensions ranging from −100 to 100 in both directions (4 times larger than the original area) and −200 to 200 in both directions (16 times larger than the original). The demand points and size remained as originally (within the −50 to 50 range) while different initial station allocations were considered, from all stations being at point (0, 0) to randomly assigned within the large box.
Figure 10 provides an indicative solution for the case of an area ranging from −100 to 100, in which 10 charging stations are to be deployed, while
Table 2 summarizes some results of the process regarding the fitness value of the total distance traveled. Not surprisingly, the algorithm, after some exploration of the whole space, has always converged to a solution very similar to the initial one and, interestingly, within the same computation time. This can highlight the GA converging capability regardless of the space size and the initial station placement.
4.7. Case Study 7: Station Allocation for EV Travel Distance (Cost) Minimization for Large Service Area Size and Number of Stations
Regarding the size of the area for which the analysis is performed, the following aspects need to be considered: depending on the city (or neighborhood) size, the number of stations can vary from a few to many. In fact, this decision has also to do with the demand level, in the sense that if the demand is low and dispersed, it is not cost-effective to build a large number of stations. Instead, the users should travel a longer distance to reach a station. Within the present analysis, a relatively small number of stations have been considered (up to 25). This is very realistic for neighborhoods and small-to-medium-size cities, e.g., 10 by 10 km (thus every distance unit in the above analysis corresponds to 100 m). To evaluate the scalability performance of the algorithm, larger station numbers have been further considered (within the same plan structure and demand size and distribution). In particular, 50, 100, and 200 stations were examined. The total traveling distances for 50, 100, and 200 stations are 411, 197, and 105, respectively. Nevertheless, since the number of demand generated spots is 100, there is no need to go over that number in terms of stations built. The indicative results of this analysis are shown in
Figure 11.
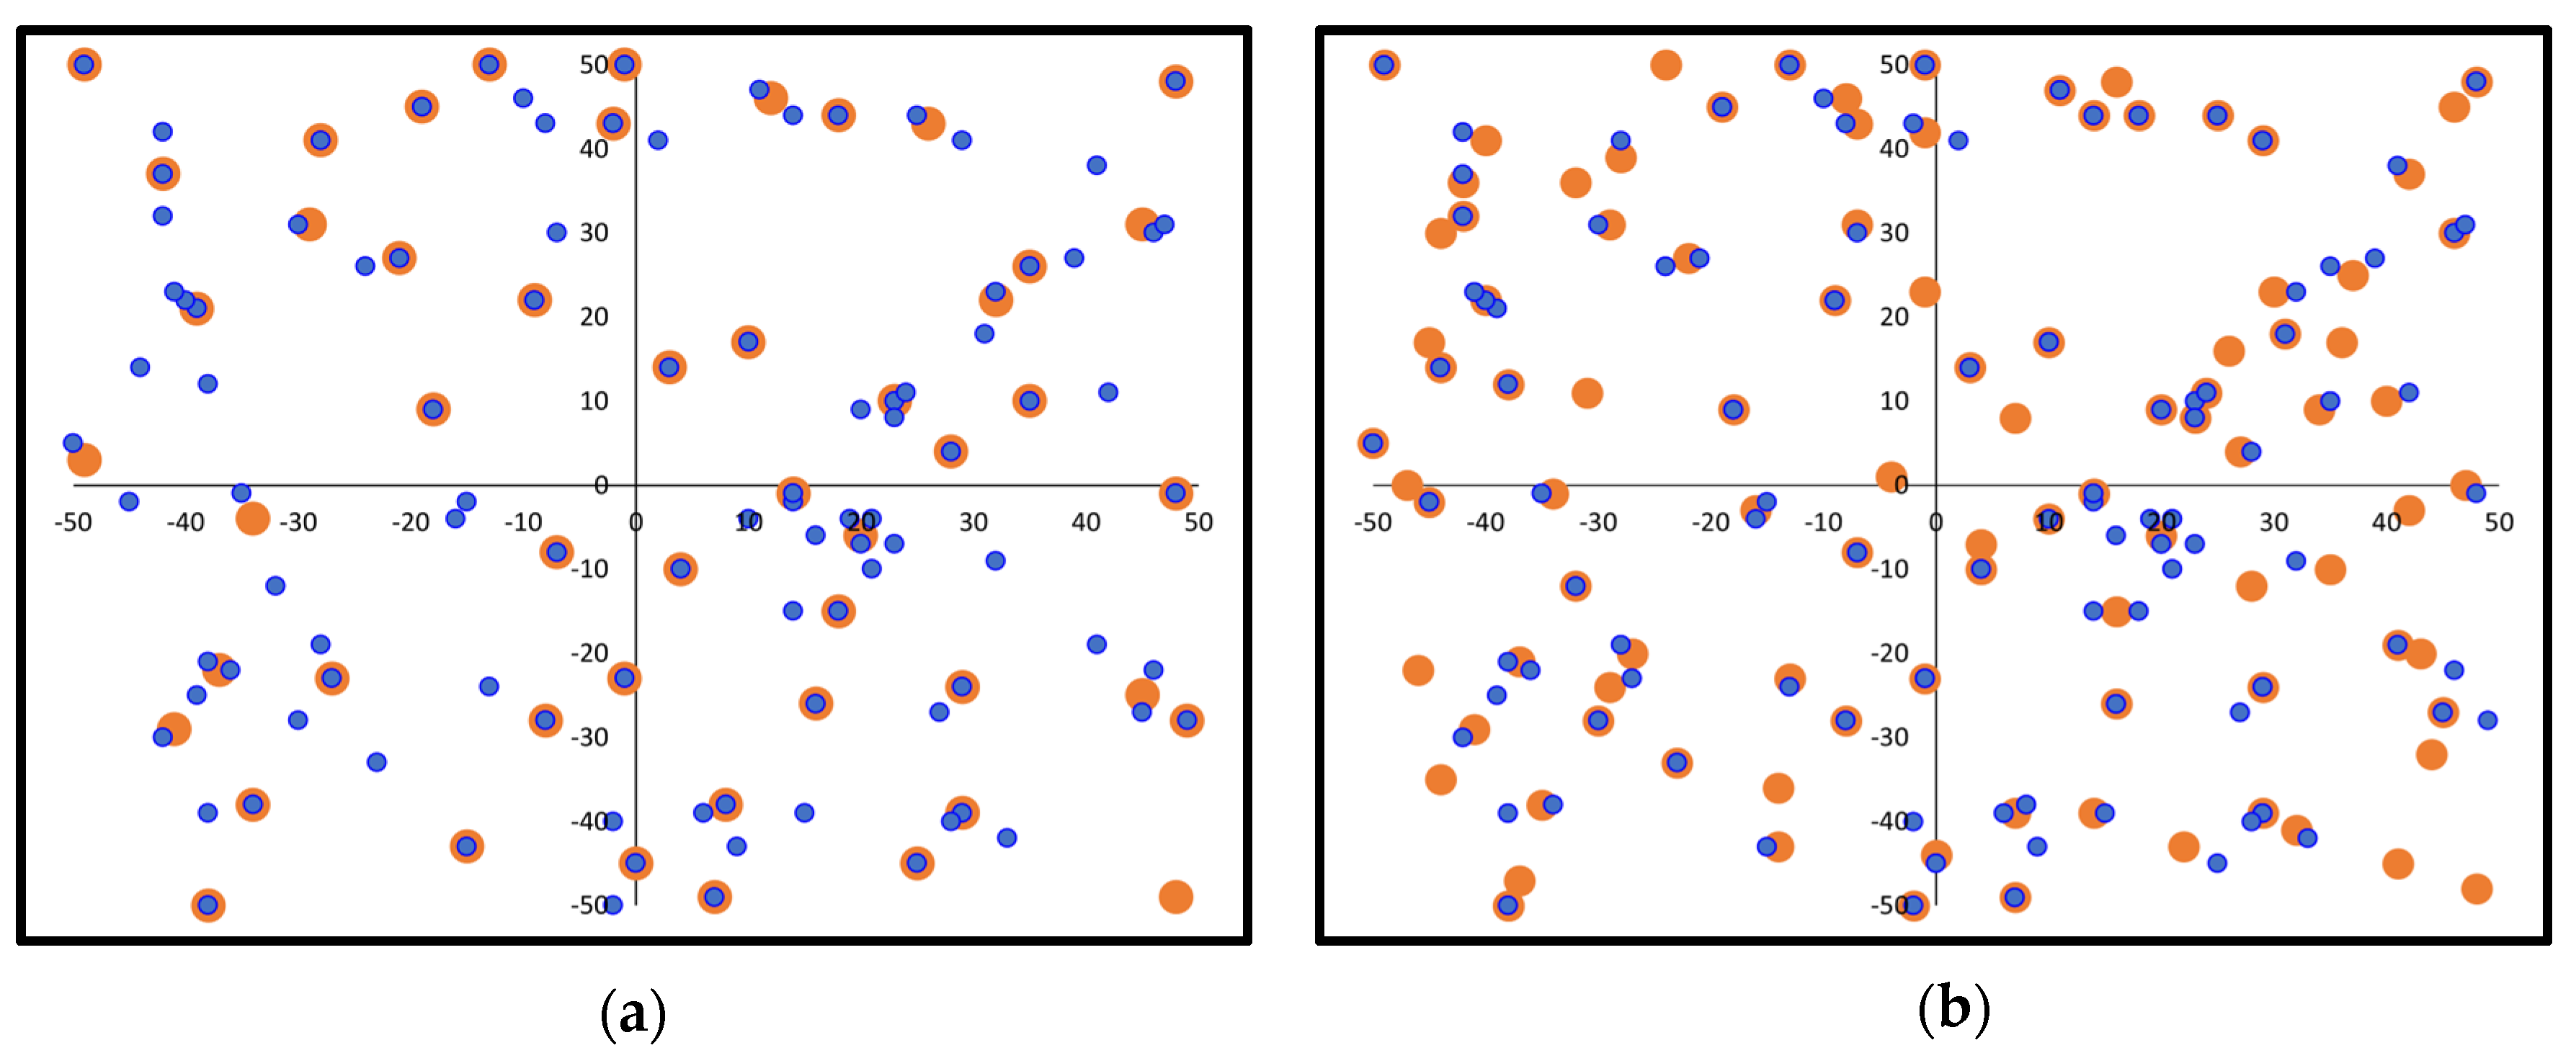
A similar analysis assumes that there are 50 (100) demand spots of 4 (2) EVs each. The same number of stations is considered, with the expectation being that one station is placed exactly at each demand spot. Although no full convergence on this goal is obtained, the solution indicates that most stations coincide with demand spots, while a few others attract EVs from more than one demand point, making the use of some other stations unnecessary. In
Figure 12, the station allocations for the cases of 50 or 100 uniform demand points (with a total demand of 200 EVs) are presented to indicate the outcome. In the case of 50 stations, 4 of them are redundant (they do not attract any demand) and can be omitted. In the case of 100 stations, 23 of them are redundant.
4.8. Case Study 8: Station Allocation for EV Travel Distance (Cost) Minimization at Grid Discretization Levels
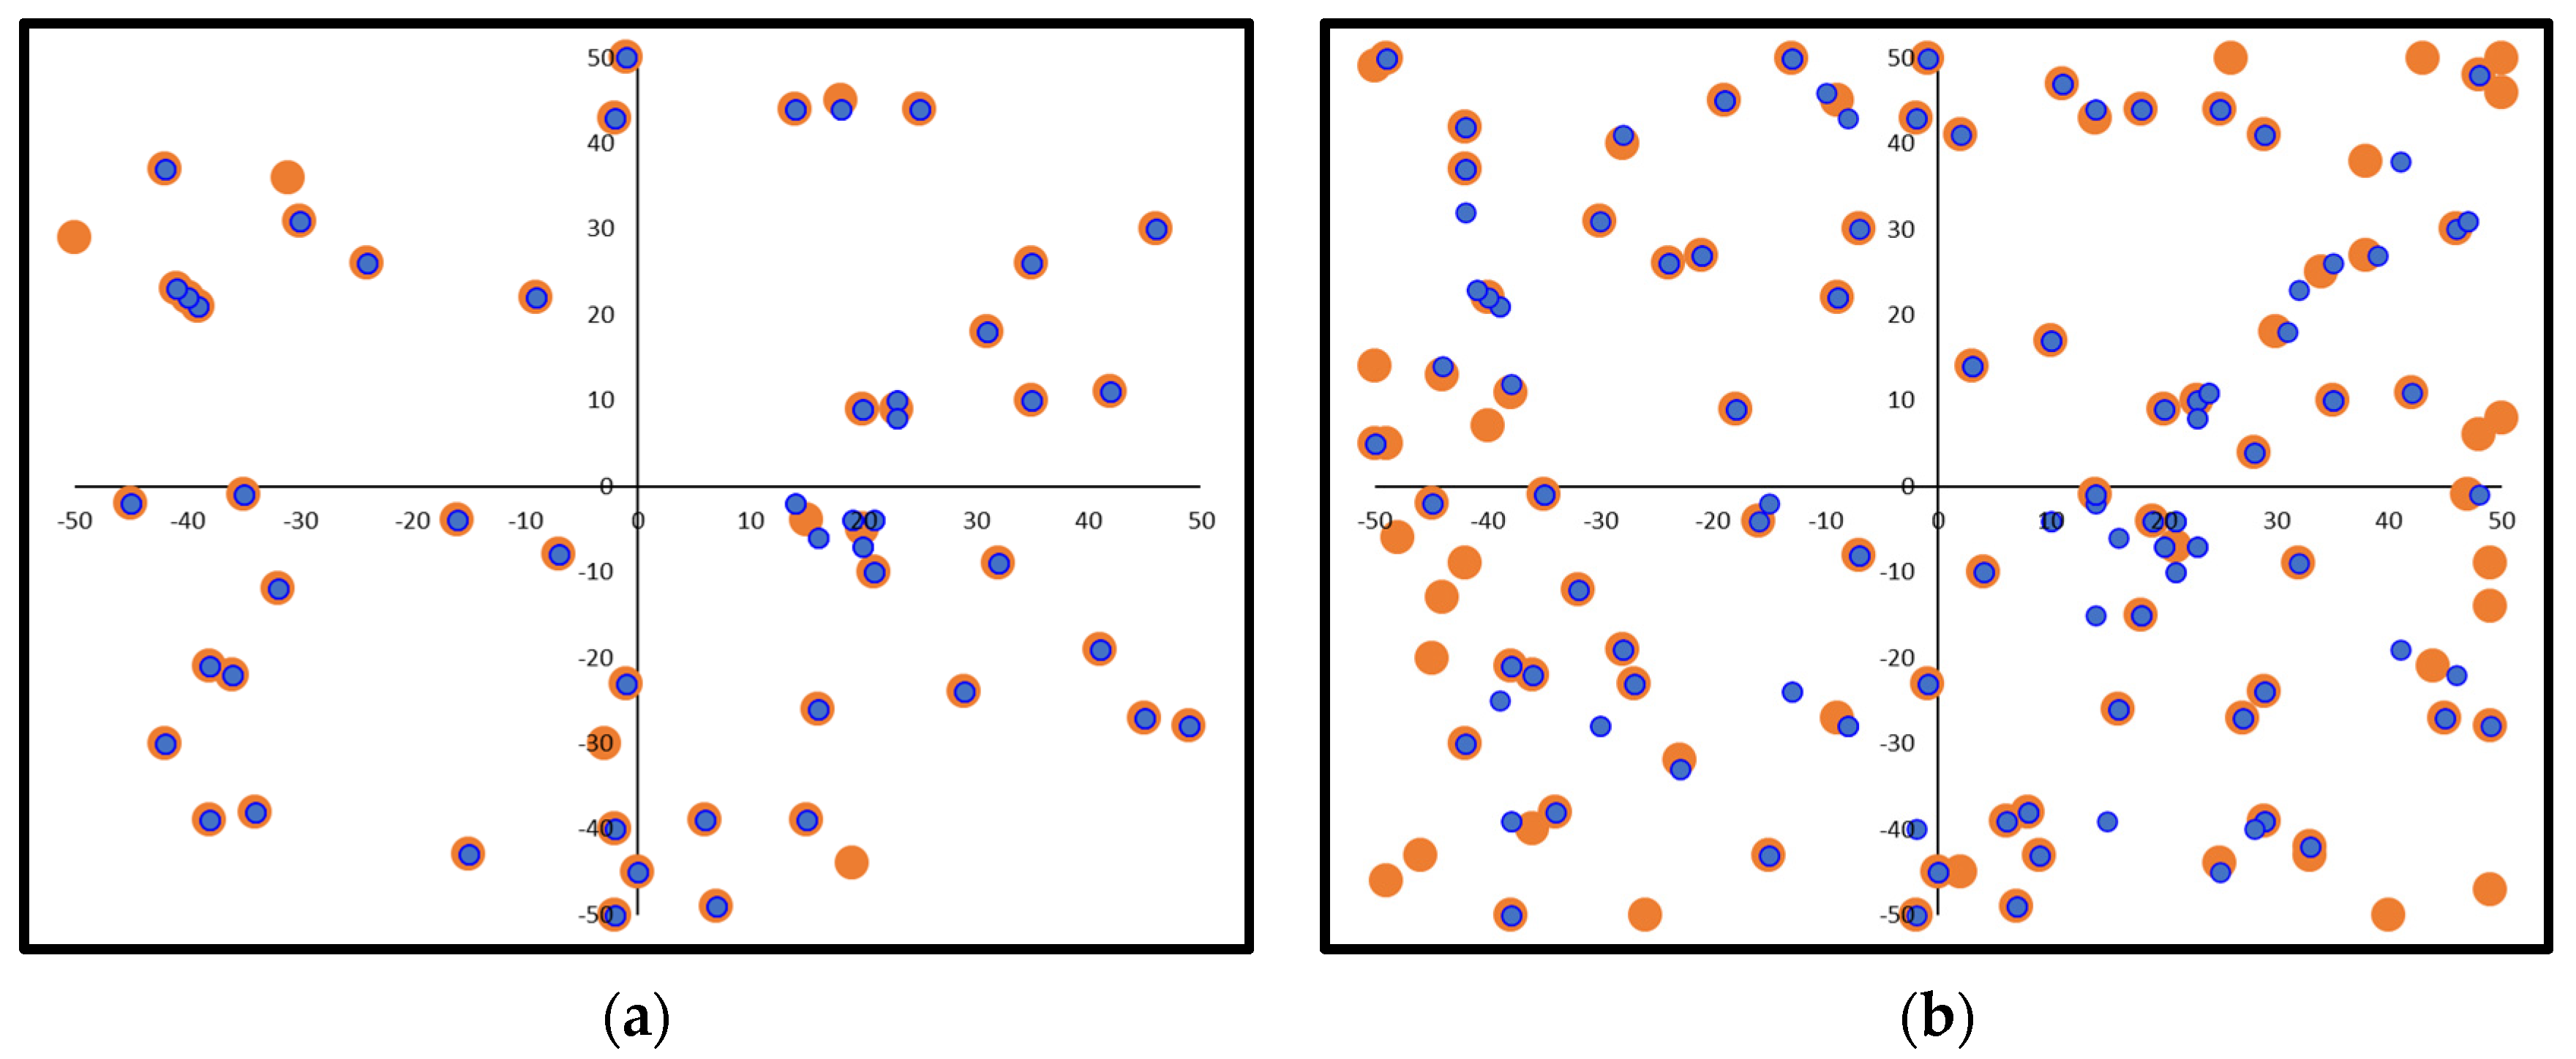
The issue of grid discretization is important for the following reasons. The area size under analysis may vary considerably along city sizes and the achievement of a certain level of detail is a desirable aspect. On the other hand, fine discretization may lead to difficulties in achieving an optimal solution in terms of both, the fitness value and the computational time. In this regard, a number of grid discretization alternatives have been examined as part of this investigation. All the solutions presented above have been obtained by considering station coordinates with integer values. In the present analysis, different discretization levels are considered in the basic scenario. As the discretization level becomes coarser, the problem progressively moves from a facility-to-site to a facility-to-location formulation. For instance, if the grid unit is 10, there are 11 by 11 possible locations for allocating the charging stations in the −50 to 50 range of the rectangle area, and the objective is to select which of these points will host a station. Such rough discretization may be preferable if the application space is widespread, e.g., in large cities. As the number of possible locations decreases, the number of alternative solutions also decreases, as does the optimization quality in terms of the fitness value. On the other hand, a possible benefit of such rough discretization may be any reduction in computation time. Not surprisingly, the computational time is not improved because the required computations are virtually the same, as the only change is the set of values that the decision parameters (station coordinates) can choose from. In fact, even with a fine decimal level of discretization, the computation burden is not increased, and the resulting fitness value is comparable to that of the integer discretization.
Figure 13 illustrates the results for 10 stations and discretization levels of 1 and 10 units. The total traveling distance for discretization levels of 1, 2, 5, and 10 units is 2042, 2045, 2078, and 2193, respectively. The lowest of the above values is also achieved with any decimal discretization of the application area.
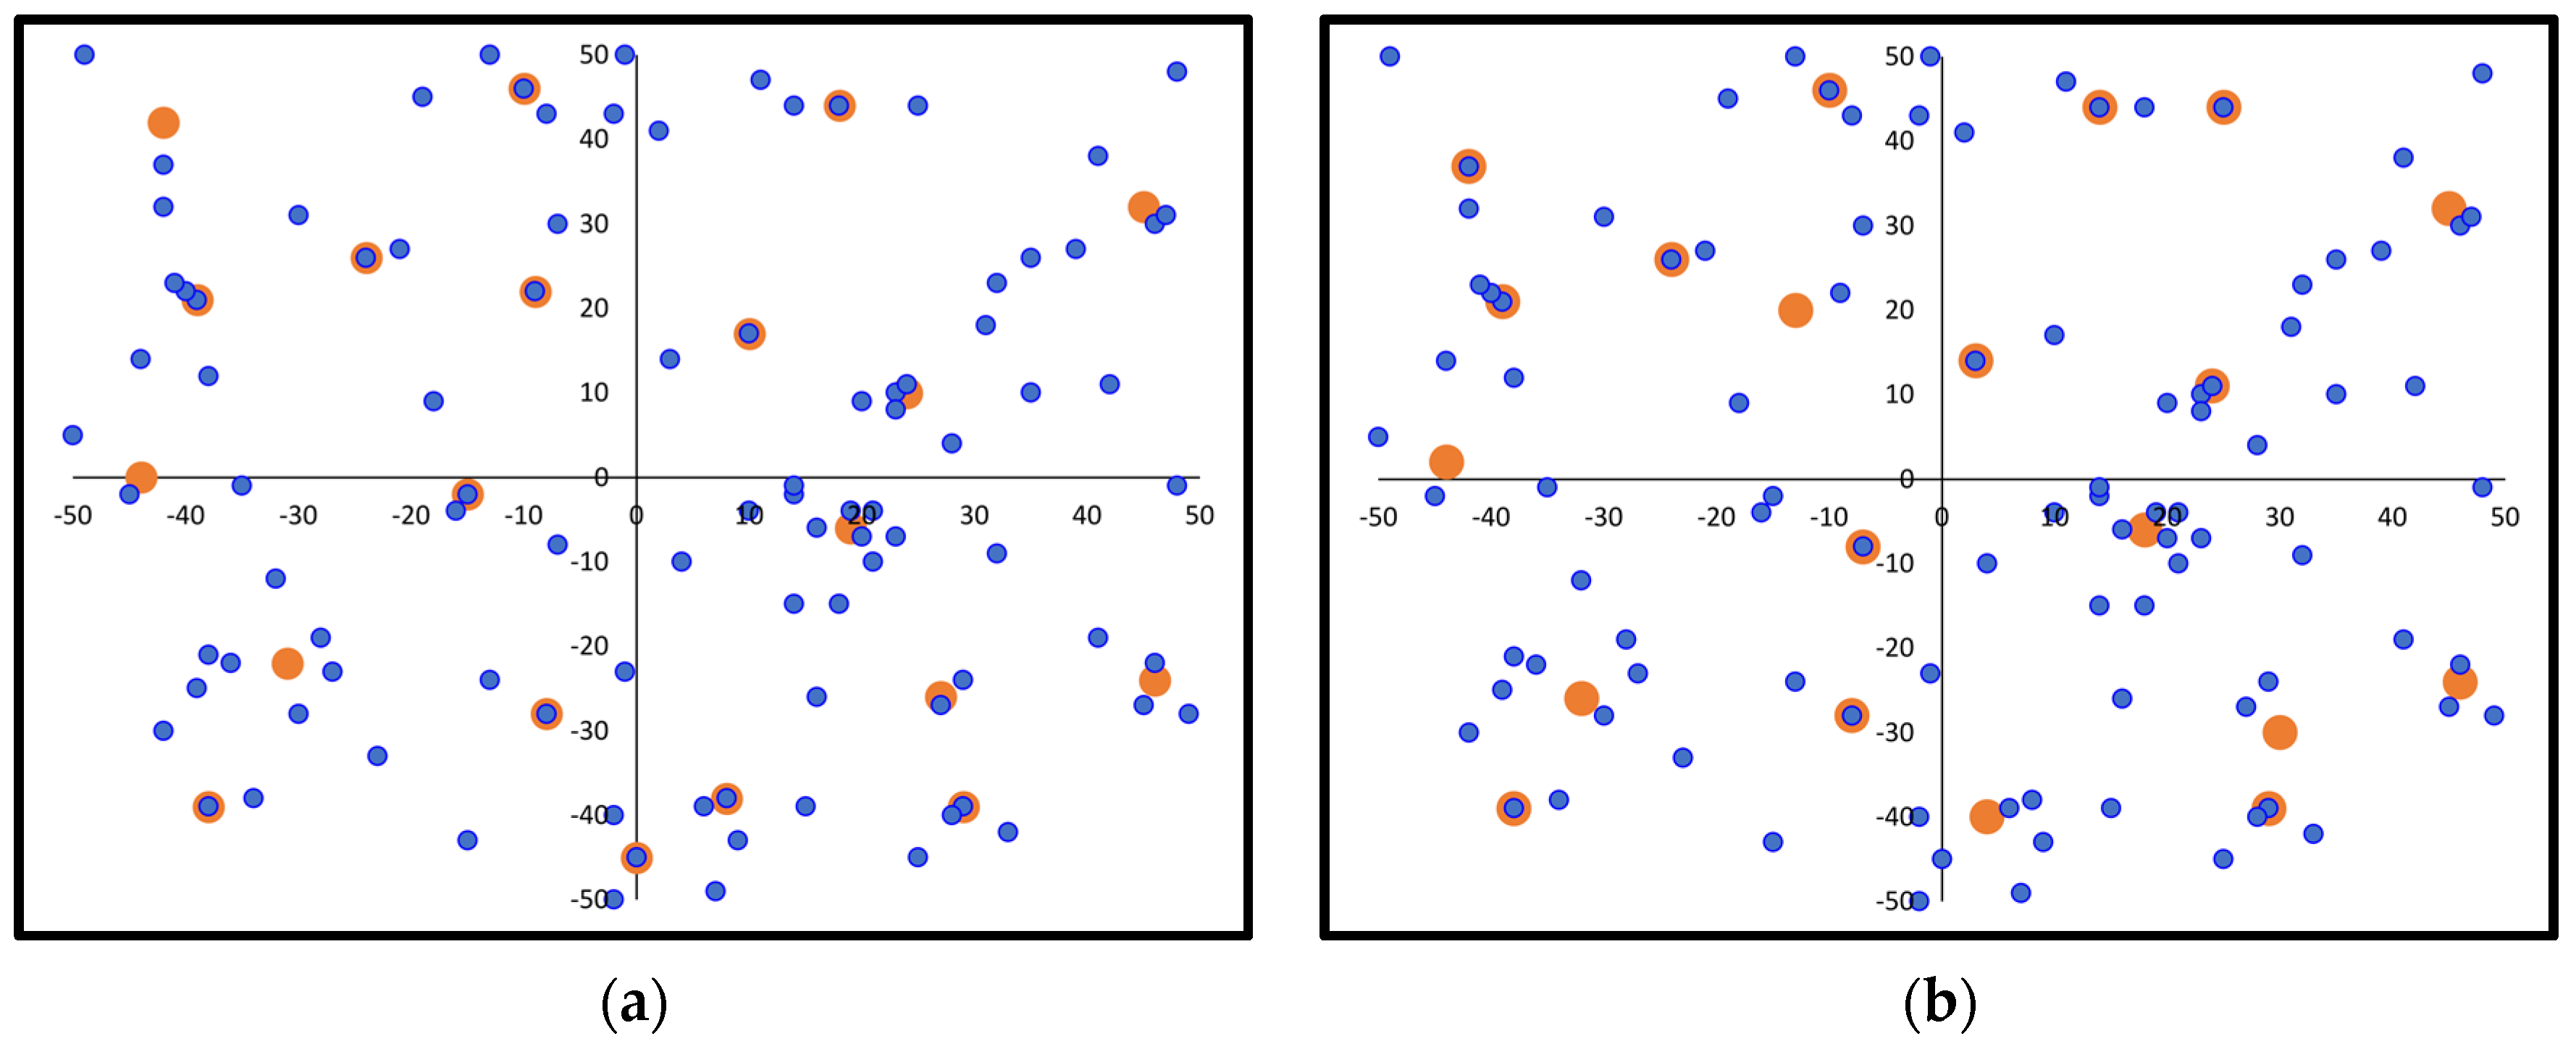
4.9. Case Study 9: Station Allocation for EV Travel Distance (Cost) Minimization at Progressive Station Network Deployment
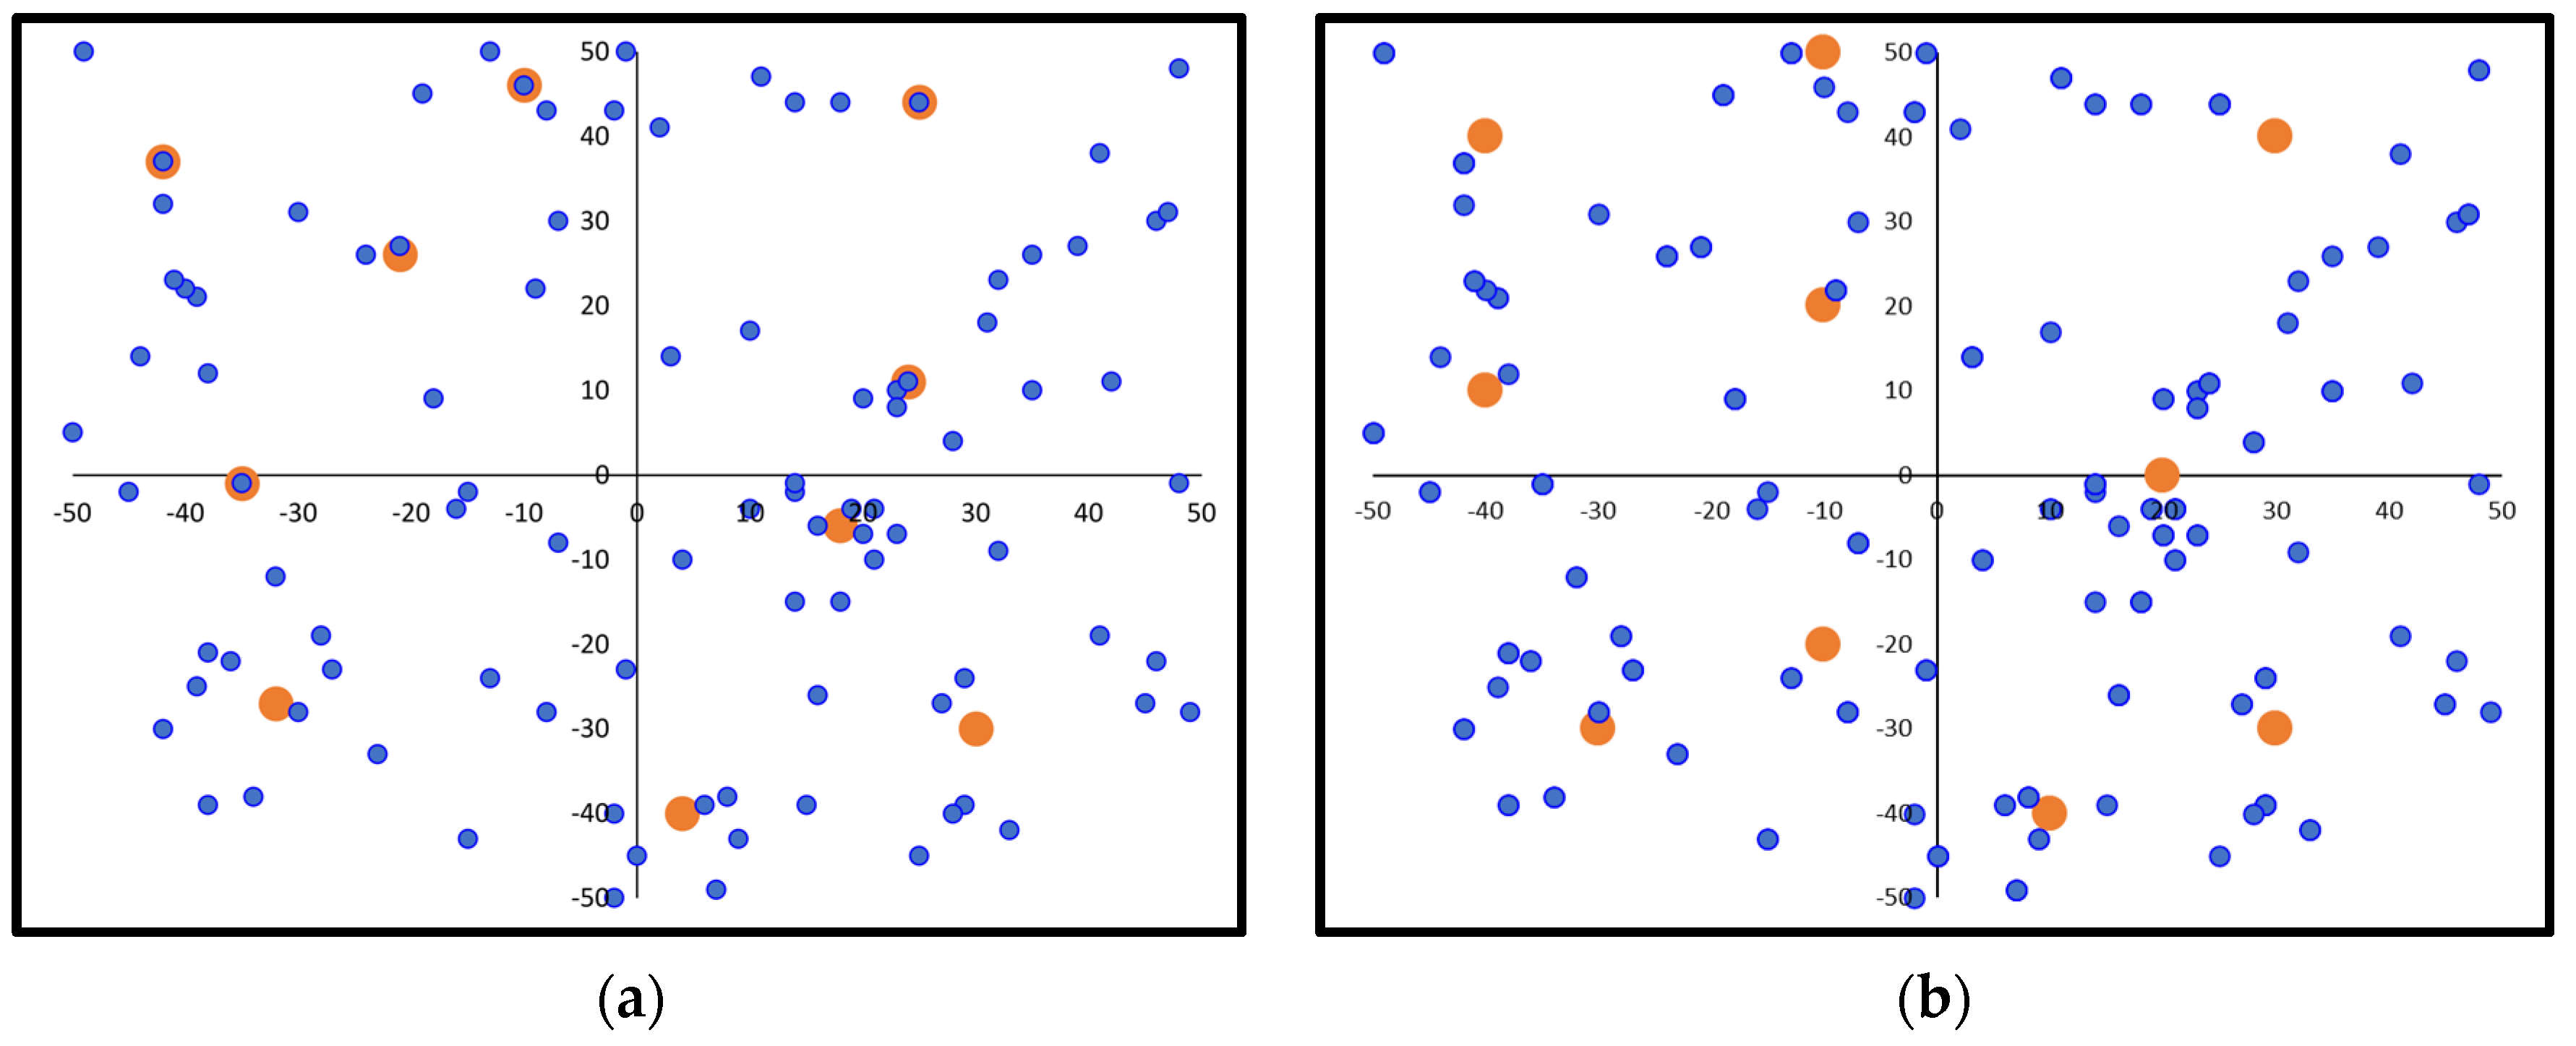
This analysis refers to the practical consideration of the dynamic demand evolvement over time. The EV market and charging demand are still in their infancy in many places around the world but they grow fast. Although a full-scale station development could be done now with the expectation of full market growth in a few years, an alternative cost-effective solution is the ongoing (phased) station development. This approach balances the demand growth and the service provision without binding unnecessary resources for building several stations from the beginning to serve initially sparse EV charging demand. This progressive development may also be of benefit if the EV demand, besides increasing, presents a different space allocation in the future, as a result of city development. For the purposes of the present study, it is assumed that the EV demand retains the same space allocation which is also a realistic scenario. The analysis is performed in two stages. Initially, 10 charging stations are optimally allocated (with reference to the basic scenario). In the second phase, these 10 stations are considered fixed, and another 10 stations are further allocated in an optimal way to improve the total EV traveling distance. The final solution is compared to the one with a single-phase allocation of 20 charging stations.
Figure 14 comparatively illustrates the two scenarios, one deploying 20 stations at once and a second deploying 10 stations nowadays and another 10 stations in a future stage. It can be seen that the total traveling distance in these two cases is 1170 and 1236, respectively, indicating an increase in the second case of about 6%.
4.10. Case Study 10: Station Allocation for EV Travel Distance (Cost) Minimization Considering EV Range Capacity and Infeasible Zones for Station Deployment
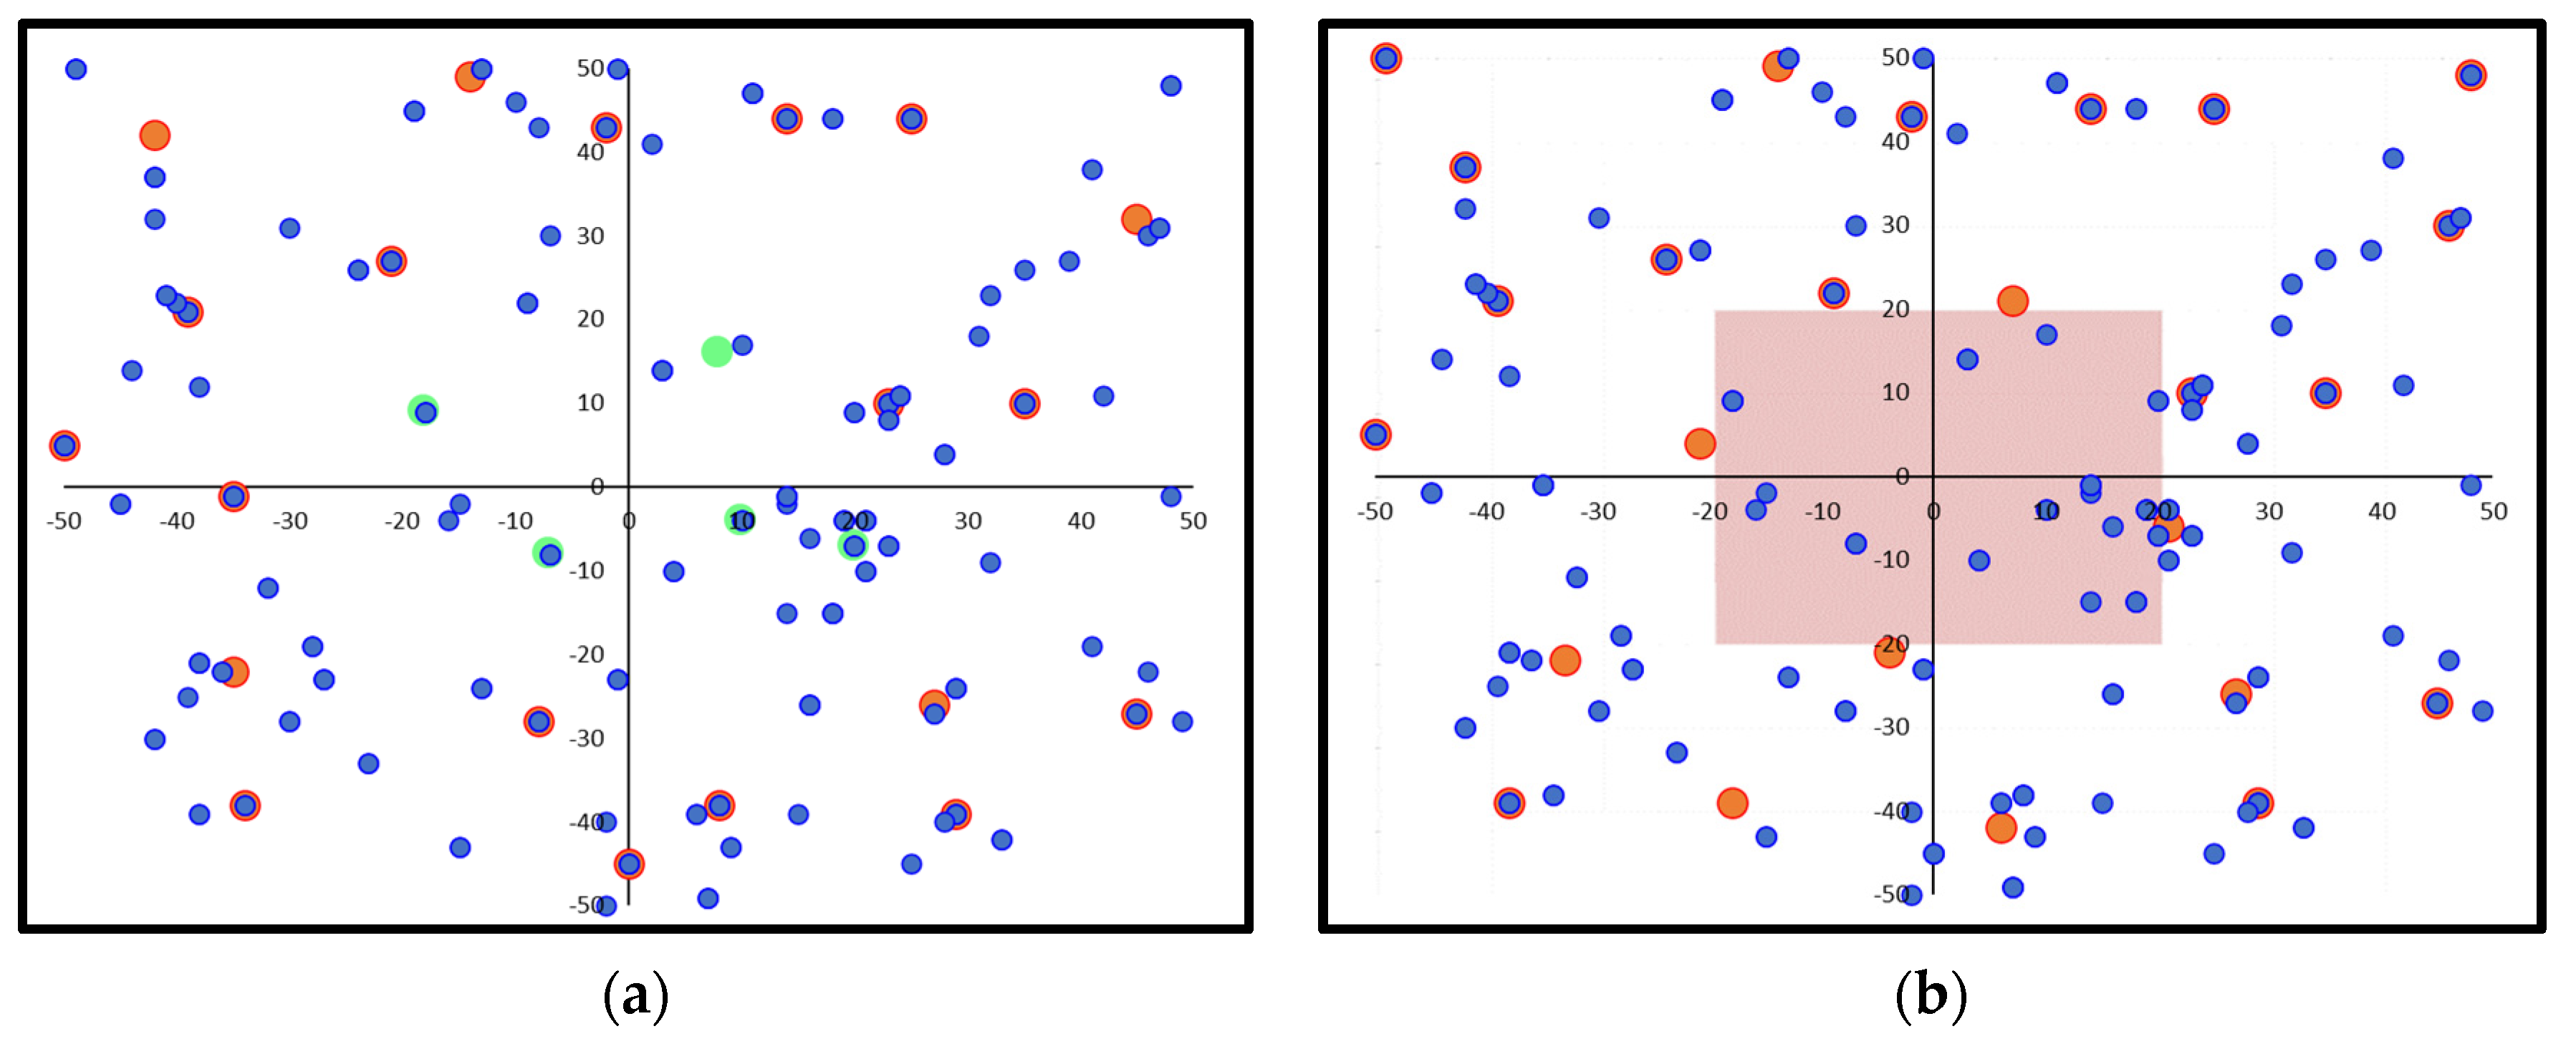
In this part of the analysis, two further cases are considered, the implication of EV range limitations to reach a station and the potential existence of infeasible zones for station deployment. In regard to the traveling range limitation, the 12-station network that was examined in Case Study 1 is revisited. Different range thresholds are considered to indicate the maximum distance the EVs can travel.
Table 3 illustrates some indicative results. If the permittable range is higher than 27.31 units, which is the maximum EV traveling distance in the case of free station allocation, the optimization results coincide with those of Case Study 1 in terms of station spatial distribution and the objective function value. Below the threshold of 27.31 units, station reallocation is needed to satisfy the maximum range constraint at the expense, however, of the total (and average) traveling distance. The lowest limit of the maximum traveling distance that can lead to a feasible solution is 17.03 and can be found by minimizing the max trip distance of all EVs.
The second part of this Case study examines the practical implication of having infeasible zones for station deployment within the search area. This case can be considered a special instance of Case Study 4 (different cost zones) by setting an extremely high-cost value within the infeasible zones. An indicative example is presented in
Figure 15 where the inner zone is considered to be infeasible for station deployment. The results indicate that five stations initially allocated in this zone (green color) are moved outside it with some of them placed just outside the infeasible region to serve EVs from this area. The corresponding fitness values for the two cases in terms of total distance are 948 and 1019, respectively.
5. Discussion
The EV charging station deployment within a spatial area is a combinatorial problem that aims to place the stations in such a pattern that facilitates different objectives, the most important being the cost of station deployment and the necessary traveling distance of EV users to reach a station. The problem includes several numerical and practical considerations that need to be considered to enhance its practical applicability in the real world. In this paper, a simple yet effective optimization model has been developed and tested in several cases to provide a rather complete view of its capability, applicability, and scalability in tackling practical problems.
Focusing on the main analysis and result features, the model considers the two cost functions described above with certain weight coefficients and can be quite easily implemented in a spreadsheet mode. Based on that, several aspects of the problem can be modeled and tested through an optimization software. Among them, some interesting findings include the following: The model can provide an optimal solution for both the number and placement of charging stations based on the demand level and dispersion as well as the cost of station construction and user movement to the nearest station. The optimal station positioning outcome is slightly affected by the area size and the number of demand spots. In fact, the level of solution detail (both in terms of the fitness value and the required computation time) may be controlled by the grid discretization of the analysis area. As anticipated, the more coercive discretization leads to a declining efficiency in terms of fitness value. In the case of very aggregate discretization, the problem may resemble the facility-to-location structure. The model responds expectedly to variations in the charging demand levels and assigns stations close to or right at high-demand spots.
The case studies that were analyzed in the previous section aimed at highlighting the practical implications and summarizing the usefulness of this research. The consideration of several characteristics that simulate the actual EV charging problem and environment (in terms of both optimization goals and constraints) and the exploration of methods for modeling these characteristics provide a tool for efficiently addressing the real-world challenges associated with this problem. In fact, it appears that many of the real-world characteristics can be modeled quite efficiently by exploring suitable ways to describe them with mathematics and developing the respective optimization problem.
The charging station allocation represents the first stage of the whole optimization process. The second part that integrates the process is the EV distribution to stations. Unlike the former part, which is rather of a stationary nature, the second one is highly dynamic as the demand distribution typically changes over time while the actual routes from EV demand spots to any nearby station as well as the traffic conditions need to be taken into account.


