
Speech Emotion Recognition through Hybrid Features and Convolutional Neural Network
 , ,
, ,  ,
,
Abstract
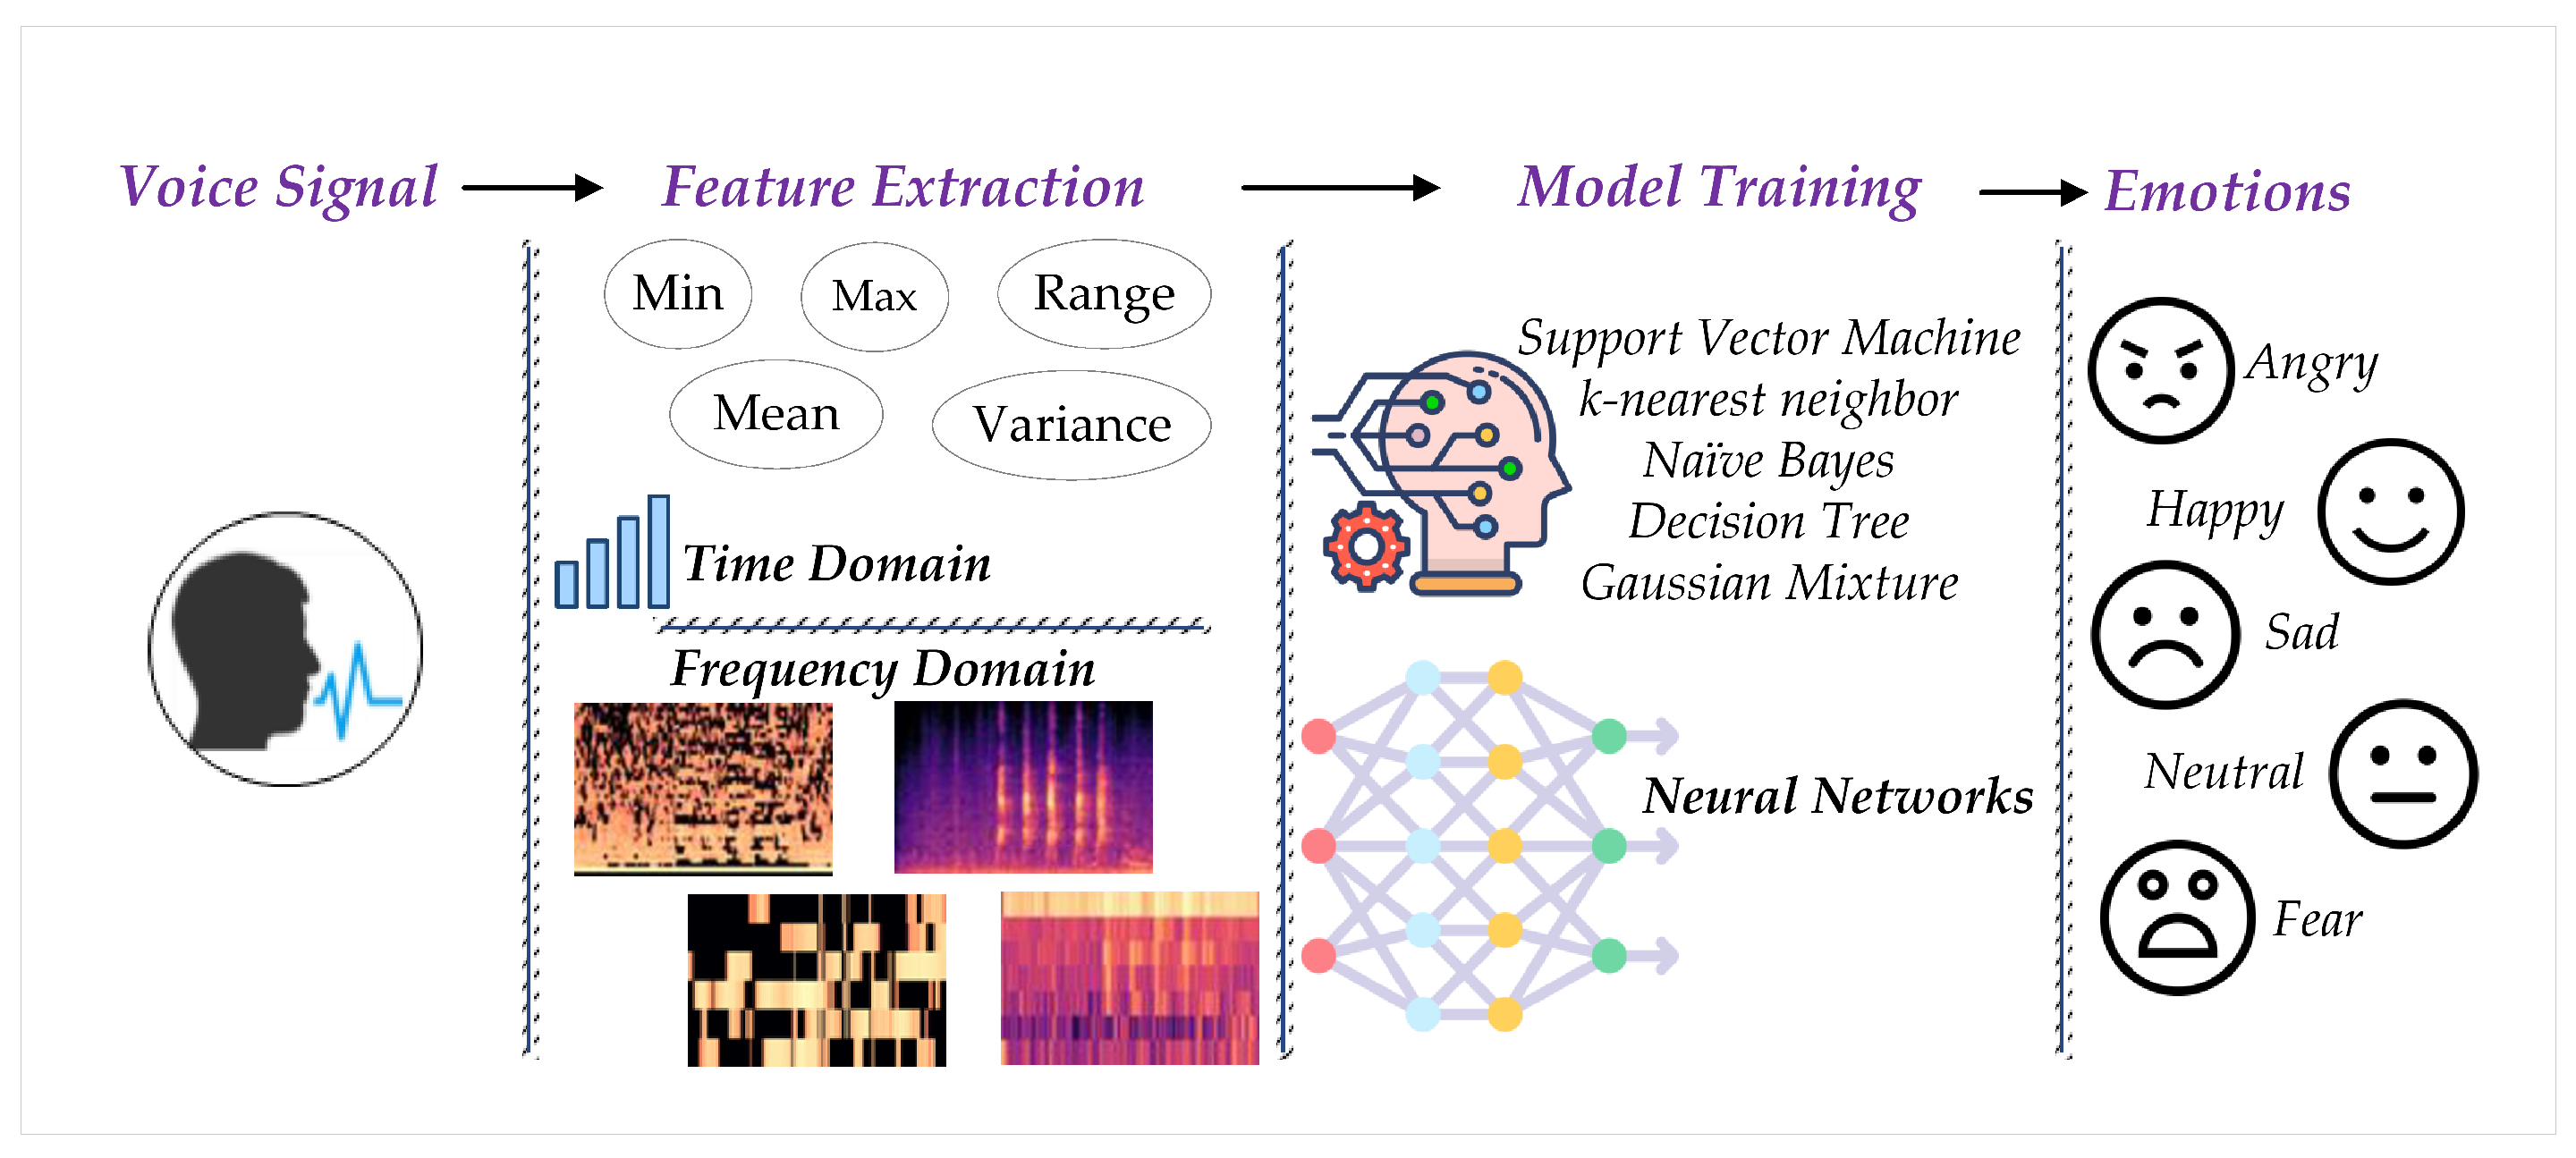
:1. Introduction
- The ability to recognize emotional declines in complex situations, such as inter-speaker differences, variations in expressions, and environmental factors [10];
- The expert-driven features require significant time, money, and human expertise in order to train ML classifiers to enhance the efficiency [11];
- Currently, there is no established algorithm available to extract the ideal features to identify emotions [12].
2. Related Work
2.1. Feature Extraction
2.2. Classification Methods
3. Materials and Methods
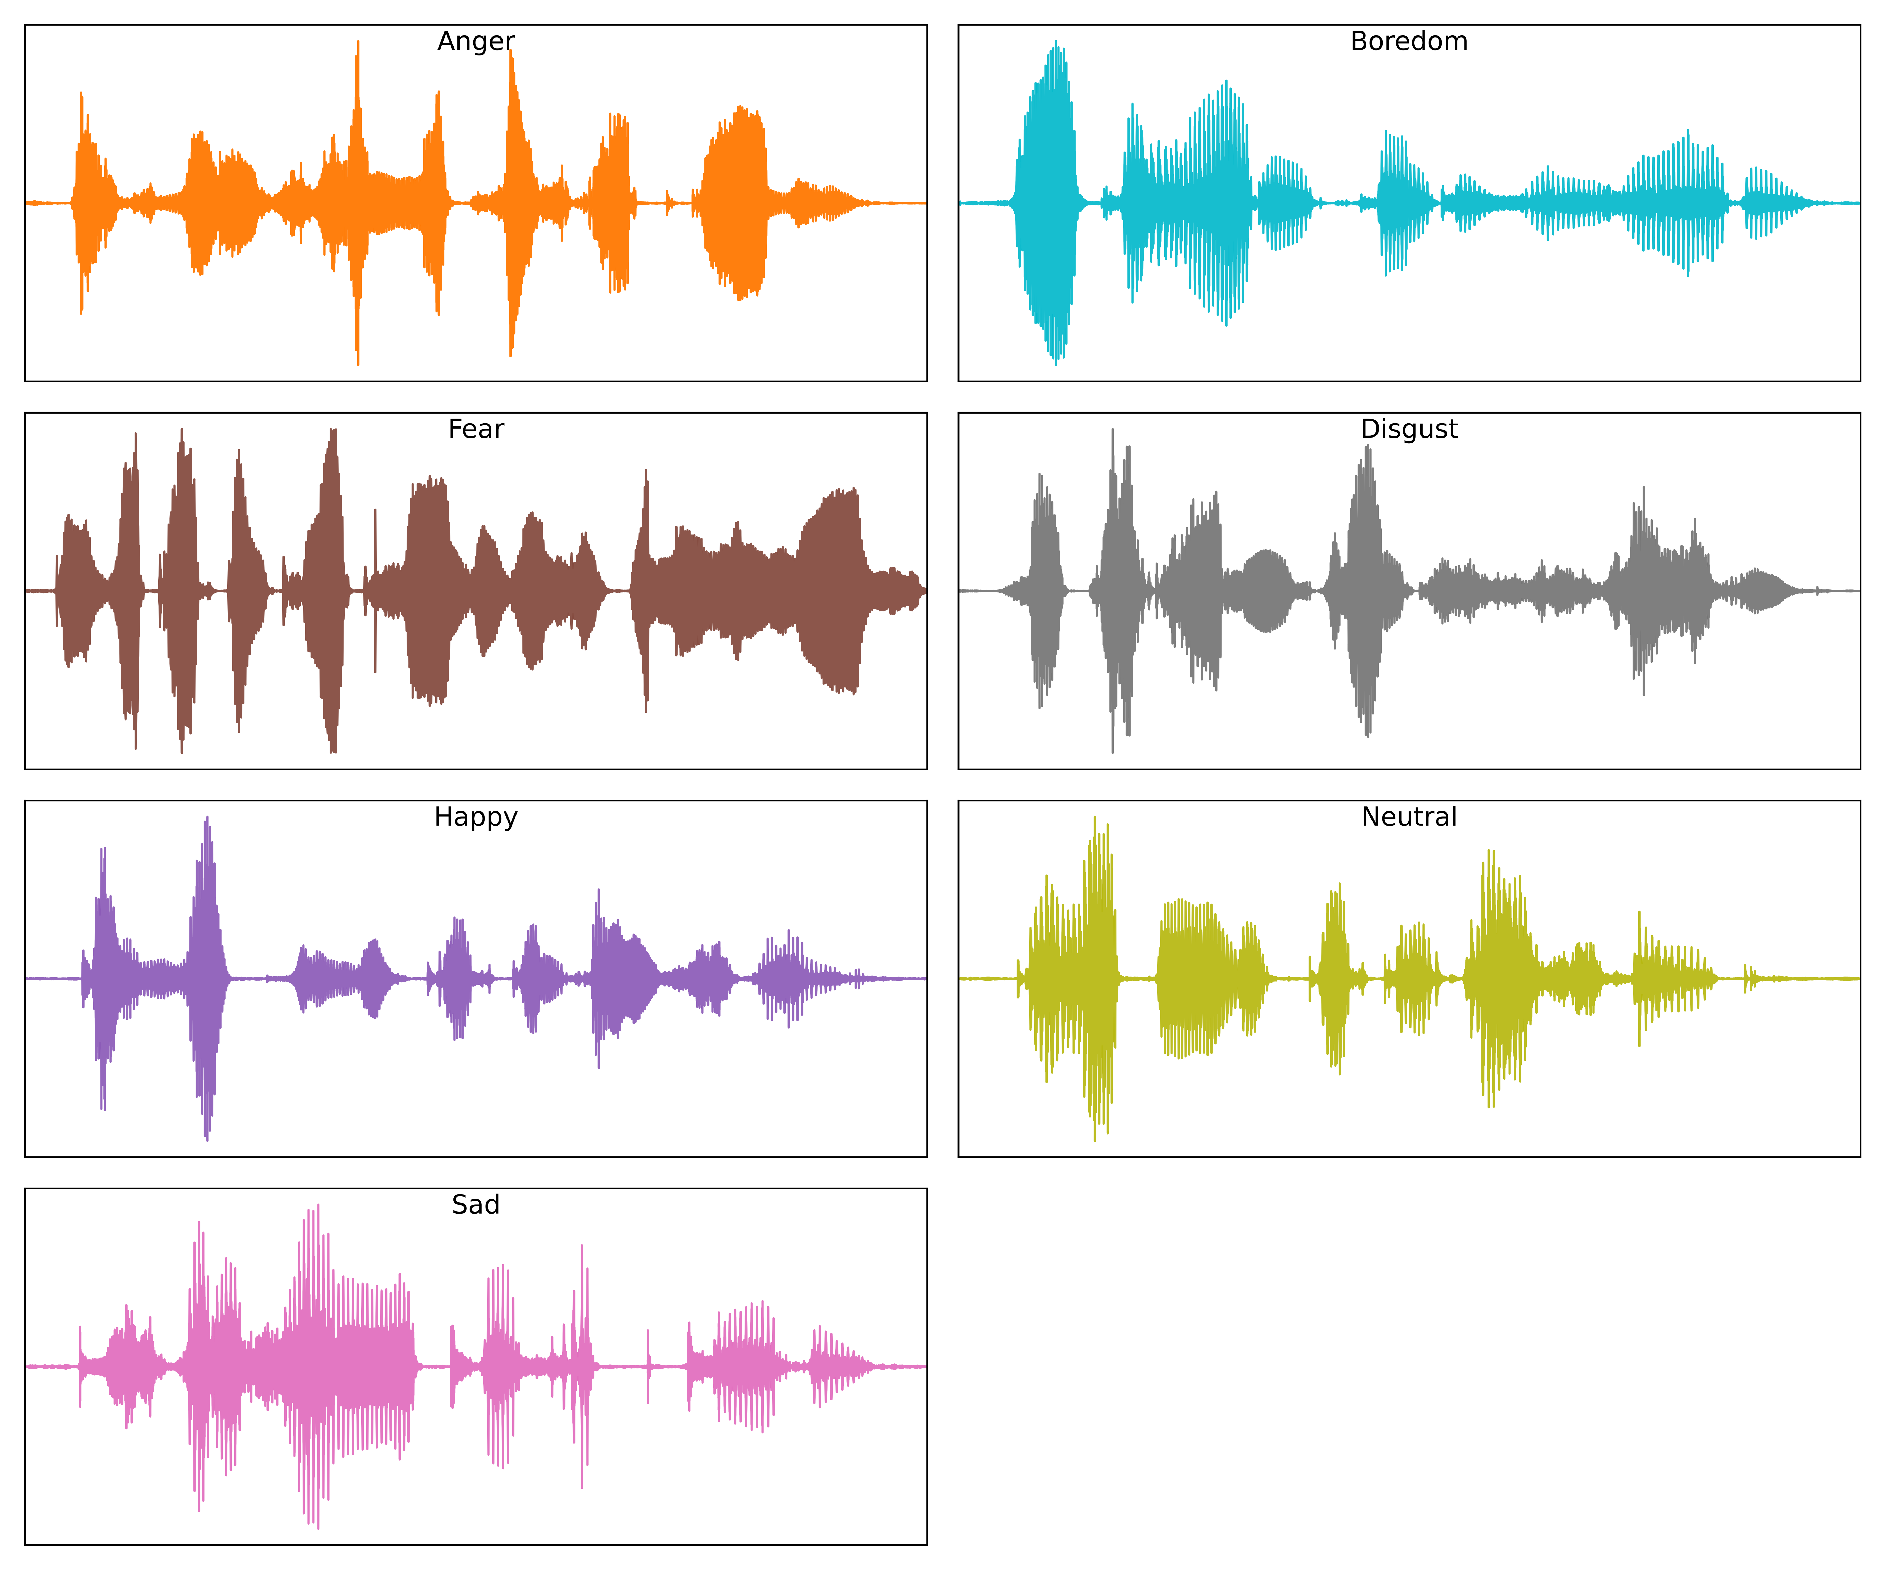
3.1. Datasets
3.2. Data Pre-Processing
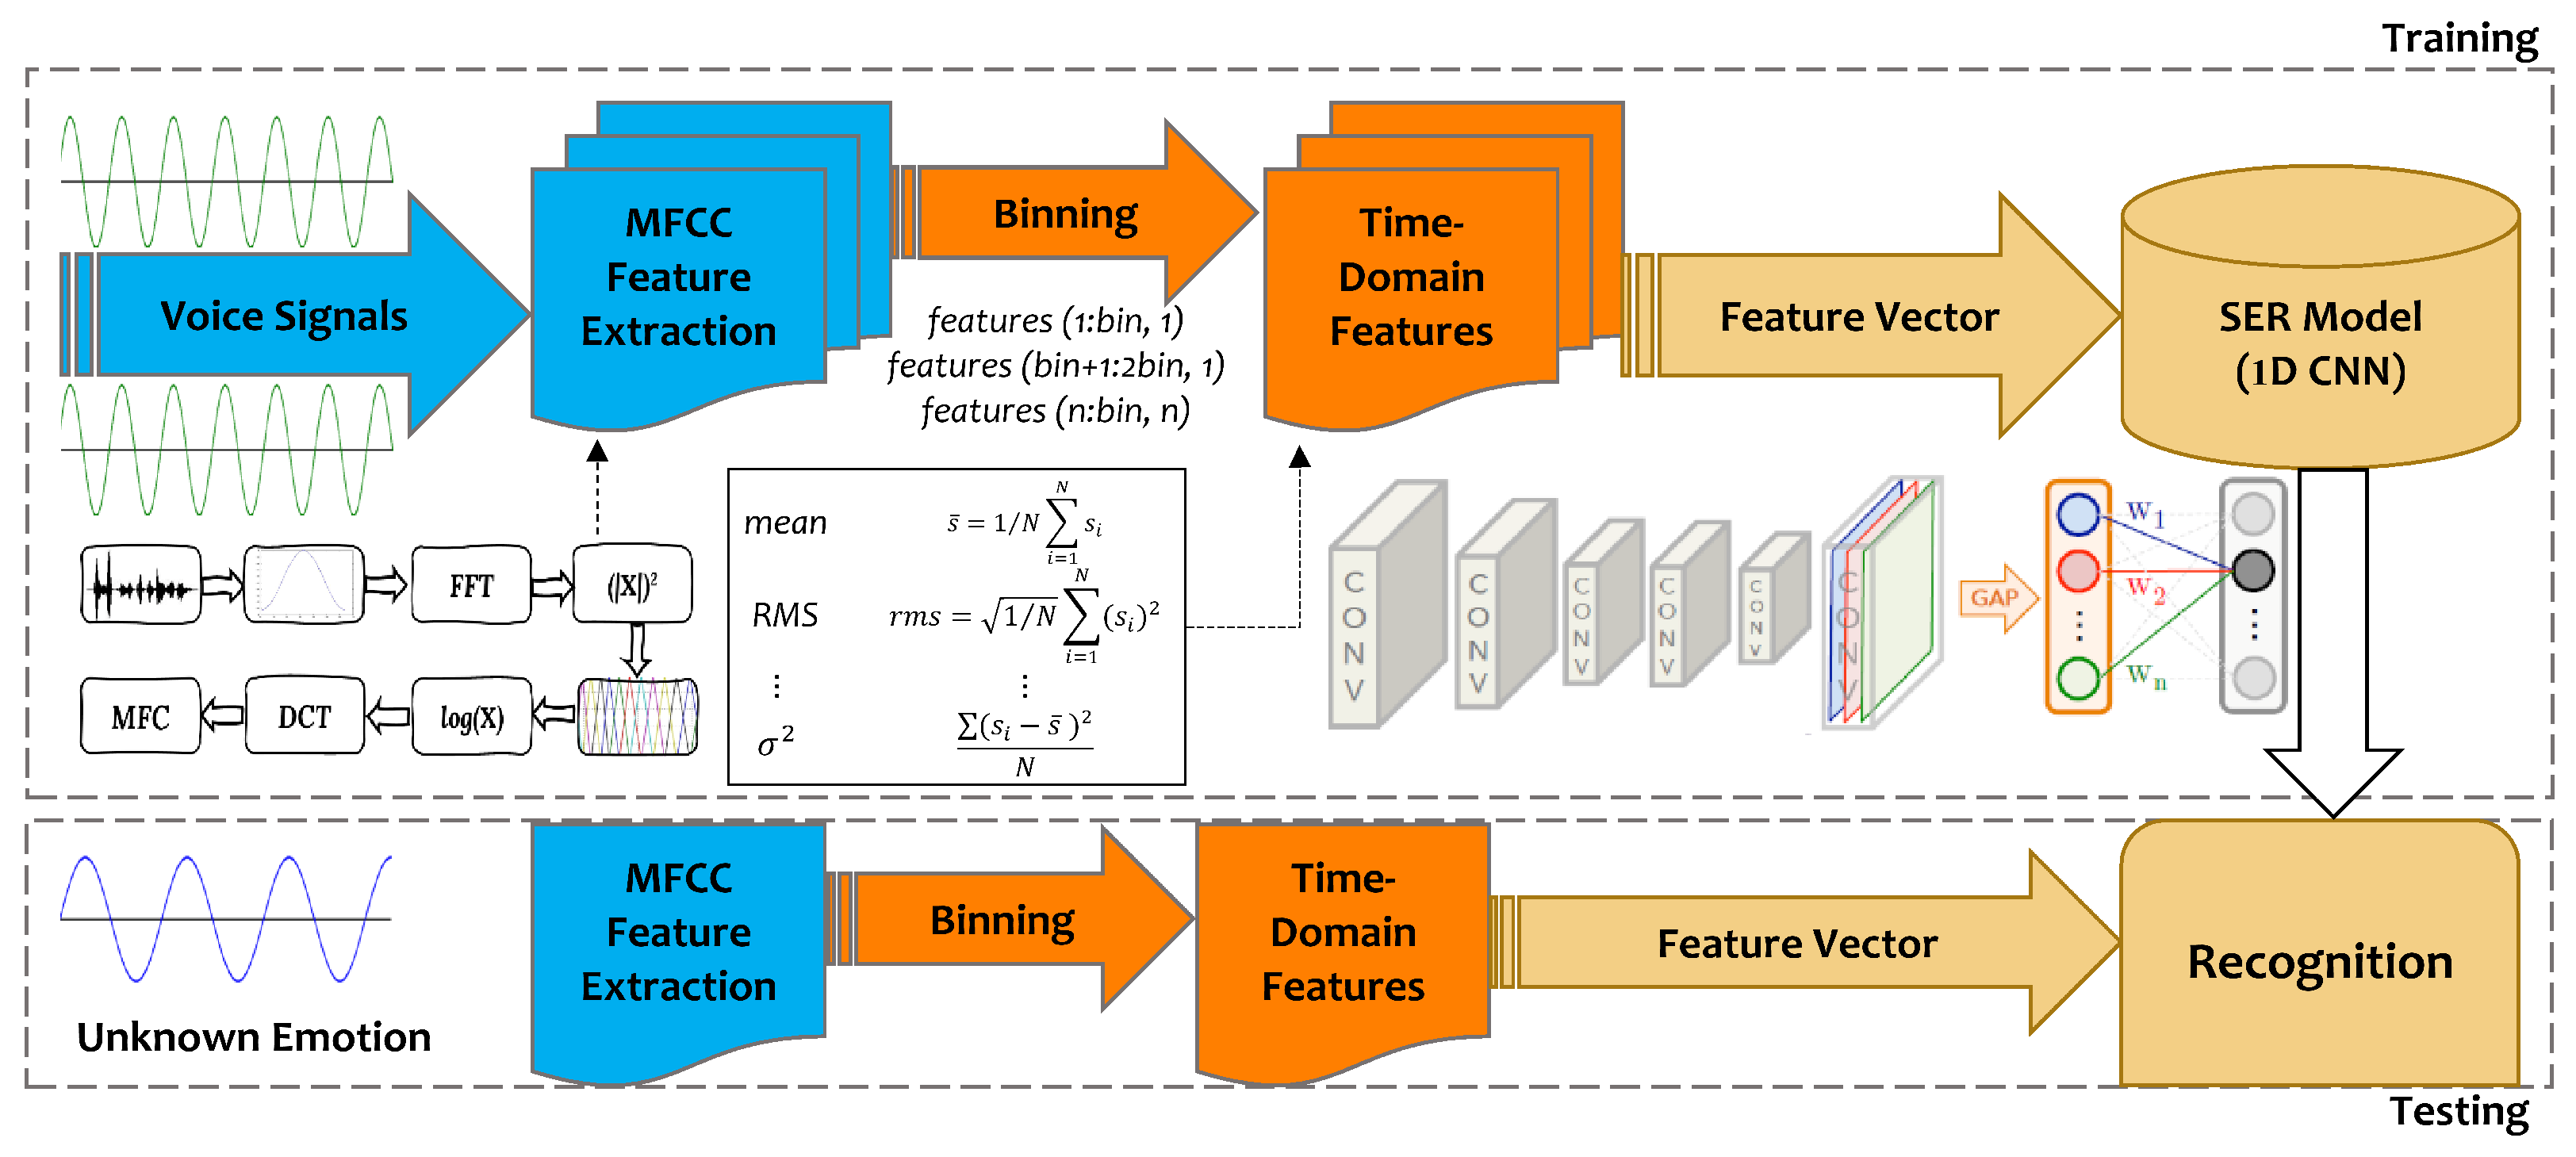
3.3. Feature Extraction
The Proposed MFCCT Features
- (a)
- Extracting the MFCCs features
- (b)
- Extracting MFCCT Features
| Algorithm 1: Constructing the Master Feature Vector for CNN. |
12  |
3.4. Convolutional Neural Network Model
3.5. Evaluation Metrics
4. Experimental Results and Discussion
4.1. Results of Experiment I
4.2. Results of Experiment II
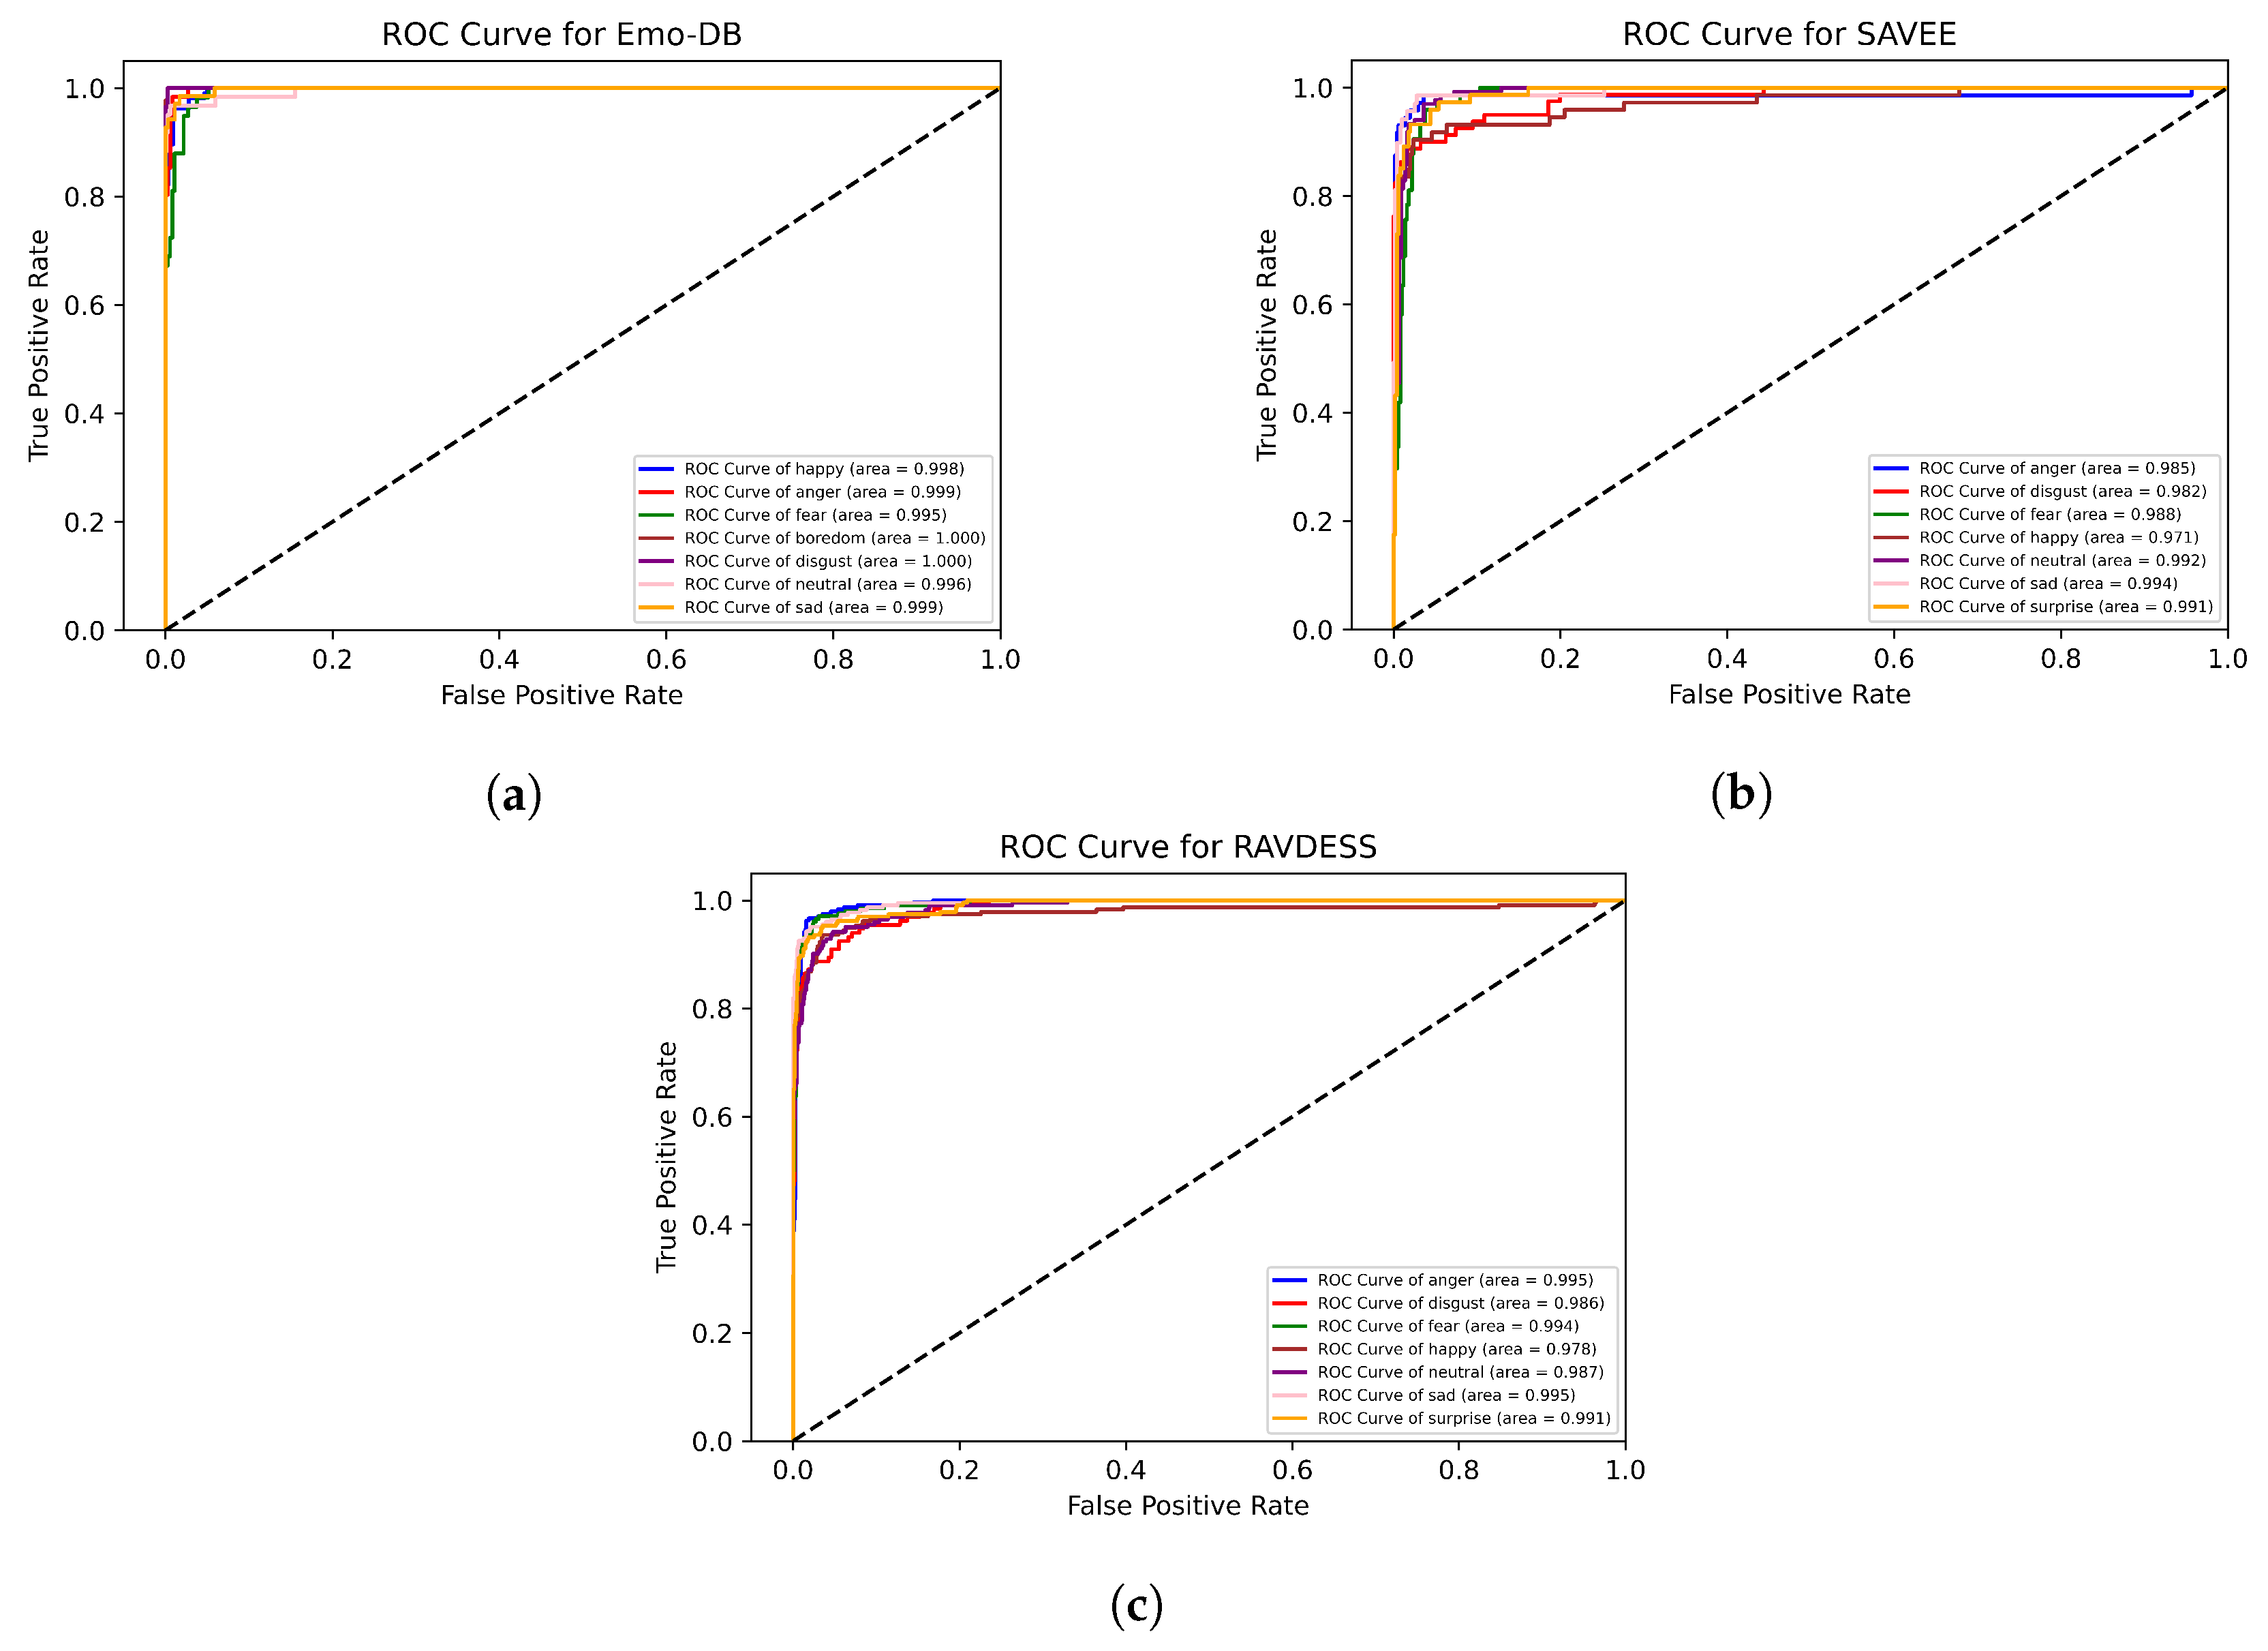
4.3. Results of Experiment III
4.4. Results of Experiment IV
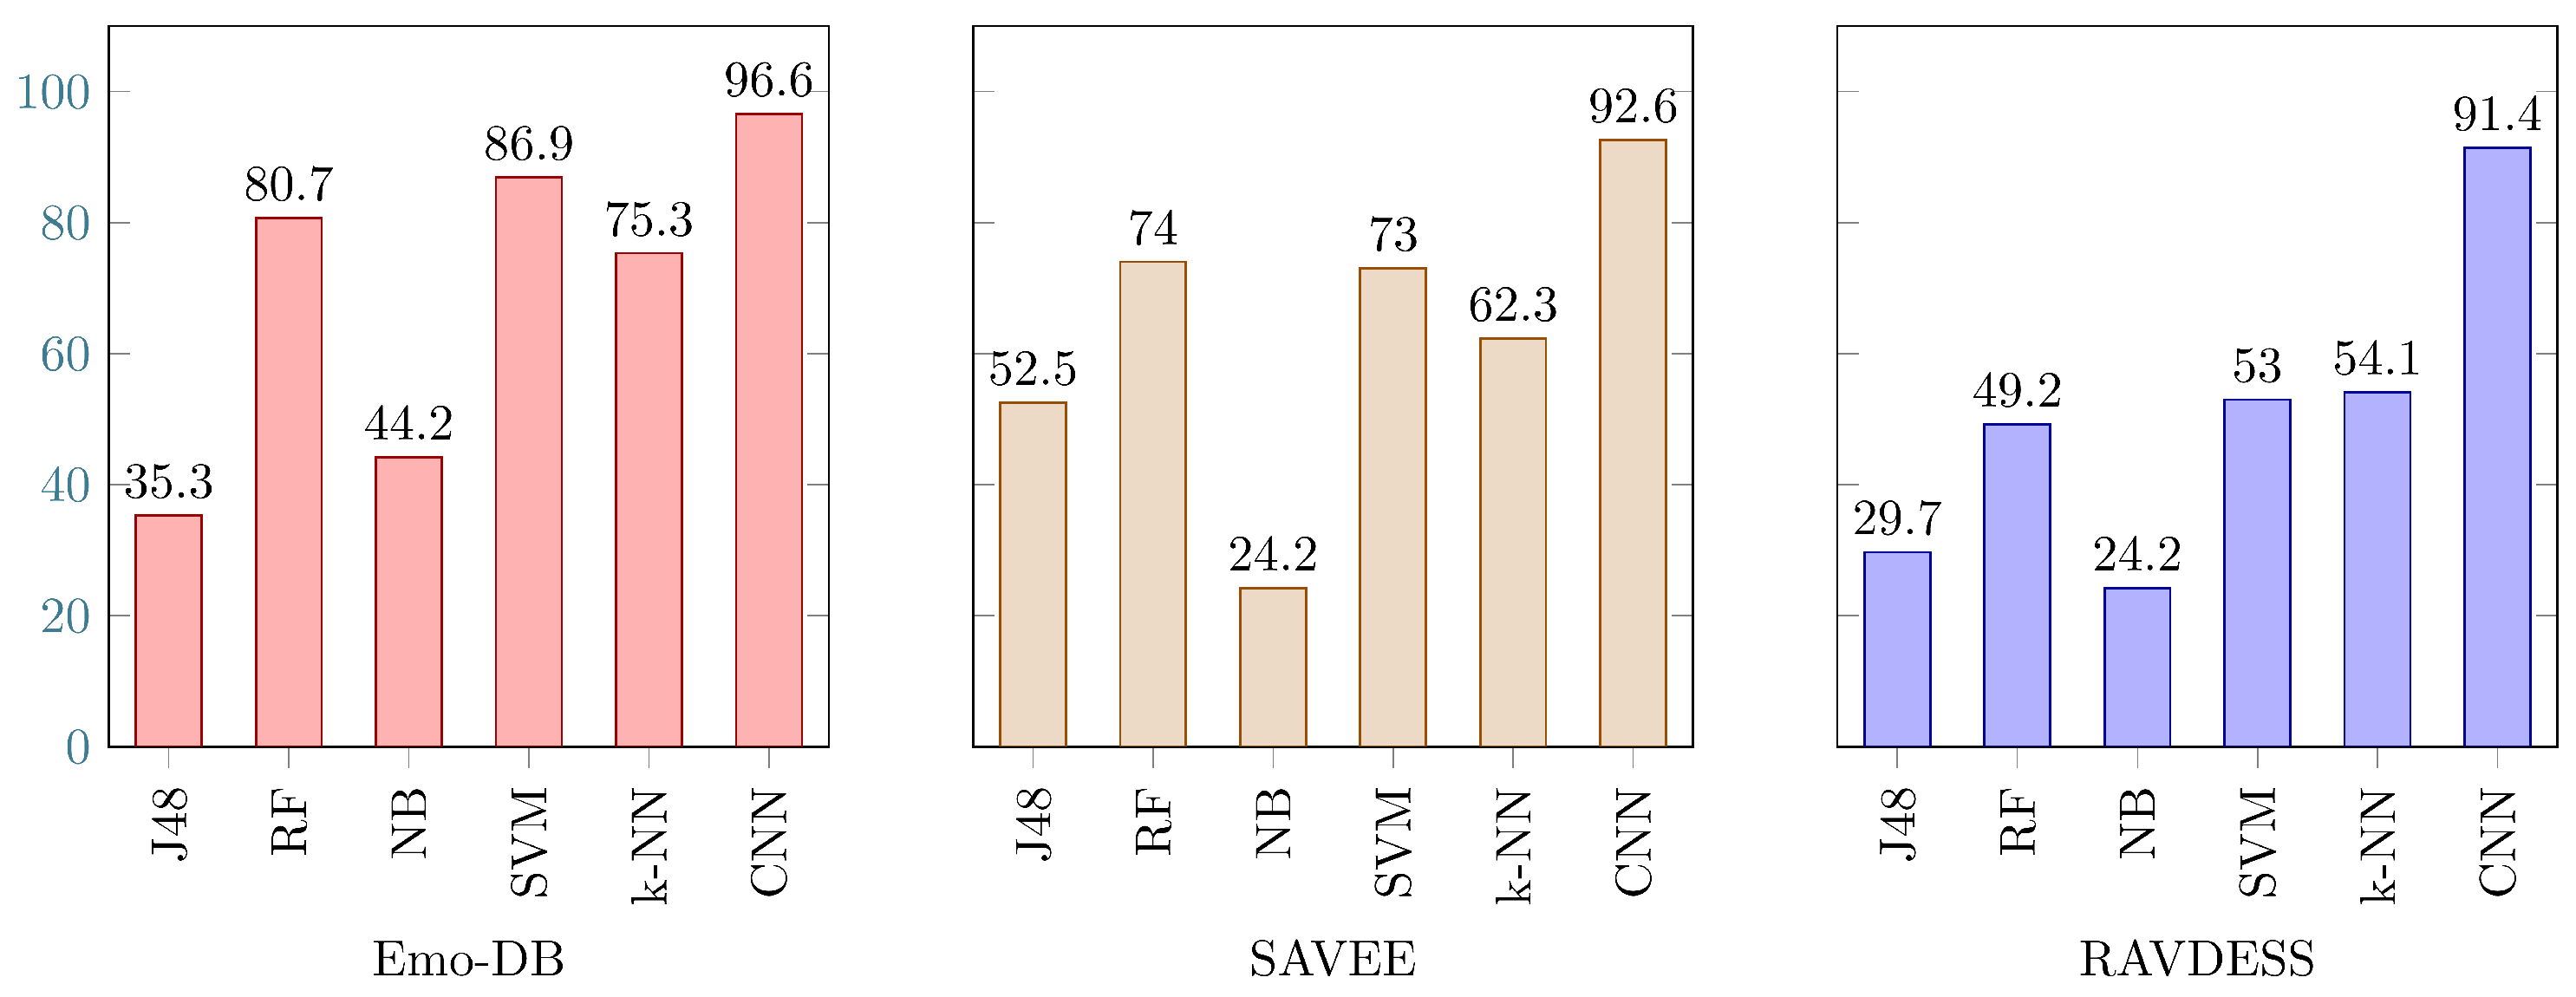
4.5. Comparison with Baseline
4.6. Summary
5. Conclusions
Author Contributions
Funding
Institutional Review Board Statement
Informed Consent Statement
Data Availability Statement
Conflicts of Interest
References
- Chen, L.; Su, W.; Feng, Y.; Wu, M.; She, J.; Hirota, K. Two-layer fuzzy multiple random forest for speech emotion recognition in human-robot interaction. Inf. Sci. 2020, 509, 150–163. [Google Scholar] [CrossRef]
- Hansen, J.H.; Cairns, D.A. Icarus: Source generator based real-time recognition of speech in noisy stressful and lombard effect environments. Speech Commun. 1995, 16, 391–422. [Google Scholar] [CrossRef]
- Koduru, A.; Valiveti, H.B.; Budati, A.K. Feature extraction algorithms to improve the speech emotion recognition rate. Int. J. Speech Technol. 2020, 23, 45–55. [Google Scholar] [CrossRef]
- Zheng, W.; Zheng, W.; Zong, Y. Multi-scale discrepancy adversarial network for crosscorpus speech emotion recognition. Virtual Real. Intell. Hardw. 2021, 3, 65–75. [Google Scholar] [CrossRef]
- Schuller, B.; Rigoll, G.; Lang, M. Speech emotion recognition combining acoustic features and linguistic information in a hybrid support vector machine-belief network architecture. In Proceedings of the 2004 IEEE International Conference on Acoustics, Speech, and Signal Processing, Montreal, QC, Canada, 17–21 May 2004; pp. 577–580. [Google Scholar]
- Spencer, C.; Koç, İ.A.; Suga, C.; Lee, A.; Dhareshwar, A.M.; Franzén, E.; Iozzo, M.; Morrison, G.; McKeown, G. A Comparison of Unimodal and Multimodal Measurements of Driver Stress in Real-World Driving Conditions; ACM: New York, NY, USA, 2020. [Google Scholar]
- France, D.J.; Shiavi, R.G.; Silverman, S.; Silverman, M.; Wilkes, M. Acoustical properties of speech as indicators of depression and suicidal risk. IEEE Trans. Biomed. Eng. 2000, 47, 829–837. [Google Scholar] [CrossRef]
- Uddin, M.Z.; Nilsson, E.G. Emotion recognition using speech and neural structured learning to facilitate edge intelligence. Eng. Appl. Artif. Intell. 2020, 94, 103775. [Google Scholar] [CrossRef]
- Jahangir, R.; Teh, Y.W.; Hanif, F.; Mujtaba, G. Deep learning approaches for speech emotion recognition: State of the art and research challenges. Multimed. Tools Appl. 2021, 80, 23745–23812. [Google Scholar] [CrossRef]
- Fahad, M.S.; Ranjan, A.; Yadav, J.; Deepak, A. A survey of speech emotion recognition in natural environment. Digit. Signal Process. 2021, 110, 102951. [Google Scholar] [CrossRef]
- Jahangir, R.; Teh, Y.W.; Mujtaba, G.; Alroobaea, R.; Shaikh, Z.H.; Ali, I. Convolutional neural network-based cross-corpus speech emotion recognition with data augmentation and features fusion. Mach. Vis. Appl. 2022, 33, 41. [Google Scholar] [CrossRef]
- Ayadi, M.E.; Kamel, M.S.; Karray, F. Survey on speech emotion recognition: Features, classification schemes, and databases. Pattern Recognit. 2011, 44, 572–587. [Google Scholar] [CrossRef]
- Abdel-Hamid, O.; Mohamed, A.-R.; Jiang, H.; Deng, L.; Penn, G.; Yu, D. Convolutional neural networks for speech recognition. IEEE/ACM Trans. Audio Speech Lang. Process. 2014, 22, 1533–1545. [Google Scholar] [CrossRef] [Green Version]
- Trigeorgis, G.; Ringeval, F.; Brueckner, R.; Marchi, E.; Nicolaou, M.A.; Schuller, B.; Zafeiriou, S. Adieu features? end-to-end speech emotion recognition using a deep convolutional recurrent network. In Proceedings of the 2016 IEEE International Conference on Acoustics, Speech and Signal Processing (ICASSP), Shanghai, China, 20–25 March 2016; pp. 5200–5204. [Google Scholar]
- Anvarjon, T.; Kwon, S. Deep-net: A lightweight CNN-based speech emotion recognition system using deep frequency features. Sensors 2020, 20, 5212. [Google Scholar] [CrossRef] [PubMed]
- Rybka, J.; Janicki, A. Comparison of speaker dependent and speaker independent emotion recognition. Int. J. Appl. Math. Comput. Sci. 2013, 23, 797–808. [Google Scholar] [CrossRef]
- Akçay, M.B.; Oğuz, K. Speech emotion recognition: Emotional models, databases, features, preprocessing methods, supporting modalities, and classifiers. Speech Commun. 2020, 116, 56–76. [Google Scholar] [CrossRef]
- Zhang, S.; Tao, X.; Chuang, Y.; Zhao, X. Learning deep multimodal affective features for spontaneous speech emotion recognition. Speech Commun. 2021, 127, 73–81. [Google Scholar] [CrossRef]
- Pawar, M.D.; Kokate, R.D. Convolution neural network based automatic speech emotion recognition using Mel-frequency Cepstrum coefficients. Multimed. Tools Appl. 2021, 80, 15563–15587. [Google Scholar] [CrossRef]
- Issa, D.; Demirci, M.F.; Yazici, A. Speech emotion recognition with deep convolutional neural networks. Biomed. Signal Process. Control. 2020, 59, 101894. [Google Scholar] [CrossRef]
- Sajjad, M.; Kwon, S. Clustering-based speech emotion recognition by incorporating learned features and deep BiLSTM. IEEE Access 2020, 8, 79861–79875. [Google Scholar]
- Badshah, A.M.; Rahim, N.; Ullah, N.; Ahmad, J.; Muhammad, K.; Lee, M.Y.; Kwon, S.; Baik, S.W. Deep features-based speech emotion recognition for smart affective services. Multimed. Tools Appl. 2019, 78, 5571–5589. [Google Scholar] [CrossRef]
- Er, M.B. A Novel Approach for Classification of Speech Emotions Based on Deep and Acoustic Features. IEEE Access 2020, 8, 221640–221653. [Google Scholar] [CrossRef]
- Nicholson, J.; Takahashi, K.; Nakatsu, R. Emotion recognition in speech using neural networks. Neural Comput. Appl. 2000, 9, 290–296. [Google Scholar] [CrossRef]
- Noroozi, F.; Sapiński, T.; Kamińska, D.; Anbarjafari, G. Vocal-based emotion recognition using random forests and decision tree. Int. J. Speech Technol. 2017, 20, 239–246. [Google Scholar] [CrossRef]
- Nwe, T.L.; Foo, S.W.; Silva, L.C.D. Speech emotion recognition using hidden Markov models. Speech Commun. 2003, 41, 603–623. [Google Scholar] [CrossRef]
- Aljuhani, R.H.; Alshutayri, A.; Alahdal, S. Arabic Speech Emotion Recognition From Saudi Dialect Corpus. IEEE Access 2021, 9, 127081–127085. [Google Scholar] [CrossRef]
- Al-onazi, B.B.; Nauman, M.A.; Jahangir, R.; Malik, M.M.; Alkhammash, E.H.; Elshewey, A.M. Transformer-based multilingual speech emotion recognition using data augmentation and feature fusion. Appl. Sci. 2022, 12, 9188. [Google Scholar] [CrossRef]
- Jahangir, R.; Teh, Y.W.; Memon, N.A.; Mujtaba, G.; Zareei, M.; Ishtiaq, U.; Akhtar, M.Z.; Ali, I. Text-independent speaker identification through feature fusion and deep neural network. IEEE Access 2020, 8, 32187–32202. [Google Scholar] [CrossRef]
- Jahangir, R.; Teh, Y.W.; Nweke, H.F.; Mujtaba, G.; Al-Garadi, M.A.; Ali, I. Speaker identification through artificial intelligence techniques: A comprehensive review and research challenges. Expert Syst. Appl. 2021, 171, 114591. [Google Scholar] [CrossRef]
- Khan, A.A.; Jahangir, R.; Alroobaea, R.; Alyahyan, S.Y.; Almulhi, A.H.; Alsafyani, M. An efficient text-independent speaker identification using feature fusion and transformer model. Comput. Mater. Contin. 2023, 75, 4085–4100. [Google Scholar]
- Garcia-Ceja, E.; Riegler, M.; Kvernberg, A.K.; Torresen, J. User-adaptive models for activity and emotion recognition using deep transfer learning and data augmentation. User Model. User-Adapt. Interact. 2020, 30, 365–393. [Google Scholar] [CrossRef]
- Nie, W.; Ren, M.; Nie, J.; Zhao, S. C-GCN: Correlation based Graph Convolutional Network for Audio-video Emotion Recognition. IEEE Trans. Multimed. 2020, 23, 3793–3804. [Google Scholar] [CrossRef]
- Gholamy, A.; Kreinovich, V.; Kosheleva, O. Why 70/30 or 80/20 Relation between Training and Testing Sets: A Pedagogical Explanation; University of Texas at El Paso USA: El Paso, TX, USA, 2018. [Google Scholar]
- Burkhardt, F.; Paeschke, A.; Rolfes, M.; Sendlmeier, W.F.; Weiss, B. A database of German emotional speech. In Proceedings of the Ninth European Conference on Speech Communication and Technology, Lisbon, Portugal, 4–8 September 2005. [Google Scholar]
- Livingstone, S.R.; Russo, F.A. The Ryerson Audio-Visual Database of Emotional Speech and Song (RAVDESS): A dynamic, multimodal set of facial and vocal expressions in North American English. PLoS ONE 2018, 13, e0196391. [Google Scholar] [CrossRef] [PubMed] [Green Version]
- Jackson, P.; Haq, S. Surrey Audio-Visual Expressed Emotion (Savee) Database; University of Surrey: Guildford, UK, 2014. [Google Scholar]
- Domingos, P. A few useful things to know about machine learning. Commun. ACM 2012, 55, 78–87. [Google Scholar] [CrossRef] [Green Version]
- Tahon, M.; Devillers, L. Towards a small set of robust acoustic features for emotion recognition: Challenges. IEEE/ACM Trans. Audio Speech Lang. Process. 2015, 24, 16–28. [Google Scholar] [CrossRef] [Green Version]
- Fawcett, T. An introduction to ROC analysis. Pattern Recognit. Lett. 2006, 27, 861–874. [Google Scholar] [CrossRef]
- Farooq, M.; Hussain, F.; Baloch, N.K.; Raja, F.R.; Yu, H.; Zikria, Y.B. Impact of Feature Selection Algorithm on Speech Emotion Recognition Using Deep Convolutional Neural Network. Sensors 2020, 20, 6008. [Google Scholar] [CrossRef] [PubMed]
- Zhao, Z.; Li, Q.; Zhang, Z.; Cummins, N.; Wang, H.; Tao, J.; Schuller, B.W. Combining a parallel 2D CNN with a self-attention Dilated Residual Network for CTC-Based discrete speech emotion recognition. Neural Netw. 2021, 141, 52–60. [Google Scholar] [CrossRef]
- Kwon, S. Att-Net: Enhanced emotion recognition system using lightweight self-attention module. Appl. Soft Comput. 2021, 102, 107101. [Google Scholar]


| Label | Time-Domain Features |
|---|---|
| MIN | Minimum value of each bin |
| MAX | Maximum value of each bin |
| Mn | Mean value of each bin |
| Md | Median of each bin |
| Mo | Mode of each bin |
| STD | Standard deviation of each bin |
| VAR | Variance of each bin |
| COV | Covariance of each bin |
| RMS | Root mean square of each bin |
| Q1 | 25th percentile of each bin |
| Q2 | 50th percentile of each bin |
| Q3 | 75th percentile of each bin |
| CNN Configuration |
|---|
| Conv_1 (5, @64), activation function = “ReLU”, Dropout Rate (0.2), |
| MaxPooling_1 (4), Conv_2 (5, @128), activation function= “ReLU”, |
| Dropout Rate (0.2), MaxPooling_2 (4), Conv (5, @256), activation |
| function= “ReLU”, Dropout Rate (0.2), Flatten, Dense (7 neurons), |
| Softmax (7 emotions) |
| Parameters: Adam Optimizer, 100 epochs, 0.0001 learning rate |
| 500 | 1000 | 1500 | 2000 | 2500 | 3000 | |
|---|---|---|---|---|---|---|
| EMO-DB | 0.76 | 0.87 | 0.97 | 0.81 | 0.81 | 0.82 |
| SAVEE | 0.77 | 0.84 | 0.93 | 0.78 | 0.74 | 0.74 |
| RAVDESS | 0.72 | 0.81 | 0.92 | 0.73 | 0.64 | 0.76 |
| No of t-Domain Features | EMO-DB | SAVEE | RAVDESS |
|---|---|---|---|
| 2 | 81.6 | 53.8 | 48.2 |
| 4 | 84.6 | 73.6 | 69.3 |
| 6 | 87.4 | 78.5 | 73.9 |
| 8 | 88.3 | 80.1 | 76.8 |
| 10 | 90.6 | 83.7 | 79.8 |
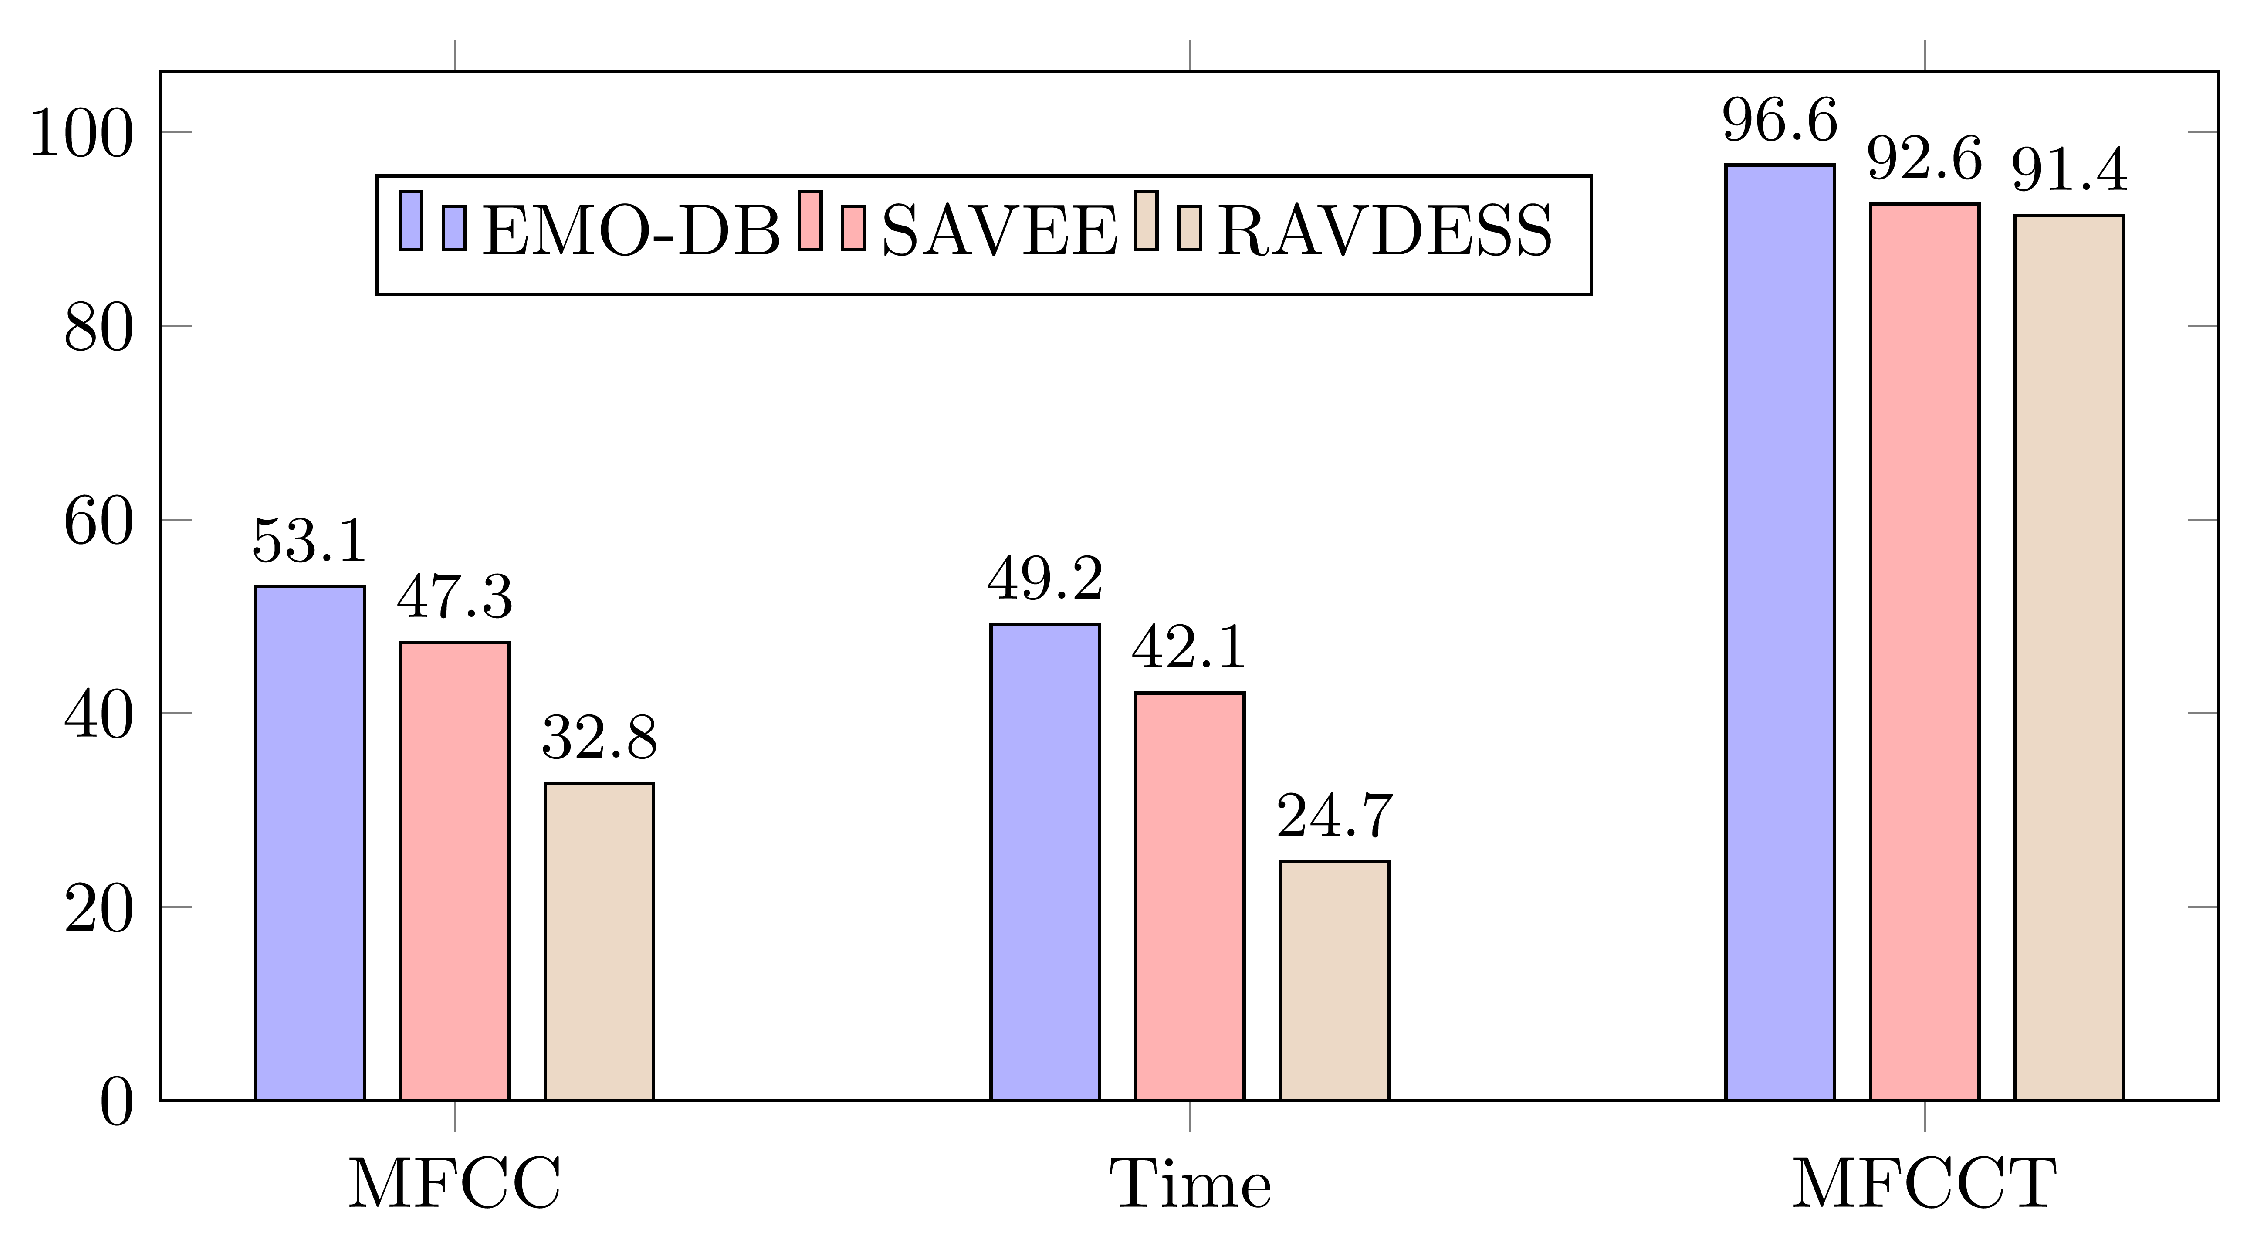
| 12 | 96.6% | 92.6% | 91.4% |
| Study | Datasets | Accuracy (×100%) of Individual Emotion | |||||||||
|---|---|---|---|---|---|---|---|---|---|---|---|
| A | B | C | D | F | H | N | S | U | Avg | ||
| [20] | EMO-DB | 1.00 | 0.61 | × | 0.67 | 0.67 | 1.00 | 1.00 | 0.87 | × | 0.86 |
| RAVDESS | 0.92 | × | 0.57 | 0.72 | 0.76 | 0.68 | 0.75 | 0.52 | 0.80 | 0.71 | |
| [41] | EMO-DB | 0.92 | 0.88 | × | 0.99 | 0.92 | 0.92 | 0.90 | 0.93 | × | 0.90 |
| RAVDESS | 0.80 | × | 0.90 | 0.71 | 0.74 | 0.65 | 0.68 | 0.66 | 0.67 | 0.73 | |
| SAVEE | 0.90 | × | × | 0.48 | 0.50 | 0.47 | 0.82 | 0.58 | 0.53 | 0.67 | |
| [19] | EMO-DB | 0.88 | 0.95 | × | 0.84 | 0.95 | 0.84 | 0.95 | 0.95 | × | 0.93 |
| [1] | EMO-DB | 0.88 | 0.95 | × | 0.84 | 0.95 | 0.84 | 0.95 | 0.95 | × | 0.93 |
| [21] | EMO-DB | 0.91 | 0.90 | × | 0.87 | 0.92 | 0.66 | 0.85 | 0.88 | × | 0.85 |
| RAVDESS | 0.95 | × | 0.95 | 0.86 | 0.91 | 0.43 | 0.50 | 0.61 | 0.95 | 0.77 | |
| Proposed model | EMO-DB | 0.96 | 0.91 | × | 0.96 | 0.99 | 1.00 | 0.97 | 0.99 | × | 0.97 |
| SAVEE | 0.94 | × | × | 0.90 | 0.91 | 0.95 | 0.95 | 0.94 | 0.93 | 0.93 | |
| RAVDESS | 0.95 | × | 0.93 | 0.92 | 0.94 | 0.95 | 0.89 | 0.91 | 0.93 | 0.92 | |
Disclaimer/Publisher’s Note: The statements, opinions and data contained in all publications are solely those of the individual author(s) and contributor(s) and not of MDPI and/or the editor(s). MDPI and/or the editor(s) disclaim responsibility for any injury to people or property resulting from any ideas, methods, instructions or products referred to in the content. |
© 2023 by the authors. Licensee MDPI, Basel, Switzerland. This article is an open access article distributed under the terms and conditions of the Creative Commons Attribution (CC BY) license (https://creativecommons.org/licenses/by/4.0/).
Share and Cite
Alluhaidan, A.S.; Saidani, O.; Jahangir, R.; Nauman, M.A.; Neffati, O.S. Speech Emotion Recognition through Hybrid Features and Convolutional Neural Network. Appl. Sci. 2023, 13, 4750. https://doi.org/10.3390/app13084750
Alluhaidan AS, Saidani O, Jahangir R, Nauman MA, Neffati OS. Speech Emotion Recognition through Hybrid Features and Convolutional Neural Network. Applied Sciences. 2023; 13(8):4750. https://doi.org/10.3390/app13084750
Chicago/Turabian StyleAlluhaidan, Ala Saleh, Oumaima Saidani, Rashid Jahangir, Muhammad Asif Nauman, and Omnia Saidani Neffati. 2023. "Speech Emotion Recognition through Hybrid Features and Convolutional Neural Network" Applied Sciences 13, no. 8: 4750. https://doi.org/10.3390/app13084750