
Understanding Seasonal Indoor Radon Variability from Data Collected with a LoRa-Enabled IoT Edge Device


Abstract
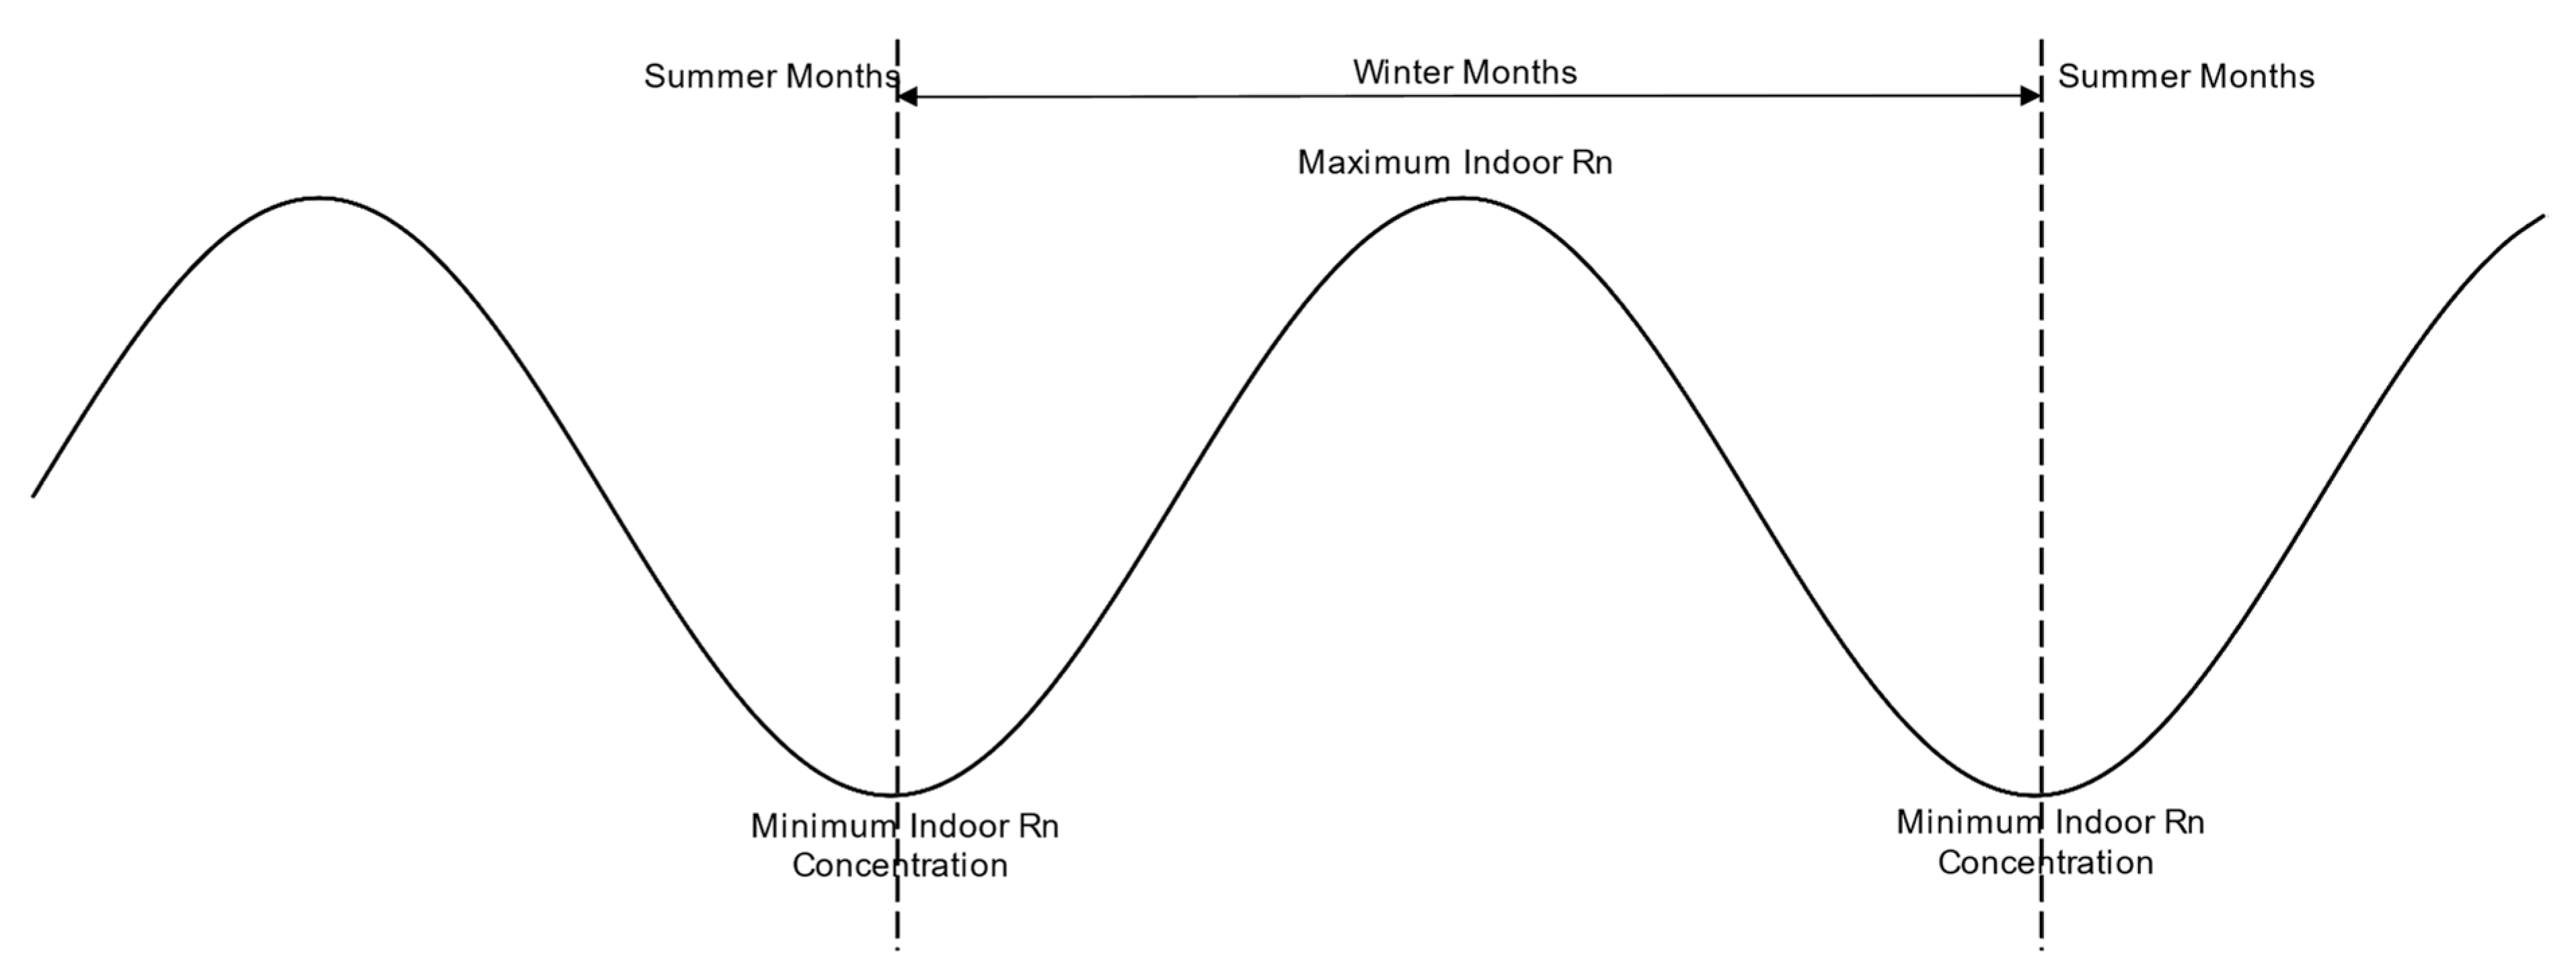
:1. Introduction
2. Literature Review
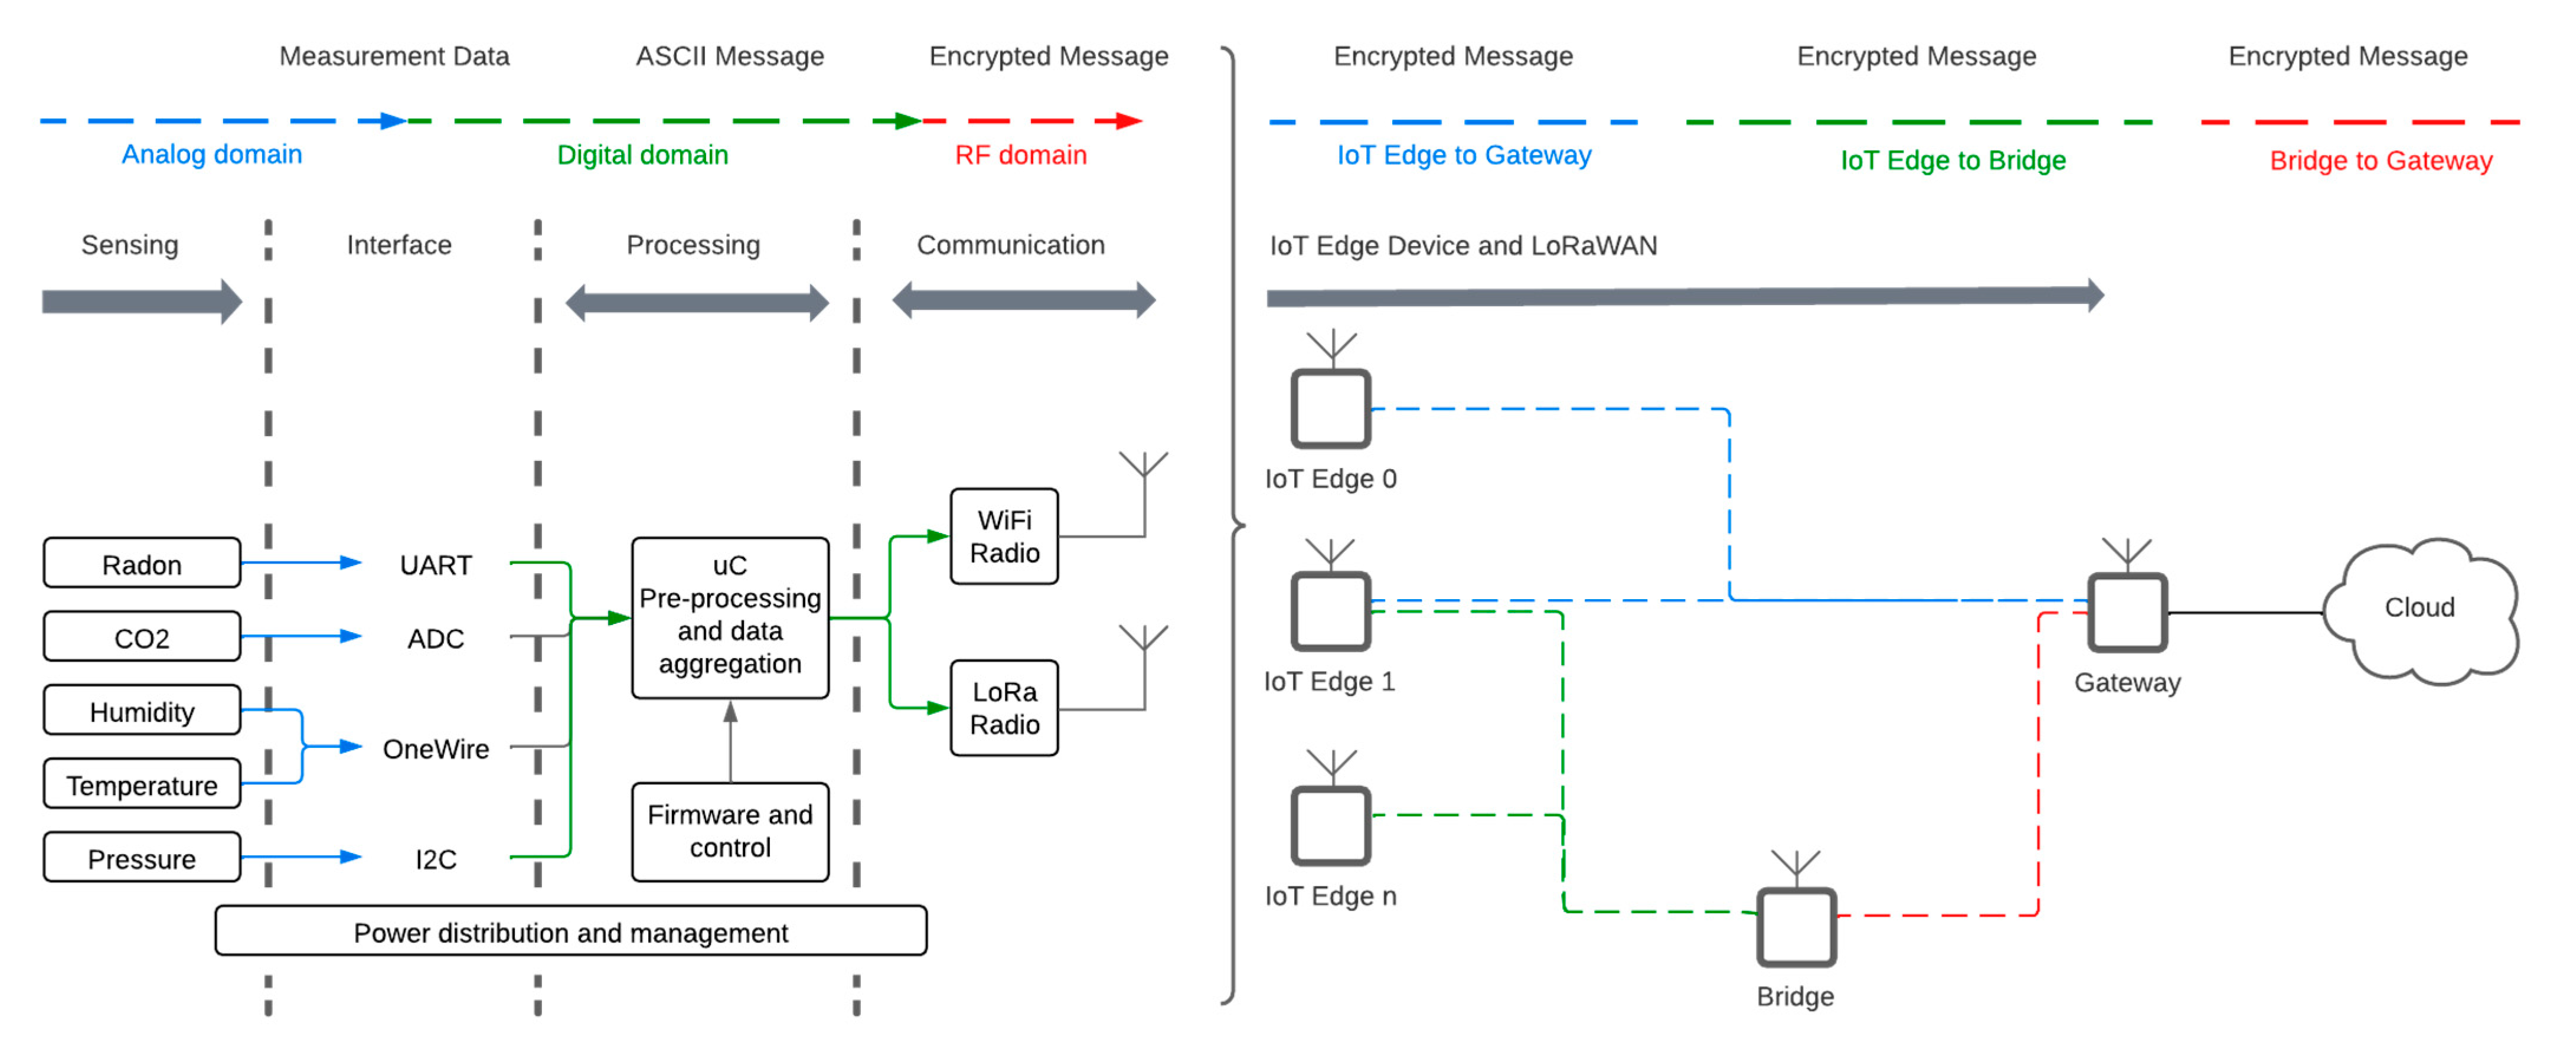
3. Materials and Methods
3.1. Location and Framework of the Study Area
3.2. Indoor Rn Concentration Assessment
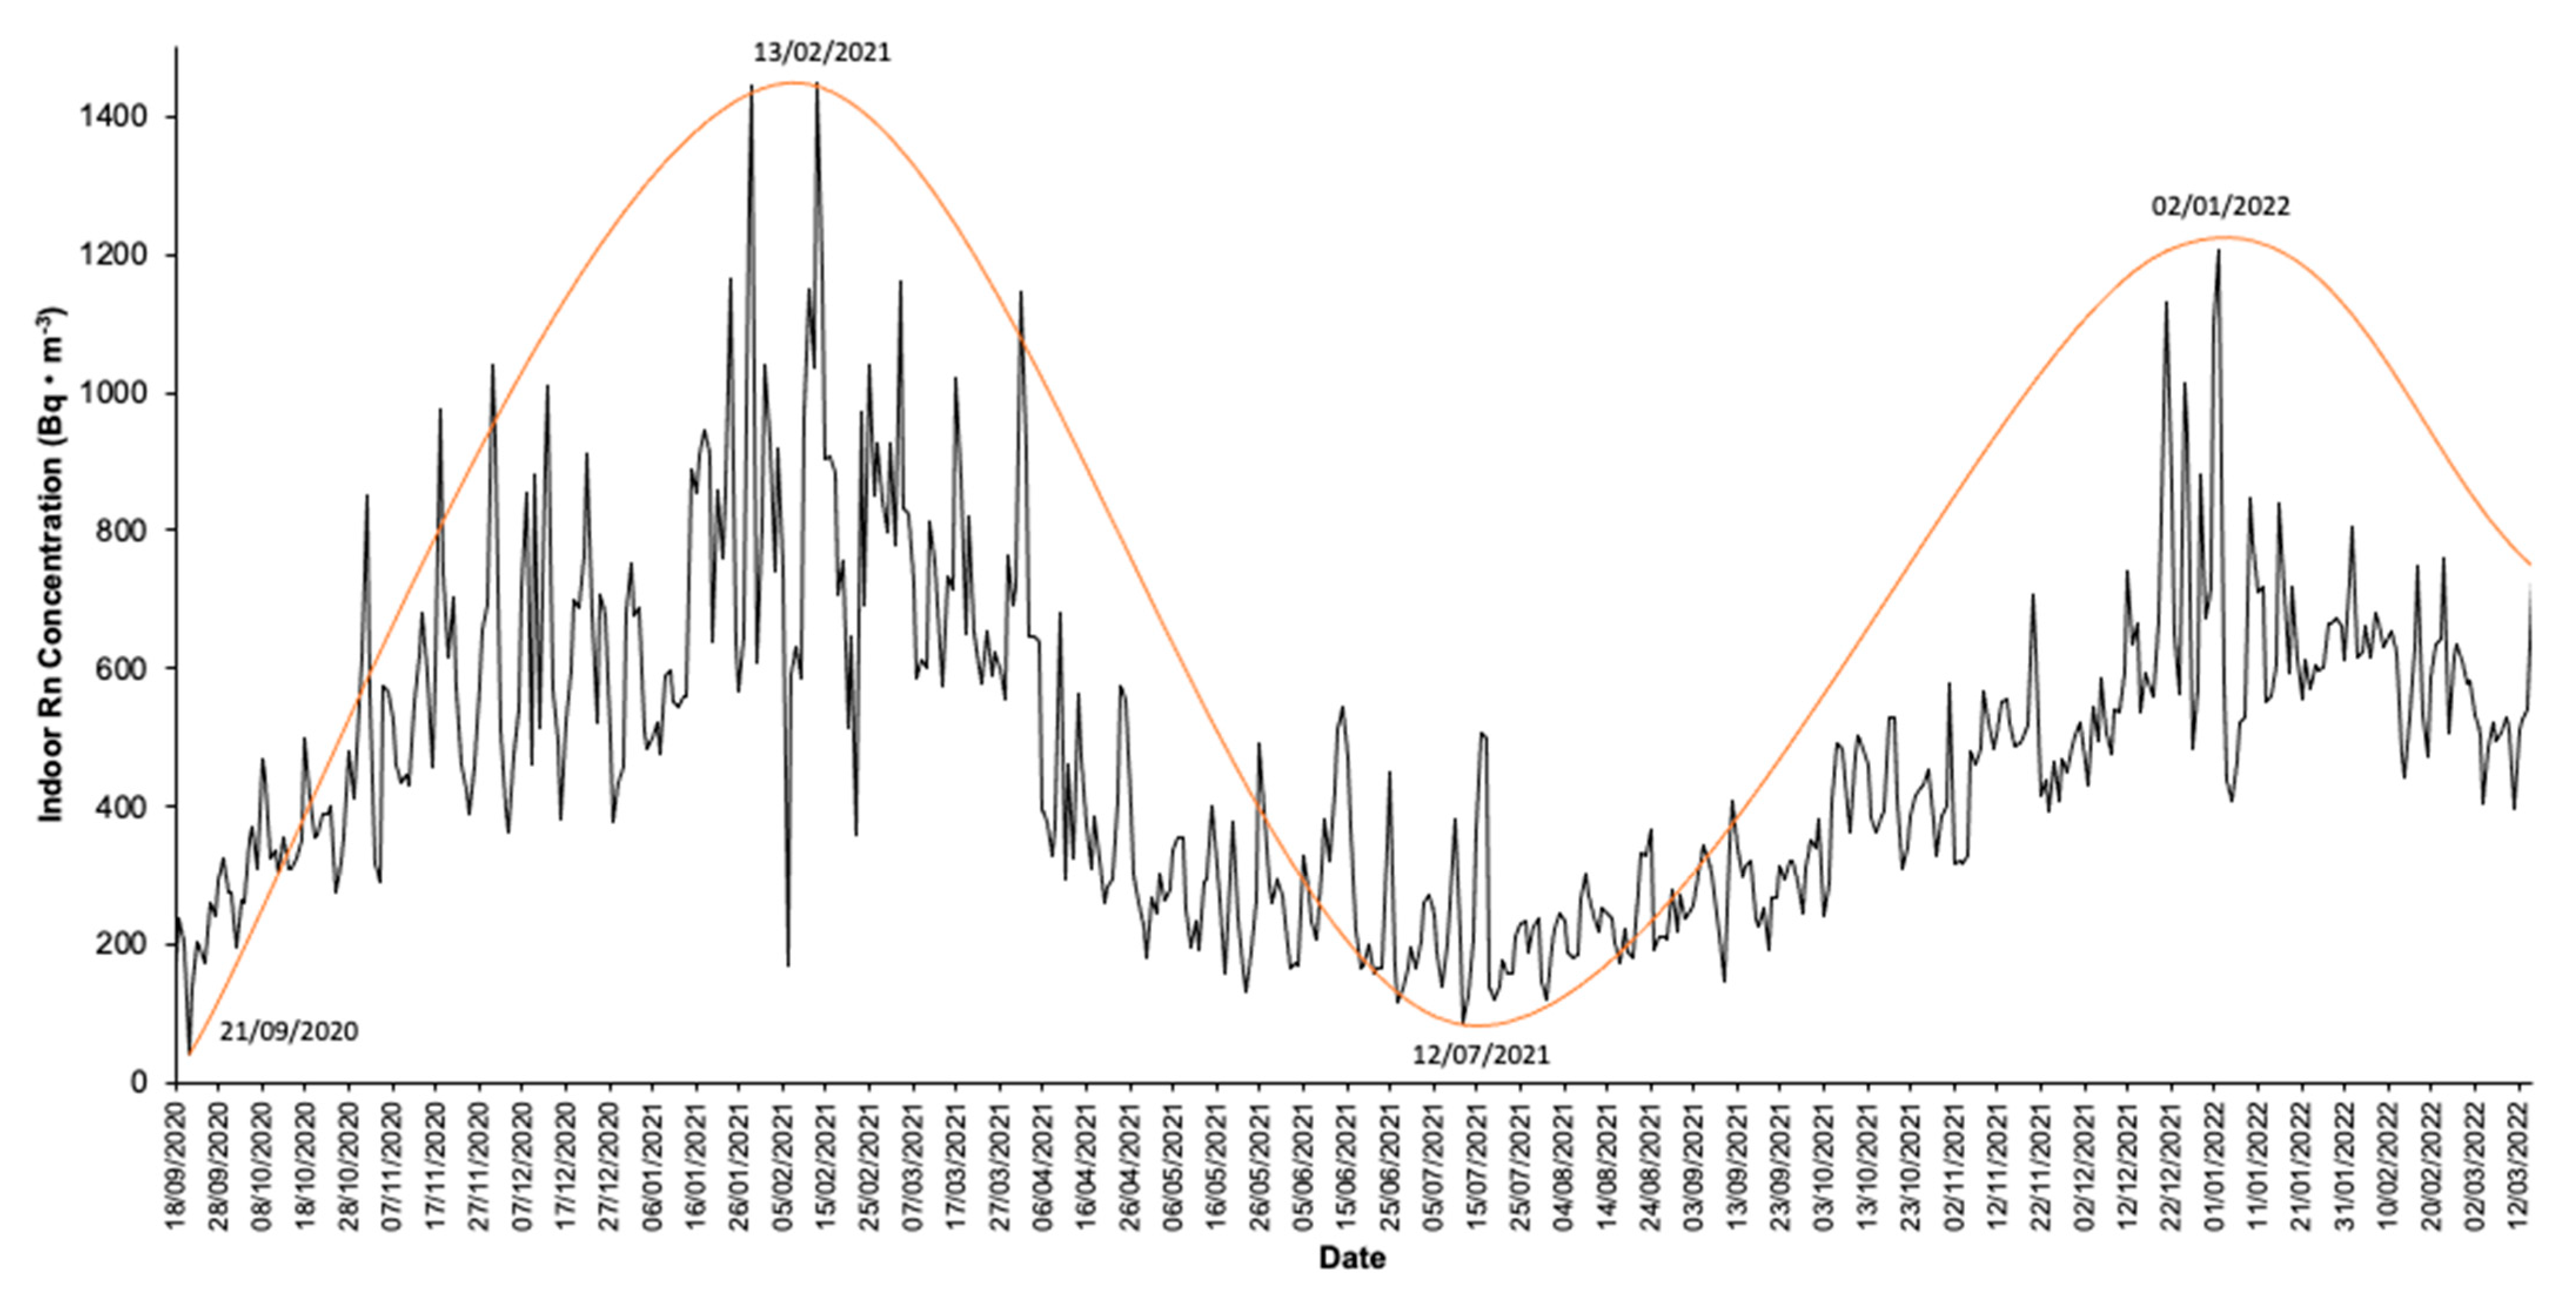
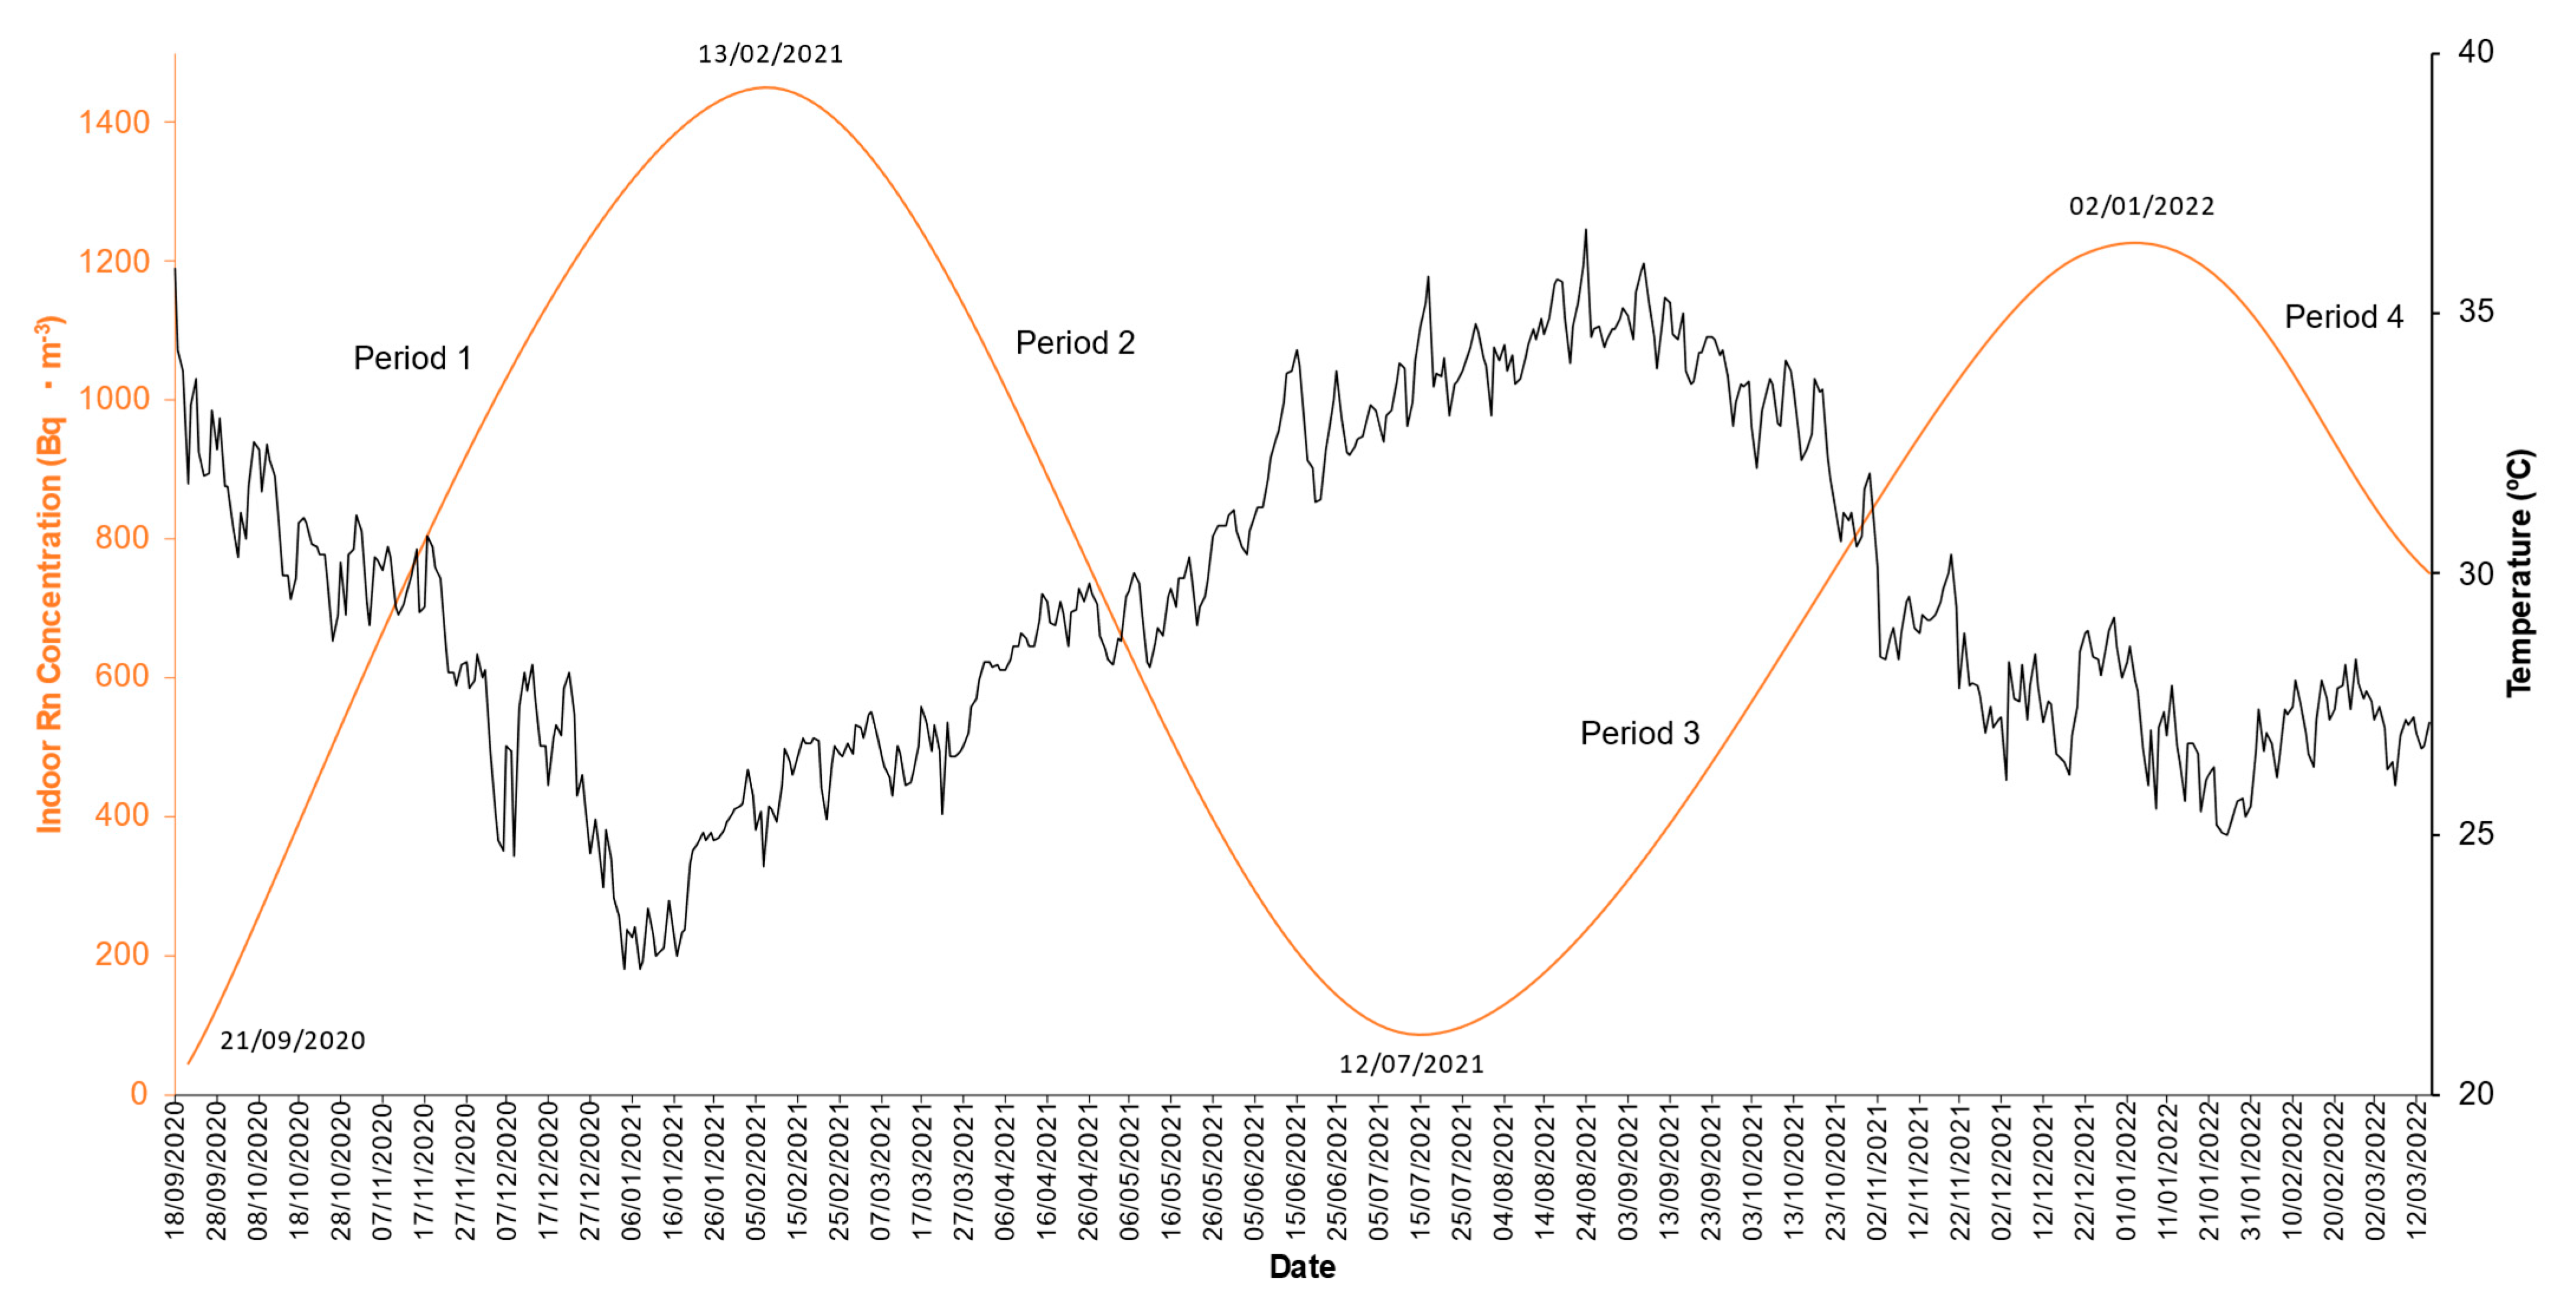
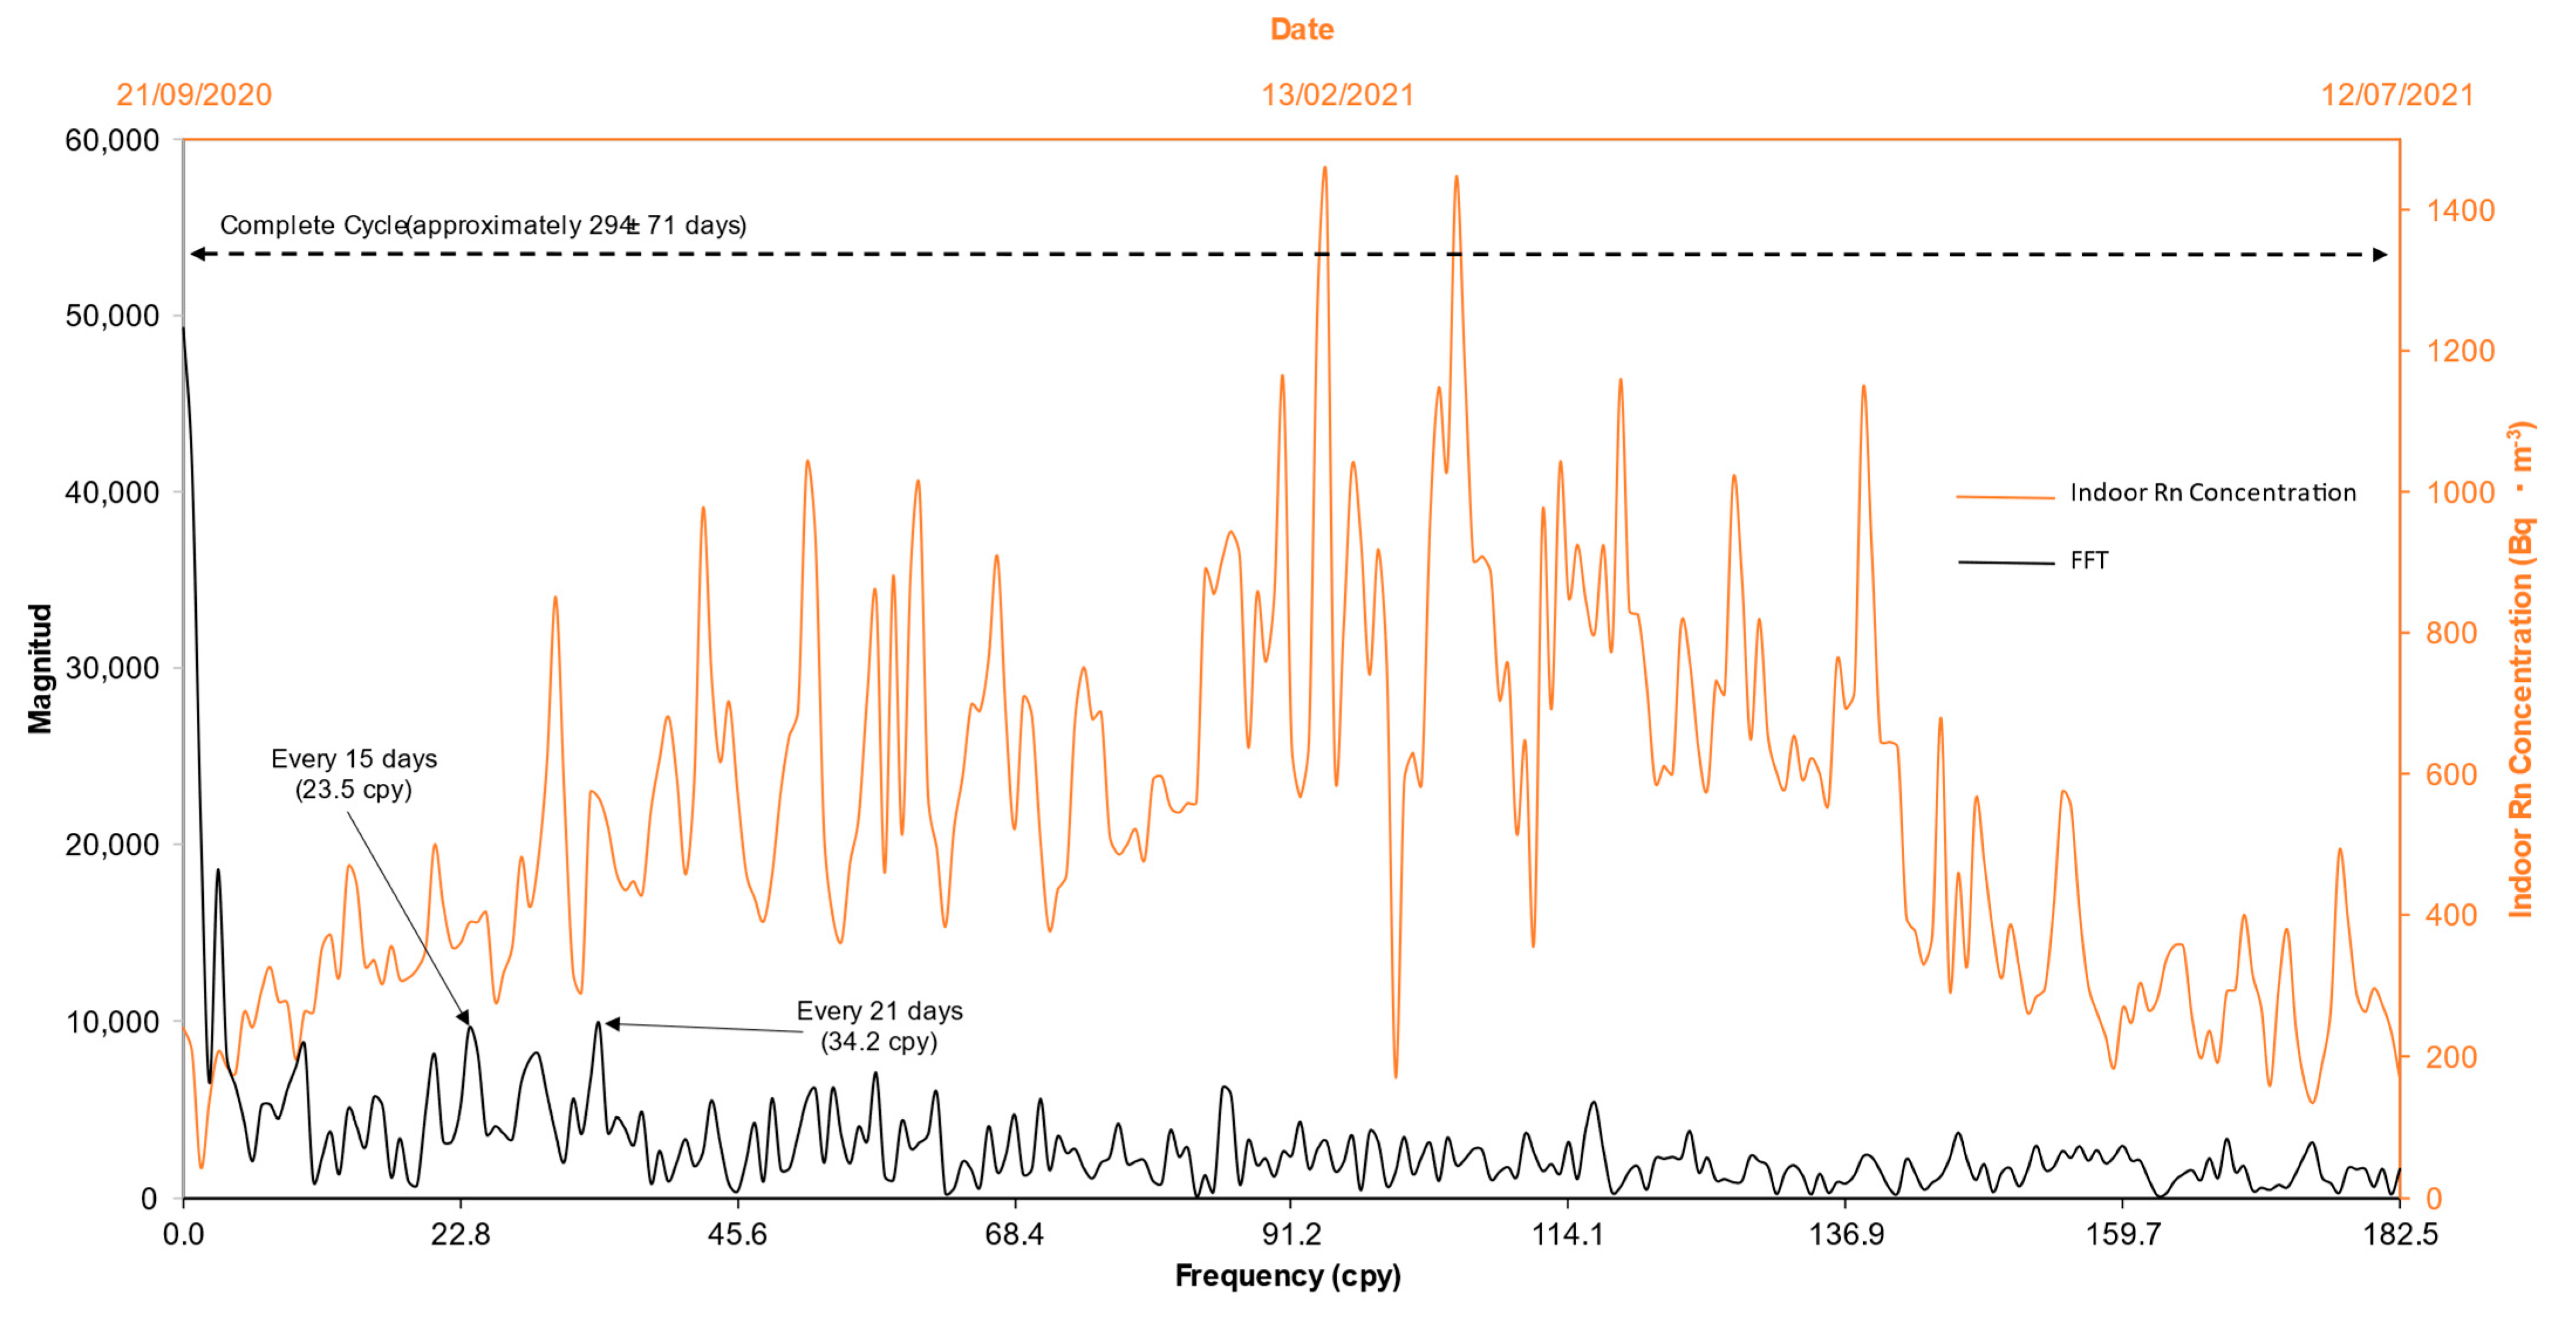
4. Results and Discussion
5. Conclusions
Author Contributions
Funding
Institutional Review Board Statement
Informed Consent Statement
Data Availability Statement
Acknowledgments
Conflicts of Interest
References
- Skeppström, K.; Olofsson, B. Uranium and radon in groundwater. Eur. Water 2007, 17, 51–62. [Google Scholar]
- Verma, D.; Khan, M.S. Assessement of indoor radon, thoron and their progeny in dwellings of bareilly city of northern india using track etch detectors. Rom. J. Phys. 2014, 59, 172–182. [Google Scholar]
- Birchall, A.; James, A. Uncertainty analysis of the effective dose per unit exposure from radon progeny and implications for ICRP risk-weighting factors. Radiat. Prot. Dosim. 1994, 53, 133–140. [Google Scholar] [CrossRef]
- Hansen, M.; Moss, G. Assessing the deposition of radon progeny from a uranium glass necklace. Radiat. Prot. Dosim. 2015, 164, 591–594. [Google Scholar] [CrossRef]
- Martell, E. alpha-Radiation dose at bronchial bifurcations of smokers from indoor exposure to radon progeny. Proc. Natl. Acad. Sci. USA 1983, 80, 1285–1289. [Google Scholar] [CrossRef] [Green Version]
- Cheng, Y.-S.; Chen, T.-R.; Wasiolek, P.T.; Van Engen, A. Radon and radon progeny in the Carlsbad Caverns. Aerosol Sci. Technol. 1997, 26, 74–92. [Google Scholar] [CrossRef]
- Mc Laughlin, J. An historical overview of radon and its progeny: Applications and health effects. Radiat. Prot. Dosim. 2012, 152, 2–8. [Google Scholar] [CrossRef]
- World Health Organization. WHO Handbook on Indoor Radon: A Public Health Perspective; World Health Organization: Geneva, Switzerland, 2009. [Google Scholar]
- Lantz, P.M.; Mendez, D.; Philbert, M.A. Radon, smoking, and lung cancer: The need to refocus radon control policy. Am. J. Public Health 2013, 103, 443–447. [Google Scholar] [CrossRef]
- Pershagen, G.; Akerblom, G.; Axelson, O.; Clavensjo, B.; Damber, L.; Desai, G.; Enflo, A.; Lagarde, F.; Mellander, H.; Svartengren, M. Residential radon exposure and lung cancer in Sweden. N. Engl. J. Med. 1994, 330, 159–164. [Google Scholar] [CrossRef]
- Vogeltanz-Holm, N.; Schwartz, G.G. Radon and lung cancer: What does the public really know? J. Environ. Radioact. 2018, 192, 26–31. [Google Scholar] [CrossRef]
- Varley, N.; Flowers, A. The influence of geology on radon levels in SW England. Radiat. Prot. Dosim. 1998, 77, 171–176. [Google Scholar] [CrossRef]
- Asher-Bolinder, S.; Owen, D.E.; Schumann, R.R. A preliminary evaluation of environmental factors influencing day-to-day and seasonal soil-gas radon concentrations. In Field Studies of Radon in Rocks, Soils and Water; CRC Press: Boca Raton, FL, USA, 1991; Volume 1971, pp. 23–31. [Google Scholar]
- Ball, T.; Cameron, D.; Colman, T.; Roberts, P. Behaviour of radon in the geological environment: A review. Q. J. Eng. Geol. Hydrogeol. 1991, 24, 169–182. [Google Scholar] [CrossRef]
- Bossew, P.; Lettner, H. Investigations on indoor radon in Austria, Part 1: Seasonality of indoor radon concentration. J. Environ. Radioact. 2007, 98, 329–345. [Google Scholar] [CrossRef]
- Tchorz-Trzeciakiewicz, D.; Kłos, M. Factors affecting atmospheric radon concentration, human health. Sci. Total Environ. 2017, 584, 911–920. [Google Scholar] [CrossRef]
- Darby, S. Residential radon, smoking and lung cancer. Radiat. Res. 2005, 163, 696. [Google Scholar]
- Pacheco-Torgal, F. Indoor radon: An overview on a perennial problem. Build. Environ. 2012, 58, 270–277. [Google Scholar] [CrossRef] [Green Version]
- Chao, C.Y.; Tung, T.C.; Burnett, J. Influence of ventilation on indoor radon level. Build. Environ. 1997, 32, 527–534. [Google Scholar] [CrossRef]
- Akbari, K.; Oman, R. Impacts of heat recovery ventilators on energy savings and indoor radon in a Swedish detached house. WSEAS Trans. Environ. Dev. 2013, 9, 24–34. [Google Scholar]
- Burghele, B.; Botoș, M.; Beldean-Galea, S.; Cucoș, A.; Catalina, T.; Dicu, T.; Dobrei, G.; Florică, Ș.; Istrate, A.; Lupulescu, A. Comprehensive survey on radon mitigation and indoor air quality in energy efficient buildings from Romania. Sci. Total Environ. 2021, 751, 141858. [Google Scholar] [CrossRef]
- Saini, J.; Dutta, M.; Marques, G. Internet of Things for Indoor Air Quality Monitoring; Springer: Berlin/Heidelberg, Germany, 2021. [Google Scholar]
- Lopes, S.I.; Bogers, S.; Moreira, P.M.; Curado, A. A visual analytics approach for effective radon risk perception in the IoT era. In Proceedings of the Science and Technologies for Smart Cities: 5th EAI International Summit, SmartCity360, Braga, Portugal, 4–6 December 2019; pp. 90–101. [Google Scholar]
- Lopes, S.I.; Nunes, L.J.; Curado, A. Designing an Indoor Radon Risk Exposure Indicator (IRREI): An Evaluation Tool for Risk Management and Communication in the IoT Age. Int. J. Environ. Res. Public Health 2021, 18, 7907. [Google Scholar] [CrossRef]
- Syafrudin, M.; Alfian, G.; Fitriyani, N.L.; Rhee, J. Performance analysis of IoT-based sensor, big data processing, and machine learning model for real-time monitoring system in automotive manufacturing. Sensors 2018, 18, 2946. [Google Scholar] [CrossRef] [PubMed] [Green Version]
- Park, J.; Kim, K.; Cho, Y.K. Framework of automated construction-safety monitoring using cloud-enabled BIM and BLE mobile tracking sensors. J. Constr. Eng. Manag. 2017, 143, 05016019. [Google Scholar] [CrossRef]
- Nastro, V.; Carnì, D.; Vitale, A.; Lamonaca, F.; Vasile, M. Passive and active methods for Radon pollution measurements in historical heritage buildings. Measurement 2018, 114, 526–533. [Google Scholar] [CrossRef]
- Azevedo, R.; Silva, J.P.; Lopes, N.; Curado, A.; Nunes, L.J.; Lopes, S.I. Designing an IoT-enabled Data Warehouse for Indoor Radon Time Series Analytics. In Proceedings of the 2022 17th Iberian Conference on Information Systems and Technologies (CISTI), Madrid, Spain, 22–25 June 2022; pp. 1–6. [Google Scholar]
- Blanco-Novoa, O.; Fernández-Caramés, T.M.; Fraga-Lamas, P.; Castedo, L. A cost-effective IoT system for monitoring indoor radon gas concentration. Sensors 2018, 18, 2198. [Google Scholar] [CrossRef] [Green Version]
- Pereira, F.; Lopes, S.I.; Carvalho, N.B.; Curado, A. RnProbe: A LoRa-enabled IoT edge device for integrated radon risk management. IEEE Access 2020, 8, 203488–203502. [Google Scholar] [CrossRef]
- Alvarellos, A.; Gestal, M.; Dorado, J.; Rabuñal, J.R. Developing a secure low-cost radon monitoring system. Sensors 2020, 20, 752. [Google Scholar] [CrossRef] [Green Version]
- Alvarellos, A.; Chao, A.L.; Rabuñal, J.R.; García-Vidaurrázaga, M.D.; Pazos, A. Development of an automatic low-cost air quality control system: A radon application. Appl. Sci. 2021, 11, 2169. [Google Scholar] [CrossRef]
- Terray, L.; Royer, L.; Sarramia, D.; Achard, C.; Bourdeau, E.; Chardon, P.; Claude, A.; Fuchet, J.; Gauthier, P.-J.; Grimbichler, D. From sensor to cloud: An IoT network of radon outdoor probes to monitor active volcanoes. Sensors 2020, 20, 2755. [Google Scholar] [CrossRef]
- Amato, A.; Scarcelli, A.; Rizzi, M.; Di Gioia, M.; Marzocca, C.; Dario, R.; Di Lecce, V. A New Cyber Physical System for Gas Radon Monitoring and Controlling. In Proceedings of the 2020 IEEE International Symposium on Medical Measurements and Applications (MeMeA), Bari, Italy, 1 June–1 July 2020; pp. 1–6. [Google Scholar]
- Medina-Pérez, A.; Sánchez-Rodríguez, D.; Alonso-González, I. An Internet of Thing architecture based on message queuing telemetry transport protocol and node-RED: A case study for monitoring radon gas. Smart Cities 2021, 4, 803–818. [Google Scholar] [CrossRef]
- Daissaoui, A.; Boulmakoul, A.; Karim, L.; Lbath, A. IoT and big data analytics for smart buildings: A survey. Procedia Comput. Sci. 2020, 170, 161–168. [Google Scholar] [CrossRef]
- Zhang, W.; Wu, Y.; Calautit, J.K. A review on occupancy prediction through machine learning for enhancing energy efficiency, air quality and thermal comfort in the built environment. Renew. Sustain. Energy Rev. 2022, 167, 112704. [Google Scholar] [CrossRef]
- Krivetskiy, V.V.; Andreev, M.D.; Efitorov, A.O.; Gaskov, A.M. Statistical shape analysis pre-processing of temperature modulated metal oxide gas sensor response for machine learning improved selectivity of gases detection in real atmospheric conditions. Sensors Actuators B Chem. 2021, 329, 129187. [Google Scholar] [CrossRef]
- Okwuibe, J.; Haavisto, J.; Kovacevic, I.; Harjula, E.; Ahmad, I.; Islam, J.; Ylianttila, M. Sdn-enabled resource orchestration for industrial iot in collaborative edge-cloud networks. IEEE Access 2021, 9, 115839–115854. [Google Scholar] [CrossRef]
- Zhu, Y.; Al-Ahmed, S.A.; Shakir, M.Z.; Olszewska, J.I. LSTM-Based IoT-Enabled CO2 Steady-State Forecasting for Indoor Air Quality Monitoring. Electronics 2022, 12, 107. [Google Scholar] [CrossRef]
- Jia, M.; Komeily, A.; Wang, Y.; Srinivasan, R.S. Adopting Internet of Things for the development of smart buildings: A review of enabling technologies and applications. Autom. Constr. 2019, 101, 111–126. [Google Scholar] [CrossRef]
- Akkari, N.; Dimitriou, N. Mobility management solutions for 5G networks: Architecture and services. Comput. Netw. 2020, 169, 107082. [Google Scholar] [CrossRef]
- Hussain, F.; Hussain, R.; Hassan, S.A.; Hossain, E. Machine learning in IoT security: Current solutions and future challenges. IEEE Commun. Surveys Tutor. 2020, 22, 1686–1721. [Google Scholar] [CrossRef] [Green Version]
- Fadel, E.; Gungor, V.C.; Nassef, L.; Akkari, N.; Malik, M.A.; Almasri, S.; Akyildiz, I.F. A survey on wireless sensor networks for smart grid. Comput. Commun. 2015, 71, 22–33. [Google Scholar] [CrossRef]
- Curado, A.; Silva, J.; Carvalho, L.; Lopes, S.I. Indoor Radon concentration assessment in a set of single family houses: Case study held in Barcelos, North of Portugal. Energy Procedia 2017, 136, 109–114. [Google Scholar] [CrossRef]
- Azeredo, P.; Curralo, A.; Curado, A.; Lopes, S.I. A Methodological Design Approach for Health Education: Indoor Radon Exposure Case Study. In Proceedings of the Advances in Design and Digital Communication II: Proceedings of the 5th International Conference on Design and Digital Communication, Digicom 2021, Barcelos, Portugal, 4–6 November 2021; pp. 541–551. [Google Scholar]
- Curado, A.; Lopes, S.I.; Antão, A.M.M.C. On the relation of geology, natural ventilation and indoor radon concentration: The northern Portugal case study. Comun. Geol. 2021, 107, 31–41. [Google Scholar]
- Alvear-Puertas, V.E.; Burbano-Prado, Y.A.; Rosero-Montalvo, P.D.; Tözün, P.; Marcillo, F.; Hernandez, W. Smart and Portable Air-Quality Monitoring IoT Low-Cost Devices in Ibarra City, Ecuador. Sensors 2022, 22, 7015. [Google Scholar] [CrossRef] [PubMed]
- Fioccola, G.B.; Sommese, R.; Tufano, I.; Canonico, R.; Ventre, G. Polluino: An efficient cloud-based management of IoT devices for air quality monitoring. In Proceedings of the 2016 IEEE 2nd International Forum on Research and Technologies for Society and Industry Leveraging a better tomorrow (RTSI), Bologna, Italy, 7–9 September 2016; pp. 1–6. [Google Scholar]
- Jo, J.; Jo, B.; Kim, J.; Kim, S.; Han, W. Development of an IoT-based indoor air quality monitoring platform. J. Sensors 2020, 2020, 1–14. [Google Scholar] [CrossRef]
- Kumar, S.; Jasuja, A. Air quality monitoring system based on IoT using Raspberry Pi. In Proceedings of the 2017 International conference on computing, communication and automation (ICCCA), Greater Noida, India, 5–6 May 2017; pp. 1341–1346. [Google Scholar]
- De Vito, S.; Di Francia, G.; Esposito, E.; Ferlito, S.; Formisano, F.; Massera, E. Adaptive machine learning strategies for network calibration of IoT smart air quality monitoring devices. Pattern Recognit. Lett. 2020, 136, 264–271. [Google Scholar] [CrossRef]
- Moursi, A.S.; El-Fishawy, N.; Djahel, S.; Shouman, M.A. An IoT enabled system for enhanced air quality monitoring and prediction on the edge. Complex Intell. Syst. 2021, 7, 2923–2947. [Google Scholar] [CrossRef]
- Tapashetti, A.; Vegiraju, D.; Ogunfunmi, T. IoT-enabled air quality monitoring device: A low cost smart health solution. In Proceedings of the 2016 IEEE Global Humanitarian Technology Conference (GHTC), Seattle, WA, USA, 13–16 October 2016; pp. 682–685. [Google Scholar]
- Baltrėnas, P.; Grubliauskas, R.; Danila, V. Seasonal variation of indoor radon concentration levels in different premises of a university building. Sustainability 2020, 12, 6174. [Google Scholar] [CrossRef]
- Porstendorfer, J. Behaviour of radon daughter products in indoor air. Radiat. Prot. Dosim. 1984, 7, 107–113. [Google Scholar] [CrossRef]
- Akbari, K.; Mahmoudi, J.; Ghanbari, M. Influence of indoor air conditions on radon concentration in a detached house. J. Environ. Radioact. 2013, 116, 166–173. [Google Scholar] [CrossRef]


| Time Interval | Positive Increments (n) | Minimum Registered Value (Bq·m−3·h−1) | Maximum Registered Value (Bq·m−3·h−1) | Average (Bq·m−3·h−1) |
|---|---|---|---|---|
| 1 | 78 | 0.1 | 26.1 | 5.41 |
| 2 | 73 | 0.1 | 25.5 | 3.95 |
| 3 | 92 | 0.2 | 18.7 | 2.82 |
| 4 | 30 | 0.1 | 13.2 | 1.86 |
| Total | 273 | 3.9 |
Disclaimer/Publisher’s Note: The statements, opinions and data contained in all publications are solely those of the individual author(s) and contributor(s) and not of MDPI and/or the editor(s). MDPI and/or the editor(s) disclaim responsibility for any injury to people or property resulting from any ideas, methods, instructions or products referred to in the content. |
© 2023 by the authors. Licensee MDPI, Basel, Switzerland. This article is an open access article distributed under the terms and conditions of the Creative Commons Attribution (CC BY) license (https://creativecommons.org/licenses/by/4.0/).
Share and Cite
Nunes, L.J.R.; Curado, A.; Lopes, S.I. Understanding Seasonal Indoor Radon Variability from Data Collected with a LoRa-Enabled IoT Edge Device. Appl. Sci. 2023, 13, 4735. https://doi.org/10.3390/app13084735
Nunes LJR, Curado A, Lopes SI. Understanding Seasonal Indoor Radon Variability from Data Collected with a LoRa-Enabled IoT Edge Device. Applied Sciences. 2023; 13(8):4735. https://doi.org/10.3390/app13084735
Chicago/Turabian StyleNunes, Leonel J. R., António Curado, and Sérgio Ivan Lopes. 2023. "Understanding Seasonal Indoor Radon Variability from Data Collected with a LoRa-Enabled IoT Edge Device" Applied Sciences 13, no. 8: 4735. https://doi.org/10.3390/app13084735