1. Introduction
The operation of technically complex objects, encompassing a broad range of facilities, poses numerous challenges and obstacles. One of the most pressing concerns for engineers, operators, and users alike is maintaining an acceptable level of reliability, particularly regarding availability and readiness. This issue can cause significant anxiety and stress among those involved in the management and operation of such facilities. The life cycle phase of a technical object, the so-called operations, occupies up to 95% of the life of any piece of equipment. This is particularly important for any owner or user in terms of achieving their objectives. Consequently, many theories have been put forward about the causes of failures or damage, the maintenance system, maintenance or increasing the level of reliability. Therefore, it is necessary to pay attention to universal methods that can be used in many fields, such as, among others, the method of mixed nonlinear programming. This method takes into account the error or uncertainty in predictions and allows the creation of the most cost-effective multi-state model [
1]. The problem of fault estimation of subsystems subjected to external disturbances is also presented in another paper, whose authors proposed a new fault estimation law. This law is based on weighted variable iterations to quickly track fault signals and weaken the effects of disturbances [
2]. Discussing the algorithms used for failure prediction, one should also not forget the data quality control algorithm [
3] and a probabilistic neural network classification model optimized by the improved particle swarm algorithm [
4].
Technical facilities are used in every sphere of daily life, but not every user implements appropriate procedures to ensure proper operation. Maintenance or ensuring proper operational concerns in particular sectors is critical, such as those concerning product maintenance or securing the operation of transport and logistics processes.
Depending on the particular industry sector, there exist various methodologies to ensure the proper functioning of technical facilities, which are collectively referred to as maintenance.
In the industrial manufacturing sector, different maintenance strategies can be distinguished, such as:
In manufacturing companies, a very strong emphasis is placed on the profitability of production, which results in the adoption of a maintenance model and the organization of the company. Attempts are made to optimize maintenance processes to achieve these goals. As a result of developments in science and technology, methods have been developed such as:
Total productive maintenance (TPM), a method for ensuring maximum production efficiency [
7];
Reliability-centered maintenance (RCM), maintenance oriented to functional reliability, i.e., the facility continues to perform its assigned operational functions despite minor failures [
8];
Failure mode and effects analysis (FMEA), analysis of the types and effects of possible failures. This method aims to prevent the effects of defects that may occur in the design phase and the manufacturing phase. Defects are very often identified in the operating process and corrected in the design and manufacturing phases [
9].
In transport and, in particular, aviation, the following operating strategies can be distinguished [
10]. A life-based strategy consists of regular maintenance activities carried out at predetermined time intervals, regardless of the equipment’s technical condition, to prevent future issues and extend its lifespan. A condition-based strategy, however, involves maintenance activities being performed only when the equipment’s actual condition requires it, based on knowledge of the technical condition of the equipment and plant components.
Similarly, a reliability-based strategy involves making operational decisions based on the results of periodic reliability level checks and an analysis of acceptable reliability indicators to maintain the equipment’s reliability at an acceptable level. Finally, a mixed approach blends the mechanisms of the above operational strategies to achieve a balance between cost and performance objectives.
Each maintenance strategy comes with its own potential limitations and trade-offs [
11]. For example, reactive maintenance may result in equipment downtime and higher costs due to urgent repairs, while preventive maintenance may lead to unnecessary maintenance activities and costs if the equipment does not require it. Additionally, implementing advanced maintenance methods such as TPM and RCM may require significant investments in technology and training, according to Moore et al. [
12]. In the transport sector, the life-based strategy may result in excessive maintenance activities if the equipment remains in good condition, while the condition-based strategy may risk equipment failures if monitoring is insufficient. Therefore, companies must carefully evaluate their maintenance needs and choose the most suitable strategy that balances their goals with potential limitations and trade-offs.
Overall, these operational strategies play an essential role in ensuring safe and efficient transportation, particularly in aviation. By choosing the appropriate operational strategy and combining it with proper maintenance practices, organizations can optimize their operations and minimize the risk of equipment failure, which can lead to significant financial losses and potentially catastrophic accidents.
Various indicators can be used to evaluate the operation process, particularly reliability, serviceability, or efficiency. Selected ones include [
13,
14]:
Mean time to failure (MTTF) is a reliability metric that estimates the average time that a system or a component will work correctly before failing. MTTF is often used for products with a limited lifespan, such as electronic devices or mechanical systems, to estimate how long they will last before requiring maintenance or replacement. MTTF is calculated by dividing the total time of operation by the number of failures during that time.
Mean time between failure (MTBF) is a measure of the reliability of a system or a component. MTBF is defined as the average time between two consecutive failures of a system or a component under normal operating conditions. MTBF is often used to estimate the maintenance and repair schedule for a system, as it helps to predict when the system is likely to fail. MTBF is calculated by dividing the total operating time by the number of failures.
Mean time to repair (MTTR) is a maintenance metric that measures the average time required to repair a system or a component after a failure occurs. MTTR is an important factor in determining the availability of a system, as it affects the downtime of the system. A lower MTTR indicates a quicker repair process and faster system recovery. MTTR is calculated by dividing the total repair time by the number of repairs.
Overall equipment effectiveness (OEE) is a measure of the efficiency of a production system, typically used in manufacturing or other industries that use equipment. OEE measures the percentage of time that a machine or equipment is producing quality output during scheduled production time. OEE considers three factors: availability, performance, and quality. The equipment utilization rate is a component of OEE and measures the percentage of time that a machine or equipment is available for production during scheduled production time. The equipment utilization rate is calculated by dividing the total production time by the scheduled production time. OEE is a widely used general indicator in the manufacturing industry that represents three key performance factors: availability, utilization, and quality. Availability is the ratio of the time planned for the execution of a task to the time that can be spent on the task. Utilization is the ratio of available time to actual work. Quality is the ratio of good to defective products produced. Together, these factors provide a comprehensive view of a manufacturing process’s performance and can help identify areas for improvement.
Aviation also uses reliability metrics to assess the operational process [
15]. Dedicated computerized operating support systems are used for this purpose, where data from the operational process is collected and periodically analyzed. Data collection and analysis can be applied to any purpose and technical facility, provided that the data are reliable and comprehensive. In reliability assessment, particularly important are the data on failures and defects, with all the parameters of their occurrence (i.e., the time or resource of work that the equipment has worked), and a detailed description of the symptoms, causes, and the method of repair. In these data collection systems, the most valuable data are the information on the causes of downtime, as well as the method of restoring the equipment to serviceability.
Despite the adopted maintenance model or strategy, it must be remembered that the chosen maintenance system must be supplied with acceptable human, financial, and material resources to function properly and fulfill its goals. Referring to material resources, this requires a properly organized logistics system that will meet the needs of the related supply of spare and operating parts. The principles of warehousing and stock control from a warehouse management point of view have been described in many works [
16,
17,
18]. This area is also often analyzed from the perspective of the needs arising from the user as a customer of the warehouse resources. Newer and newer techniques and methods are being implemented in this area, where in-service data and reliability indicators, derived directly from operations, can be used successfully for its design.
The paper’s main contribution is the development of a method of logistic planning considering accidental damage to components, which could not be predicted at the stage of planning delivery of spare parts. If a reliability study identifies a specific spare part as susceptible to failure, the airline can proactively replace the part before it fails and causes a safety incident. Additionally, by conducting reliability studies on spare parts, failure patterns can be identified and maintenance schedules adjusted accordingly to reduce the likelihood of unexpected failures. Reliability studies can help identify which spares are critical to the safe operation of the aircraft and prioritize their maintenance accordingly [
19]. By analyzing data from reliability studies, maintainers responsible for the safe execution of flight operations can make informed decisions about which spares should be in their inventory to ensure that the right parts are available when they are needed, which can help reduce delays and ensure safe flight operations.
2. Basis for Planning the Logistical Support of the Operation Process
The intensity of the spare parts supply stream should fully satisfy the user’s demand for consumable materials while maintaining a safe quantity as a fixed stock as a safety buffer (non-rotating stock).
An example of a needs planning methodology in a manufacturing company is presented in work [
20] and mainly focuses on the issue of scheduling supplies necessary for the production process.
While planning the replenishment of material or technical resources, consideration should be given to, among other things [
14,
20,
21]:
the type and number of technical facilities;
the standards and limits of consumption, e.g., oil, lubricants, and fuel;
the intensity of using the technical facilities;
current stock levels;
experience from previous operations;
planned additional maintenance, modifications, and upgrades.
In the case of aviation, the planning of material and technical needs, e.g., spare parts and consumables, is carried out for each calendar year. The accurate planning of purchases makes it possible to avoid aircraft downtime associated with the search for parts at take-off. In planning purchases, four phases can be distinguished in establishing a complete list of needs:
Phase I—based on the planned number of flight hours per aircraft type in the planned calendar year, an “Airframe Plan” is prepared, in which the expected intensity of aircraft utilization is entered and broken down into individual quarters and months, as well as a “Schedule of Periodic Maintenance and Engine Replacements” [
22], in which all types of maintenance resulting from the “Air flight plan”, as well as from the time intervals (calendar) independent of the completed air flight. Based on information regarding the number and type of individual maintenance operations, it is possible to analyze the range of individual maintenance and the necessary consumables needed for each type of maintenance. A list of technical and material supplies (broken down by P/N—part number identification), e.g., washers, gaskets, pins, filters, etc., for a particular service can be called a logistics or maintenance package, which represents the minimum necessary list of materials to be consumed during a particular service. Depending on the level of service and its scope, the logistics packages will have a differentiated list of assortments.
In this stage of planning activities, the total number of assortments defined is determined by multiplying the number of services by the service packages [
23]. The result of this procedure gives us the total number of consumables required to secure the assumed list of planned maintenance [
23].
The next step (Phase II) in logistical planning is the analysis of components with a limited calendar or technical life (LLP—life-limited parts), and there is an obligation to replace them within the planning period. The list of such components is another set to the comprehensive set of needs in the logistics planning process.
The next phase (Phase III) is the identification of technical bulletins (SB—service bulletins), which must or can be performed by the forces of the own maintenance organization, e.g., modifications to aircraft equipment. The list of material and technical provisions for these activities is another set in determining the comprehensive logistics need. In determining this list, a methodology identical to Phase I is used.
All the activities described above (Phase I, II, and III) are activities resulting from the planning. Determining the material and technical provision is not a major problem, but it consumes a significant part of the man-hours of those involved in the planning process.
In the operational process, the so-called unplanned failures and breakdowns are very common and cannot be predicted.
At the Phase IV stage of planning, it is necessary to analyze the service life, identify the most frequent faults, determine their causes, and estimate the needs arising from the service life. A detailed breakdown and description of technical facility malfunctions is described in the work [
24].
Phase IV planning involves addressing two main questions: how to predict which components will fail and when, and how many and which components to purchase. However, aeronautical organizations that operate commercial aircraft often overlook Phase IV planning, as they have no problems with spare part availability, and delivery times do not significantly impact their operations. On the other hand, Phase IV is crucial for organizations that engage in long-term planning, are subject to procurement regulations, and operate a small fleet of aircraft where spare parts are produced on demand. In such cases, proper Phase IV planning is necessary to ensure efficient and uninterrupted operations.
In the above cases, where Phase IV is crucial, and the proper estimation of spare parts needs can minimize the loss of operations in the organization, answers to the previous questions can be sought by conducting a reliability analysis. The focus of such an analysis is to determine the frequency of occurrence of characteristic failures and the determination of appropriate reliability indices.
3. Methods
The planning of the logistical support of the operations process, in particular for Stage IV, i.e., the prediction of failures that could potentially occur during the planning year, is a complex process and often subject to a high risk of error. Many theories have been developed in failure-potential analysis, but they are most often associated with thorough mathematical knowledge and dedicated specialized software.
Using a simple factor to assess mean time to failure (MTTF) reliability will make it possible to make it extremely easy to estimate which typical failures will occur in a planning year by using the damage data from past operations, determining the MTTFD (the data come from flight data and failures analysis) for the most common faults, and breaking them down by the P/N of the main replaceable parts, e.g., fuel pump, chassis actuator, safety valve.
The MTTF
D is calculated from the operational data using the following formula [
25]:
where:
Based on observing the changes in the index value, a prediction can be made of the failure frequency of the specified component.
Determining the MTTFD is within the reach of any engineer or operator, who does not need specific mathematical knowledge or sophisticated computer tools for this purpose but only a calculator, a pen, and a piece of paper. The biggest difficulty of this damage prediction method is to build a damage database with the determination of characteristic parameters about each damage, i.e.,
Name of the damaged unit;
Part Number (P/N) identification number of the part;
Date of installation on board;
Date the failure occurred;
The operating time of the device until the failure occurred—calculated in flight hours, months, hours, days, cycles, etc.;
Brief description of the failure—in particular, at what level of maintenance was it detected, symptoms, impact on other components, impact on the operation of the entire technical facility, impact on the operational work of the technical facility, impact on safety, etc.;
How the failure was repaired—replacement with a new one, adjustment, or other activity.
Having all the above information about the set of all failures, the necessary analysis can be easily carried out.
Mathematical Method
In the logistical support of an operations process, various types of probability distributions can be used to model different aspects of the system [
26,
27]. Some of these have been summarised in
Table 1.
In summarizing the usage of the probability application in the control of the logistical support of the operation process, for example, the normal distribution can be used to model the demand for a product or resource. This can be useful for forecasting future demand and determining appropriate inventory levels. The Poisson and Weibull distribution can also be used to model demand, particularly for situations where the number of occurrences of an event is small. The exponential distribution is commonly used to model the time between the arrivals of deliveries or the time between equipment failures. In addition, the log-normal distribution is also used in logistics to model the time taken by a process or the time between failures of equipment.
These distributions can provide a useful tool for logistics planners to predict and optimize the resources and materials needed and the logistics operation processes.
4. Research Object and Flow of the Study
Aircraft designed for flight training were used as the object of study. Consequently, the topics of reliability, efficiency, readiness, and aircraft availability are widely analyzed and considered. Availability has a direct impact on the level of training of pilots, while efficiency and reliability have a direct impact on the safety of flight training. Economic aspects recede into the background of priorities.
The operational process of a helicopter used for flight training was analyzed, and its operational and utilization efficiency and utilization potential can be presented graphically.
The research object is operated according to a mixed operation strategy, i.e., some of the built-in equipment, as well as major components, have a limited life span and are subject to replacement, irrespective of their technical condition, when a predetermined amount of work has been achieved or after a specific calendar time. These are components that have a direct impact on the safety of flight training in the air. Other equipment is operated according to its technical condition. Since the availability of individual helicopters was not at a satisfactory level and the time to restore airworthiness was significantly prolonged, an attempt was made to identify the reasons for this.
5. Results
5.1. Preliminary Research
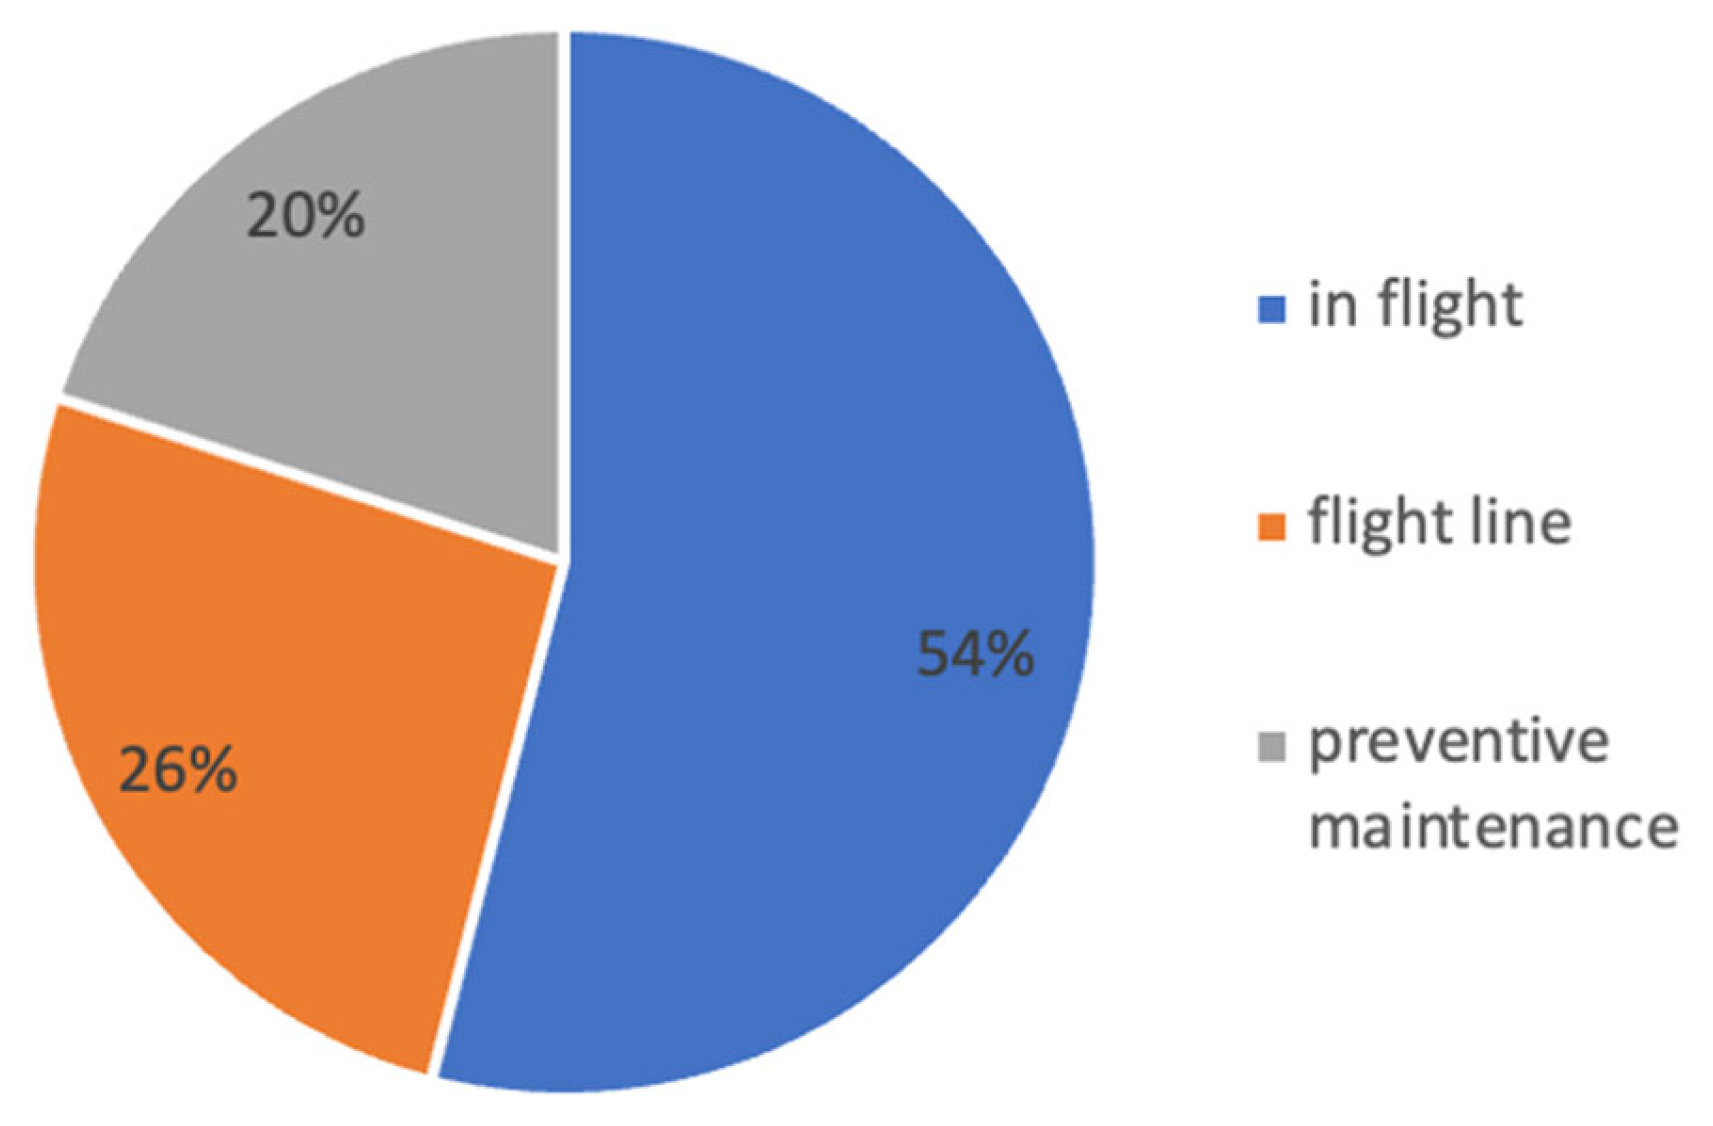
The operational data of training helicopters from 2012–2019 were analyzed in terms of the utilization of the service potential of the entire aircraft fleet, level, and duration of specific maintenance, the occurrence of faults and failures, in particular where they were detected, how they were rectified and the time required to restore serviceability, the time taken to operate the equipment until failure (flight hours), and the waiting time for spare parts when a replacement was necessary. Based on operating/maintenance data, the following associations were analyzed: the stages in operation/maintenance at which failures were detected (
Figure 1). It was noted that most defects are detected during the flight. This may indicate that the helicopter was affected during the flight, which is, unfortunately, the most dangerous situation.
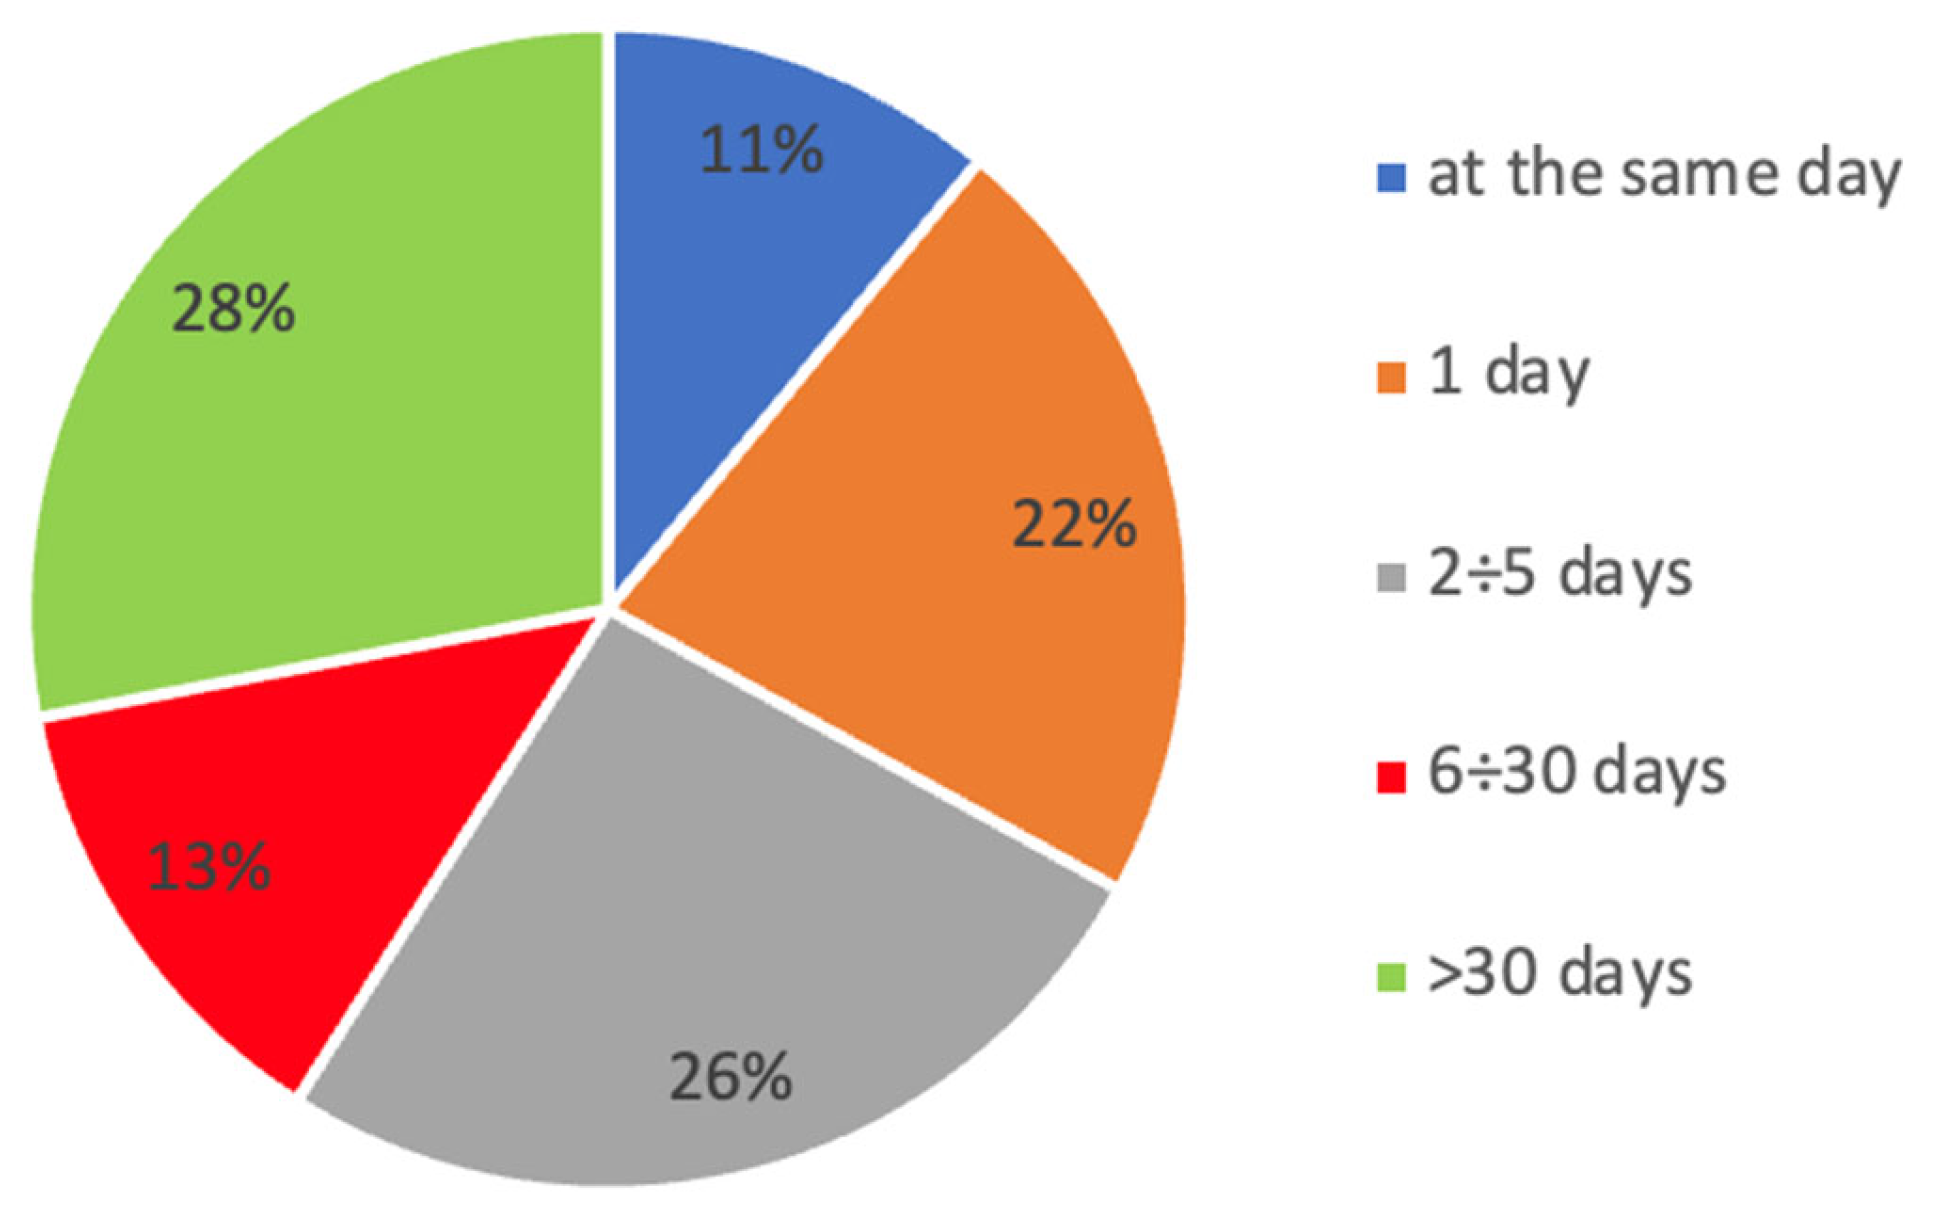
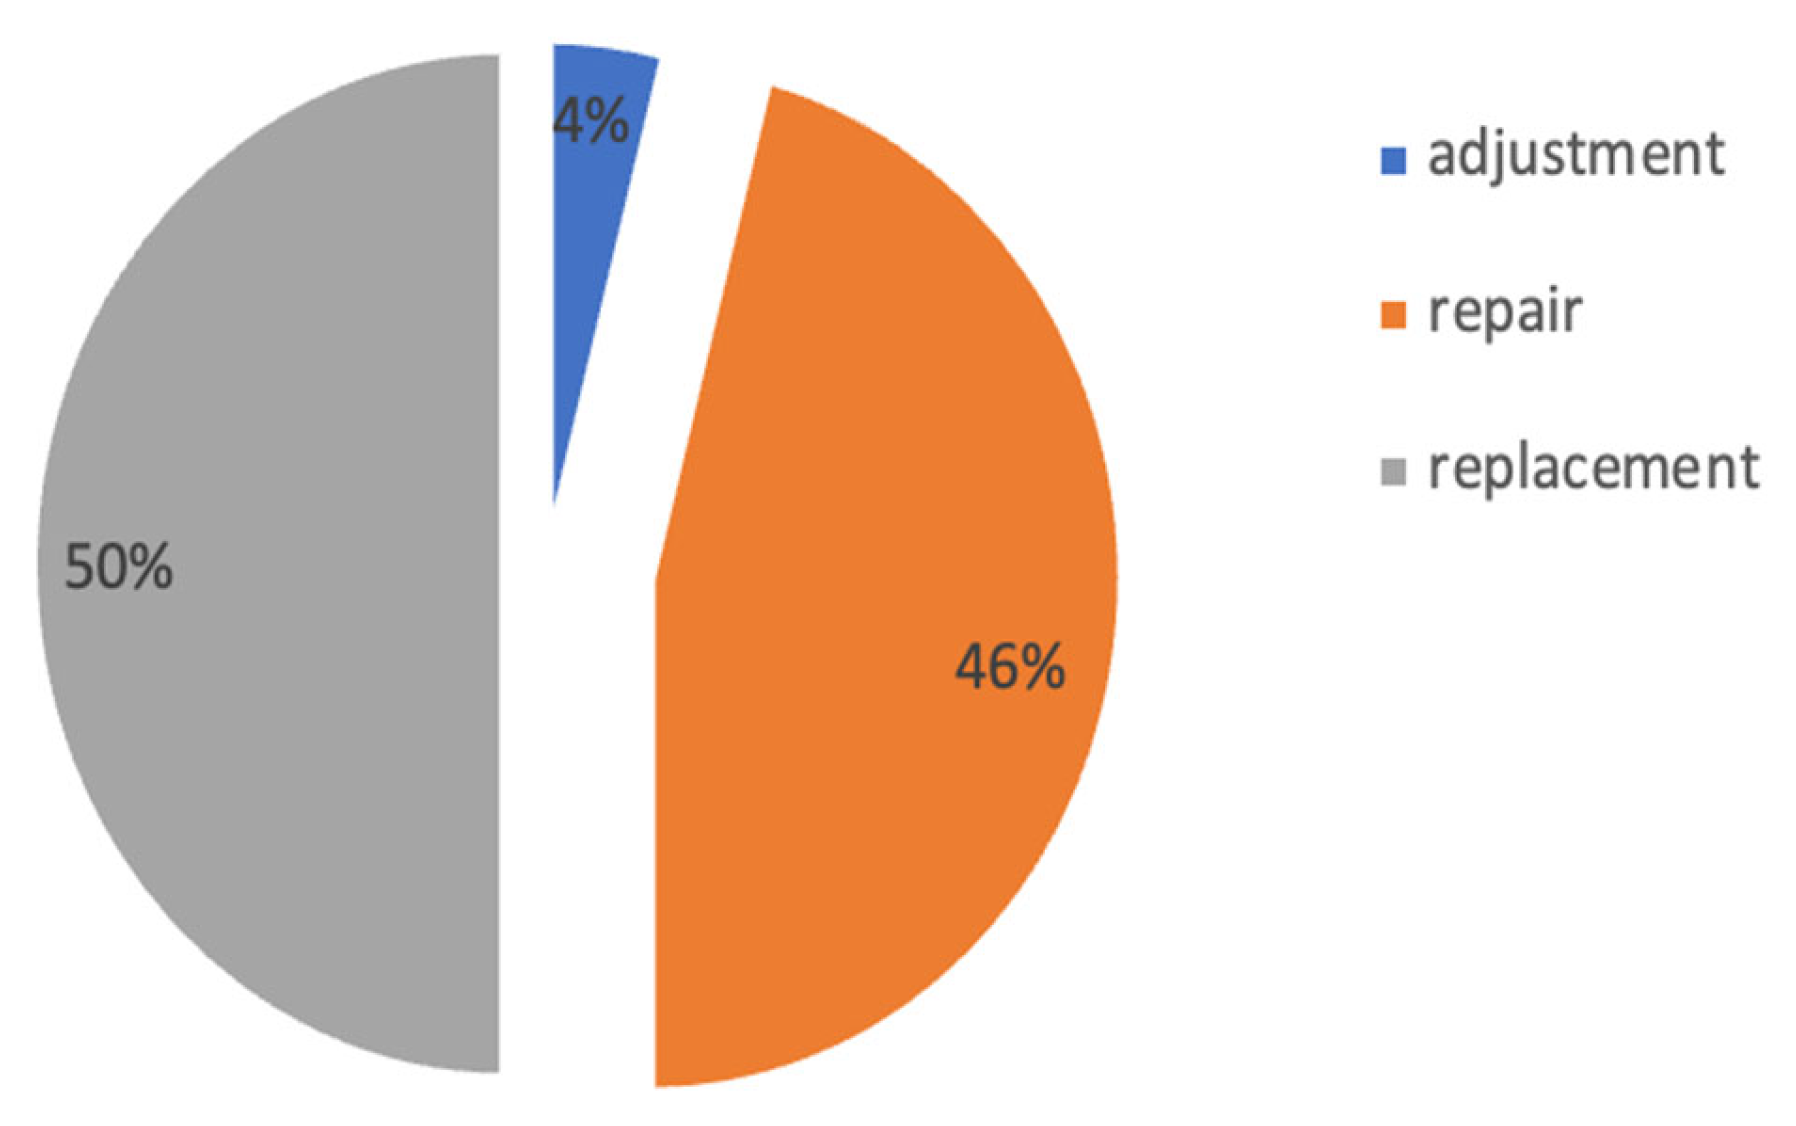
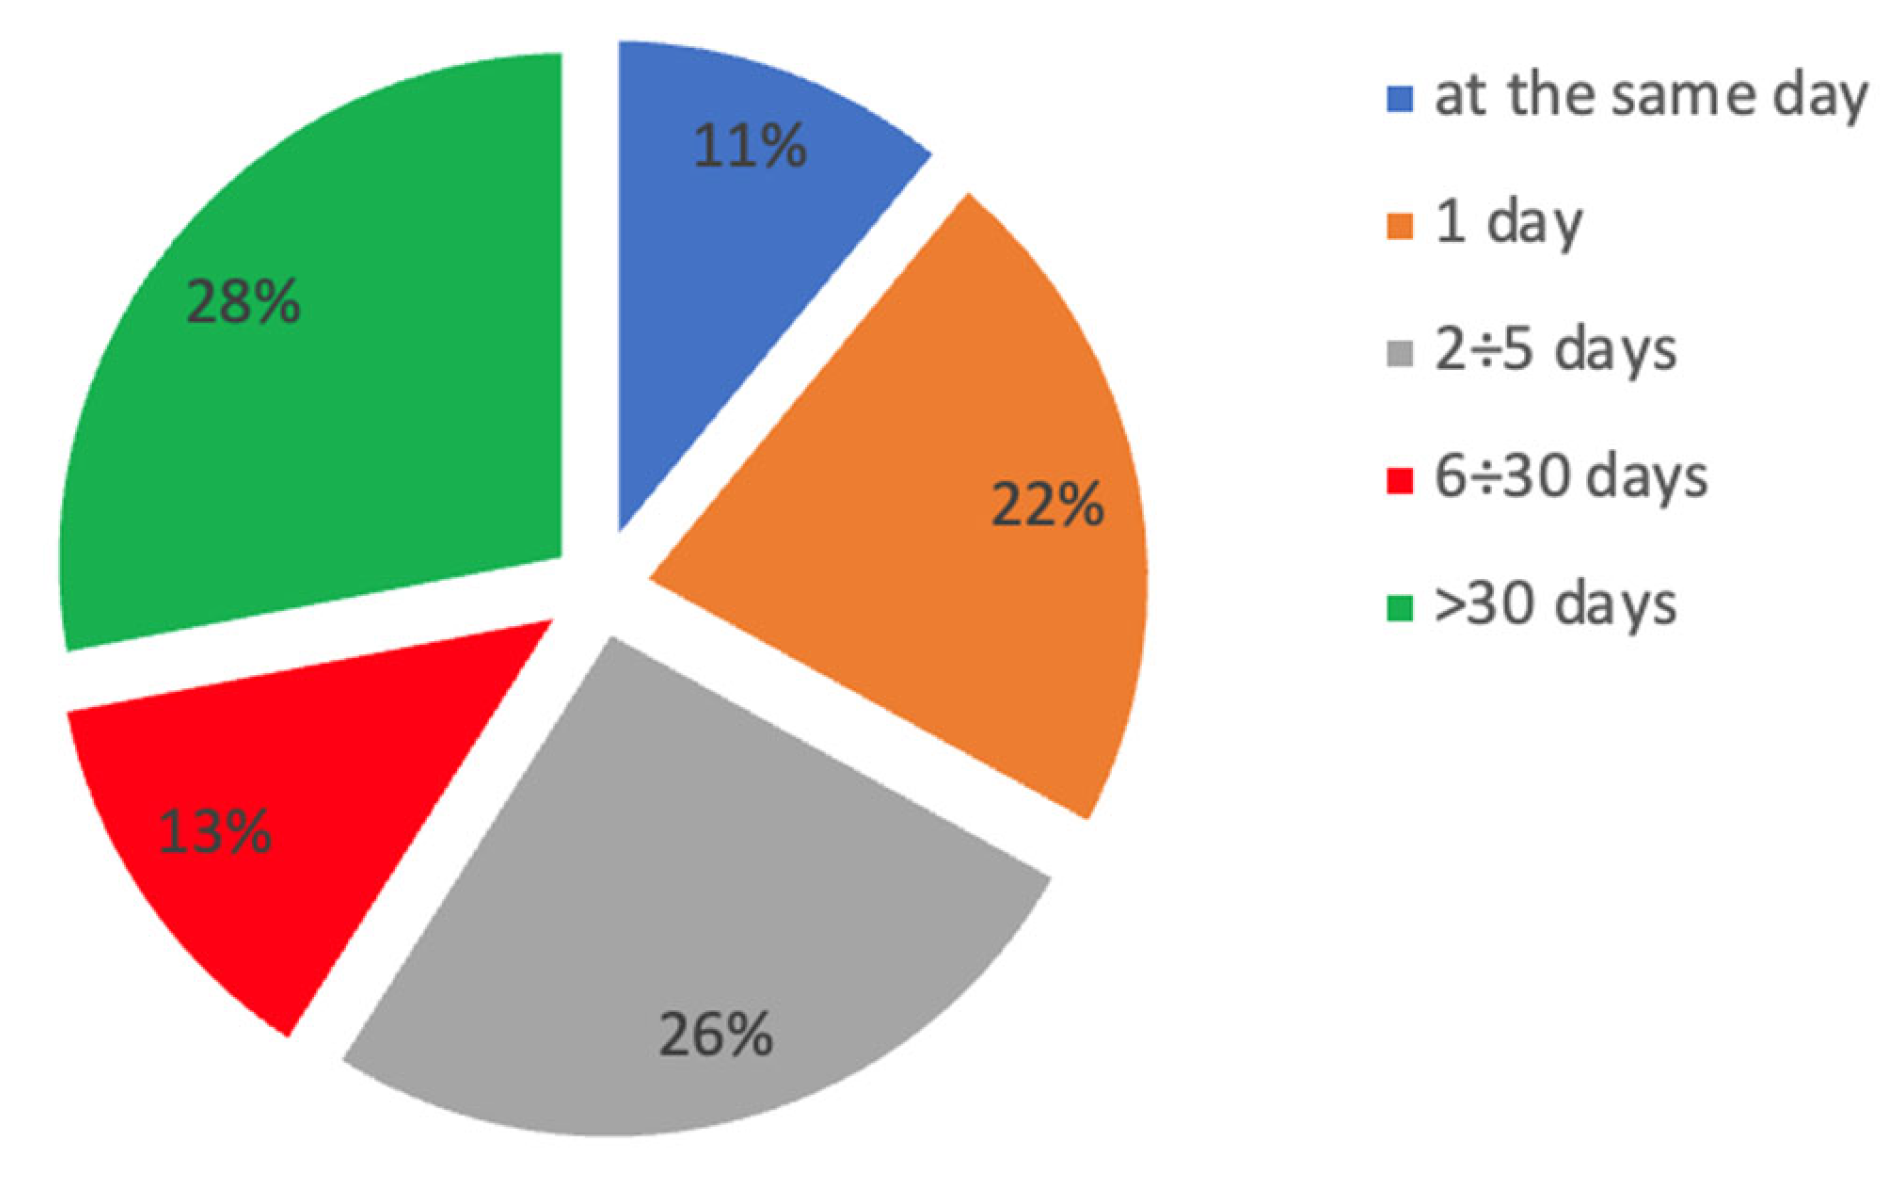
Summarizing the conducted analysis (
Figure 1,
Figure 2,
Figure 3 and
Figure 4), it can be concluded that most defects were detected in flight or during ongoing maintenance, and, during preventive maintenance, only a fifth of all defects were detected. For 19% of all defects, the time to rectify them took more than 5 days, and, for a further 18%, the time took more than 30 days. In total, 50% of all faults were rectified by replacement with a new unit. For 28% of all faults rectified by replacing the unit with a new one (taken from stock), the waiting time for a spare part was more than 30 days. From these partial conclusions, one main conclusion arises: the main reason for the lack of adequate availability of helicopters for flight training is the lack of parts in stock. This observation prompted the exploration of methods to improve this situation.
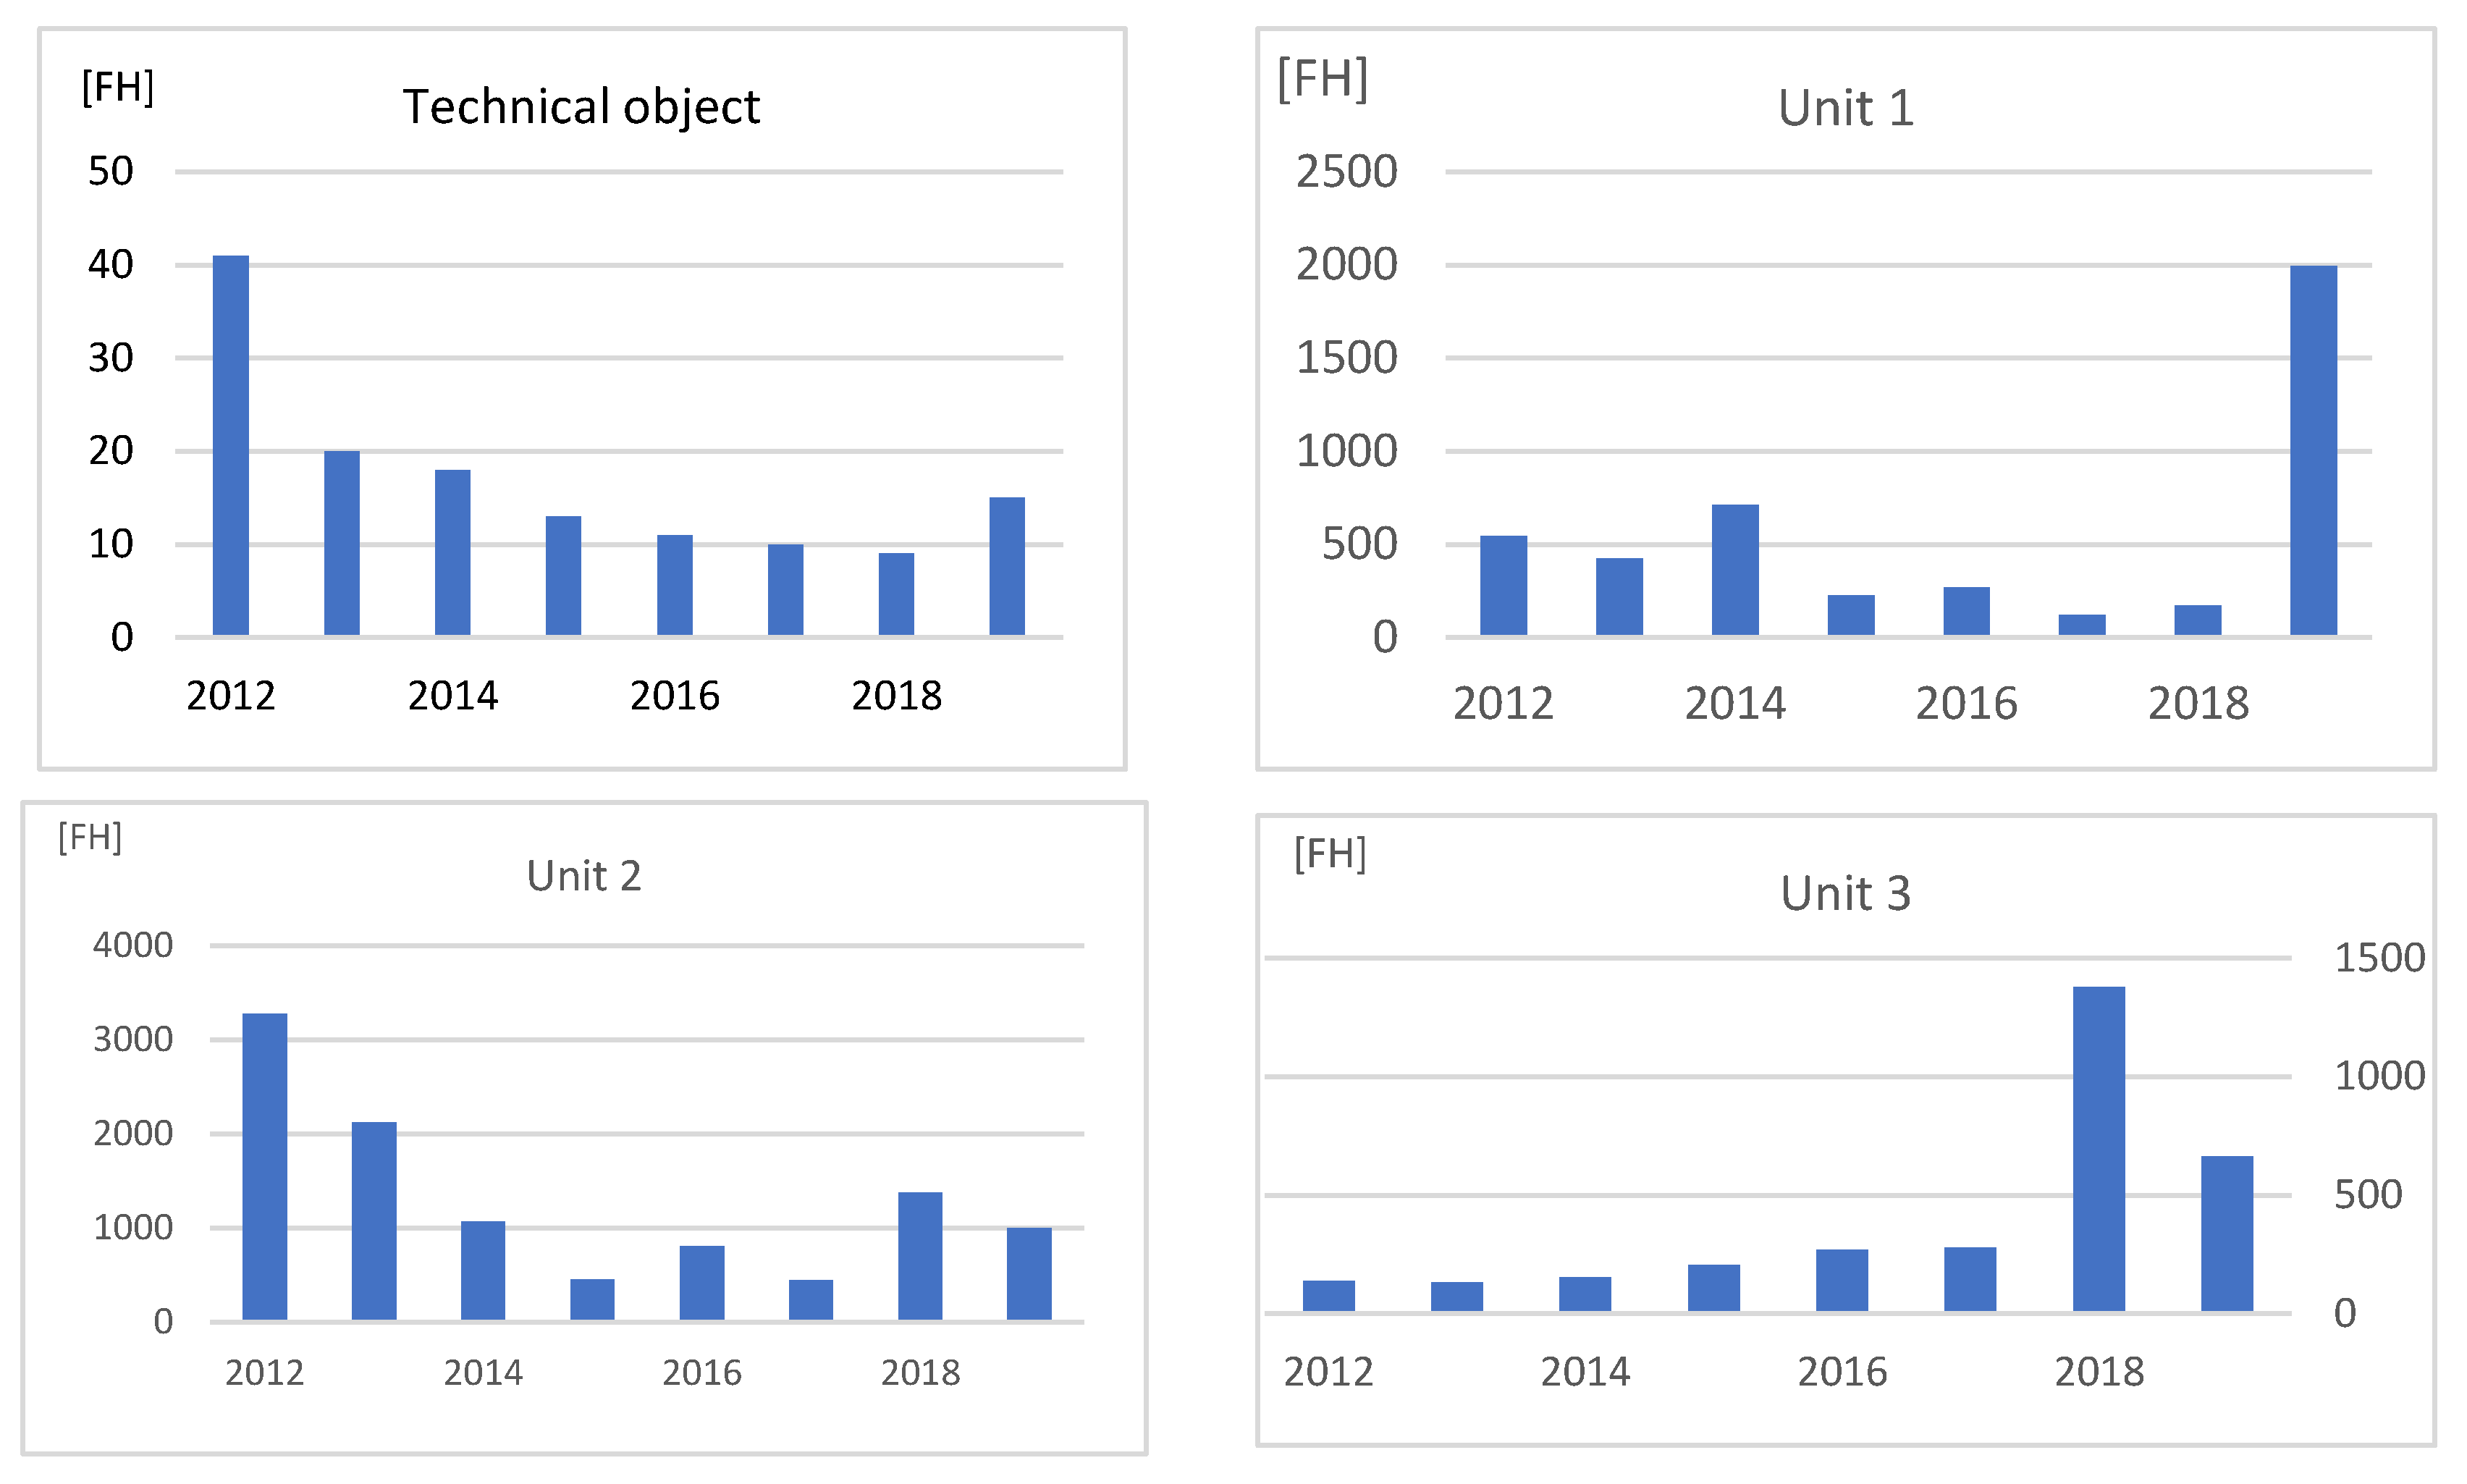
5.2. The Trend in Annual MTTF
Based on the operational data collected, MTTF
D values were calculated from Equation (1), by year, for the selected equipment in the following years. The number of hours between failures is presented in
Figure 5. It can be observed that the longest time between failures is for the years 2012, 2019, 2012, and 2018, respectively, for technical objects, unit 1, unit 2, and unit 3.
The characteristic evolution of the annual values of the MTTF
D indicator was observed, where it was possible to observe a trend in the change of the indicator value. By plotting the trend line, it is possible to estimate the direction of change (increasing or decreasing) and the approximate value of the indicator in the planning year. To confirm the correctness of the assumptions, an estimation of the MTTF indicator was performed based on selected probability distributions. The estimation of the selected parameters of the individual distributions was performed with the Weibull++ software 11.1.1 [
28], using flight data from the maintenance support information system.
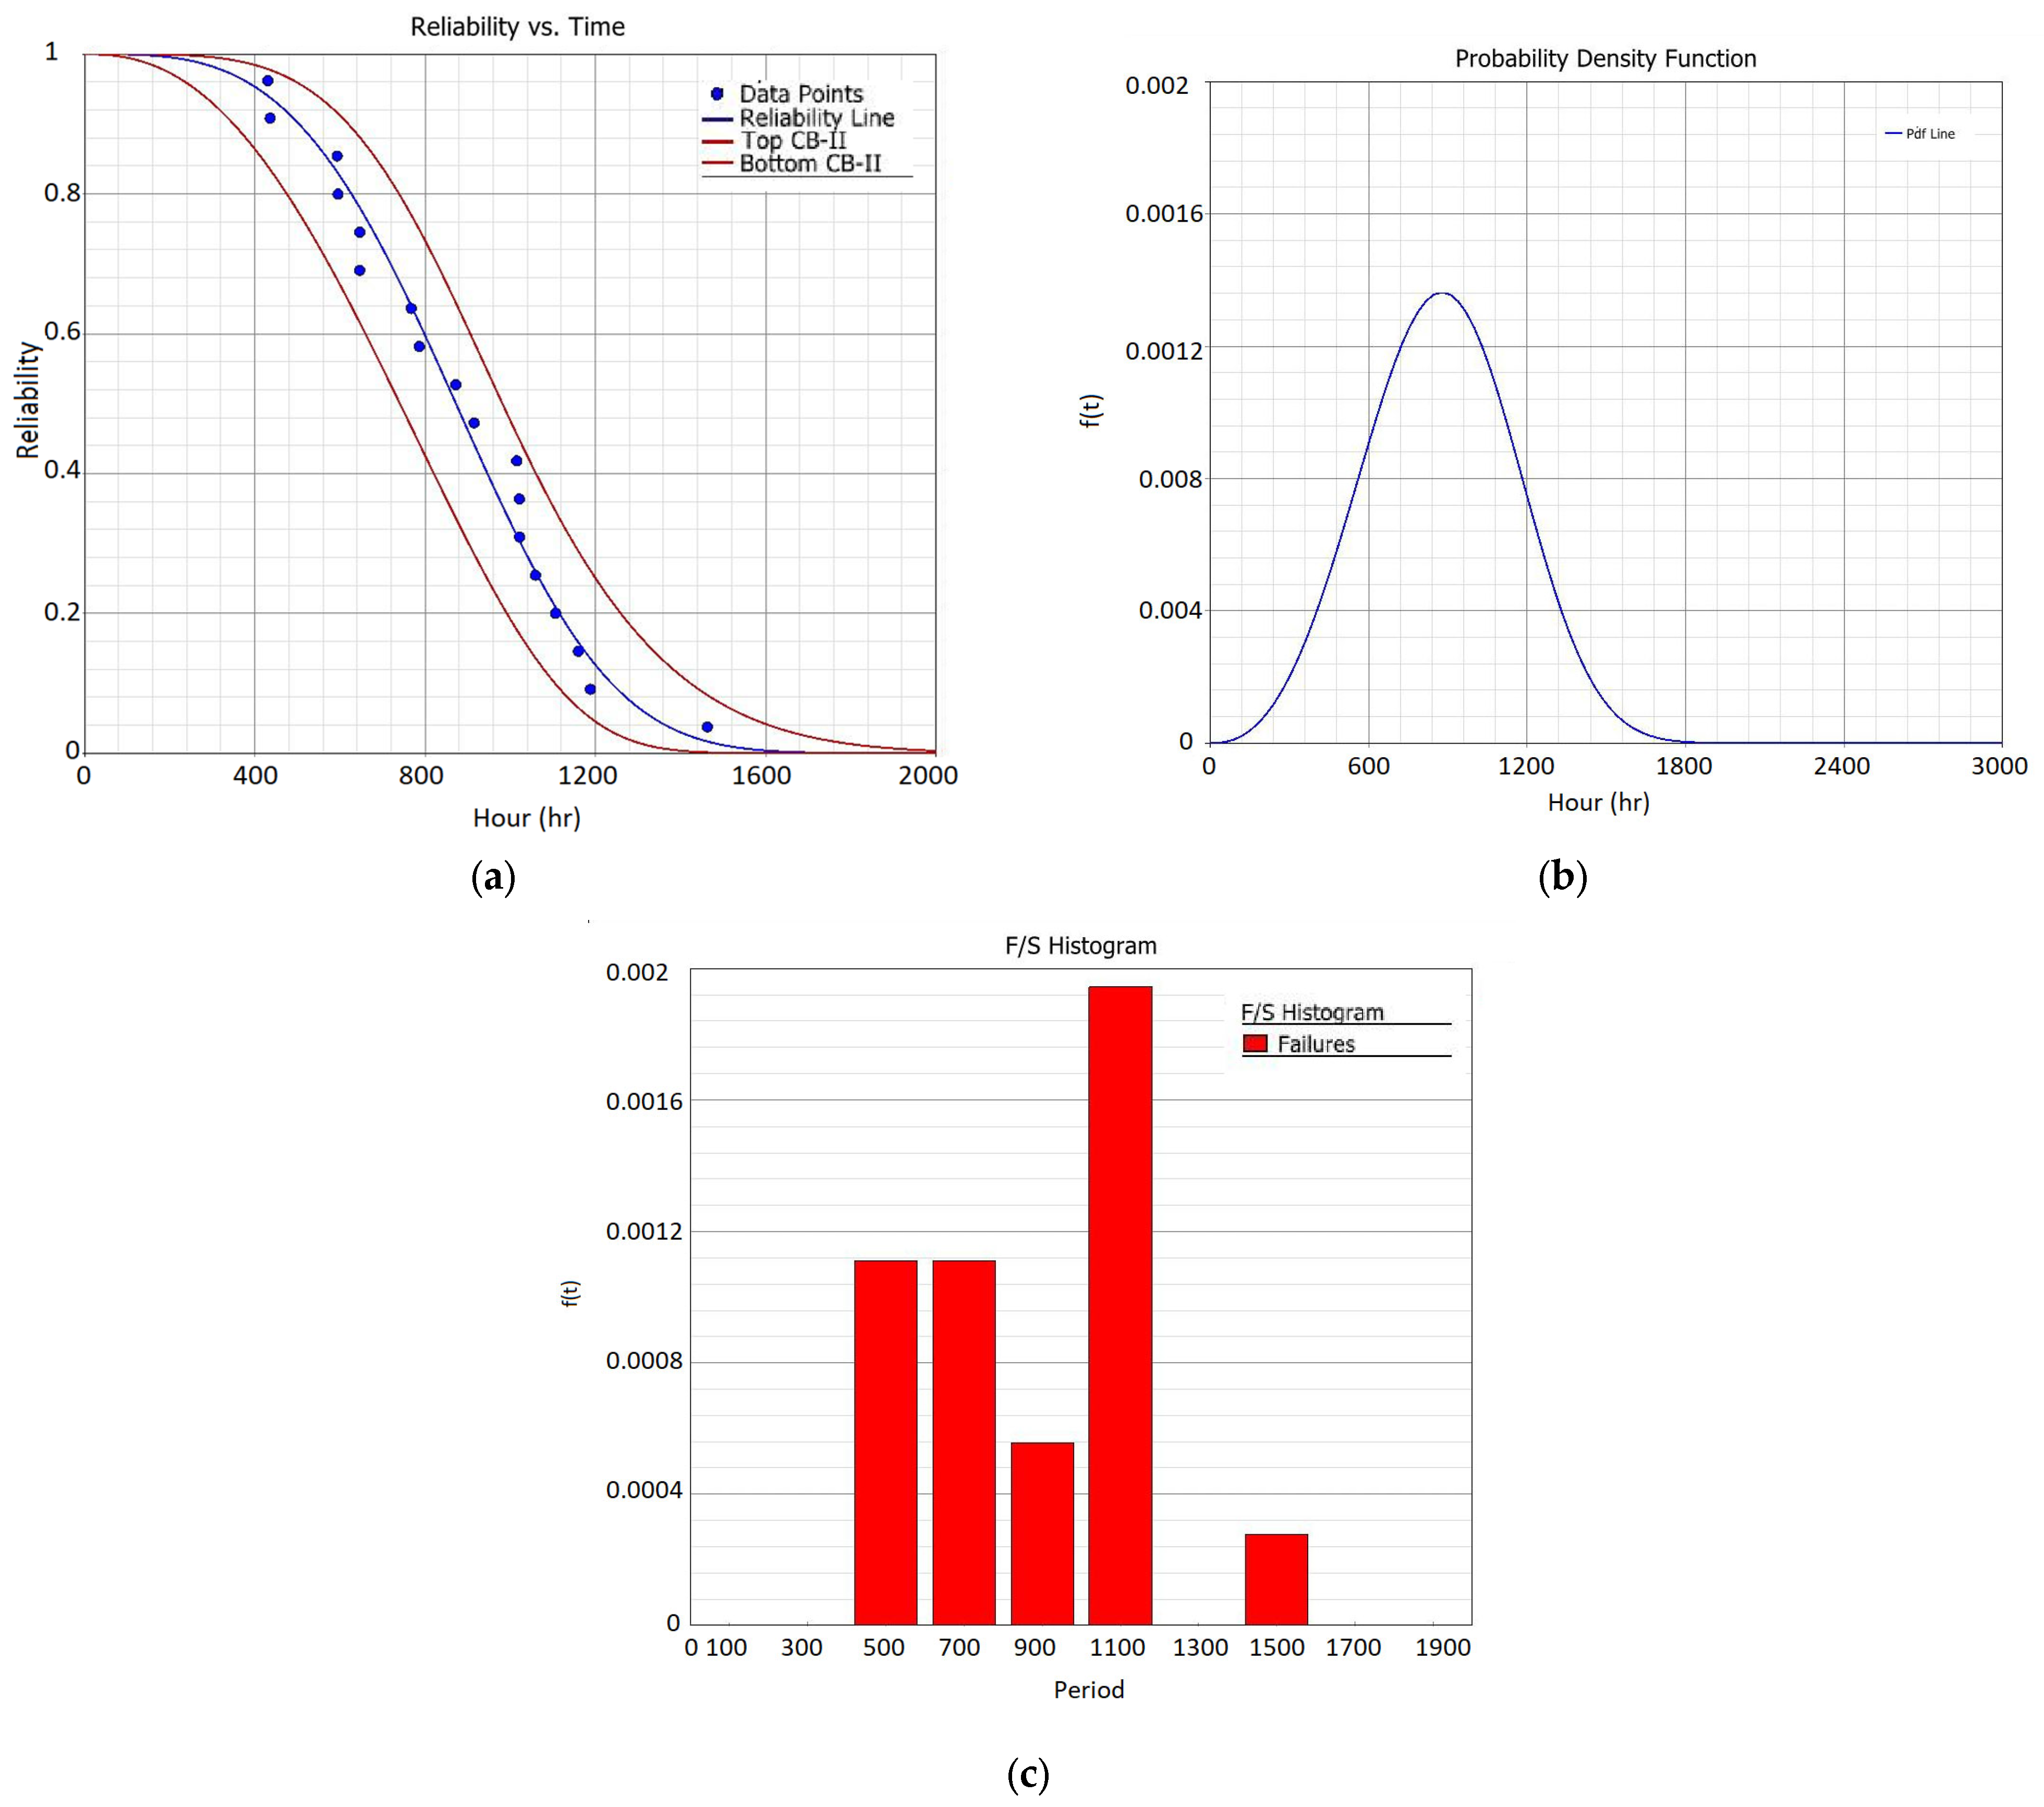
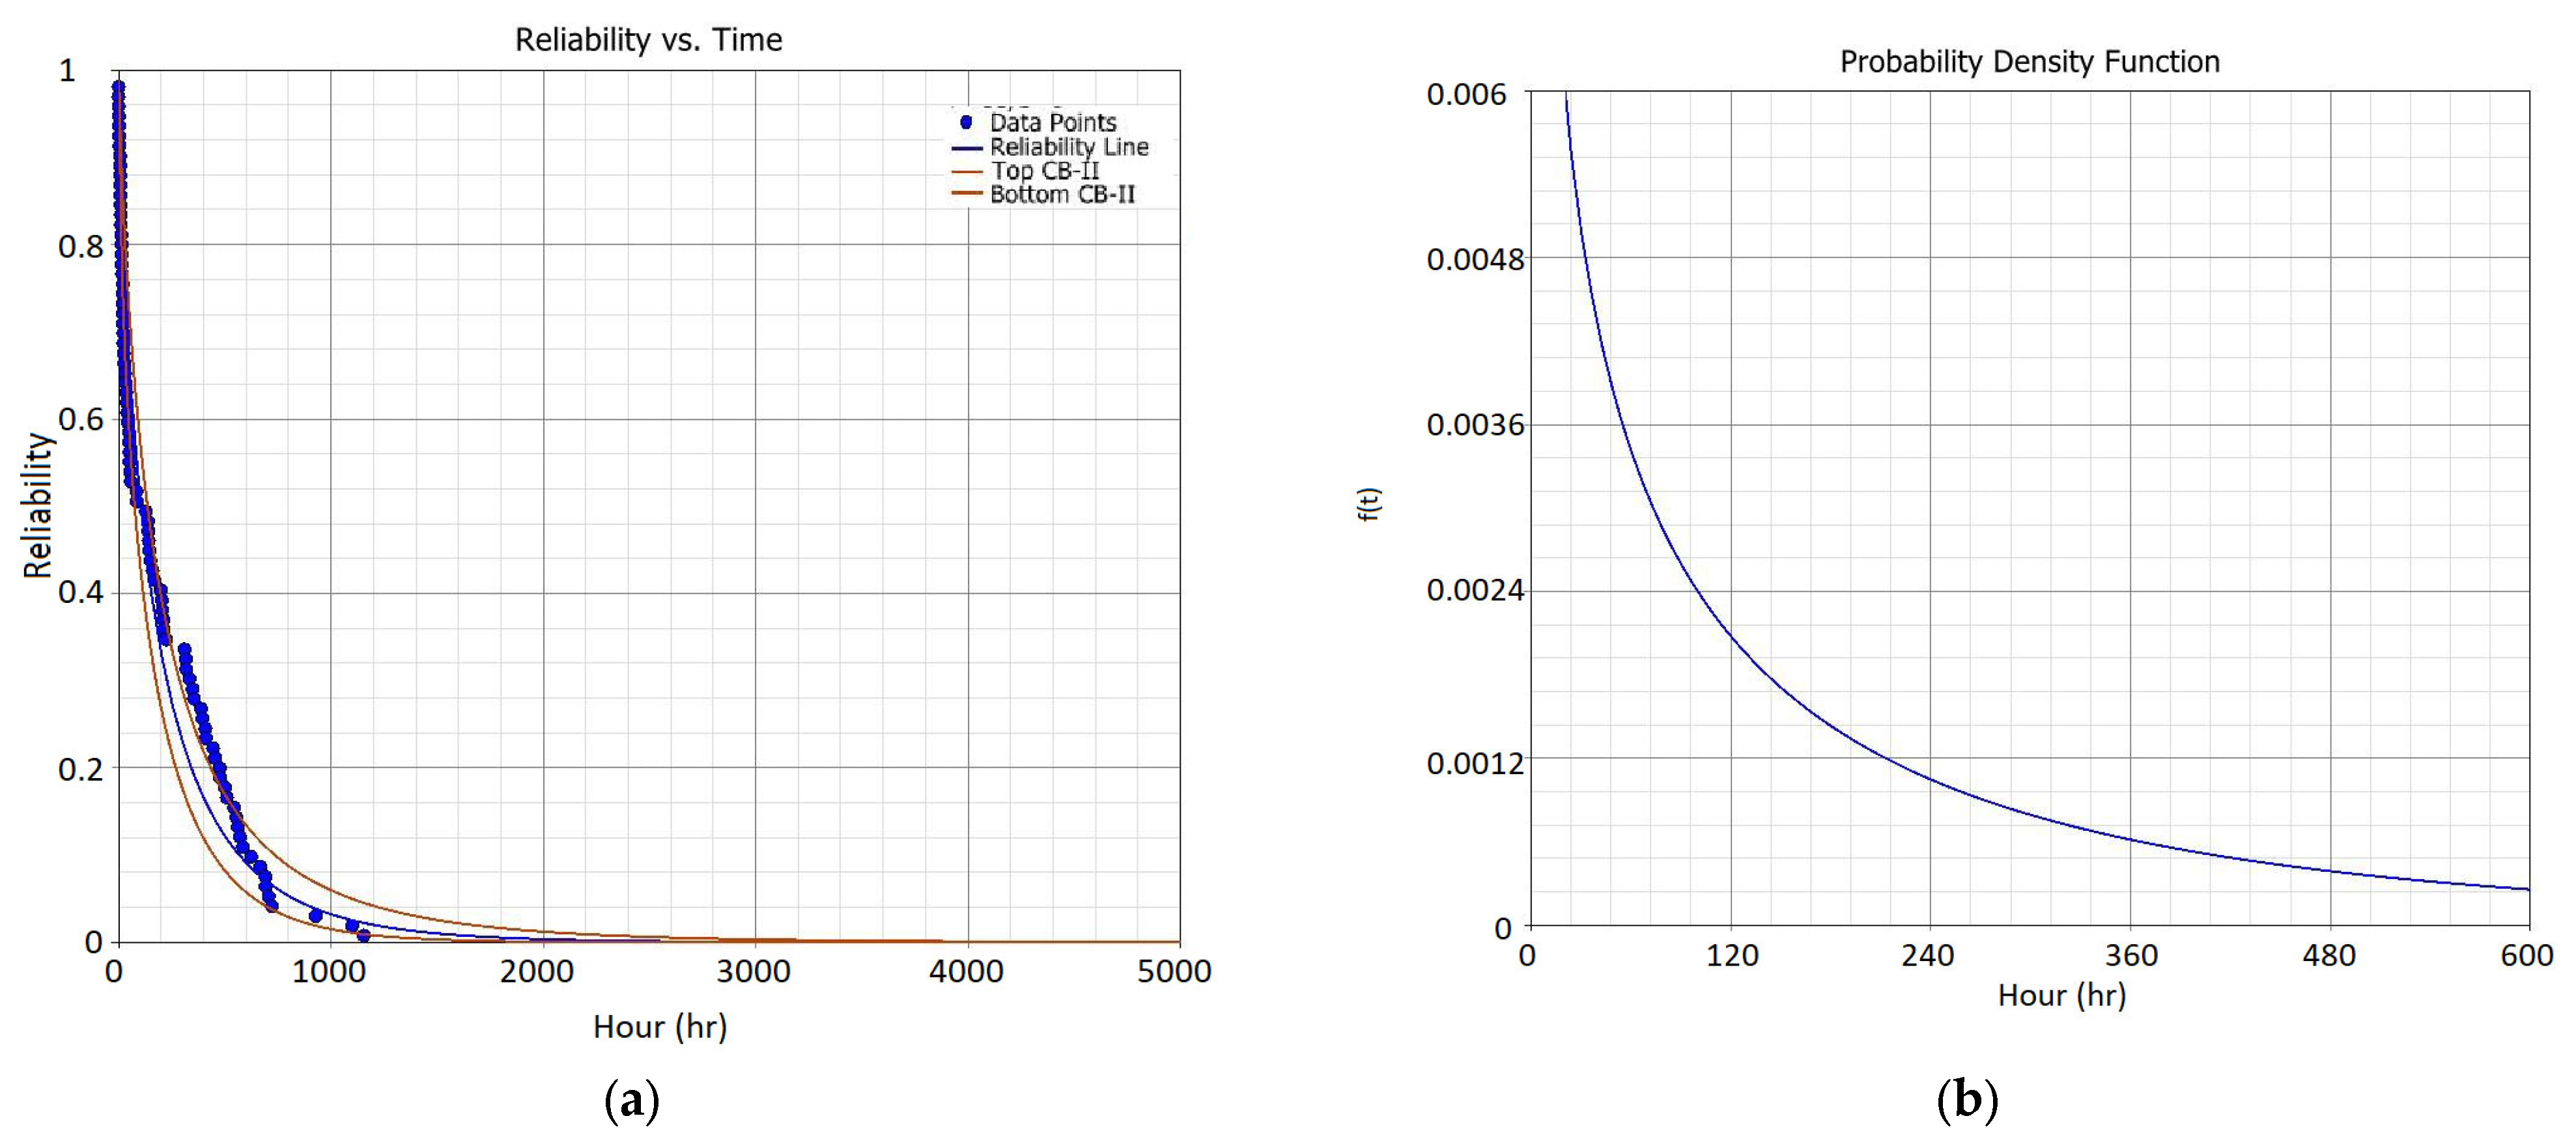
The study’s results are presented figuratively in the following forms:
Figure 6a,
Figure 7a and
Figure 8a display the reliability function R(t), with the blue line indicating the average value of the function, and the red lines representing the two-sided limits of the 90% confidence interval.
Figure 6b,
Figure 7b and
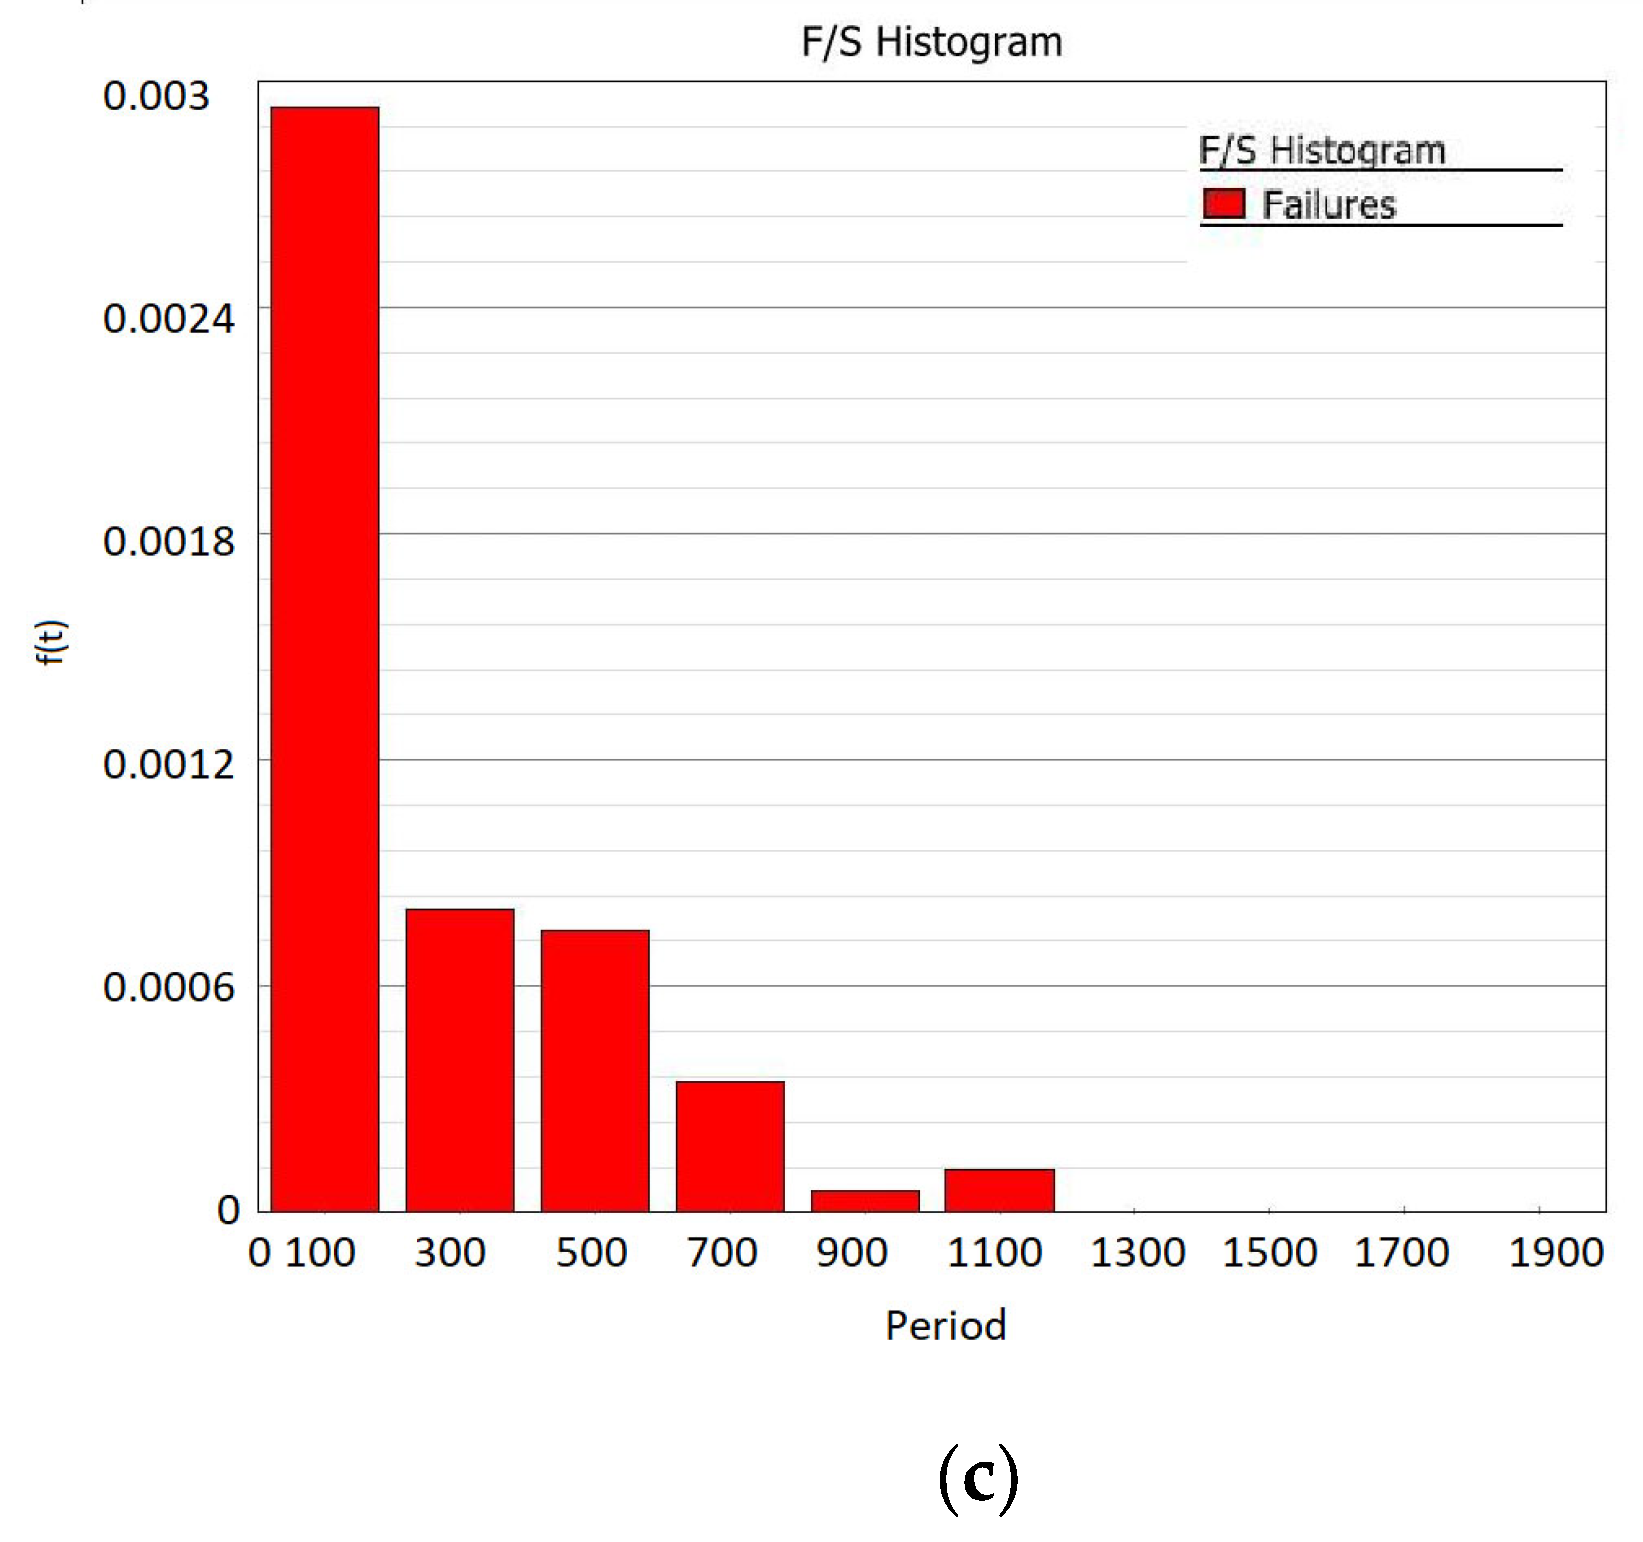
Figure 8b illustrate the probability density function f(t), which shows the distribution of data over time. Finally,
Figure 6c,
Figure 7c and
Figure 8c show the histogram, which rearranges the abundance of damage in qualified time intervals or the consumption of residual life (FH, number of landings, cycles, etc.).
The other distributions used showed less graphic fit, but the numerical values are very similar. Only the value of the estimated MTTF factor using the lognormal distribution differs slightly from the other distributions and especially from the MTTFD value calculated from Formula (1).
The numerical data of the MTTF
D indices are summarized in
Table 2.
The data presented in
Table 2 show that using the MTTF
D factor based on Formula (1) is legitimate, which is proven by the similar values of the factors estimated from the statistical distributions. Because the training helicopter, by definition, has to fly 300 h per year, the differences in the MTTF
D and MTTF values determined from the distributions are small and can be considered negligible.
6. Estimating the Logistical Security Needs of the Operation
As previously stated, estimating the logistical needs to support the aviation technology operation process consists of four stages. The first three stages are quite simple in terms of the algorithm for determining needs. The major difficulty is getting through Stage IV.
The research presented in the article can decisively facilitate this process, without needing a specialized tool in the form of dedicated IT software or specialist knowledge in the basics of reliability, logistical planning, or statistics. A prerequisite is the ongoing collection of information about failures that have occurred and the recording of specified, characteristic information about failures and how they were rectified. Based on the collected data, the MTTF
D should be determined for the device in question (taking into account the P/N of the unit), and an additional analysis carried out by determining the unit’s replacement rate over the analyzed period (e.g., 1 year), W, from the formula:
The logistics consumption for the
i-th element
Lpi can be determined from the values:
MTTFDi and
Wi, with the help of the relationship:
where
N is the planning number of flight hours of the fleet.
The complex compilation of logistical needs resulting from the planning process carried out for Phase IV follows:
However, it should be remembered that Formulas (2)–(4) apply to Stage IV, i.e., the estimation of needs using the MTTFD reliability index estimated on the basis of past operational data and knowledge of emergent failures.
A comprehensive statement of the logistical maintenance needs to be estimated, based on the MTTFD indicator, which should be reduced by the number of assortments (P/N) held in the user’s warehouse. Only the result of this operation will constitute a complete list of assortments necessary to be procured for the planned aircraft’s lifetime.
7. Conclusions
The article’s main objective was to provide an overview of the logistics planning methodology for securing the operation of a military aircraft and, in particular, to find a way of generating the need to fill the depot with spare parts in the event of unplanned damage. This is important from the point of view of minimizing losses due to the unavailability of the aircraft for flight training. Planning the purchase of spare parts in military aviation is related to long-term planning. First, the logistics needs are defined, then, the budget is estimated, the appropriate contracts with subcontractors are signed, and, finally, the order is completed in the form of the delivery of parts. Often, this process takes a minimum of 15 months. The biggest problems were with the estimation of logistic needs related to the occurrence of accidental damage. Therefore, there was a need to develop a method of logistical planning that considers the occurrence of accidental damage to aircraft. As a tool, one of the available reliability indices—the mean time to failure (MTTF) determined from the collected data from past operations—was proposed. The next step was to determine the mean time to failure using available probability distributions. The results obtained were compared with the MTTF obtained from Formula (1). The values of the indices obtained are comparable. The developed method was verified by comparing the size of the calculated logistic needs with the actual exchanges of a given device. In total, 70% of the results obtained were consistent with the real exchanges. Therefore, it can be concluded that it is possible and effective to predict failing spare parts based on the MTTF reliability index. This method does not require complex computer programs or in-depth mathematical knowledge. It is a method that can be used by any engineer, provided that failure data from a previous operation is available.
Summarizing, it would be appropriate to highlight once again that reliability is of the utmost importance in aviation, especially when it comes to safety. The reliability of aircraft and their components is crucial to ensure safe flight operations, as well as readiness to perform them. A thorough reliability study can identify potential failure modes and implement preventive measures to reduce the risks associated with these failures. The use of advanced data collection and analysis techniques can also help to identify potential problems before they occur and to maintain a high level of reliability and safety in flight operations. Therefore, a comprehensive reliability study can significantly affect the safety and readiness of the aircraft for flight operations.


 ,
, 


