Article

Matrix Stiffness Influences Tubular Formation in Renal Tissue Engineering

1
Department of Medicine, David Geffen School of Medicine, University of California Los Angeles, Los Angeles, CA 90095, USA
2
Medical and Research Services, Greater Los Angeles Veterans Affairs Healthcare System at Sepulveda, North Hills, CA 91343, USA
3
Department of Mechanical and Aerospace Engineering, Samueli School of Engineering, University of California Los Angeles, Los Angeles, CA 90095, USA
*
Authors to whom correspondence should be addressed.
Appl. Sci. 2023, 13(7), 4510; https://doi.org/10.3390/app13074510
Submission received: 15 November 2022 / Revised: 29 March 2023 / Accepted: 30 March 2023 / Published: 2 April 2023

Abstract

:
Tubular structures contribute to essential organ functions. Therefore, controlling tubulogenesis is essential for bottom-up tissue engineering approaches. Tissue engineering strategies to form tubular structures utilize extracellular matrix (ECM) components and micropatterned molds. To improve the tubular formation rate, we studied the substrate stiffness’s influence on the tubulogenesis of murine inner medullary collecting duct (mIMCD) cells. mIMCD cells were seeded in micropatterned molds with different compositions of polydimethylsiloxane (PDMS) (1:5, 1:10, 1:15, 1:20, 1:30) and agarose (1%, 2%, 3% 5%). We established the Young’s modulus of the PDMS and agarose substrates and determined the ideal substrate stiffness for tube formation to be between 277 kPa and 2610 kPa. Within our parameters, optimal tube formation was observed at 439.9 kPa, a value similar to the Young’s Modulus found in the basement membrane of the murine renal tubular compartment. We also found that different substrate concentrations of agarose or PDMS are associated with different expression levels of the apical polarization marker Zonula occludens 1 (ZO-1) in the generated tubular structures. In addition to the substrate stiffness, we observed that the tube formation differed based on the substrate material, with agarose showing a generally greater tube formation rate. While previous research demonstrated that ECM stiffness influences cellular behavior towards tube formation, our results suggest that the stiffness of the substrate influences tubular formation independently of the ECM.

1. Introduction

Tissue engineering aims to generate functional cell-based composites that are analogous to native structures or tissues to replace or improve injured tissues or organs. Attempts have been made to create various tissues and organs, from tissue-engineered oral mucosa [1] to engineered heart valves [2] and lymphoid organs [3].
Tubular structures are the central elements within a tissue that enable the function of organs such as the lung, the mammary gland, blood vessels, and components of the urogenital- and digestive systems. During tube formation, epithelial cells polarize and connect via tight- and adherence junctions to form tube-like structures that contain a lumen [4]. Evolution gave rise to various mechanisms to form tubular structures that have a continuous lumen. For example, the vertebrate neural tube is generated by the invagination of a sheet of polarized cells, while the heart tube in Drosophila is formed by the entrapment of extracellular space by non-polarized cells [5]. In mammary glands, the lumen is generated by the apoptosis of centrally located cells [5]. In the kidney, the lumen containing the ureteric bud, and its subsequent branches, are formed by a mesenchymal-to-epithelial transition (MET) driven invagination of the mesonephric duct (Wolffian duct) [6]. Lumen formation in nephrons, which develop from the metanephric mesenchyme, seems to follow a cord hollowing mechanism, where the lumen is formed de novo within a cord of cells [7].
Micropatterned molds have been used to provide spatial cues to generate structures and tissue analogs from a wide variety of cells [8]. For example, Nelson et al. used a micropatterned gel to induce tube formation in mammary epithelial cells and control the tubes’ branching geometry [9]. Using micropatterned gels, tubular structures can be generated in different diameters, as Raghavan et al. reported [10]. In a previous study, we reported the controlled formation of tubes using ureteric bud cells in combination with a micropatterned gel [11].
Developmental tissue engineering approaches the generation of tissues and organs by mimicking the processes of organogenesis and morphogenesis using the embryo’s functional and morphological clues [12]. Studies have demonstrated that tube formation can be facilitated by extracellular matrix components and physical cues such as micropatterned molds [13]. While PDMS is commonly used as a first-choice polymer to generate micropatterned molds or microfluidic devices, the hydrophobic surface makes it difficult to handle small volumes of liquid outside of a microfluidic system. Therefore, for tubular formation, we aimed to find a better suited substrate. For example, the basement membrane component collagen is processed and used by seeded cells, enabling tubular lumen formation [14]. Alginate-based hydrogels commonly maintain progenitor stem cells and lineage-specific cells [15]. Cells do not form a cell-substrate interaction with alginate, which can be beneficial to help with the polarization of cells during tubular and lumen formation. Agarose-based hydrogels have been used in tissue engineering approaches to support the formation of the vascular tissue with morphological similarity to in vivo tissue [16]. In addition, a collagen and agarose composite has been shown to promote the formation of tubular vascular networks [17].
An essential factor besides extracellular components and geometric cues are the physical properties of the materials used, such as stiffness [18]. For example, Alderfer and colleagues demonstrated the effect of matrix stiffness on lymphatic tube formation [19]. In this study, we aimed to elicit the influence of matrix stiffness on the tube formation of ureteric bud-derived tubular cells in PDMS or agarose-based micropatterned molds.

2. Materials and Methods

2.1. Measuring Physical Characteristics of Agarose and PDMS Molds

To characterize the Young’s modulus of the PDMS substrate, nanoindentation tests were performed using the Hysitron PI 85L SEM Picoindenter (Bruker Corporation, Billerica, MA, USA) that was equipped with a cube-corner diamond tip inside a focused ion beam (FIB), FEI Nova 600 DualBeam (FEI Inc., Hillsboro, OR, USA). A displacement-controlled loading mode was selected for all experiments, and the indentation on the sample was performed at a constant displacement rate of 60 nm/s to a depth of 2–2.5 µm. The data acquisition rate was selected for each experiment based on the displacement rate. Load displacement data were obtained from the Picoindenter Software (Bruker Corporation, Billerica, MA, USA), and, using the Oliver-Pharr method, the reduced modulus was subsequently calculated as follows:
E r = S π 2 A
where S is the slope of the unloading curve near the start of unloading, and A is the contact area for the cube corner tip. The PDMS elastic modulus (E_PDMS) is then obtained from the reduced elastic modulus as
1 E r = 1 ν P D M S 2 E P D M S + 1 ν t i p 2   E t i p
where νPDMS and νtip are Poisson’s ratio of the PDMS and the diamond tip, respectively. Since, EtipEPDMS, the above equation is simplified to
E P D M S = 0.75 E r
Because agarose cannot be subjected to a strong vacuum, nanoindentation tests cannot be performed with the Hysitron PI 85L Picoindenter. Therefore, we conducted uniaxial compression tests to characterize the Young’s modulus of the agarose molds. The samples were loaded by an uniaxial testing machine, an Instron 5966 (Instron Corporation, Norwood, MA, USA) equipped with a 50 N load cell at a loading rate of 0.2 mm/s. Their nominal stress-strain relations were obtained. We modeled the materials according to the following incompressible neo-Hookean model
W = μ 2   t r   F F T 3 + p   det F 1
where W is the strain energy density function, µ is the initial shear modulus, F is the deformation gradient tensor, and p is the hydrostatic pressure. The nominal (first Piola-Kirchoff) stress under uniaxial compression is then given by
S 11 = μ   [ 1 1 ε 11 2 1 ε 11 ]
where S11 and ε11 represent the nominal stress and strain along the loading direction, respectively. We fitted the above equation to the experimental data using the linear least-square method, yielding the initial shear modulus µ. The Young’s modulus is µ.

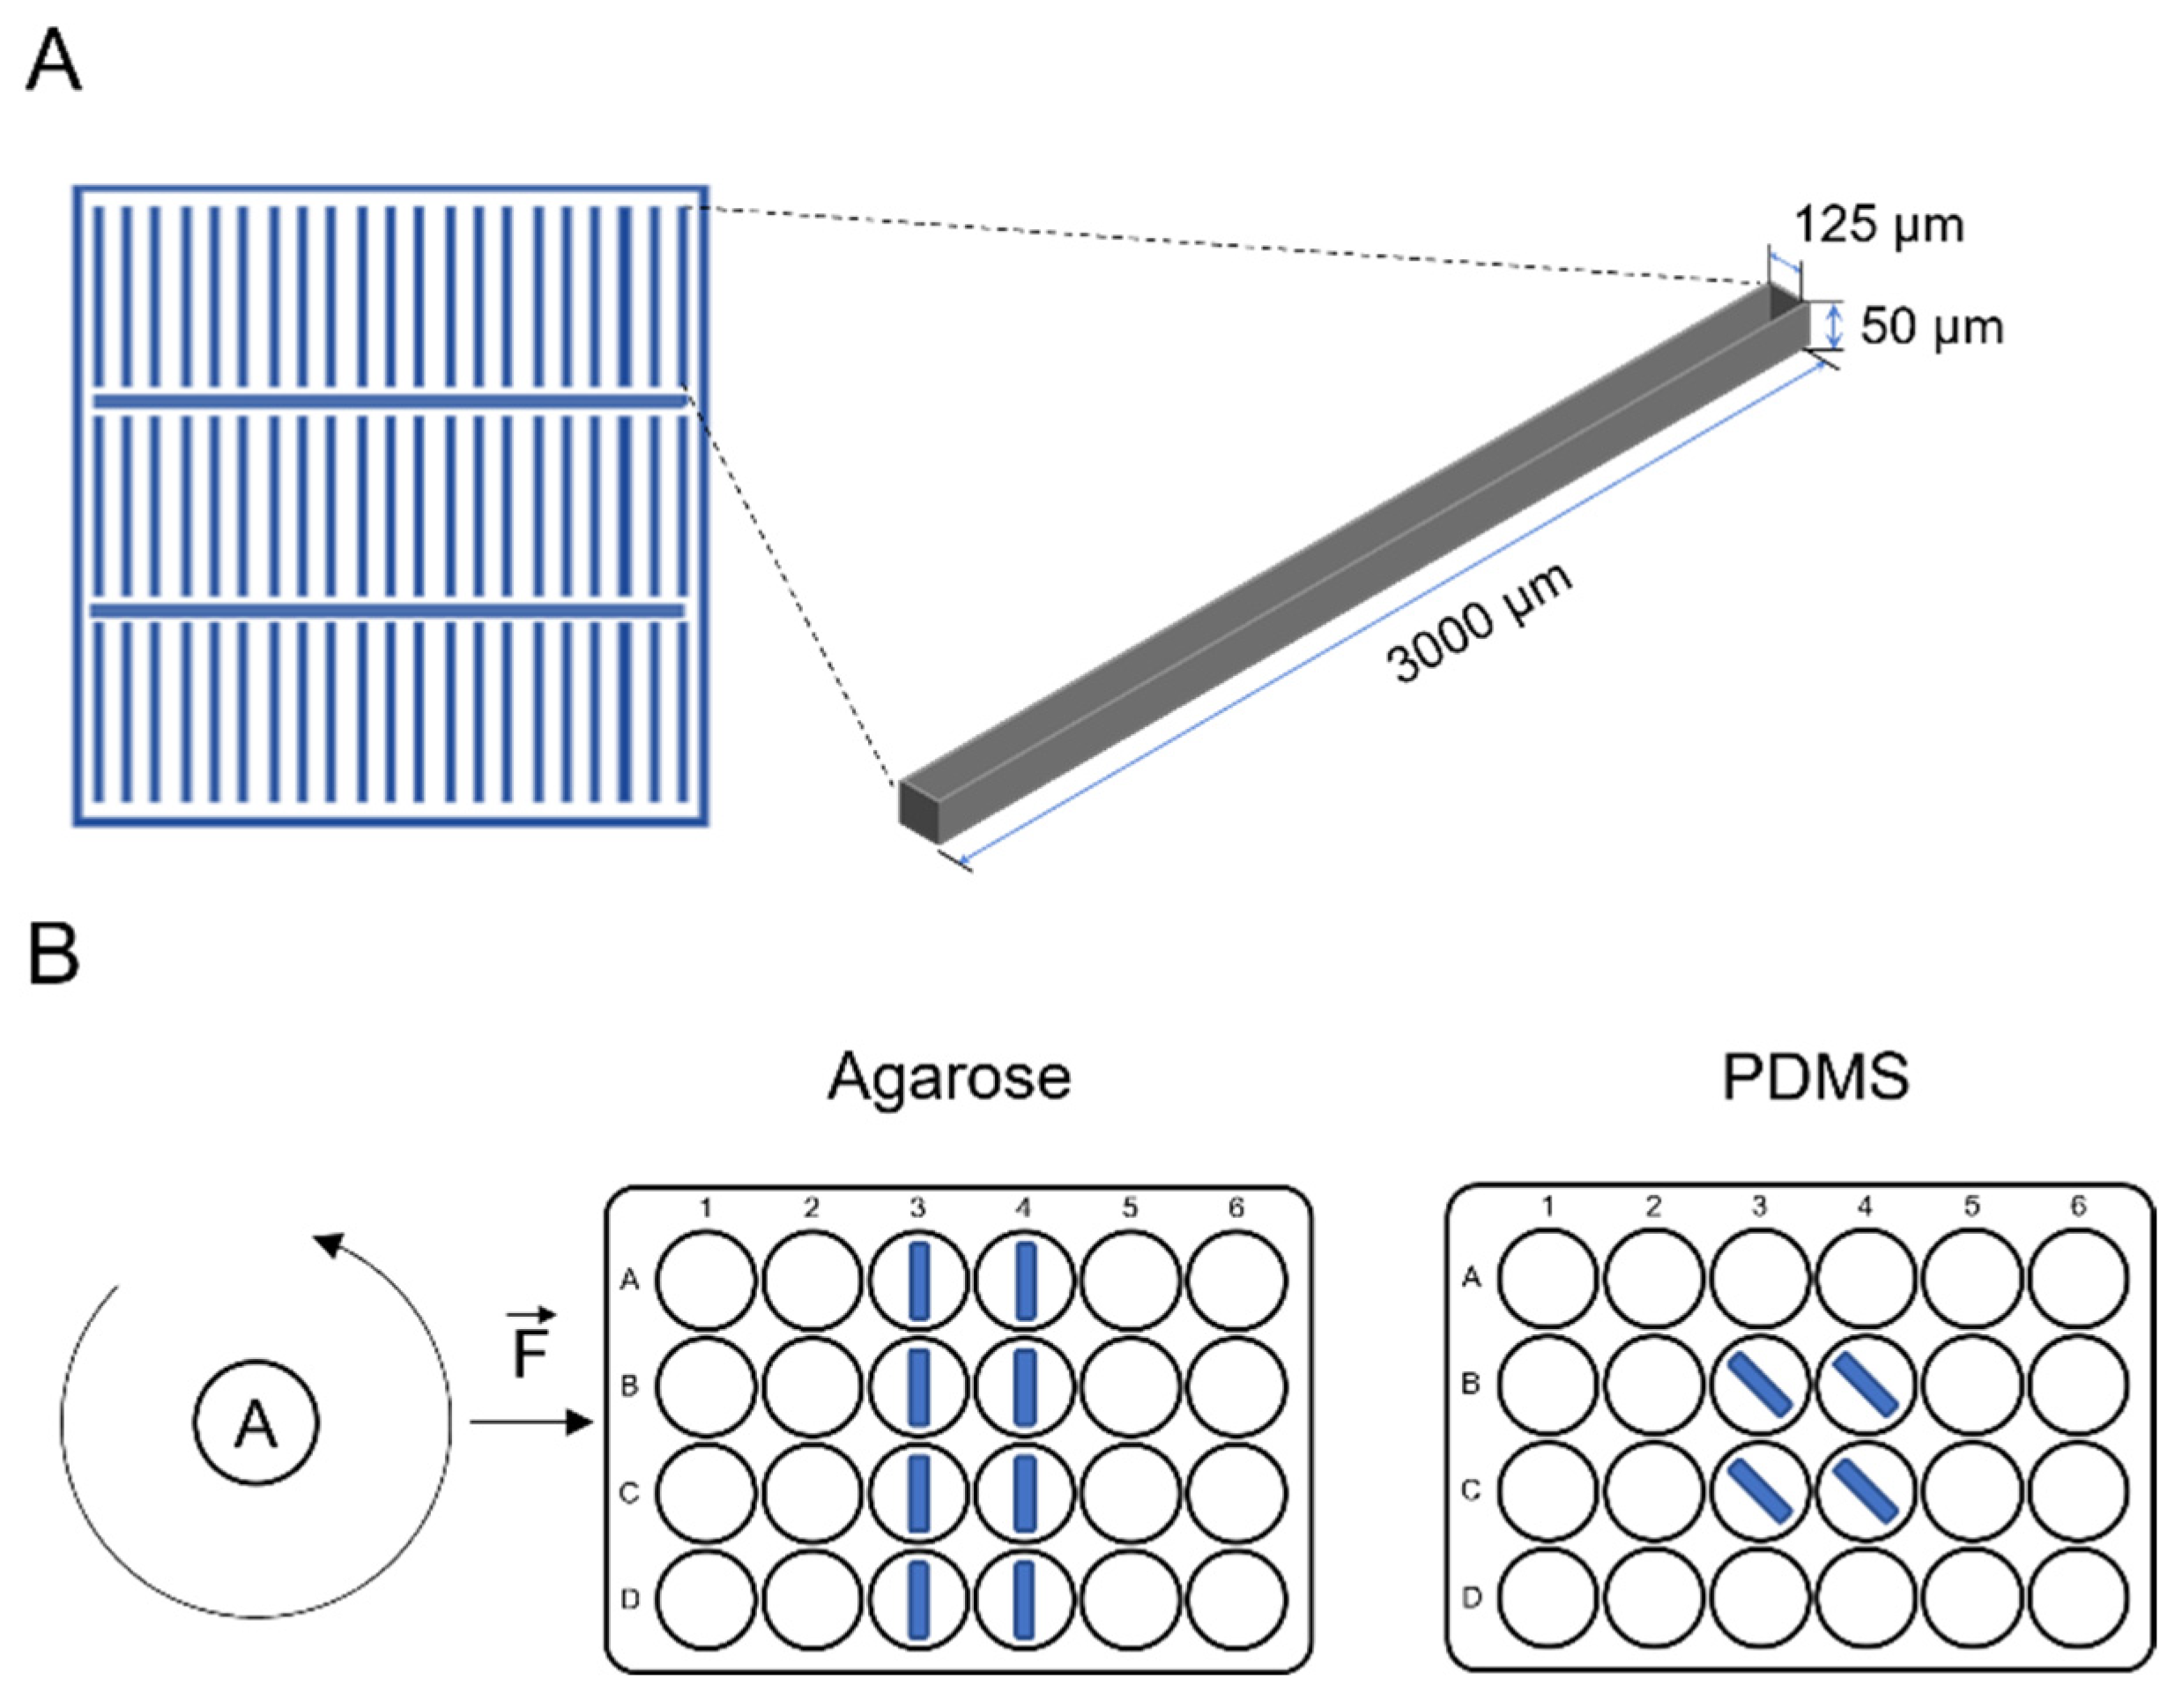
2.2. SU-8 Mold Fabrication

Photocatalytic lithography was used to generate a micropatterned platform (mold) on a SU-8 waver as described previously [11]. Briefly, AutoCad software (Autodesk, San Francisco, CA, USA) was used to design the mold pattern and outline an optical mask. The photomask was printed by CAD/Art Service, Inc. (Bandon, OR, USA). Molds were fabricated with SU-8 2050 (Microchem, Newton, MA, USA) on silicon wafers (Silicon Valley Microelectronics, Inc., Santa Clara, CA, USA). After speed coating the SU-8 on the silicon wafer, the polymer was soft baked at 65 °C for 3 min and then at 95 °C for 7 min. After cooling down, the hardened SU-8 was exposed to UV light through the designed mask using a UV-KUB 2 (KLOE, Saint-Mathieu-de-Tréviers, France), following the manufacturer’s processing guidelines. UV-exposed SU-8 polymerized, and formed the SU-8 mold, while the unexposed region was removed during the development phase. After post-exposure baking (1 min at 65 °C and 6 min at 95 °C), development, and hard-baking (1 h at 200 °C) phases, the mold was ready to use. The mold holds 63 rectangular-shaped patterns sized 125 µm × 3 mm with a depth of 50 µm (Figure 1A).

2.3. Polymer and Agarose Based Micropatterned Mold

Agarose gels were produced with 1, 2, 3, and 5% concentrations of agarose (Sigma-Aldrich, St. Louis, MO, USA) dissolved in culture media (DMEM or MEM/F12) absent of fetal bovine serum (FBS—Sigma Aldritch), under sterile conditions. The agarose was crosslinked by the physical method. It was melted by heating it in a microwave. The melted agarose was then transferred to a 65 °C incubator until the temperature was equilibrated. After cooling to 65 °C, the agarose was transferred to the SU-8 mold, where it polymerized to room temperature during the cooling. Micropatterned gels were removed from the SU-8 based casting mold under sterile conditions in a biosafety cabinet using sterile forceps and a scalpel and immediately used or stored in an air-sealed container at 4 °C.
Micropatterned PDMS polymers were produced using a Silicone Elastomer Kit, SylgardTM 184 Silicone Elastomer (Dow Corning Corp., Midland, MI, USA). The curing agent and the silicone base component were mixed in ratios of 1:5 (one part curing agent and five parts silicone base), 1:10, 1:15, 1:20, and 1:30 and was then homogenized by stirring. Bubbles were removed by exposure of the mixture to a 10% vacuum for 10 min. The polymer mixture was applied to the SU-8 mold and cured at 85 °C for two hours. After polymerization, potential contamination of the micropatterned polymers was removed by washing in 70% ethanol, followed by rinsing in sterile PBS and air drying in a biosafety cabinet.

2.4. Cells and Cell culture

The murine inner medullary collecting duct (mIMCD) cell line was obtained from the American Type Culture Collection (ATCC; Manassas, VA, USA). Cells were cultured in high glucose DMEM/F12 media (Gibco, Invitrogen Corporation, Carlsbad, CA, USA) supplemented with 10% FBS (Sigma-Aldrich) and antibiotics (Pen/Strep, Sigma-Aldrich) in non-pyrogenic-10 cm Petri dishes (Corning, Lowell, MA, USA) at standard conditions (37 °C, 5% CO2 and 100% humidity). Growth media were changed between 48–72 h, and cells were sub-cultured before reaching ~75% confluency.

2.5. Tubular Formation

Dispersed mIMCD cells were suspended in a neutralized collagen I solution and transferred to the micropatterned molds, as described previously [11]. Confluent mIMCD cells were washed with phosphate-buffered saline (PBS) and incubated with 0.05% trypsin/EDTA to detach. Growth media were added to the detached cells and centrifuged at 400× g for 3 min. The cells were resuspended in collagen I solution (2.4%) (BD Bioscience, Bedford, MA, USA) according to the manufacturer’s recommendations. Droplets in the size of 70–100 µL of the mIMCD cells suspended in collagen (12 × 106 cells/mL) were then pipetted onto the micropatterned gels and incubated for 20–30 min at 4 °C to allow the cells to settle into the pattern by gravity. After passive gravity seeding, the micropatterned gels were centrifuged (1200 rpm, 10 min, 4 °C) in a microplate carrier (GS-6R, Beckman Coulter, Fullerton, CA, USA) to force seed mIMCD cells and remove the excess cells in suspension. The optimal centrifugation angle of 90° of the agarose mold patterns relative to the centrifugation axis, and an angle of 45° of the PDMS gels, were established by testing angles 0°, 45°, and 90° (Figure 1B). The seeding procedure and the progress of tubular formation were observed by light microscopy. The micropatterned molds of PDMS and agarose holding mIMCD cells were then transferred via forceps, and each mold was placed into a well of a 12-well plate. After incubation for 15 min at 37 °C to allow polymerization of the neutralized collagen I solution, the molds were carefully submerged in growth media and incubated at standard conditions (37 °C, 5% CO2, 100% humidity).

2.6. Confocal Microscopy

We used an Olympus FV1000 laser confocal fluorescence microscope (Olympus Life Science Solutions, Center Valley, PA, USA) in combination with Olympus Fv10-ASW 0.4 imaging software to generate 3D-stack images from fluorescent stained tubular aggregates. Images (1024 × 1024 pixels) were generated using a 10× objective (NA 1.4) (Olympus) and a sampling speed of 40.00 μs/pixel.
The ZO-1 antibody (Abcam 59720, Abcam, Cambridge, UK) was used in a dilution of 1:200, with anti-rabbit IgG-Alexa 597 conjugated antibody (Abcam) in a dilution of 1:200. Nuclei were stained with DRAQ5 (1:1000).
Z-stack projections of each scanned tubular structure were quantified for ZO-1 expression levels using Fiji—Image J software, Image J2 (Wayne Rasband, National Institute of Health, Kensington, MD, USA).

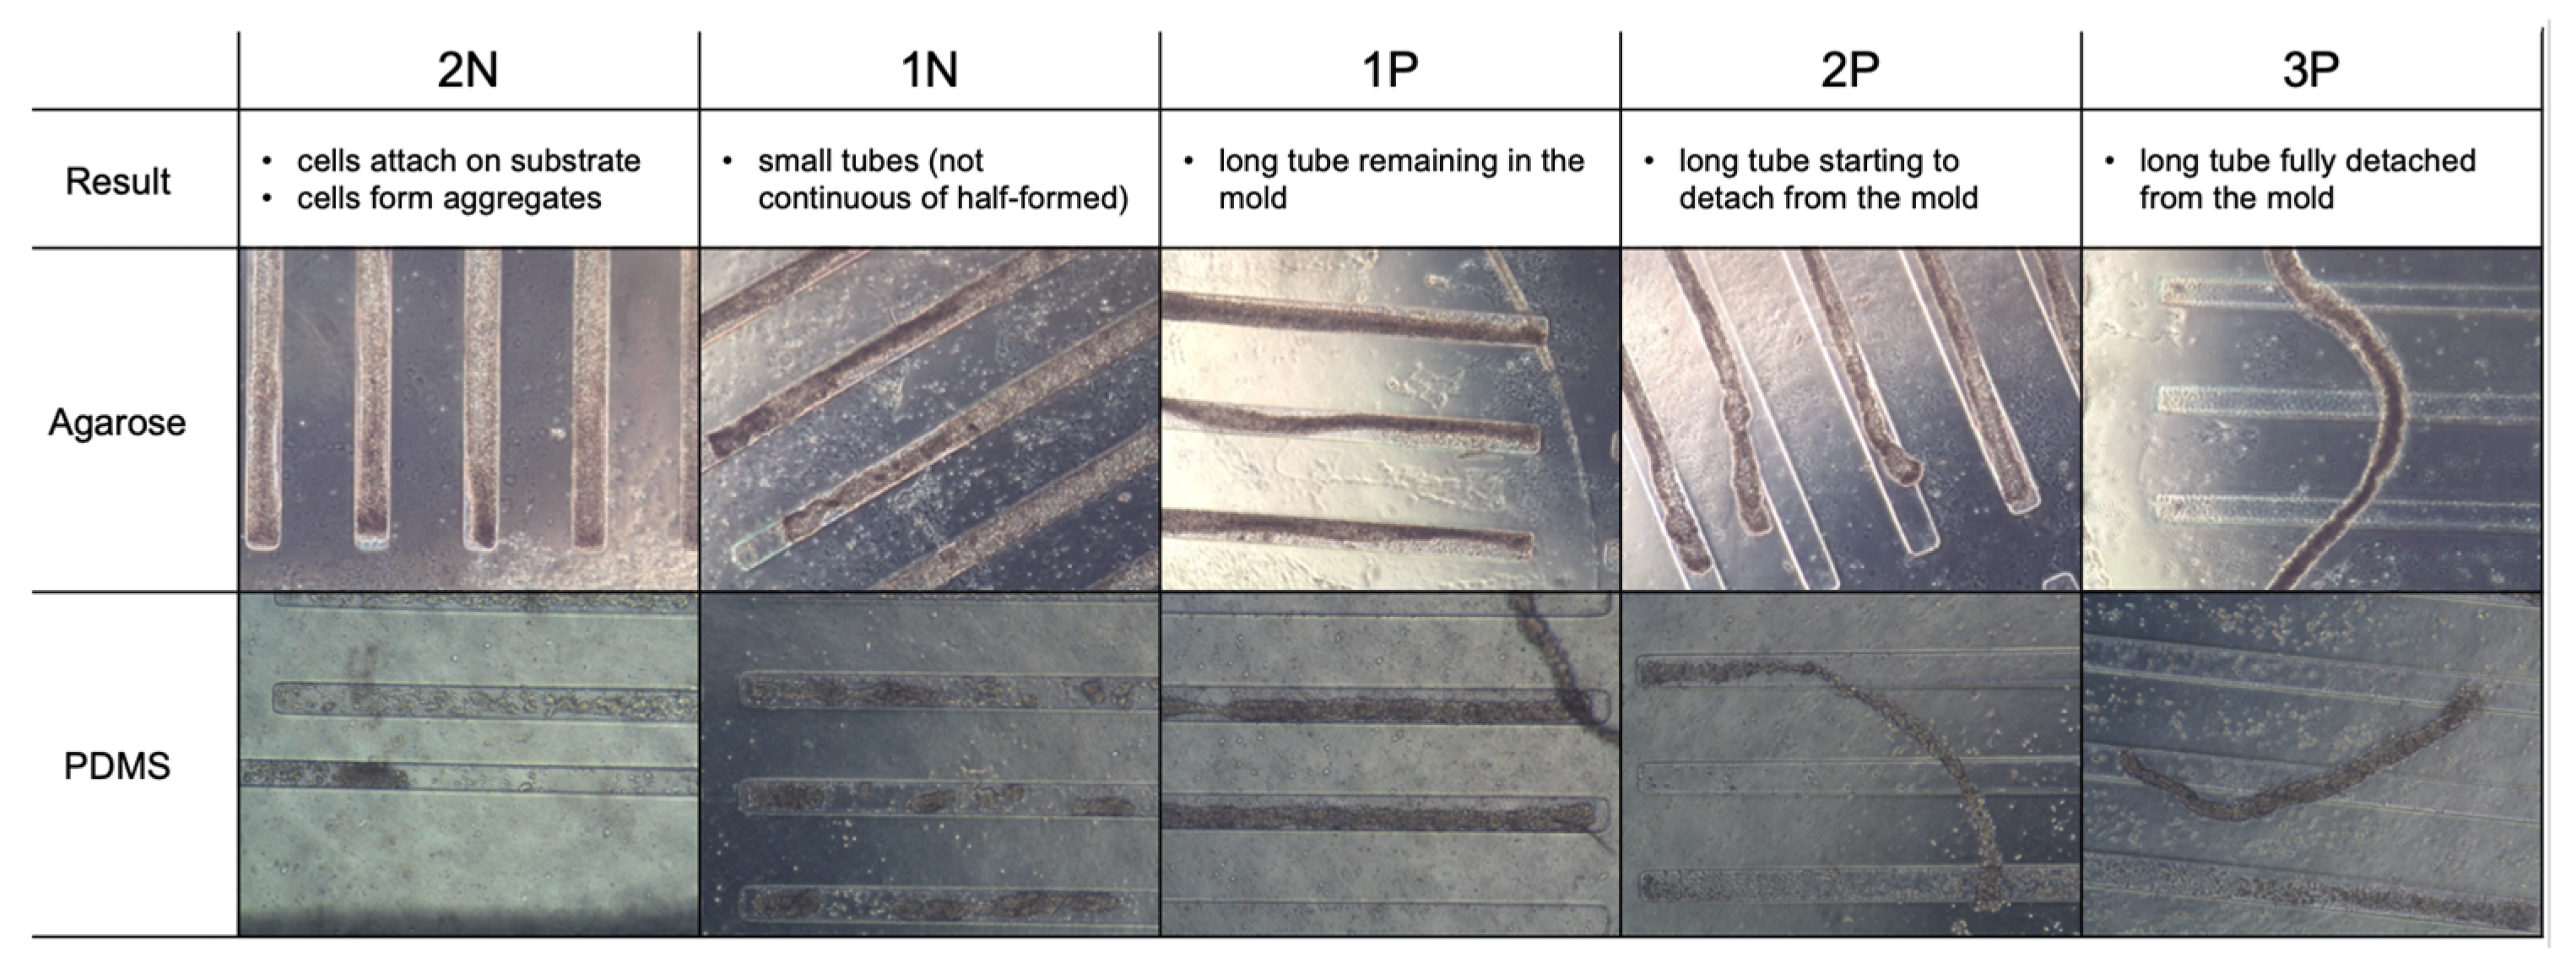
2.7. Scoring of Tubular Formation and Statistic Analysis

The efficiency of tube formation was scored by grades (from low to high) as −− (2N), − (1N), + (1P), ++ (2P), and +++ (3P). For 2N structures, cells grow on a single layer or form small cell aggregates with no tubular shape. For 1N structures, cells form small tubular-shaped aggregates. Those structures do not form one long single tubular structure in each mold. For 1P (+), 2P (++), and 3P (+++), cells form a single long tubular structure in each mold. The degree of maturity of the tubular structures was assessed based on its position in the mold: 1P for structures that remained in the mold, 2P for structures that start to exit from the mold, and 3P for structures outside the mold, based on our previous results [11]. Scoring was performed in a blinded manner. Experiments were repeated at least four times, and the results per gel concentration were given as mean ± standard deviation (SD). Statistical comparisons were made using analysis of variance (ANOVA) for multiple comparisons with the Tukey-Kramer post hoc test for multiple comparisons and the Student’s t-test for paired comparisons. Specifically, ANOVA tests were used to analyze differences between substrate stiffness, and Student’s t-tests were used to compare paired substrates with similar stiffness. A p-value of ≤0.05 was considered significant.

3. Results

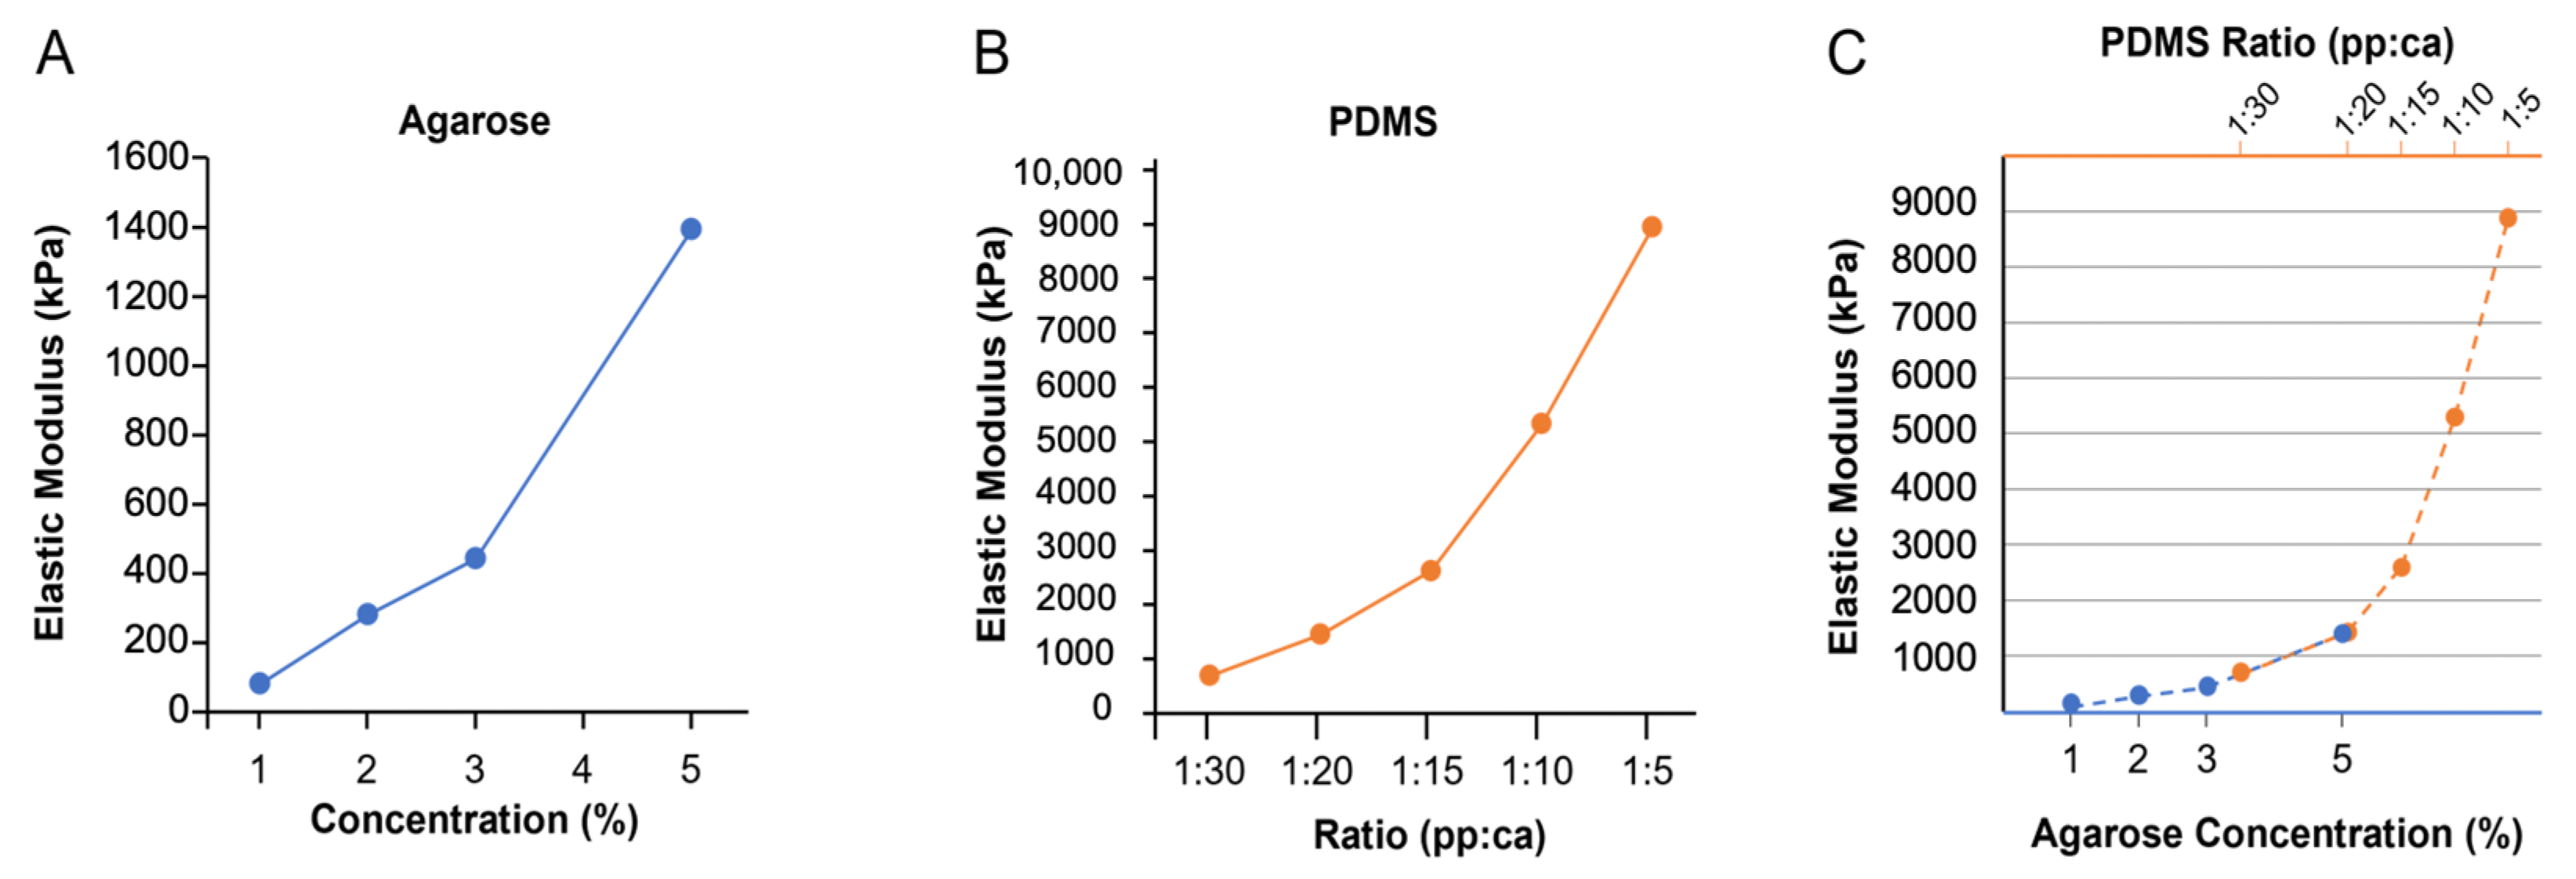
3.1. Polymer Characteristics

The nominal stress-strain relations of the agarose molds are shown in Supplementary Data Figure S2. Measurements of the mechanical properties of the different agarose samples showed an elastic behavior, and the characterization of the Young’s moduli resulted in an average Young’s modulus ranging from 78 kDa to 1388 kDa for agarose gels ranging from 1% to 5% agarose, respectively (Figure 2A), which is in the same range as previously reported [20]. As expected, we observed that Young’s modulus increased exponentially (R2 = 0.9921) with the increase in the percentage of agarose.
The influence of the curing ratio on the compression strength of PDMS is presented in Supplementary Data S2. Measurements of the mechanical properties of the different PDMS samples showed an elastic behavior, and the analysis using the Oliver-Pharr model resulted in an average Young’s modulus ranging from 680 kDa to 8920 kDa for a PDMS ratio of 1:30 and 1:5, respectively (Figure 2B), similar to what was reported previously [21]. As anticipated, the Young’s modulus increases exponentially (R2 = 0.9946) when the Curing Agent: Pre-Polymer ratio decreases. The data also showed a difference in the loading and unloading forces, and large variations in both curves for PDMS ratios of 1:15, 1:20, and 1:30 (Supplementary data Figure S2), which may be due to the increased stickiness of the PDMS at these ratios. The agarose substrates of 3% and 5% exhibit similar mechanical properties as PDMS generated in 1:30 and 1:20, as observed by overlapping elastic moduli (Figure 2C).

3.2. Cell Seeding

We tested different angles to optimize the seeding process. The results showed that centrifugation angles of 90° for the agarose and 45° for PDMS mold patterns, relative to the centrifugation axis are optimal for cell seeding (Figure 1B and Figure S3).

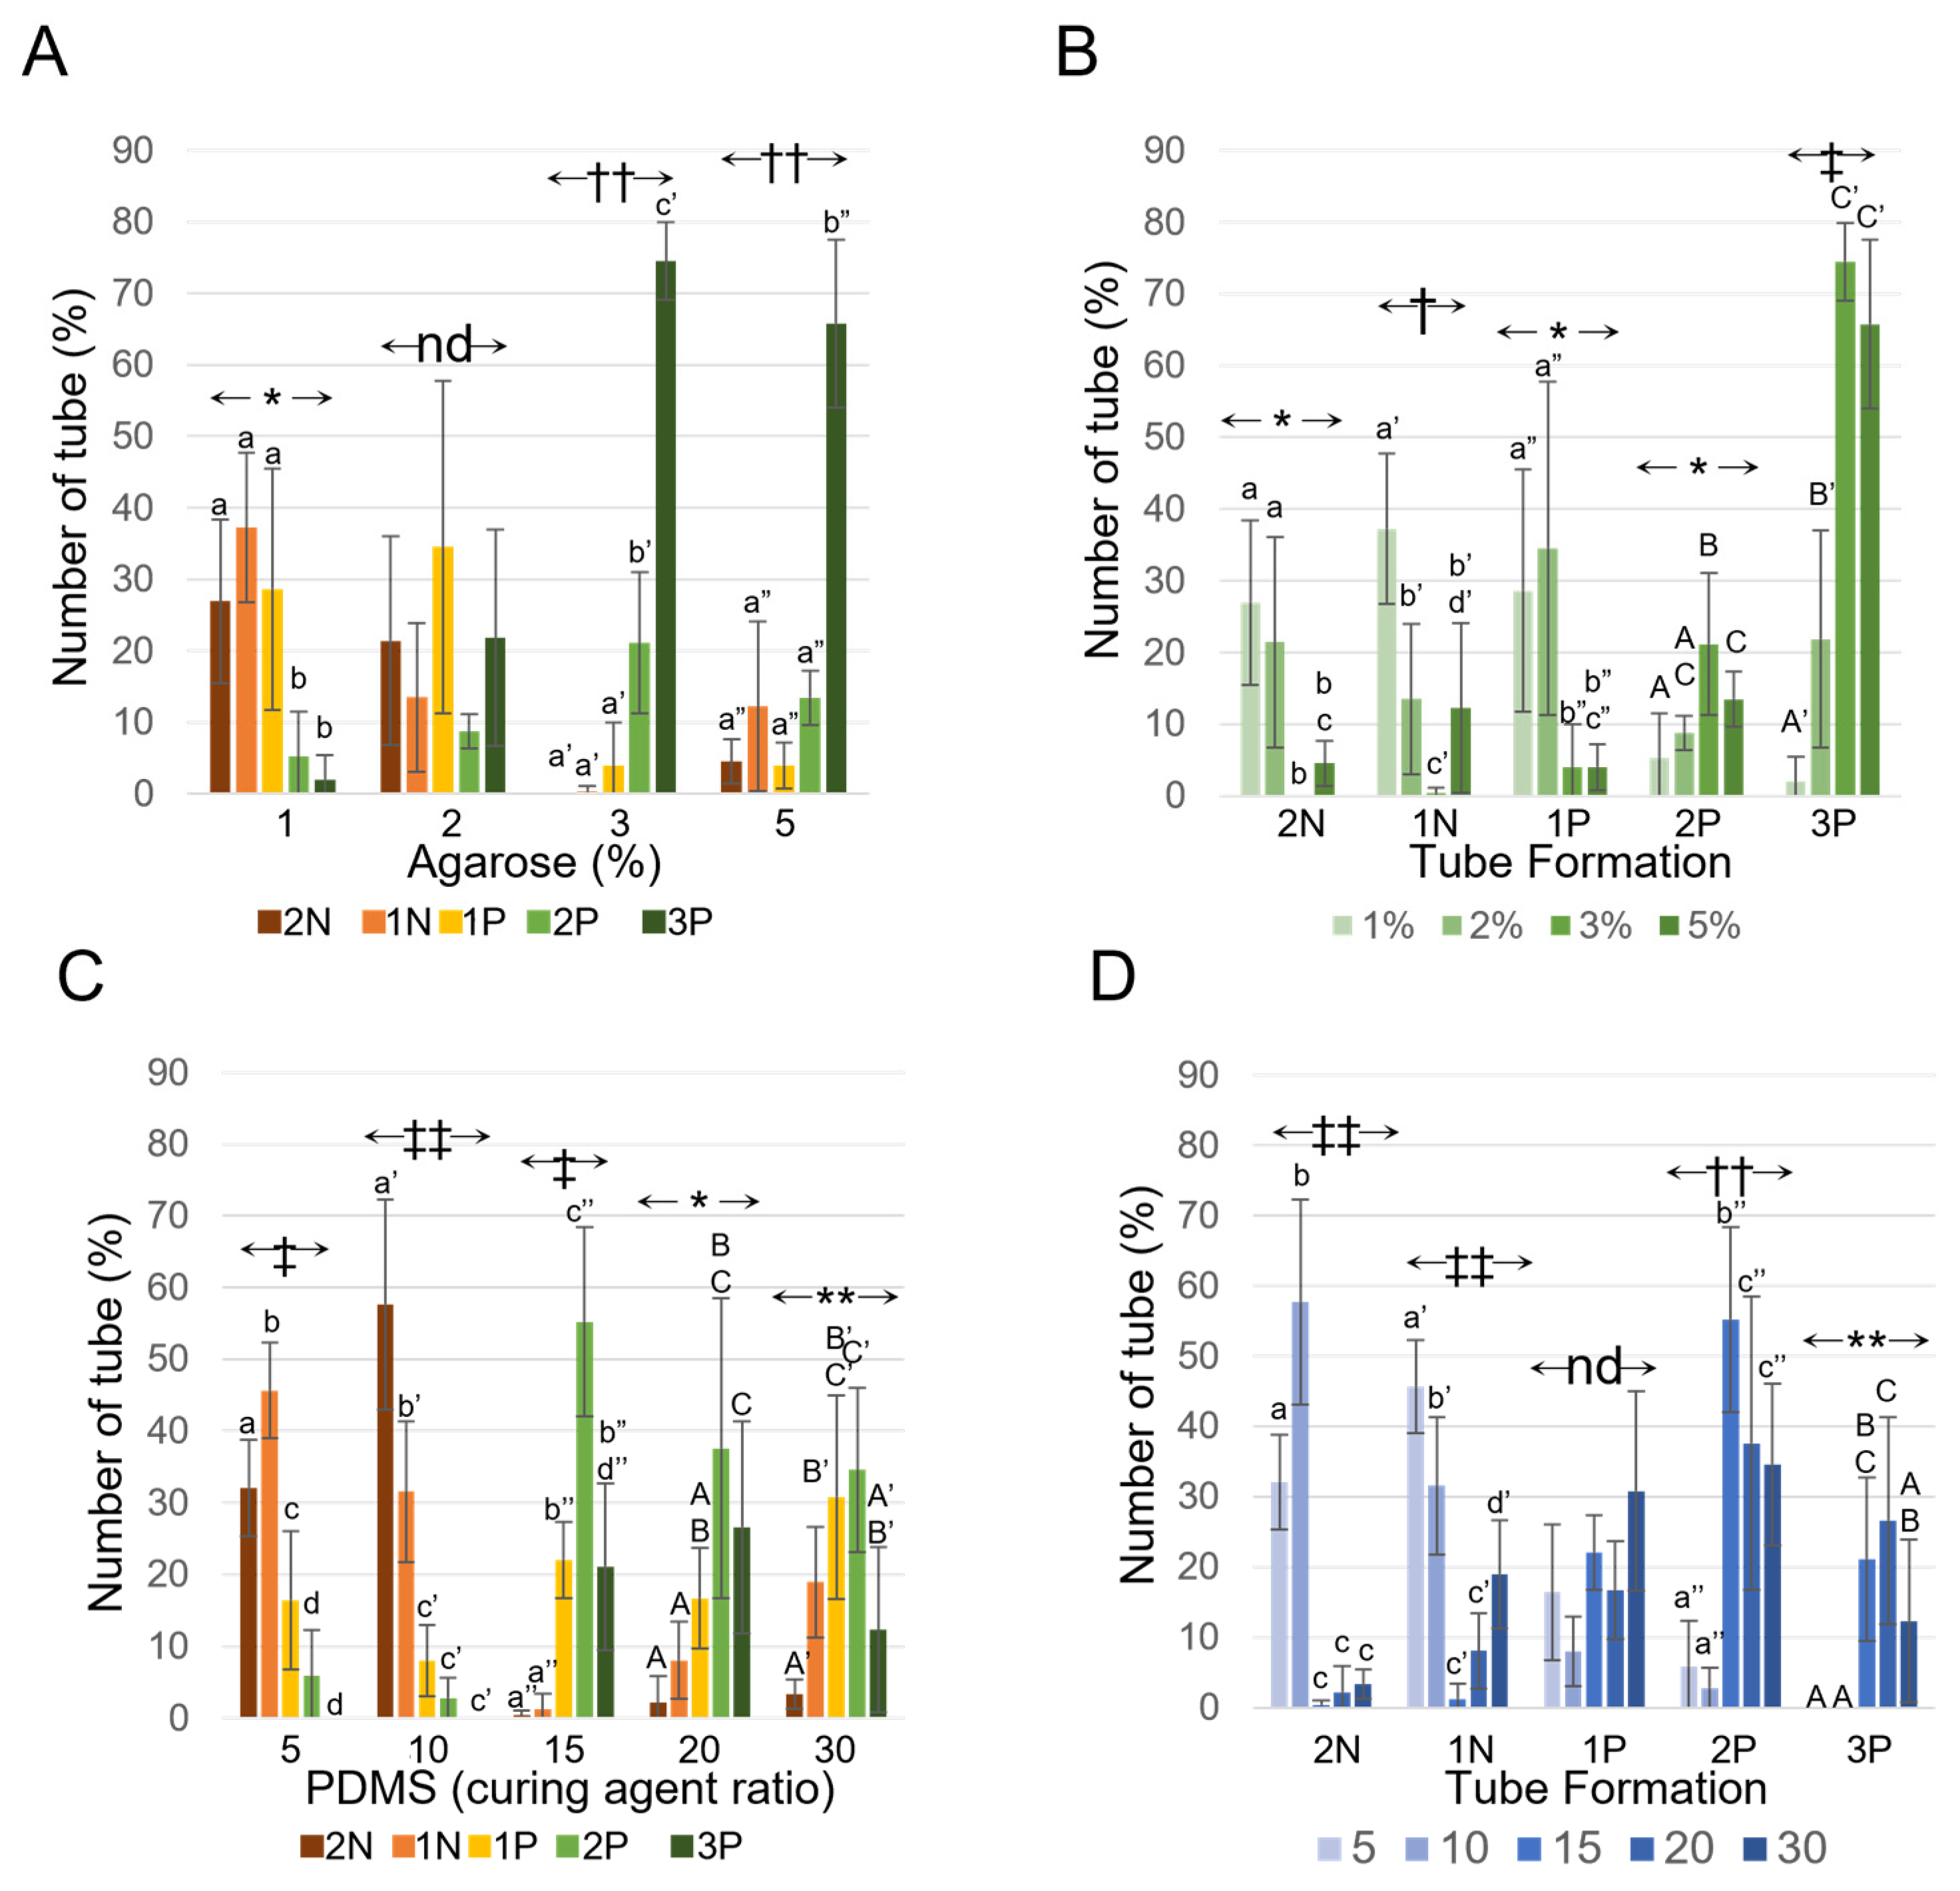
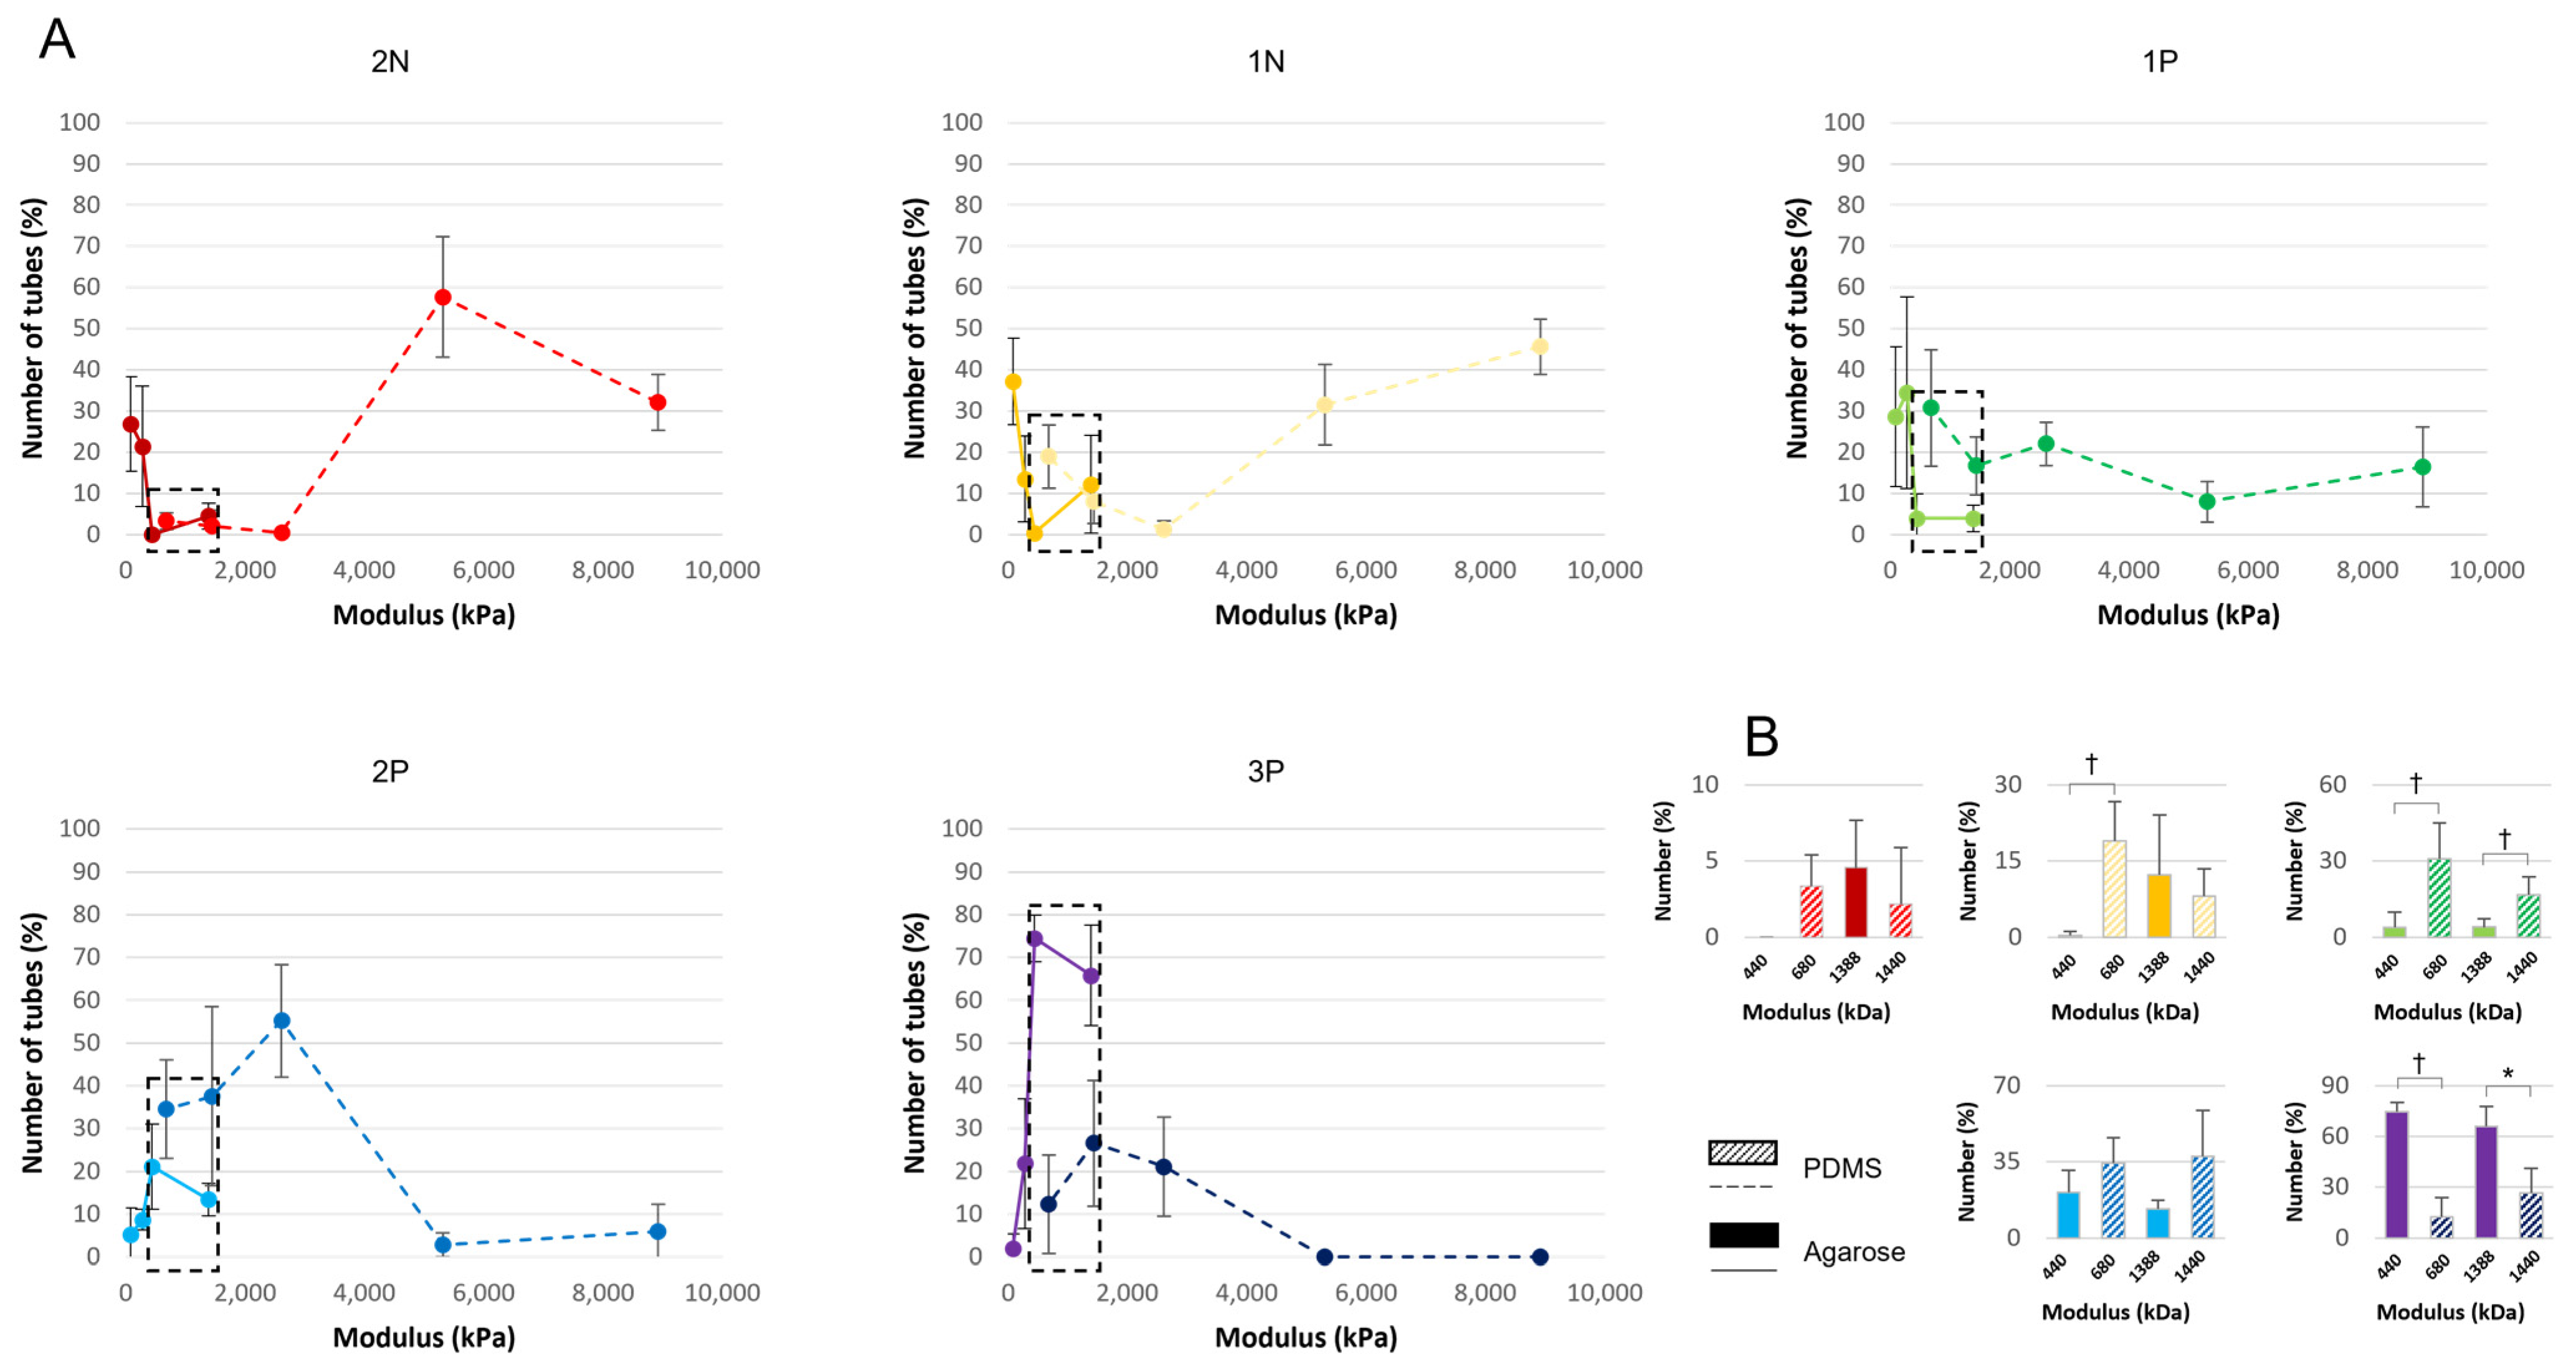
3.3. Tube Formation on Agarose

After 24 h of culture, the tubular formation was scored according to the categories listed in Figure 3, following our previous findings [11]. Figure 4A,B illustrates the percentage of tubes in the function of the agarose concentrations. We observed that better tube formation (2P and 3P) occurred in the agarose mold with higher concentrations (3% and 5%), while either no tubes or small tubes (2N and N) formed in agarose with the lowest concentrations (1%), and no significant differences were observed between the different tube status in 2% agarose molds. When agarose concentration increases, we observed that the number of 2N tubes remained constant (no significant difference) at lower concentrations (1% and 2%) but dramatically decreased at concentrations between 2% and 3% and remained low at concentrations between 3% and 5%. Similarly, the number of N tubes rapidly decreased (from 1% to 2%), and remained low when the agarose concentration increased (from 2% to 5%). We did not observe significant differences in the number of tubes remaining in the mold (P tubes) at low concentrations (1% and 2%, 28.6% and 34.5%, respectively) and high concentrations (3% agarose and 5% agarose, 4% both). However, differences between both groups were significant. The number of 2P tube formations increased and then decreased with stiffness, with a peak at 3% agarose (21%). The percentage of 3P tubes quickly increased with the agarose concentration from 2 ± 3.4% (on agarose 1% mold) to reach 74.5 ± 5.4% on 3% agarose mold, and remained constant (65.8 ± 11.7%, with no significant difference between 3% and 5%).

3.4. Tube Formation on PDMS

After 24 h of culture, the tubular formation was scored according to the categories listed in Figure 3, following our previous findings [11]. Figure 4C,D illustrates the percentage of tubes in function of the PDMS ratio. We observed that the number of 2N tubes is maximal when cells are cultured at a conventional PDMS ratio (1:10; 57.7 ± 14.6%). The percentage of 2N tubes decreases when the PDMS ratio was decreased (1:5; 32.1 ± 6.7%) or increased (1:15, 1:20, 1:30; 0.4 ± 0.7%, 2.2 ± 3.7%, and 3.3 ± 2.0%, respectively). However, the percentage was significantly lower when the ratio was higher than when the ratio was lower. In addition, no significant differences were observed in the higher PDMS ratio (1:15, 1:20, and 1:30). Interestingly, N tube percentages were also higher on the lower PDMS ratio (1:5 and 1:10) than on higher ratios (1:15, 1:20, and 1:30). However, we noticed that the percentage, which was the lowest on 1:15 PDMS molds, increased with the ratio (from 1.3 ± 2.2% to 19.0 ± 7.7% for 1:15 and 1:30 ratio, respectively). Percentages of P tubes were consistent through the different PDMS conditions, and no significant difference was observed. Both 2P and 3P tubes were more numerous on higher PDMS ratio molds (55.2 ± 13.2%, 37.6 ± 20.9%, and 34.6 ± 11.5% for 1:15, 1:20, and 1:30 ratios, respectively, and 21.1 ± 11.6%, 26.6 ± 14.7%, and 12.3 ± 11.5% 3P tubes for 1:15, 1:20, and 1:30 ratios, respectively) compared to lower ratios (5.9 ± 6.4% and 2.8 ± 2.8% 2P for 1:5 and 1:10 ratios, respectively) where no 3P tubes were observed. Statistical analyses indicate that the number of 2P tubes remains constant and low for lower PDMS ratios, increasing with the PDMS ratio with a maximum value for PDMS 1:15. Fully formed tubes (3P) were not observed on stiff substrates (1:5 and 1:10 ratios), but were observed on softer substrates (1:15, 1:20, and 1:30). However, a significant decrease was observed between the highest ratio (1:30) and the lower ratio (1:5, 1:10, and 1:20).

3.5. Comparison of Both Materials with Similar Stiffness

We compared the percentages of formed tubes on agarose molds and PDMS molds with similar Elastic moduli, i.e., 3% (440 kDa) and 5% (1388 kDa) agarose and 1:30 (680 kDa) and 1:20 (1440 kDa) PDMS (Figure 5). When comparing 3% agarose and 1:30 PDMS, no significant differences were observed for 2N tubes and 2P tubes formation, but significant differences were observed for N tubes (p < 0.05), P tubes (p < 0.05), and 3P tubes (p < 0.001). When comparing 5% agarose and 1:20 PDMS, no significant differences were observed for 2N, N, and 2P tubes. Differences were observed for P tubes (p < 0.05) and 3P tubes (p < 0.005).

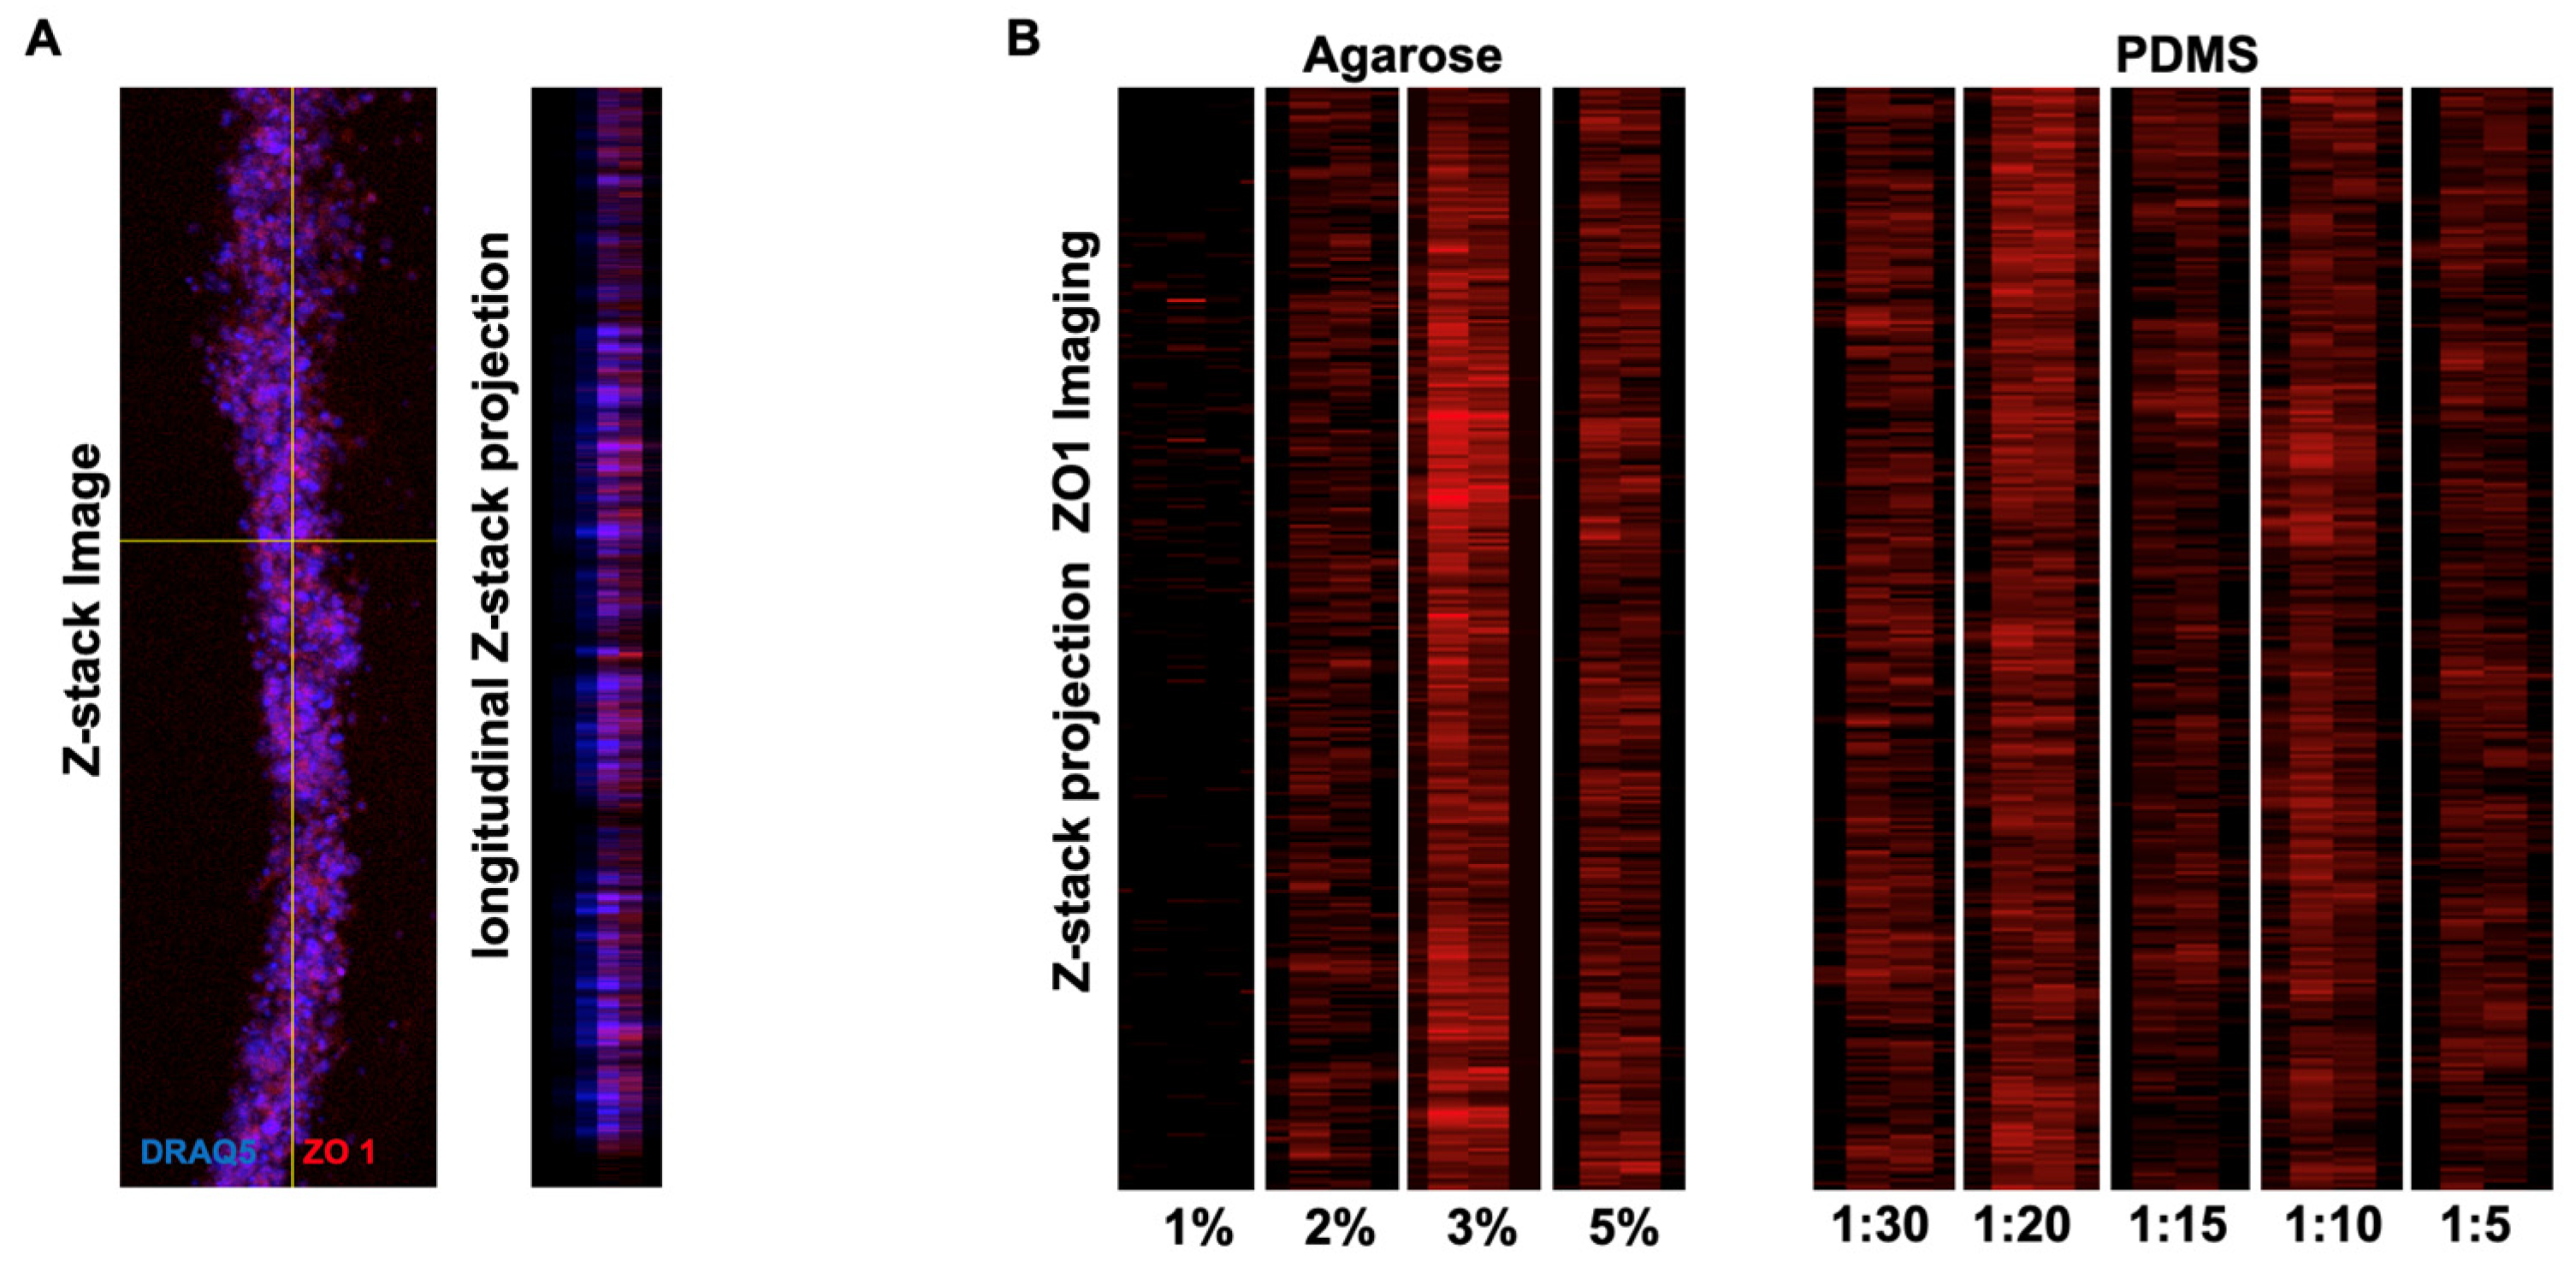
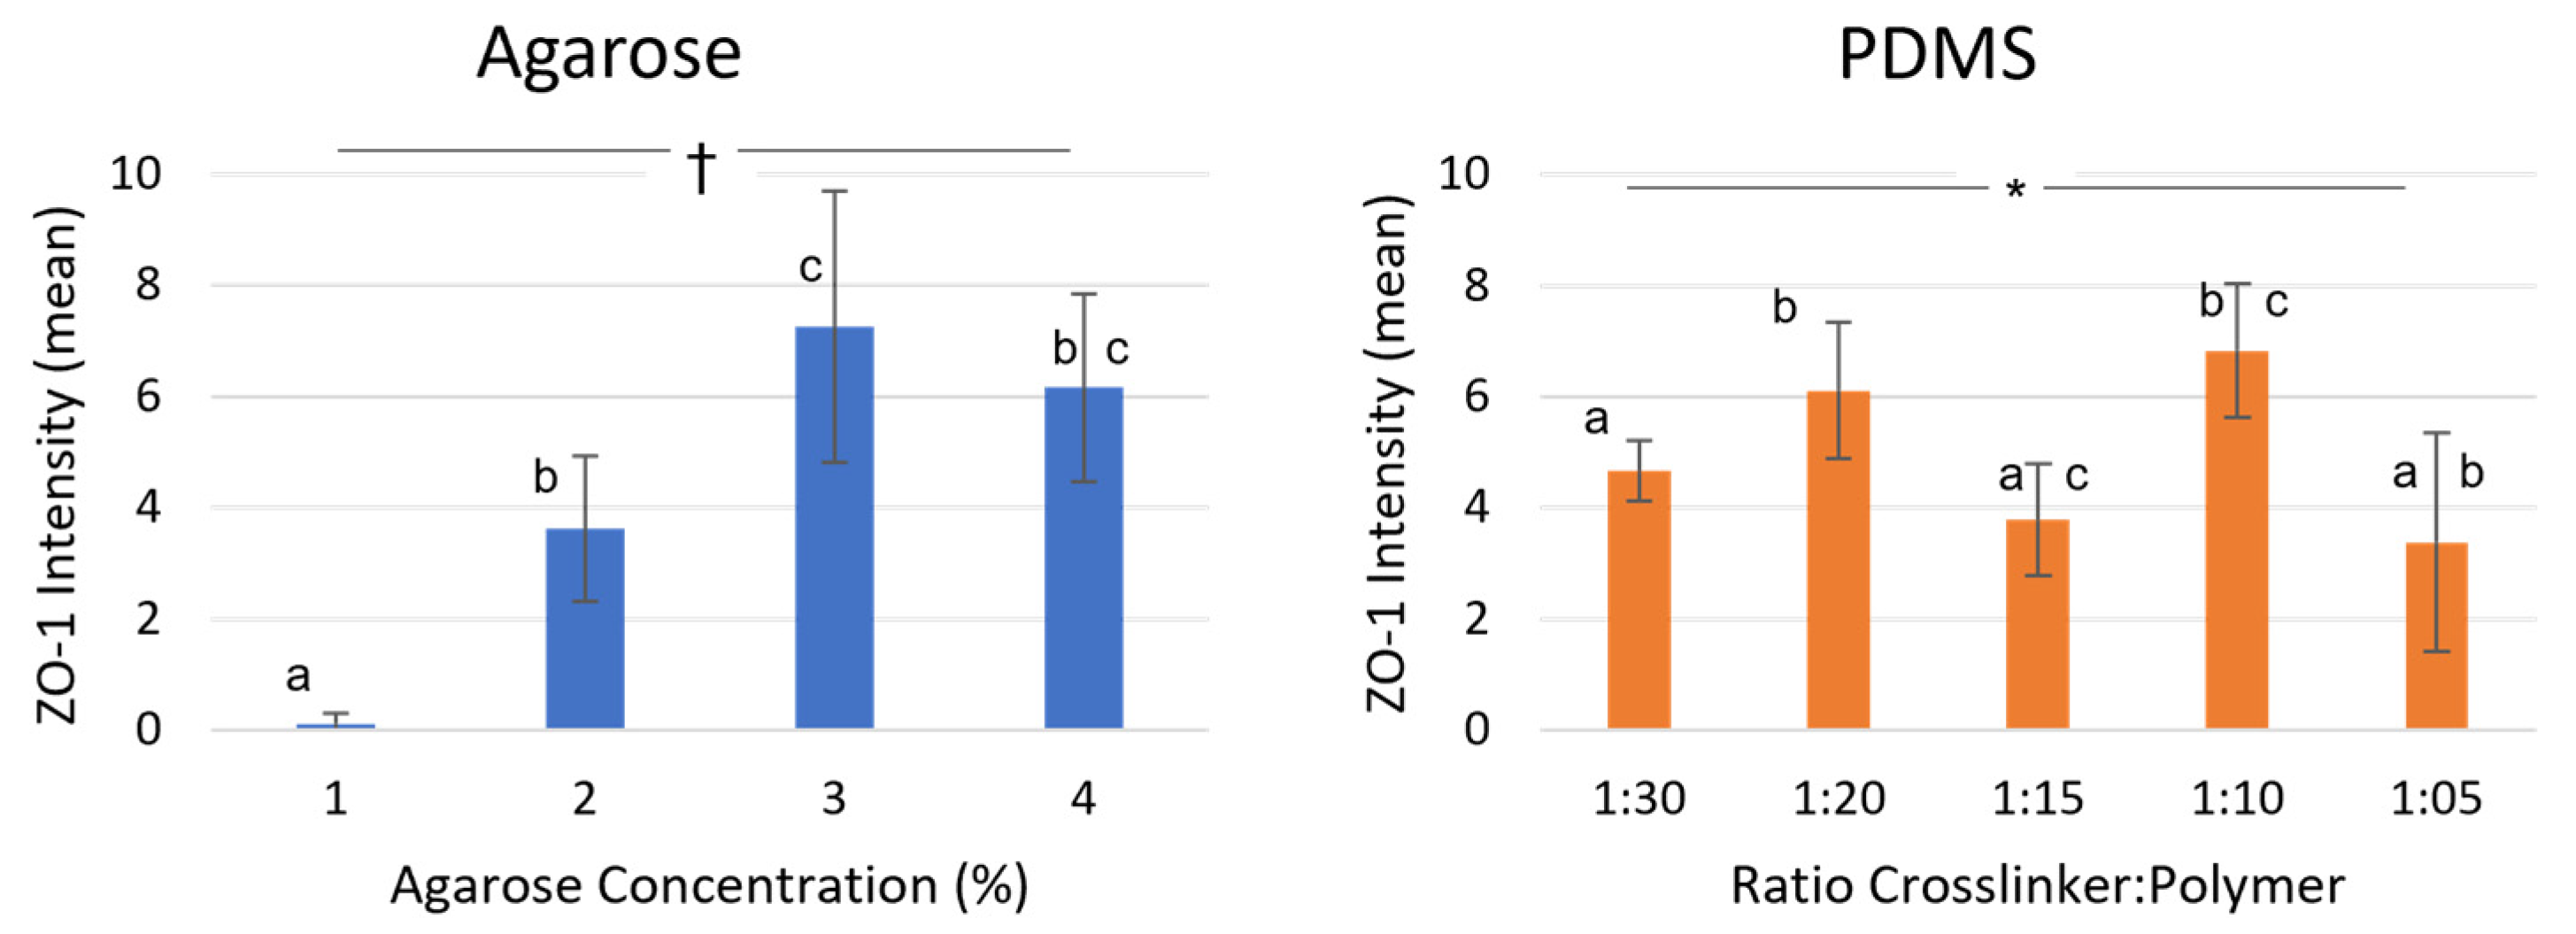
3.6. Polarization Marker

To see if improved tube formation is correlated with a change in the expression of polarization markers, we stained tubes generated on agarose (1, 2, 3, and 5%) or PDMS (1:5, 1:10, 1:15, 1:20, and 1:30) for Zonula occludens 1 (ZO-1). ZO-1 is an apical polarization marker and a prerequisite for tubular lumen formation [22]. To compare the expression levels of ZO 1 in the tubes, we scanned the stained tubes with a confocal microscope and quantified the longitudinal Z-stack projections using Image J software 1.52 (Figure 6). Comparing the mean intensity values (n = 5) of each condition, we found that tubes generated on different agarose concentrations showed significantly different expression levels. Tubes generated on 1% agarose showed a very low ZO-1 expression level, significantly different from 2, 3, and 5%. In addition, the expression of ZO-1 in tubes from 3% agarose was significantly different from the ZO-1 expression on 2% agarose. Tubes from 3% agarose showed the highest ZO-1 expression levels.
Significant differences of ZO-1 expression levels were also found in tubes cultured on the PDMS substrate. The expression of ZO-1 was significantly different in tubes from 1:30 compared to tubes from 1:20 and 1:10. Tubes generated in PDMS 1:20 were significantly different from those generated in PDMS 1:15. Tubes cultured on 1:10 PDMS exhibited the strongest ZO-1 expression (Figure 7).

4. Discussion

In this work, we report the generation of tubular structures in micropatterned gels with different elastic moduli or stiffness. Tubular structures are basic in most organs and tissues, such as blood vessels, lungs, and urogenital and digestive systems. Therefore, the capacity to create tubular structures is critical for the bottom-up approach of tissue engineering, which aims to develop basic structures and combine them to create more complex in vivo-like tissues.
We previously demonstrated that tube structures could be constructed successfully using micropatterned molds [11]. To see if we can further improve the ratio of formed tubular structures, we investigated tubular formation depending on the substrate stiffness.
Native tissues and organs, as well as ECM molecules in vivo, possess different degrees of stiffness [23], from 200 Pa to 2–4 GPa [24], and 1 MPa to 4 GPa [23], respectively. The stiffness of tissues and basement membranes is an essential mechanical factor that can influence the phenotype of a cell in vitro [25,26], and it has been shown to have a role in morphogenesis in vivo [27,28]. Basement membrane stiffness has recently been suggested to be a critical factor in organ development, homeostasis, aging, and diseases [29], such as metastasis [30].
Our current work investigated the influence of matrix stiffness on tube formation by using micropatterned molds that we previously developed for tube formation [11]. We also tested the difference between two substrates, i.e., PDMS and agarose. Changing the fabrication process allowed us to test a range of substrates with an elastic modulus between 79 kPa to 8.9 MPa (Figure 2).
We observed that stiffness influences tubular structure formation on both agarose and PDMS molds. Similar to our previous observation, the aggregate starts forming from one end of the micropatterned molds, independently of the substrate stiffness [11]. When cultured in PDMS molds, the percentage of formed tubes is greater when tubes were cultured in molds with a higher PDMS ratio (1:15, 1:20, and 1:30), i.e., a lower elastic modulus, than in molds with a lower PDMS ratio (1:5, and 1:10), i.e., a higher elastic modulus. When cultured in agarose-based micropatterned molds, the rate of tube formation was found to be positively correlated with agarose concentrations, and therefore stiffness, with optimal agarose concentrations, is best at 3% and 5%. Our results are in accordance with results previously reported in a study showing that stiffness regulated the tubulogenesis of lymphatic tubes and components of the vascular system [19,31].
Comparing the rate of tube formation on agarose and on PDMS, we observed that mIMCD cells show optimal tube formation on substrates, with a stiffness ranging between 277 kPa and 2610 kPa. Cells cultured outside this stiffness range failed to form tubes. Our results could be explained by previous results showing that matrix stiffness seems to regulate tubular cell polarization and proliferation [32], as well as tissue morphogenesis correction [28].
In our experiments, we found that the percentage of fully formed tubes was highest on agarose with an elastic modulus of 439.9 kPa (Figure 5A). Comparing this value to elastic moduli measured in native tissue, we found that this value is similar to the elastic modulus of the kidney tubular basement membrane (BM) (438 ± 54 kPa) [33]. Crest et al. demonstrated that the tubular BM possesses an instructive potential for tissue elongation [34]. Interestingly, our results differ from those of Hagelaars et al. who observed the apical-basal polarization of Madin Darby Canine Kidney cells (MDCK) at a sub-physiological substrate stiffness of 1 kPa, while polarization was absent at supraphysiological conditions of >10 kPa [35]. Although not specified in their paper, we suppose that they referred to the stiffness of the macroscale kidney (7 kPa) [36].
How stiffness influences cell behavior remains difficult to determine, because the biomaterial potentially contributes to a certain behavior. To test if a specific material or stiffness promotes earlier ZO-1 expression (a marker for tube maturation) than another, we stained ZO-1 in 1P tubes, which, in our grading system, correspond to the earliest and lowest tube maturation stage. We observed differences in the expression of ZO-1, a marker for tube maturation [22], in 1P tubes, depending on the culture substrate. When cultured on agarose, we observed that ZO-1 expression increases with the agarose concentration up to 3%, and then decreases (5%—Figure 6. When compared to the number of 2P and 3P tubes (Figure 4), we observed a similar evolution in function of the agarose concentration, suggesting that the stiffness influences ZO-1 expression, which, in return, influences the number of mature tubes. However, when cultured on PDMS, the PDMS ratio has less influence on the ZO-1 expression, and few differences were observed in the expression intensity of ZO-1 in the function of the PDMS ratio. In addition, no similarity could be found when comparing the quality of tube maturation, as shown by the ZO-1 expression (Figure 6), and the number of mature tubes (2P and 3P), as shown in Figure 5. This suggests to us that PDMS influences tube maturation through other mechanisms that occur after ZO-1 expression and that have yet to be identified. In addition, stiffness, which is different depending on the observation level (molecular, tissue, organ) [23], seems to affect cell behavior on those different levels (molecular, tissue, organ), which could explain the differences between our findings and the findings of Hagelaar et al. [35].
Our results are in accordance with those of others. However, while previous research showed that cell differentiation, growth [32,37], and morphogenesis [19,31] are influenced by the stiffness of ECM, our current study suggests that stiffness alone is not the sole factor influencing tubulogenesis in our system. When comparing tube formation on agarose and PDMS molds with similar stiffness, i.e., agarose 3% vs. PDMS 1:30 (439.9 kPa and 680 kPa, respectively) and agarose 5% vs. PDMS 1:20 (1388.2 kPa and 1440 kPa, respectively), significant differences were observed for the formation of 1N, 1P, and 3P tubes. These differences suggest that the composition of the substrate further influences tubulogenesis. Although we can hypothesize that differences in cell or protein attachment onto the substrate or the presence of culture medium components in the agarose gel may have an influence, further experiments will be needed to determine additional factors that influence tubular formation.

5. Conclusions

In this paper, we demonstrated that substrate stiffness is important for controlling tube formation. Further experiments are needed to delineate how the stiffness of substrates, that show limited or no cell adhesive properties [38,39], can influence tube morphogenesis, and to clarify the cellular receptors or ligands involved in this process.

Supplementary Materials

The following supporting information can be downloaded at: https://www.mdpi.com/article/10.3390/app13074510/s1, Figure S1: Nominal Stress-Strain Curve for agarose; Figure S2: Force Displacement Plots for PDMS; Figure S3: Cell seeding based on PDMS mold orientation during centrifugation.

Author Contributions

Conceptualization, M.H. and P.V.H.; methodology, M.H., Y.C., P.S., V.G., L.J. and P.V.H.; formal analysis, M.H., Y.C., P.S., V.G., L.J. and P.V.H.; data curation, M.H., Y.C., P.S., V.G., L.J. and P.V.H.; writing—original draft preparation, M.H. and P.V.H.; writing—review and editing, M.H., Y.C., P.S., H.-M.C., V.G., L.J., N.Y. and P.V.H.; resources, M.H., Y.C., P.S., H.-M.C., V.G., L.J. and P.V.H.; supervision, M.H. and P.V.H.; project administration, M.H., N.Y. and P.V.H.; funding acquisition, N.Y. and P.V.H. All authors have read and agreed to the published version of the manuscript.

Funding

This study was supported with funding from the Chau-Li Foundation (to N.Y.) and GLAVREF from various donor funds (to P.V.H.).

Institutional Review Board Statement

Not applicable.

Informed Consent Statement

Not applicable.

Data Availability Statement

Not applicable.

Conflicts of Interest

The authors declare that they have no conflict of interest.

References

  1. Moharamzadeh, K.; Colley, H.; Hearnden, V.; Murdoch, C. 15-Tissue-engineered models of oral soft tissue diseases. In Biomaterials for Oral and Dental Tissue Engineering; Tayebi, L., Moharamzadeh, K., Eds.; Woodhead Publishing: Sawston, UK, 2017; pp. 245–255. [Google Scholar] [CrossRef]
  2. Williams, J.K.; Yoo, J.J.; Atala, A. Chapter 59-Regenerative Medicine Approaches for Tissue Engineered Heart Valves. In Principles of Regenerative Medicine, 3rd ed.; Atala, A., Lanza, R., Mikos, A.G., Nerem, R., Eds.; Academic Press: Boston, MA, USA, 2019; pp. 1041–1058. [Google Scholar] [CrossRef]
  3. Tan, J.K.H.; Watanabe, T. Chapter 5-Artificial Engineering of Secondary Lymphoid Organs. In Advances in Immunology; Alt, F.W., Ed.; Academic Press: Cambridge, MA, USA, 2010; pp. 131–157. [Google Scholar] [CrossRef]
  4. Nelson, W.J. Tube morphogenesis: Closure, but many openings remain. Trends Cell Biol. 2003, 13, 615–621. [Google Scholar] [CrossRef] [PubMed] [Green Version]
  5. Marciano, D.K. A holey pursuit: Lumen formation in the developing kidney. Pediatr. Nephrol. Berl. Ger. 2017, 32, 7–20. [Google Scholar] [CrossRef] [PubMed] [Green Version]
  6. Schlüter, M.A.; Margolis, B. Apical Lumen Formation in Renal Epithelia. J. Am. Soc. Nephrol. 2009, 20, 1444. [Google Scholar] [CrossRef] [PubMed] [Green Version]
  7. Yang, Z.; Zimmerman, S.; Brakeman, P.R.; Beaudoin, G.M., 3rd; Reichardt, L.F.; Marciano, D.K. De novo lumen formation and elongation in the developing nephron: A central role for afadin in apical polarity. Dev. Camb. Engl. 2013, 140, 1774–1784. [Google Scholar] [CrossRef] [Green Version]
  8. Orabi, H.; AbouShwareb, T.; Zhang, Y.; Yoo, J.J.; Atala, A. Cell-seeded tubularized scaffolds for reconstruction of long urethral defects: A preclinical study. Eur. Urol. 2013, 63, 531–538. [Google Scholar] [CrossRef] [Green Version]
  9. Nelson, C.M.; Vanduijn, M.M.; Inman, J.L.; Fletcher, D.A.; Bissell, M.J. Tissue geometry determines sites of mammary branching morphogenesis in organotypic cultures. Science 2006, 314, 298–300. [Google Scholar] [CrossRef] [Green Version]
  10. Raghavan, S.; Nelson, C.M.; Baranski, J.D.; Lim, E.; Chen, C.S. Geometrically controlled endothelial tubulogenesis in micropatterned gels. Tissue Eng. Part A 2010, 16, 2255–2263. [Google Scholar] [CrossRef] [Green Version]
  11. Hauser, P.V.; Nishikawa, M.; Kimura, H.; Fujii, T.; Yanagawa, N. Controlled tubulogenesis from dispersed ureteric bud-derived cells using a micropatterned gel. J. Tissue Eng. Regen. Med. 2016, 10, 762–771. [Google Scholar] [CrossRef] [Green Version]
  12. Contessi Negrini, N.; Angelova Volponi, A.; Higgins, C.A.; Sharpe, P.T.; Celiz, A.D. Scaffold-based developmental tissue engineering strategies for ectodermal organ regeneration. Mater. Today Bio 2021, 10, 100107. [Google Scholar] [CrossRef]
  13. Ouyang, M.; Yu, J.-Y.; Chen, Y.; Deng, L.; Guo, C.-L. Cell-extracellular matrix interactions in the fluidic phase direct the topology and polarity of self-organized epithelial structures. Cell Prolif. 2021, 54, e13014. [Google Scholar] [CrossRef]
  14. Sacharidou, A.; Stratman, A.N.; Davis, G.E. Molecular mechanisms controlling vascular lumen formation in three-dimensional extracellular matrices. Cells Tissues Organs. 2012, 195, 122–143. [Google Scholar] [CrossRef] [Green Version]
  15. Łabowska, M.B.; Cierluk, K.; Jankowska, A.M.; Kulbacka, J.; Detyna, J.; Michalak, I. A Review on the Adaption of Alginate-Gelatin Hydrogels for 3D Cultures and Bioprinting. Mater. Basel. Switz. 2021, 14, 858. [Google Scholar] [CrossRef]
  16. Kinoshita, K.; Iwase, M.; Yamada, M.; Yajima, Y.; Seki, M. Fabrication of multilayered vascular tissues using microfluidic agarose hydrogel platforms. Biotechnol. J. 2016, 11, 1415–1423. [Google Scholar] [CrossRef]
  17. Discher, D.E.; Janmey, P.; Wang, Y.L. Tissue cells feel and respond to the stiffness of their substrate. Science 2005, 310, 1139–1143. [Google Scholar] [CrossRef] [Green Version]
  18. Ichanti, H.; Sladic, S.; Kalies, S.; Haverich, A.; Andrée, B.; Hilfiker, A. Characterization of Tissue Engineered Endothelial Cell Networks in Composite Collagen-Agarose Hydrogels. Gels. Basel. Switz. 2020, 6, 27. [Google Scholar] [CrossRef]
  19. Alderfer, L.; Russo, E.; Archilla, A.; Coe, B.; Hanjaya-Putra, D. Matrix stiffness primes lymphatic tube formation directed by vascular endothelial growth factor-C. FASEB J. Off. Publ. Fed. Am. Soc. Exp. Biol. 2021, 35, e21498. [Google Scholar] [CrossRef]
  20. Mori, Y.; Kanazawa, S.; Watanabe, M.; Suenaga, H.; Okubo, K.; Nagata, S.; Fujihara, Y.; Takato, T.; Hoshi, K. Usefulness of Agarose Mold as a Storage Container for Three-Dimensional Tissue-Engineered Cartilage. Mater. Sci. Appl. 2013, 4, 733–778. [Google Scholar] [CrossRef] [Green Version]
  21. Moustafa, M.E.; Gadepalli, V.S.; Elmak, A.A.; Lee, W.; Rao, R.R.; Yadavalli, V.K. Large area micropatterning of cells on polydimethylsiloxane surfaces. J. Biol. Eng. 2014, 8, 24. [Google Scholar] [CrossRef] [Green Version]
  22. Odenwald, M.A.; Choi, W.; Buckley, A.; Shashikanth, N.; Joseph, N.E.; Wang, Y.; Warren, M.H.; Buschmann, M.M.; Pavlyuk, R.; Hildebrand, J.; et al. ZO-1 interactions with F-actin and occludin direct epithelial polarization and single lumen specification in 3D culture. J. Cell Sci. 2017, 130, 243–259. [Google Scholar] [CrossRef] [Green Version]
  23. Akhtar, R.; Sherratt, M.J.; Cruickshank, J.K.; Derby, B. Characterizing the elastic properties of tissues. Mater. Today 2011, 14, 96–105. [Google Scholar] [CrossRef]
  24. Butcher, D.T.; Alliston, T.; Weaver, V.M. A tense situation: Forcing tumor progression. Nat. Rev. Cancer 2009, 9, 108–122. [Google Scholar] [CrossRef] [PubMed]
  25. Levental, I.; Georges, P.C.; Janmey, P.A. Soft biological materials and their impact on cell function. Soft Matter. 2007, 3, 299–306. [Google Scholar] [CrossRef] [PubMed]
  26. Ogle, M.E.; Doron, G.; Levy, M.J.; Temenoff, J.S. Hydrogel Culture Surface Stiffness Modulates Mesenchymal Stromal Cell Secretome and Alters Senescence. Tissue Eng. Part A 2020, 26, 1259–1271. [Google Scholar] [CrossRef] [PubMed]
  27. Koser, D.E.; Thompson, A.J.; Foster, S.K.; Dwivedy, A.; Pillai, E.K.; Sheridan, G.K.; Svoboda, H.; Viana, M.; da F Costa, L.; Address, J.; et al. Mechanosensing is critical for axon growth in the developing brain. Nat. Neurosci. 2016, 19, 1592–1598. [Google Scholar] [CrossRef] [PubMed] [Green Version]
  28. Skeath, J.B.; Wilson, B.A.; Romero, S.E.; Snee, M.J.; Zhu, Y.; Lacin, H. The extracellular metalloprotease AdamTS-A anchors neural lineages in place within and preserves the architecture of the central nervous system. Dev. Camb. Engl. 2017, 144, 3102–3113. [Google Scholar] [CrossRef] [Green Version]
  29. Khalilgharibi, N.; Mao, Y. To form and function: On the role of basement membrane mechanics in tissue development, homeostasis and disease. Open Biol. 2021, 11, 200360. [Google Scholar] [CrossRef]
  30. Reuten, R.; Zendehroud, S.; Nicolau, M.; Fleischhauer, L.; Laitala, A.; Kiderlen, S.; Nikodemus, D.; Wullkopf, L.; Nielsen, S.R.; McNeilly, S.; et al. Basement membrane stiffness determines metastases formation. Nat. Mater. 2021, 20, 892–903. [Google Scholar] [CrossRef]
  31. Hanjaya-Putra, D.; Yee, J.; Ceci, D.; Truitt, R.; Yee, D.; Gerecht, S. Vascular endothelial growth factor and substrate mechanics regulate in vitro tubulogenesis of endothelial progenitor cells. J. Cell Mol. Med. 2010, 14, 2436–2447. [Google Scholar] [CrossRef] [Green Version]
  32. Chen, W.-C.; Lin, H.-H.; Tang, M.-J. Regulation of proximal tubular cell differentiation and proliferation in primary culture by matrix stiffness and ECM components. Am. J. Physiol. Renal. Physiol. 2014, 307, F695–F707. [Google Scholar] [CrossRef]
  33. Bhave, G.; Colon, S.; Ferrell, N. The sulfilimine cross-link of collagen IV contributes to kidney tubular basement membrane stiffness. Am. J. Physiol. Renal. Physiol. 2017, 313, F596–F602. [Google Scholar] [CrossRef] [Green Version]
  34. Crest, J.; Diz-Muñoz, A.; Chen, D.-Y.; Fletcher, D.A.; Bilder, D. Organ sculpting by patterned extracellular matrix stiffness. eLife 2017, 6, e24958. [Google Scholar] [CrossRef]
  35. Hagelaars, M.J.; Yousef Yengej, F.A.; Verhaar, M.C.; Rookmaaker, M.B.; Loerakker, S.; Bouten, C.V.C. Substrate Stiffness Determines the Establishment of Apical-Basal Polarization in Renal Epithelial Cells but Not in Tubuloid-Derived Cells. Front. Bioeng. Biotechnol. 2022, 10, 820930. [Google Scholar] [CrossRef]
  36. Guimarães, C.F.; Gasperini, L.; Marques, A.P.; Reis, R.L. The stiffness of living tissues and its implications for tissue engineering. Nat. Rev. Mater. 2020, 5, 351–370. [Google Scholar] [CrossRef]
  37. Beamish, J.A.; Chen, E.; Putnam, A.J. Engineered extracellular matrices with controlled mechanics modulate renal proximal tubular cell epithelialization. PLoS ONE 2017, 12, e0181085. [Google Scholar] [CrossRef] [Green Version]
  38. Livoti, C.M.; Morgan, J.R. Self-assembly and tissue fusion of toroid-shaped minimal building units. Tissue Eng. Part A 2010, 16, 2051–2061. [Google Scholar] [CrossRef] [Green Version]
  39. Brown, X.Q.; Ookawa, K.; Wong, J.Y. Evaluation of polydimethylsiloxane scaffolds with physiologically-relevant elastic moduli: Interplay of substrate mechanics and surface chemistry effects on vascular smooth muscle cell response. Biomaterials 2005, 26, 3123–3129. [Google Scholar] [CrossRef]
Figure 1. (A) Size, shape, and arrangement of the micropatterned mold used for tube formation. Each micropatterned mold holds three rows with 21 tube patterns. (B) Orientation of the tubes during the seeding process of forced gravity via centrifugation was established, as shown (F—centrifugal force, A—rotation axis).
Applsci 13 04510 g001
Figure 2. Elastic moduli of (A) agarose and (B) polydimethylsiloxane (PDMS). (C)The elastic moduli of the agarose substrate at 3% and 5% overlaps with the PDMS substrate generated in a 1:30 and 1:20 ratio.
Applsci 13 04510 g002
Figure 3. The efficiency of tube formation was graded after 24 h of culture along the characteristics shown in the panels. Tube formation was scored by grades (from low to high) as 2N (−−), 1N (−), 1P (+), 2P (++) and 3P (+++).
Applsci 13 04510 g003
Figure 4. Percentage of tube formation on agarose (A,B) and PDMS (C,D) molds. Data are represented in function of the (A,C) substrate composition and (B,D) the tube formation’s grade. Symbols indicate the p-value of the ANOVA test: p < 0.05 (*), p < 0.005 (**), p < 0.0005 (†), p < 0.00005 (††), p < 0.000005 (‡), p < 0.000001 (‡‡), and no differences (nd). A compact letter display is used to indicate non-significant differences from post hoc analysis (where a similar letter indicates no significant differences).
Applsci 13 04510 g004
Figure 5. (A) Number of each tube stages (from 2N to 3P) in function of the Young’s modulus cultured on agarose (plain line) or PDMS (dotted line). (B) Close-up of the percentage of tube formation in the function of overlapping Young’s modulus from agarose and PDMS substrates. Overlap areas are indicated by rectangles with dashed lines in (A). Symbols indicate p < 0.05 (*) and p < 0.005 (†).
Applsci 13 04510 g005
Figure 6. (A) Representative confocal image of the tubular structure stained for polarization marker ZO-1 (red) and DRAQ5 (blue). Longitudinal Z-stack projection on the right panel. Tubes were harvested after 24 h from agarose substrates of different stiffness and stained for ZO-1 (red) and measured using Image J2 software 1.52 (B) A representative longitudinal Z-stack projection of ZO-1 (red) stained tubes generated on agarose and PDMS substrates of different concentrations or dilutions, respectively. The ZO-1 intensity was measured using Image J.
Applsci 13 04510 g006
Figure 7. (Left) The diagram represents the measured mean intensity (n = 5) of the stained tubes for polarization marker ZO-1. Tubes were harvested after 24 h from agarose substrates of different stiffness and stained for ZO-1 and measured using Image J. (Right) Mean intensities of the ZO-1 staining of tubes (n = 5) from PDMS substrates of different stiffness. Symbols indicate p < 0.005 (*) and p < 0.0005 (†). A compact letter display is used to indicate non-significant differences from post hoc analysis (where a similar letter indicates no significant differences).
Applsci 13 04510 g007
Disclaimer/Publisher’s Note: The statements, opinions and data contained in all publications are solely those of the individual author(s) and contributor(s) and not of MDPI and/or the editor(s). MDPI and/or the editor(s) disclaim responsibility for any injury to people or property resulting from any ideas, methods, instructions or products referred to in the content.

