Article

Personality Types and Traits—Examining and Leveraging the Relationship between Different Personality Models for Mutual Prediction

1
Graduate School of Information Science and Technology, Hokkaido University, Nishi 9, Kita 14, Kita-ku, Sapporo 060-0814, Japan
2
Faculty of Information Science and Technology, Hokkaido University, Nishi 9, Kita 14, Kita-ku, Sapporo 060-0814, Japan
*
Author to whom correspondence should be addressed.
Appl. Sci. 2023, 13(7), 4506; https://doi.org/10.3390/app13074506
Submission received: 23 February 2023 / Revised: 28 March 2023 / Accepted: 30 March 2023 / Published: 2 April 2023

Abstract

:
The popularity of social media services has led to an increase of personality-relevant data in online spaces. While the majority of people who use these services tend to express their personality through measures offered by the Myers–Briggs Type Indicator (MBTI), another personality model known as the Big Five has been a dominant paradigm in academic works that deal with personality research. In this paper, we seek to bridge the gap between the MBTI, Big Five and another personality model known as the Enneagram of Personality, with the goal of increasing the amount of resources for the Big Five model. We further explore the relationship that was previously reported between the MBTI types and certain Big Five traits as well as test for the presence of a similar relationship between Enneagram and Big Five measures. We propose a new method relying on psycholingusitc features selected based on their relationship with the MBTI model. This approach showed the best performance through our experiments and led to an increase of up to 3% in automatic personality recognition for Big Five traits on the per-trait level. Our detailed experimentation offers further insight into the nature of personality and into how well it translates between different personality models.

1. Introduction

Personality is a popular concept that emerged in the early 20th century to explain the differences present on an individual level between people. Academics describe it as a set of distinct emotional, cognitive and behavioural patterns that differ from individual to individual but remain relatively consistent over time and context. As such, personality is essential to determining one’s life and identity. It influences various life choices [1] and how one is perceived by others [2,3] and also has a significant impact on how one experiences the world around them [4].
The pivotal role of personality in human interaction has inspired various researchers to formulate theories and models that enhance our understanding of the concept [5]. While the theories tend to be more general in nature and cover the conceptual aspects of personality through how it works, personality models are what is often used in practice to describe one’s personality and its effects on an individual.
The process of assessing ones personality through these models historically consisted of a psychological expert administering a test during an interview, with the test choice being dictated by the choice of model. Though reliable and effective, this approach requires expert knowledge and is usually time consuming. However, the combination of new machine-learning techniques and increase of online communication has led to interest from scholars into the possibility of automating the tasks of prediction, interpretation and generation of dimensions that personality models use.
Although the dimensions and the number of them differ on a model-to-model basis, it is possible to separate personality models into two groups based on the kind of value they assign along the said dimensions. These groups are:
  • Trait-based personality models, which use traits or, in other words, assign a continuous value along the dimension.
  • Type-based personality models, which rely on types to describe a personality. Types can also be viewed as categories or a form of a discrete value selected from a dimension’s domain.
Examples of a type-based model would be the likes of Myers–Briggs Type Indicator (also known as the MBTI) and Enneagram of Personality (often referred to as simply Enneagram), while the Big Five model would be an example of a trait-based one.

1.1. Motivation

New computational algorithms and the development of modern technologies have led to the formation of personality computing—a research field at the intersection of personality psychology and artificial intelligence [6]. In addition to advancements in machine learning, another contributing factor to the rapid development of the field has been the increase in popularity of social media services, as this has encouraged people to share their interests publicly in online spaces [1].
However, while the amount of personality-related information increases daily, the need for more relevant personality-labelled data remains one of the most cited issues in the field [7]. This paradoxical phenomenon can be explained by the difference in personality model preference between academia and the non-psychological population that is more prevalent on social media. More specifically, while the Big Five model has seen extensive use in personality research, the MBTI has been the more popular choice for describing personality in online spaces.
The trait-based approach of the Big Five model as well as its empirical support, cross-cultural applicability and reliability [8,9,10] have caused it to be a popular choice in scientific circles, with a majority of research on personality computing centred around it. Several studies have additionally contributed to this preference by confirming its validity [11,12], while the MBTI has often been criticised for lacking this evidence [13,14,15,16]. If we consider the data that is publicly available through https://books.google.com/ngrams (accessed on 28 March 2023), we can note that, although both the Big Five and MBTI personality models have seen an increase in popularity within the last couple of decades, the “Big Five” n-gram appears significantly more frequently when it comes to book titles (shown in Figure 1).
On the other hand, if we use the frequency with which people search for a particular personality model using the Google (https://www.google.com/ (accessed on 28 March 2023)) search engine as an indicator of interest, we note that the preference seems to be different from that in academia. When observing the data available through the Google Trends API (https://trends.google.com/home (accessed on 28 March 2023)), we notice that the MBTI has drawn much more interest than the Big Five, especially in the last several years (depicted in Figure 2). This can be attributed to the fact that the way in which MBTI assigns personality (using a four-letter acronym) is easier to interpret and report for the non-psychological population, causing it to be more prevalent on social media platforms and, thus, attract greater attention.
Despite the differences between the two previously mentioned personality models, several studies [13,17,18] have pointed towards a statistically significant correlation between the MBTI types and certain traits belonging to the Big Five model. The existence of this relationship between the two raises the question of whether it can somehow be leveraged in overcoming each of their individual shortcomings. In our study, we aim to bridge the gap between these two personality models and, as a result, provide a significant increase in resources for the more scientifically accredited Big Five model.

1.2. Contribution

Our work further examines the relationship between the MBTI and the Big Five personality models. In addition, we look into the possible existence of a relationship between the Big Five and the Enneagram model, as well as the nature thereof. We conduct detailed experiments involving different sets of features and employ various regression algorithms, providing insight into their effectiveness on the task of personality prediction. Throughout this work, we adopt a comprehensive reporting style in order to assure replicability and better comparability with previous works, as the lack of comparison between studies has been a prevalent issue in personality computing [19]. The main goal of our experiments is to highlight the relationship between different personality models and further our understanding of personality. We can summarize our contributions as follows:
  • The series of detailed experiments that we conduct provides insight into the effectiveness of different features and regression algorithms for the task of personality prediction. Additionally, the choice of algorithms allows for greater interpretability of the results while maintaining a simplistic approach.
  • We propose a simple framework based on psycholinguistic features that leverage the relationship between different personality models. Our method led to an increase of 1.2 to 3.3 % in the Pearson r correlation coefficient between predicted values and the gold-standard labels when compared to the baseline approach on a dimension-to-dimension level.
  • Using psycholinguistic features helps further explore the relationship between language and how type-based personality shapes its use in online spaces. While the relationship between the Big Five and language use has been thoroughly studied due to the lexical background of the Big Five model [20], similar studies for the type-based models are limited to the best of our knowledge.

1.3. Paper Overview

The structure of this paper is as follows. Section 2 serves as a gentle introduction to the field by providing a brief history of personality research while also contextualizing the importance of our research. In Section 3, we introduce several closely related works. Section 4 describes our approach and provides a description of our experimental settings. In Section 5, we go over the results of our experiments, while in Section 6, we further discusses their implications as well as limitations. Finally, Section 7 summarizes our findings and concludes this paper.

2. Background on Personality Research

2.1. Brief History of Personality

Personality is a relatively new concept, dating back to the early 20th century. Despite this, it is speculated that the efforts to classify people based on their communication, behavioural and thinking patterns long predate written sources. The earliest known literary work that touches upon the topic of individual differences is a book called “Characters” [21] by the Greek philosopher Theophrastus. Dating back to the fourth century BC, it includes 30 short descriptions of different moral types, known as characters, that can be interpreted as prototypes of the modern personality types. However, it should be noted that some translators of the work have since noted that the word “trait”, rather than “character”, would be better suited as certain characteristics overlap between the descriptions.
Another early work that has proven important for the development of modern personality theories is that of physicians Hippocrates and Galen of Pergamon, which was later documented in Galen’s book “De Temperamentis” [22]. Despite appearing roughly five centuries after “Characters”, their work on the Four Humours theory has arguably had a greater influence on modern personality psychology and philosophy.
Hippocrates was first one to suggest that an imbalance in humour, or vital bodily fluids (from the Latin humor—meaning fluid), can influence behaviour. He described each humour as a combination of values along the two different pillars—dry/wet and hot/cold. For example, blood was considered to be hot and wet, while black bile was considered to be a combination of the cold and dry pillars. Following their work, Galen speculated the existence of a moderate value between the two pillars, combining the values along them to describe a total of nine different temperaments, four of which he considered to be primary [23]. These temperaments—namely, sanguine, choleric, melancholic and phlegmatic, have left an impact on both the English language and various works that involve personality.
The theory of the four temperaments formulated by Hippocrates and Galen has since been thoroughly explored by philosophers and psychologists in their theories that attempted to explain reasons behind individual differences. Prominent philosopher Immanuel Kant further explored the theory in their book “Anthropology From a Pragmatic Point of View” [24], arguing that, rather than nine, there are, in fact, only four temperaments. He described these temperaments as independent from one another, formulating a comprehensive list of traits that can be used in describing them. This approach can be seen as related to how the modern type-based personality models function.
In addition to inspiring Kant’s work, the four temperaments theory has also drawn interest from Wilhelm Wundt—the man who is widely considered to be the father of experimental psychology. Wundt proposed that a two dimensional approach was sufficient to accurately describe personality. He introduced the dimensions of emotional intensity (strong–weak) and activity changeability (changeable–unchangeable) and expressed the four temperaments along the axes of these dimensions. Some authors have since pointed out that these interpretations of the four temperaments made by Kant and Wundt have an “uncanny” resemblance to Neuroticism and Extroversion—two dimensions that belong to the Big Five personality model [25].
The seminal contributions made by Immanuel Kant and Wilhelm Wundt can be seen as highly influential in the field of personality research [26], as they have helped to develop theories of several prominent researchers. The impact of their work is observed in personality theories proposed by Gordon Allport and Carl Gustav Jung, who, in turn, helped shape the modern Big Five and MBTI models, respectively. The concepts of introversion and extroversion proposed by Jung can be traced back to their study of Kant’s work on morality. While in the case of Gordon Allport, the concept of a “cardinal trait” that is present in their work and refers to a single dominant trait that shapes the personality can be tied to the Kantian idea of self.

2.2. Personality Evaluation Tools

Through the history of personality psychology, several prominent theories and models have been used to describe personality [5,27,28,29]. However, in this subsection, we focus primarily on introducing the three personality models mentioned in the introductory section—the Big Five, Myers–Briggs Type Indicator and the Enneagram of Personality, all of which have been used in our experiments.

2.2.1. Big Five Model

The Big Five model or the Five Factor Model [30] has often been described as the “dominant paradigm” in the field of personality research and as “one of the most influential models” in psychology [31]. Its origins can be traced to a list of 4500 terms relating to personality traits that were introduced by Gordon Allport and Henry Odbert [32]. Using factor analysis, this list was initially reduced to 16 traits, only to be narrowed down to the final five from which the model received its name. As such, it is a result of contributions from many different authors, with roots in the English lexicon [20]. The five traits, or factors, that make up the Big Five model are most frequently labelled as:
  • Openness—measure of curiosity;
  • Conscientiousness—measure of efficiency;
  • Extroversion—measure of energy;
  • Agreeableness—measure of compassion;
  • Neuroticism—measure of sensitivity.
When using the Big Five model to measure personality, a continuous value is assigned to person along each of these traits (Figure 3) with the exact scale of these numbers largely depending on the test used [7]. An example of this would be a person scoring 85/100 along the Openness trait, which indicates they are less likely to be cautious when exploring new things.

2.2.2. Myers–Briggs Type Indicator

The Myers–Briggs Type Indicator [33], or MBTI for short, is another very popular personality evaluation tool. The Myers–Briggs Company (https://www.themyersbriggs.com/en-US/Connect-with-us/Blog/2018/October/MBTI-Facts–Common-Criticisms (accessed on 28 March 2023), which is in charge of distributing the evaluation test, has stated that millions of people use the test annually in over 100 countries.
Unlike the Big Five model, MBTI focuses on personality types, rather than traits, and as such is based on the theoretical works of Carl Gustav Jung [34], who is often credited as the progenitor of personality types. Building on the three dichotomies that Jung originally proposed, namely Introverted/Extroverted, Sensing/Intuitive and Thinking/Feeling, Isabel Briggs-Myers and Katherine Cook Briggs later introduced the fourth dichotomy labelled as Judging/Perceiving, which finalized the initial MBTI model [35]. These dichotomies can be explained as measures in the following way:
  • Extroverted/Introverted—Describes how an individual gains energy. Often abbreviated as E-I;
  • Sensing/Intuitive—Describes how an individual gains information. Often abbreviated as S-N;
  • Thinking/Feeling—Describes how an individual makes decisions. Often abbreviated as T-F;
  • Judging/Perceiving—Describes how an individual observes the world around them. Often abbreviated as J-P.
Personality measured by the MBTI model is based on the idea that every individual has one pronounced value from the four dichotomies mentioned (Figure 4). For example, the type INTJ would refer to an individual who is Introverted, iNtuitive, Thinking and Judging. Thus, the MBTI offers a total of 16 different combinations that describe 16 unique personality types [36].

2.2.3. Enneagram of Personality

The Enneagram of Personality is another prominent personality model that uses types to measure individual differences [37]. The origins of the MBTI and the Big Five model can be traced to some of the early philosophical theories on individuality [26]; however, the exact origins of the Enneagram are disputed, with the Armenian philosopher George Gurdjieff often being credited with introducing it to the Western world [38].
The Enneagram is usually depicted as a circle with nine equidistant points that are connected with intersecting lines—the figure from which the model received its name. Personality types offered by the Enneagram are referred simply by a number from One to Nine (e.g., Type Eight), with these types often being associated with different virtues, vices or ego fixations (depicted in Figure 5).

2.3. Personality Computing

In recent years, several studies have pointed towards the existence of a relationship between personality and essential aspects of life, such as career selection and success [39,40,41], political participation and affiliation [42,43,44], religion [45], investment in social roles [46] and quality of life [47]. Due to the importance of personality and the rapid development of new technologies, Vinciarelli et al. [1] coined the term personality computing to describe the practice of applying machine-learning approaches to tasks involving personality [6].
The same authors described the main tasks of personality computing to be: (1) Automatic Personality Recognition (the identification of one’s true personality from verbal or behavioural evidence), (2) Automatic Personality Perception (the recognition of personality that others might assign to an individual based on their behaviour) and (3) Automatic Personality Synthesis (the generation of artificial personalities). They concluded that any study that seeks to understand, predict or synthesise human behaviour could greatly benefit from personality computing approaches, closely relating the research field to affective computing [48] and its endeavors to build emotionally intelligent machines.
Although the main focus of our research is the translation from one personality model into another, it can best be described as a subtask of the automatic personality recognition task.

3. Related Research

Early research works involving personality centred around smaller sources of data, such as essays [49,50,51], emails [52] or blogs [53,54]. An important turning point for the personality computing field was the release of the MyPersonality dataset, which utilized information from the social media platform Facebook (https://www.facebook.com/ (accessed on 28 March 2023)). The dataset originated from the research of Kosinski et al. [55] and consisted of about 15.5 million Facebook statuses and some 7.5 million user profiles. As such, it represented the first publicly available large-scale dataset that included labels for the Big Five model. While MyPersonality has since been removed from the internet due to privacy concerns, with only a small portion of it being left accessible [56], it has inspired many future researchers in examining social media platforms as a potential source of data (Table 1) [6,57,58].
A very influential work in personality computing is that of Mairesse et al. [51]. Their work used the EAR [59] and Essays [49] datasets to test the effectiveness of different features using classification, regression and ranking models. When using a smaller set of data, they reported that simpler algorithms, such as Naive Bayes and regression trees offered better performance; however, ranking models achieved better scores for a larger dataset. While their approach closely related to our endeavours in analysing the effectiveness of different features, they focused on a single personality model. On the other hand, our work analyses the effectiveness of different features and how well they capture the relationship between multiple personality models, rather than focusing only on the Big Five model and language usage.
An interesting study comparing multiple personality models is that of Celli and Lepri [60], who compared the effectiveness of predicting labels for the MBTI and the Big Five model on a dataset originating from the social media platform Twitter (https://twitter.com/ (accessed on 28 March 2023)). They treated the problem as nine separate binary classification tasks, five of which were for classifying Big Five traits and four for the MBTI types. For the model architecture, they used a combination of n-gram, LIWC dimensions and metadata features for Support Vector Machine and another meta-classifier based on the work of Thornton et al. [61]. While their approach offered novel insight into the difference in effectiveness of the automatic personality recognition task for two different models, the relationship between models themselves was left unexplored.
Several notable contributions have been made on the automatic personality recognition task using deep-learning methods. Sun et al. [62] used a concatenation of bidirectional LSTMs and a convolutional neural network in order to predict personality traits from two Big Five personality datasets—the Essays dataset [49] and another one coming from the YouTube platform [63]. Kazameini et al. [64] also used the Essays dataset in their experiments; however, they adopted a multi-step approach that used a combination of Mairesse features [51] and BERT token representations [65] for prediction of the Big Five personality using a Support Vector Machine algorithm.
On the other hand, Kerz et al. [66] used a two-step approach that relied on BERT and BLSTM to predict Big Five personality traits from the Essays dataset, and MBTI types from the MBTI Kaggle dataset [67]. While there have been many more studies that used deep-learning methods and showed promising results [58,68,69], most of them tend to focus on a single personality model, most commonly the Big Five.
In addition, the vast majority of studies that utilize deep-learning methods treat the problem of Big Five trait prediction as a classification problem, rather than a regression one. The only exception is the previously mentioned work of Kerz et al. [66], which focused on multiple personality models. However, due to Big Five traits and MBTI types stemming from two different sources of data, it is impossible to obtain deeper insight into the relationship between two personality models.
Table 1. A non-exhaustive overview of various personality computing works that utilize social media platforms as a source of data. Different to our work, most of the listed research tends to focus on a single personality model, most often the Big Five model.
Social Media PlatformAuthorsModalityPersonality Model
FacebookSchwartz et al. [70]TextBig Five
Farnadi et al. [71]TextBig Five
Verhoeven et al. [72]TextBig Five
Celli et al. [73]TextBig Five
Park et al. [74]TextBig Five
Youyou et al. [75]TextBig Five
Segalin et al. [76]ImagesBig Five
Tandera et al. [77]MultimodalBig Five
Kulkarni et al. [78]TextBig Five
Ramos et al. [79]TextBig Five
Xue et al. [80]TextBig Five
Marengo et al. [81]TextBig Five
FlickrCristani et al. [82]ImagesBig Five
InstagramOsterholz et al. [83]ImagesBig Five
RedditGjurković and Šnajder [84]TextMBTI
Wu et al. [85]TextMBTI
Gjurković et al. [7]TextBig Five, Enne. and MBTI
Radisavljević et al. [86]TextBig Five and MBTI
Sina WeiboZhou et al. [87]TextBig Five (Extroversion)
TikTokMeng and Leung [88]MultimodalBig Five
TwitterPlank and Hovy [89]TextMBTI
Verhoeven et al. [90]TextMBTI
Tighe and Cheng [91]TextBig Five
Celli and Lepri [60]TextBig Five and MBTI
Balakrishnan et al. [92]TextBig Five and Dark Triad 1
Cahyani and Faishal [93]TextBig Five
YoutubeBiel and Gatica–Perez [63]VideoBig Five
Bassignana et al. [94]TextMBTI
1 Dark Triad is a group of three traits associated with negative behaviour. These traits are largely independent from the traits measured by the Big Five model.
Our approach is heavily inspired by the work of Gjurković et al. [7], who introduced a dataset containing labels for the MBTI, Big Five and the Enneagram model stemming from a single social media platform. They were the first to explore the possibility of using labels from one personality model as features in order to increase the scores of the automatic personality recognition task for another one. Their approach relied on a combination of MBTI/Enneagram predictions and a set of n-gram features to predict Big Five traits. In our work, we seek to extend their case study by taking a more detailed approach, similar to Mairesse et al. [51].
As with the works previously introduced in this section, we focus on the automatic personality recognition task. However, to do so, we seek to leverage the relationship present between multiple personality models and the way it is reflected through different features. The approach we take is detailed in nature for two reasons. The first is to assure comparability with the approach that we used as a baseline, avoiding some of the common issues in the personality computing research field [6,19]. The second reason is that, due to the complex nature of personality, gradual introduction and experimentation with different features is the best way to accurately single out the effects they have on the task of personality recognition [51].

4. Materials and Methods

When looking at tasks that use regression approaches, there are several different methods that can be utilized for improving results over the baseline. Some of the more common examples involve different regularization methods or data manipulation in the form of data augmentation or even data cleanup.
However, as the primary focus of our work is to improve our understanding of personality and the way it is reflected across different personality models, we decided to use two methods that are more linear in nature—(1) feature selection and (2) model selection. The exact design choices behind these methods will be further discussed in Section 4.2 and Section 4.3, respectively. To better contextualize the choice we made, we start this section by briefly introducing the dataset used, as well as the approach that serves as a baseline for our experiments.

4.1. Pandora Dataset and the Baseline Approach

The data used in our experiments stems from the social media platform Reddit (https://www.reddit.com/ (accessed on 28 March 2023)), and is the contribution of Gjurković et al. [7]. As such, it represents a direct extension of their previous work that introduced the MBTI9k [84], another dataset containing MBTI labels. We decided that the PANDORA (Personality ANd Demographics Of Reddit Authors) dataset was suitable for our experiments due to the following reasons:
  • Most of the work done in personality computing that focuses on using data for different personality models utilizes datasets coming from separate sources, with some examples being the works of Mehta et al. [95] and Kerz et al. [66]. On the other hand, in the work of some authors, while the data originates from the same source, it contains no overlap between users labelled with different personality models (e.g., the work of Celli and Lepri [60]). To the best of our knowledge, the PANDORA dataset is the only dataset that contains personality-relevant information for multiple personality models, with an overlap between user groups labelled with each of these models.
  • The topical diversity of Reddit opens up the possibility of looking into the effects that interests and hobbies have on personality prediction. As a social media platform, Reddit is divided into a series of different “subreddits”—or smaller message boards. These message boards are often centred around a single topic or interest that individuals participating on them tend to share. It is possible that information on these topical interests can be leveraged to improve the results of the personality prediction task.
The PANDORA dataset consists of 10,288 users that have labels for either the MBTI, Big Five or Enneagram personality models, with some users being labelled for more than one personality model. Additionally, some users also have their demographic information, such as gender or age stated. The dataset also includes 17,640,062 comments written by users in the period between the January 2015 and May 2019. Table 2 includes an overview of the dataset, providing insight into the exact number of users and comments that contain labels for either MBTI, Big Five or Enneagram personality models, as well as information on the amount of overlap between these groups.
Observing the the way data are distributed, we note that none of the personality traits appear to follow a normal distribution (Figure 6). While this is not particularly unusual, it should be noted that most previous work reported a tendency towards normal distribution for the Big Five traits (e.g., the works of Mairesse et al. [51] or work of Uysal and Pohlmeier [96]). In the PANDORA dataset, however, most of the personality traits follow a skewed distribution, with the only exception being the Neuroticism trait for which the labels seem to follow a bimodal distribution.
This phenomenon can be attributed to several different reasons, such as selection bias [84] or the propensity of openly stating personality traits being dictated by certain personality traits, e.g., high Openness. An additional possibility is that certain subreddits covering certain topics or interests tend to be more prevalent in the dataset, and thus the number of individuals with particular personality traits associated with such interests and topics tend to be more numerous. To test this possibility, we conducted an experiment into the effect that subreddit participation has on personality predictions, and the details of this study are described in Section 4.2.3.
While the data distribution of personality traits present in the dataset seems a bit unusual, it should be noted that the correlations between the Big Five traits and the MBTI types reported in data are largely in agreement with research that has previously examined relationship between these two sets of dimensions [13,18]. The only exception would be the Openness personality trait that in the case of PANDORA shows an unusually low correlation with the S-N type, despite previous works in the field reporting an agreement between these two dimensions that is higher than chance (Figure 7).
The approach used as a baseline in our work was described by the authors of PANDORA as a domain-adaptation task [97] of transferring the MBTI and Enneagram labels into the more scientifically relevant Big Five ones [7]. To this end, they started by training four logistic regression models [98]—one for each of the MBTI types, and an additional one for the types present in the Enneagram. In order to train these models, they utilized a subset of users that included the MBTI/Enneagram labels only—in other words, a subset that had no overlap with users labelled with the Big Five personality model. The set of users with labels for both the MBTI/Enneagram models and the Big Five were later used as part of a validation set.
The labels obtained from these five regression models were then used to predict MBTI/Enneagram values for the set of users without assigned labels for these type-based models. The predictions were then either used independently or combined with other features (e.g., gender, POS tags, stylistic features and named entities in text) and n-grams into a single feature set in order to predict the Big Five personality traits. The experiments were conducted using two different algorithms: (1) a linear regression model with a L2 regularization norm [99] (also known as Ridge regression) and (2) a neural network with the L2 regularization norm BERT [65] for textual encoding. The end results indicated better performance for the linear regression model, with about 15% higher results compared with the deep-learning model.

4.2. Feature Selection Approach

The first step of our experiments focused on finding the optimal set of features for the task of automatic personality recognition. These features were then combined with the predictions of the type-based personality labels in an effort to leverage a relationship between them and the Big Five model. We theorize that the following three feature sources can benefit the results and lead to possible improvements over the baseline approach:
  • Class predictions for the Big Five personality traits—a set of features obtained from predicting Big Five labels as classes rather than values (e.g., “High Extroversion” instead of 74% Extroversion) by applying a technique known as binning. These predictions were then used in combination with other features to predict the Big Five personality traits.
  • Language-based features originating from Linguistic Inquiry and Word Count (LIWC)—a set of psycholinguistic features produced as a result of statistical analysis conducted by LIWC.
  • Information about user participation and engagement on the social media platform Reddit—a feature set constructed from frequency with which users post on the most and least popular message boards present in the dataset.

4.2.1. Big Five Classification Predictions as Features

Our first hypothesis is based on the idea that the difference in the domain between personality models can ultimately impede the prediction results. While Enneagram types are represented using a whole number on a scale from 1 to 9, the MBTI types can be described using a binary value of either 0 or 1 in order to aptly represent each of the four dichotomies. On the other hand, Big Five personality traits are labelled using a positive number within the range of 0 to 100, with some labels even being represented as a single precision decimal number. It is possible to minimize these differences by introducing an additional step to the prediction process, which would treat the task as a classification problem rather than a regression one.
To convert the Big Five labels from continuous values into discrete ones, we applied binning as described by Segalin et al. [76], with slight modifications. In their work, the authors used two different techniques in order to separate Big Five traits into binary classes—(1) utilizing the mean value of the particular personality trait and (2) by using the first and third quartiles of the distribution as class delimiters and discarding all values between the them. As the data distributions of the PANDORA dataset and the data used by Segalin et al. [76] differ, we introduced slight adjustments to the approaches they used.
When it comes to technique (1), instead of relying on the mean value, we decided to use the median point of the personality trait distribution as a separator between classes. The reasoning behind this is that the median values tend to be more resilient to skewed data distributions, thus, making it a better fit for the PANDORA dataset (Figure 6). For technique (2), we decided against discarding any non-extreme value, and instead binned the Big Five traits into three classes rather than two. In doing so, we prevented any loss of information since the Big Five personality labels present in the PANDORA dataset are relatively smaller in size when compared to MBTI (Table 2).
Despite the recent success of different deep-learning approaches in predicting Big Five traits as classes [64,100,101], we decided to use the same regression algorithm as in the case of predicting MBTI and Enneagram types, so to allow for better comparability. The features used for this task include n-grams and MBTI/Enneagram predictions as described in Gjurković et al. [7]. These predictions were then later used for the regression model with Figure 8 illustrating the steps taken in predicting the continuous values for the Big Five personality traits.

4.2.2. Language-Based Features

Boyd and Pennebaker [102] stated language to be one of the most important indicators of personality. As such, many linguistic and psycholinguistic features have seen extensive use in the field of personality computing [103]. These language-based features often tend to be researched from the aspect of their relationship to the Big Five model (with some examples being the works of Mairesse et al. [51] and Holtgraves [104]). However, these features have rarely been used to connect the relationship between multiple personality models, with only few works attempting to do so [66,86]. This can be explained by the fact that, while the Big Five model is a direct result of a statistical analysis of the English lexicon [20], the MBTI and Enneagram do not share a similar lexical background.
To further examine the relationship between these personality models and language, we rely on the Linguistic Inquiry and Word Count, also known as LIWC (a full list of dimensions and their overview can be found in the https://www.liwc.app/help/psychometrics-manuals (accessed on 28 March 2023) [105], which has been a popular tool for analysis of the ways in which language is used. LIWC utilizes over 100 internal dictionaries that test for the presence of various linguistic features, capturing the social and psychological states people express through language.
Each of these dictionaries consists of words, word stems, emoticons and other text features that help to better identify the psychological category of interest from the textual data. For example, the “affiliation” dictionary comes with some 350 entries among which are words, such as “community”, “together” and other verbal constructs indicating a person’s desire to connect with others. Using these dictionaries, LIWC compares the words present in the provided text with the list of words contained in these internal dictionaries, thus, calculating the percentage of match for each of its dimensions.
It is important to note that, while a high number of features returned by LIWC can be considered psycholinguistic, as they are used to capture emotional and psychological states and processes (e.g., “posemo” for positive emotions or “anxiety” for anxiety-related words), not all of them fall into this category. Certain LIWC features, such as word count or function words, can be viewed as purely linguistic when used in isolation. However, if these features are paired with others in a set, they can be also considered psycholinguistic. For example, a higher word count when paired with anxiety words can be indicative of a certain emotional state. As we focus on using multiple LIWC features in combination for our experiments, we refer to them as psycholinguistic, thus, accenting their role as indicators of one’s psychological state.
Due to the high quantity of LIWC features being present, we later performed a feature selection approach based on their relationship with the type-based personality models. By doing this, we sought to optimize the approach to our experiments and to avoid potential noise in the set of psycholinguistic features.

4.2.3. Subreddit Participation as Features

Similarly to shaping our behavioural and communication patterns in face to face interactions, personality can also be reflected in our interactions in online spaces [106]. As such, we found it interesting to examine the possibility of participation on particular subreddits influencing the results of personality prediction. As subreddits are often grouped around a single interest point, this experiment can be seen as an examination into the effect that personality has on interests in particular topics.
When observing all of the subreddits individually, connecting interests to particular personalities seems to be a difficult task. This is due to the large number of Reddit participants that frequent each subreddit but have not disclosed any personality-relevant data. In an effort to avoid this problem, we focused primarily on measuring the frequency of participation on different subreddits through measuring the number of users for each subreddit and the amount of messages posted on them through time.
In order to obtain detailed Reddit information, we used the PushShift Reddit dataset [107]. Through this, we collected participation statistics for different subreddits in the span of time between the chronologically first and last comments present in the PANDORA dataset. After that, we selected the 50 most popular subreddits for the construction of a feature vector through using information, such as the amount of comments posted on the subreddit and the number of participating users for the observed time period. Subsequently, these feature vectors were then normalized in an effort to effectively use them for the linear regression models.

4.3. Model Selection Approach

After examining the effects that each of the feature sets have on personality prediction, we conducted experiments applying several different algorithms for this task. For the sake of maintaining the comparability with the baseline approach, we tested several different linear regression models. Additionally, we conducted experiments using a deep-learning model (KerasReressor) and an ensemble-learning approach (XGBoost).

4.3.1. Lasso Regression

While the baseline approach relied on the linear regression model implementing the L2 regularization norm, due to the large number n-gram features present in the feature set, it is possible that a model implementing L1 regularization can yield better results [108]. While L2 regularization introduces the squared magnitude of coefficients as a penalty function, the L1 uses the absolute value—making it more robust to outliers. As a result, the L1 regularization can impact and potentially eliminate some less important features from the numerous n-grams used in the feature set. A regression model that uses the L1 regularization norm is also known as Lasso regression (Least Absolute Shrinkage and Selection Operator).
The difference between these two models can be mathematically formulated in the following way. If we have m features and n observations in our data, with x i , j , we can mark the j-th feature of the i-th observation. Next, if we use w to represent the weight of our function, for the i-th feature of the observation that we are interested in predicting, (which we mark with y), the basic regression formula can be written as Equation (1). For the L2 regularization with the regularization parameter α ϵ [ 0 , 1 ] that we multiply with the sum of squared weights w, the regression formula takes the form of Equation (2). Finally, if we take the absolute value of weights instead of squaring them, we obtain the L1 regularization as shown in Equation (3).
i = 1 n ( y i j = 1 m x i , j w j ) 2
i = 1 n ( y i j = 1 m x i , j w j ) 2 + α j = 1 m w j 2
i = 1 n ( y i j = 1 m x i , j w j ) 2 + α j = 1 m w j

4.3.2. Elastic-Net

While the elimination of less important features can prove to be beneficial, it is possible that taking a more moderate approach can lead to even better results. While L1 regularization tends to be more strict by removing features, L2 only minimizes their effect. A balanced combination of the two regularization norms can prove to be beneficial in improving predictions, as it combines the best aspects of both the Ridge and Lasso regression models. The algorithm that relies on both the L1 and L2 norm is known as Elastic-Net and can be mathematically formulated in the following way:
i = 1 n ( y i j = 1 m x i , j w j ) 2 + α 1 j = 1 m w j 2 + α 2 j = 1 m w j
Our theory is that the combination of two regularizations can yield better results as it would simultaneously minimize the effect of the outliers on the prediction while also preserving those features that could potentially capture the intricate nature and finer differences between personality traits.

4.3.3. Huber Regressor

Lasso, Ridge and Elastic-Net all rely on the ordinary least squares formula for their loss function. One problem with this is that outliers often have too much influence on the predictions. This is true for both the models that implement the L1 and the L2 regularization norms, despite the fact that the L1 norm utilized the median as the central value for the sake of minimizing this effect. There are several different regression approaches that offer the complete elimination of outliers, with one example being RANSAC (RANdom SAmple Consensus).
However, due to the size of the data, as well as the nature of the task, we propose that it is best to minimize the effect of outliers rather than to completely eliminate them. For this reason, we decided to experiment with the Huber regressor, which is available through Pythons Sklearn package (https://scikit-learn.org/stable/modules/generated/sklearn.linear_model.HuberRegressor.html (accessed on 28 March 2023)). The Huber regressor, much like the Ridge regression model, implements L2 regularization.
However, it does so by using M-estimators [109] rather than mean of the distribution as its central value, thus, making it more resistant to outliers. We suggest that, due to this property, it will result in slightly better predictions compared with the baseline approach. The loss function of the Huber regressor can be mathematically formulated in the following way:
min w , σ i = 1 n σ + H ϵ x i , j w y i σ σ + α j = 1 m w j 2
where H ϵ ( z ) takes the values of:
H ϵ ( z ) = z 2 , if | z | < ϵ , 2 ϵ | z | ϵ 2 , otherwise

4.3.4. Epsilon-Support Vector Regression—SVR

Similarly to Huber regressor, the Epsilon-Support Vector Regression, or SVR, has shown good resistance to outliers. Based on a classification algorithm of Support Vector Machines (SVM), SVR uses a kernel trick to perform regression in higher dimensions. As a result, SVR tends to generalize well without its computational complexity depending on dimensionality of the problem [110]. This generalization is mainly the result of SVR using an ϵ -insensitive region (also known as an ϵ -tube), that is often used to better approximate functions that have continuous values. With this property in mind, as well as the fact that SVR is known to perform well on smaller sets of data, our theory is that the overall prediction scores can be improved by applying the SVR algorithm in our experiments.

4.3.5. Keras Regressor

Deep-learning methods have recently shown promising results in the field of automatic personality recognition [58,62,80]. While there have been several different architectures for deep-learning models that achieved promising results, we decided to focus on KerasRegressor—a part of the Keras library.
Keras (https://keras.io/ (accessed on 28 March 2023)) is a high-level library for deep learning in the Python programming language that allowing for the easy and efficient construction of neural networks. As a part, KerasRegressor represents a deep-learning model trained to predict continuous values, such as stock prices and weather conditions. In our work, we experimented with several different architectures for the KerasRegressor model, subsequently selecting the best performing one.
The model consists of four fully connected layers, with the input shaped to match the data. We use a truncated normal kernel initializer and ReLU activation function with Adam functioning as an optimizer. The model is compiled using the root mean squared error as a loss function and trained over 30 epochs with a batch size of 32 to accommodate for the size of the data.

4.3.6. Boosting Algorithms

Boosting algorithms are a useful option when working with weak estimators. Boosting hierarchically builds a model, attempting to minimize the error over time. The three most popular ensemble learning models that implement gradient boosting algorithms are XGBoost (https://xgboost.readthedocs.io/en/stable/ (accessed on 28 March 2023)), LightGBM (https://lightgbm.readthedocs.io/en/v3.3.2/ (accessed on 28 March 2023)) and Catboost (https://catboost.ai/ (accessed on 28 March 2023)). While the first two algorithms utilize asymmetrical trees—with XGBoost growing vertically and LightGBM horizontally, Catboost relies on symmetrical trees.
These algorithms have performed well on many different prediction tasks so far. For our task, we selected XGBoost due to it relying on asymmetrical trees that expand level-wise rather than leaf-wise, as well as the splitting method it uses. Additionally, recent works in personality computing have reported promising results when using XGBoost for prediction of the MBTI personality types [111]. However, it should be noted that boosting algorithms are not advised for smaller sets of data or in cases where the features outnumber the data samples as this can lead to overfitting.
These factors can potentially pose an issue in the case of the PANDORA dataset, as the amount of Big Five labels is relatively small. In order to minimize the risk of overfitting, we used 100 early stopping epochs [112] as well as performed five-fold cross validation during the training process.
Since XGBoost uses many different hyperparameters, it is difficult to tell which combination would lead to most optimal results. For this purpose, we relied on the Optuna (https://github.com/optuna/optuna (accessed on 28 March 2023)) package for searching the hyperspace, in an effort to find the best possible combination of parameters for our experiments. Table 3 lists the parameters and their values as calculated by the optimization package used in our work.

4.4. Ethical Approach to Personality Research

Before going over the results of our experiments, it is important to address the issue of ethics in personality computing. While the field itself has been rapidly developing [6], one of the most frequently cited reasons for the lack of easily accessible personality-relevant data has been privacy concerns. In fact, it is due to these reasons that the work of Kosinski et al. [55] on the MyPersonality dataset had to be removed from the internet.
A report by Fang et al. [19] stated that only about 10% of research papers reflect on the ethics and fairness of research into personality. Due to this, we suggest that this poses an issue of utmost importance for the research field. The improper handling of private data can lead to personal information being used in unintended and harmful ways, such as profiling and targeting individuals with particular services or advertisements.
In order to assure ethical research in our study, we made sure to comply with the guidelines specified by the Reddit social media platform. Additionally, our study complies with the set of rules specified by the authors of the PANDORA dataset (https://psy.takelab.fer.hr/datasets/all/pandora/ (accessed on 28 March 2023)) [7]. Due to this, we made sure to remove data from any user whose information can no longer be publicly accessed through Reddit. Additionally, we report all findings of our research on the aggregate level only, assuring the protection of privacy for the participants.

5. Results

In Section 4, we detailed several approaches that rely on different features and algorithms. Due to the large quantity of these approaches and for the sake of providing a detailed and structured comparison between the results of our experiments, we separate this chapter into two subsections, with Figure 9 providing a general overview of the flow of our experiments. In the first subsection, we focus on listing the results achieved through the feature selection approach, while the second part reports the results for each of the different regression algorithms applied. Additionally, we provide a more streamlined and concise overview of our findings in (Section 6).
Before detailing the results of our experiments, we briefly go over the results of the baseline approach as well as the evaluation criteria. Gjurković et al. [7] were the first to test the hypothesis of using MBTI and Enneagram predictions to successfully predict Big Five labels. In their experiments, they used several different feature sets, such as 
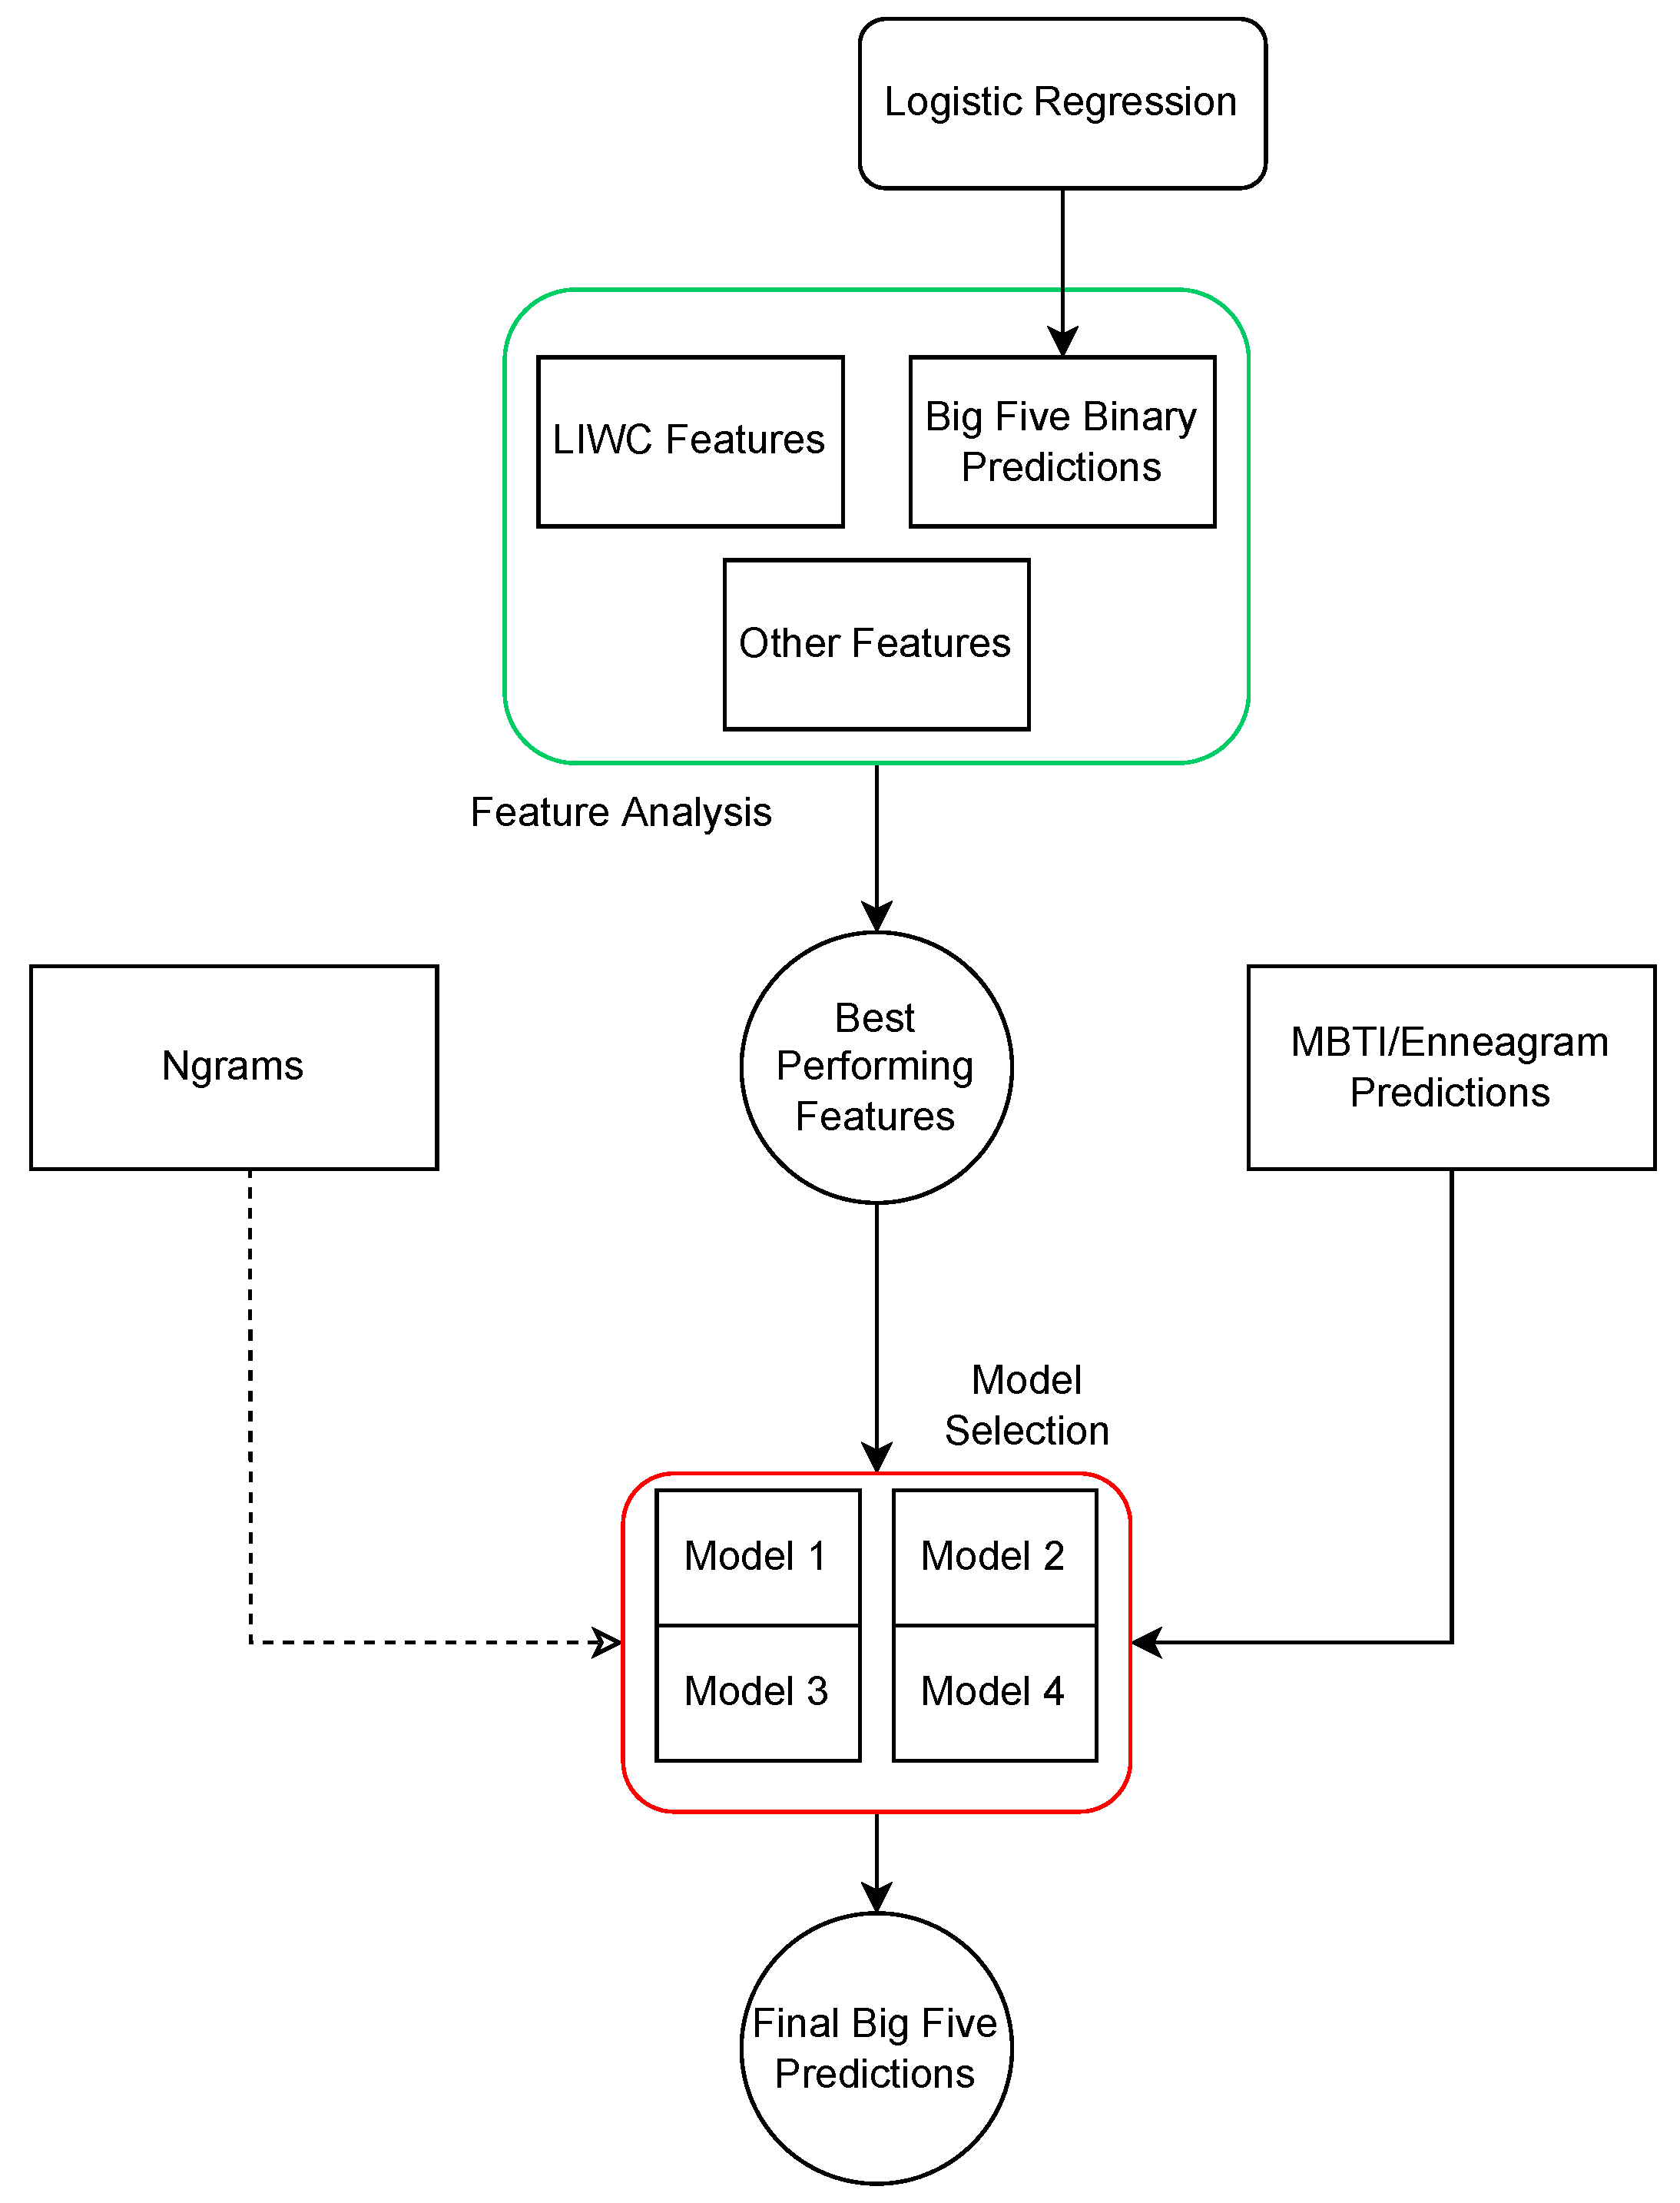
n-grams and MBTI/Enneagram predictions that were the result of logistic regression models. These features were later combined with regression models to acquire the predicted Big Five labels. In Table 4, we present the correlations between the predicted MBTI types and Big Five traits with the ground truth labels present in the PANDORA dataset as reported by Gjurković et al. [7].
Their best performing model was a L2 regularized linear regression model that used a combination of n-grams and predictions of the MBTI/Enneagram labels as features, yielding the best results for nearly all of the Big Five personality traits. The only exception was the Openness trait, which demonstrated better performances when the same regression model was used, only without the MBTI/Enneagram predictions in the feature set. The metric used to evaluate the performance of these models is known as the Pearson correlation coefficient [113]. The results of their experiments are reported in Table 5 for the sake of providing a reference when comparing the results with those achieved through experiments.
While Gjurković et al. chose the Pearson correlation coefficient for their evaluation metric, it is essential to note that various metrics have been used in personality computing to evaluate the performances of different models [6]. When focusing strictly on regression problems, the Pearson r correlation is not an uncommon metric; however, in the cases where the data do not follow a normal distribution, Spearman’s rank correlation coefficient might be a slightly better choice. Additionally, it was proposed by Fang et al. [19] to use more than a single metric when evaluating personality-recognition approaches.
For example, using the mean squared error (MSE) in addition to correlation metric would reveal the absolute difference between predictions and how the model follows the trend. In our work, we chose to focus on exploring the effectiveness of different features and algorithms for personality prediction, and how they capture the relationship between multiple models. For the sake of allowing direct comparisons with previous work, we decided to use only a single metric that has been used, which is the Pearson r correlation coefficient.
For the sake of readability, when reporting correlation scores for the four MBTI dichotomies, we report a score for only a single value out of the two in a dichotomy. The reason behind this decision can be explained by the fact that a score for the other value would be equal to the same number being multiplied by 1 , as each value represents an antipodal point of the other. For example, if the Introverted value of the E-I type shows correlation of 0.125 , the correlation of the Extroverted value would be 0.125 .

5.1. Feature Analysis

5.1.1. Big Five Classification Predictions—Median Split

When observing the results of the Big Five predictions achieved through the classification method, we notice that the overall correlation coefficients, in fact, decreased in comparison to the baseline approach (Table 6). While the correlations between the predicted Big Five traits treated as classes and the actual Big Five labels seem to be comparable to the results previously reported in the work of Gjurković et al. [7], the predictions of every single personality trait decreased, with the only exception being the Openness trait.
The likely reason for this is due to the predicted values made by the classification model of the Openness trait being more statistically independent from other personality traits, when compared to the statistical correlation exhibited by predictions made by the regression model (Table 7).

5.1.2. Big Five Classification Predictions—Quartile Split

When treating the prediction of Big Five traits as a three-class classification problem rather than a two-class one, we note that the correlations between these features and actual Big Five labels were worse than when the median value was used as suggested by the results reported in Table 8. While Openness remains the only personality trait to see improvements over the baseline approach, this is only when MBTI/Enneagram predictions are included in the feature set (Table 9).

5.1.3. Language-Based Features

When conducting analysis into psycholinguistic features, it should be noted that several researchers in the past have found correlations between the Big Five traits and different LIWC dimensions [49,59,104]. However, as the exact list of LIWC dimensions that correlate with each Big Five trait tends to differ on a dataset basis, it is possible that contextual information, in addition to personality, can have a huge influence on language usage that is measured by LIWC.
While it is possible to perform detailed research into how the Big Five personality traits have influenced language usage on the social media platform Reddit, such a study and its results could potentially introduce information leak into the prediction model if used for the regression task. In addition to this, the usage of psycholinguistic information based on its relationship with the Big Five personality traits would possibly minimize the effectiveness of MBTI/Enneagram predictions present in the feature set.
Instead, we focused on a statistical analysis of the MBTI types and how they influence language use on Reddit, as suggested by data present in the PANDORA dataset. Through this approach, we not only open the possibility of this information being leveraged in our prediction model but also provide insight into the linguistic nature of MBTI types. Table 10 and Table 11 include information about all the correlations present between LIWC dimensions and MBTI types.
The results reported in Table 10 and Table 11 highlight that the two MBTI types that tend to correlate with most of the LIWC dimensions are T-F with 69 and J-P with 54 statistically significant correlations. To establish whether an entire set of correlating LIWC dimensions can contribute to better predicting Big Five traits, we tested all the correlating LIWC dimensions as features, sorting them into four different groups—one for each MBTI type—and a fifth group that includes all 78 LIWC dimensions that were found to correlate with at least one type. The results of combining these features with n-grams, as well as MBTI/Enneagram predictions in the set of features, are reported in Table 12.

5.1.4. Identifying Useful LIWC Dimensions

While the results of predictions that utilize correlating LIWC dimensions gave promising results for predicting certain traits, it was only when paired with the previously computed MBTI/Enneagram predictions in the feature set that the results improved over baseline. This signals that, despite the LIWC features being an efficient indicator of personality traits, it is only when the relationship between the multiple personality models is leveraged that they become the most effective.
This is especially apparent for the Conscientiousness trait, which had some of the worst results without the MBTI/Enneagram predictions in the feature set but ended up outperforming the baseline results when predictions of the type-based personality models were reintroduced into the feature set. It is worth noting, however, that, due to a large amount of LIWC dimensions correlating with several MBTI types, that the potential benefit of certain psycholinguistic features are reduced by the sudden increase in the number of features.
Since this overlap between the LIWC dimensions that correlate with two or more MBTI types ranges from 51.85 % shared between the J-P and S-N types to 86.79 % between the E-I and T-F types, we needed to analytically determine which LIWC dimensions best describe the relationship between MBTI types and the Big Five traits that correlate with them. However, we suggest that several factors can be considered in order to improve the results by helping to select the adequate LIWC dimensions for the feature set.
The first factor is too high of a correlation with the MBTI type. While most of the correlations reported in Table 10 and Table 11 tend to be marginally significant, those that have exceeded the absolute value of 0.2 indicate a stronger relationship with the MBTI type, and as such are not a good indicator of the relationship present between MBTI and Big Five models. The second factor is the degree of correlation between MBTI types themselves. If the LIWC category correlates with both of the MBTI types that tend to correlate with each other, that LIWC category should be disregarded from the feature set. Finally, the third factor is the relationship present between the LIWC dimensions themselves. If the LIWC dimensions correlate with one another, only a single one should be selected, as LIWC categories need to be statistically independent from one another.
Using these three factors as criteria, we were left with the following list of LIWC dimensions that correlate with each of the four MBTI types:
  • Extroverted/Introverted (E-I) type:
    • shehe—third person singular pronouns (she, her, him…)
    • incl—inclusive words (e.g., with, and…)
    • number—numbers (first, thousand…)
    • present—present tense verbs (is, does, do…)
    • posemo—words associated with positive emotions (love, happy, hope...)
    • pronoun—total pronouns (I, they, it…)
  • Sensing/Intuitive (S-N) type:
    • WPS—average words per sentence
    • past—past tense verbs (walked, were…)
    • social—social words (we, thank, care…)
    • ipron—impersonal pronouns (that, what, it…)
    • Colon—number of colons (:)
  • Thinking/Feeling (T-F) type:
    • you—second person singular pronouns (u, yourself, you…)
    • article—number of article (a, an, the…)
    • sad—words relating to sadness (:(, cry…)
  • Judging/Perceiving (J-P) type:
    • Exclam—number of exclamations (!)
    • i—first person singular pronouns (me, myself, I…)
    • hear—auditory words (hear, sound…)
    • tentat—tentative phrases (if, any, something…)
Combining these LIWC dimensions in combination with their respective MBTI types, we achieved results in predicting the Big Five traits, which are reported in Table 13.
The results reported in Table 13 indicate that choosing LIWC dimensions with the method we described can further increase the results when predicting Big Five traits, especially in cases when the MBTI type and the Big Five trait have been found to statistically correlate with one other. This is visible for all the MBTI types as the prediction results for Openness increased when using LIWC dimensions that were selected for the S-N type, Agreeableness increased when using LIWC features for 
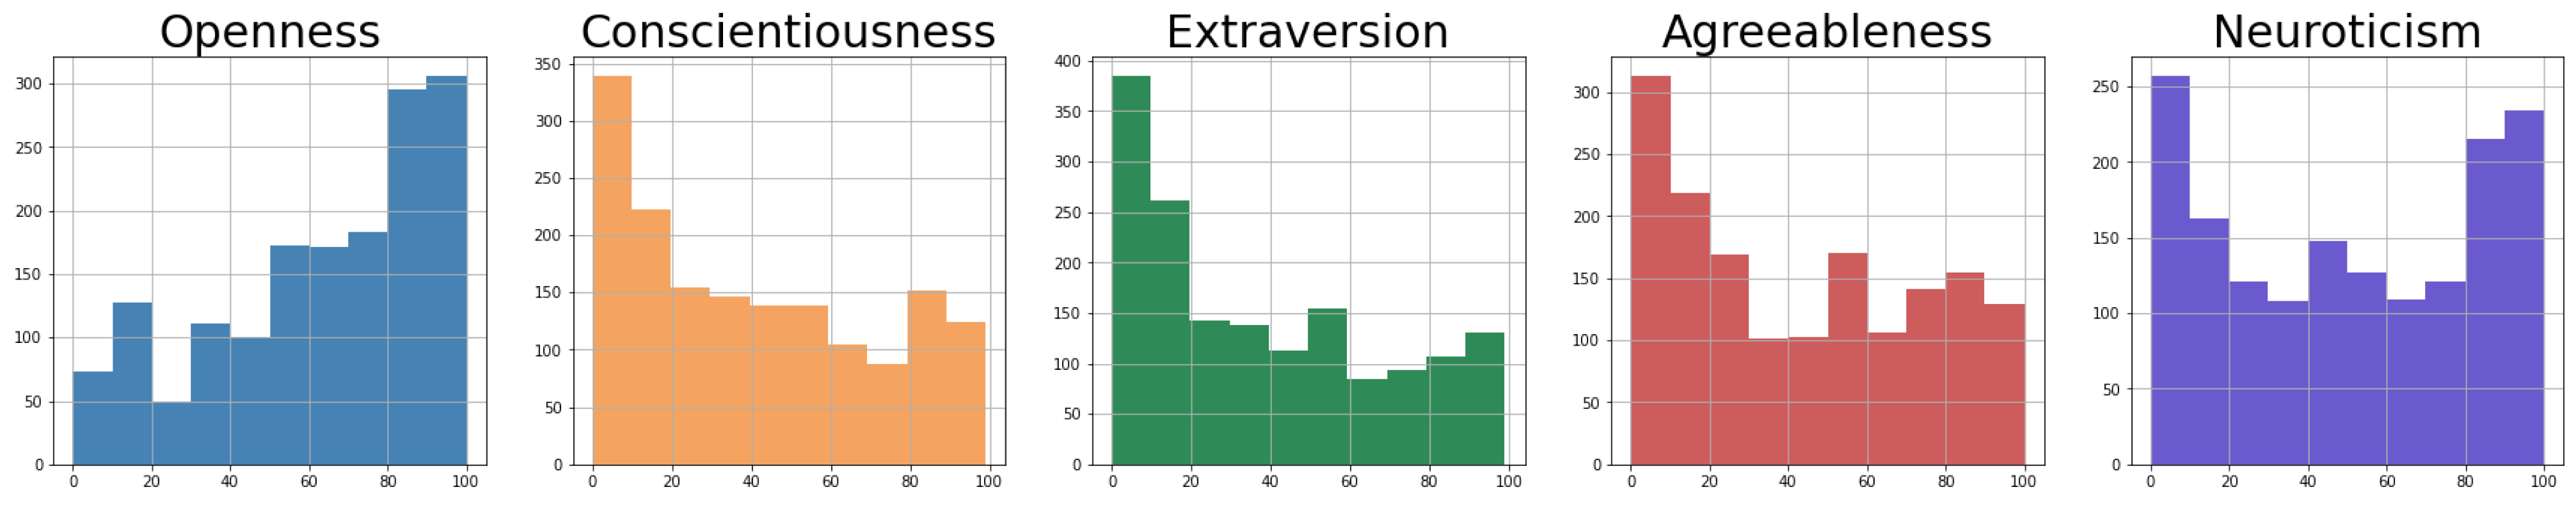
T-F, and so on. However, it should be noted that, despite the prediction scores for the Neuroticism trait increasing when using LIWC dimensions selected for the E-I and S-N types, we propose that this can be attributed either to a possible relationship between Enneagram and Neuroticism or due to the nature of the data, as Neuroticism is the only trait to follow a bimodal distribution in this dataset (Figure 6).
Unlike the MBTI types, Enneagram types have shown no presence of a statistically significant correlation with any of the LIWC dimensions.

5.1.5. Effect of Enneagram Predictions on the Big Five Predictions

While MBTI and Big Five personality models have been previously compared in the works of several authors [13,18,66,86], the relationship between the Enneagram and Big Five traits has not been thoroughly explored. This can be largely attributed to Enneagram often being underutilized in both academia and consulting—the two areas where the Big Five model and MBTI have enjoyed success, respectively. However, taking a closer look into the possible relationship between these models can help to better answer the question as to how Enneagram predictions can help the process of predicting Big Five personality traits.
The results reported in Table 14 indicate that, for certain Big Five traits, the results change drastically when the Enneagram predictions are removed from the feature set. This is visible when comparing them to the results reported in Table 13 as well as the results reported for the baseline approach. With this in mind, we make the following observations:
  • The model’s performance when predicting the Neuroticism trait without Enneagram predictions in the feature set decreases in comparison to all the feature sets that previously included Enneagram predictions.
  • The model’s performance when predicting both Conscientiousness and Agreeableness increases in almost every case when Enneagram predictions are removed from the feature set. The only exception to this is when the following LIWC dimensions appear in the feature set: shehe, incl, number, present, posemo and pronoun.
  • Predictions of the Openness trait either stay the same or only slightly fluctuate when Enneagram predictions are removed from the feature set, indicating that predicting this trait benefits only slightly from the Enneagram predictions.
The first of these three observations points towards the possible relationship existing between the Enneagram types and Big Five’s Neuroticism trait. This can be confirmed when observing the correlations between the Enneagram types and the Big Five traits that Gjurković et al. [7] reported in their work, which we list in Table 15 for reference.
Despite these results, it is still difficult to conclude whether the relationship between Enneagram and Neuroticism is result of the data’s nature, or a case of language usage that is associated with Neuroticism being shared with many of the Enneagram types. This is largely due to a lack of literature comparing Enneagram types to Big Five traits, especially from the perspective of language usage. As the PANDORA dataset contains a rather small number of Enneagram labels, as well as Big Five ones, it would be difficult to conduct an in-depth analysis into the topic from this dataset alone. However, we hope that these findings can help to motivate future research into the relationship between Enneagram types, Big Five traits and language usage shared between them, as we propose that it would be greatly beneficial for personality computing tasks conducted in the future.

5.1.6. Subreddit Participation

Analysing data from the PushShift dataset, we found that, in the period between the chronologically first and last comments present in the PANDORA dataset there has been activity on 879,826 different subreddits. Out of all these subreddits, the 50 most popular ones have mostly been those with a more general topics, such as r/AskReddit and r/worldnews. However, it is worth noting that, in the set of most popular subreddits, several personality related ones were included, e.g., r/mbti and several subreddits dedicated to specific MBTI types, such as r/INTP and r/ENFP. On the other hand, the PANDORA dataset included information on some 46,214 different subreddits, a considerably smaller number.
After forming feature vectors based on either the number of unique users participating in subreddits within the time window matching that of the PANDORA dataset or on the number of total comments, we found that these two feature vectors are nearly identical. This is due to the fact that total number of comments and number of unique users participating in subbreddits showed a high Pearson correlation of 0.83 . Consequently, we decided to only focus on the feature vector that is formed by using the total number of comments as a measurement of subreddit popularity. The results of predictions when using these features in the feature set are shown in Table 16.
While subreddit participation is visibly less effective when predicting Openness and Neuroticism, it caused a slight increase in the results when predicting Conscientiousness and Agreeableness with the success rates of predicting Extroversion remaining the same. We suggest that this is caused by the fact that vast numbers of subreddits present in the feature vector tend to be more general in nature, rather than topic-specific. This has contributed to them attracting different people that all, most likely, do not share much in the way of personality traits. However, as the relationship between interests and MBTI types has not been thoroughly studied in the existing literature, we decided not to further investigate the usefulness of this feature set, instead choosing to leave it for future works.

5.2. Model Selection

Features introduced in the previous subsection were all evaluated on the same L2 regularized regression model, which was also used as part of the method that achieved the baseline results. While some features led to improvements, they also, in turn, introduced additional complexity in the feature space. To additionally improve the results, we conducted experiments with several different regression models capable of weighing features in order to bring the most out of the them for the task of predicting Big Five traits.
For the sake of conciseness, as well as for easier comparison between the results, we chose to report the results for all the different models within a single table (Table 17). For features used as input to these models, we decided to select the best performing set, which was a combination of n-grams, MBTI/Enneagram predictions and certain LIWC features, which were selected in the way described in the subsection detailing the methods for selecting the best language based features (Section 5.1.4).
The first section of results in Table 17 outlines the results achieved by using the Ridge regression model, which are same as those previously reported in Table 13. When comparing these results to other sections of the table, we note that certain models, such as SVR, Huber regressor and Elastic-Net, led to improvements in predicting most of the Big Five traits, while Lasso regression, KerasRegressor and XGBoost demonstrated poor performance on the task overall. Out of the better performing models, Elastic-Net stands out as it scored the best on three out of five Big Five traits, namely Openness, Conscientiousness and Extroversion, while the Huber regressor and SVR proved to be better choices for predicting the remaining two Big Five traits.
Analysing the performance of the Lasso regression, which ended up being the worst performing model overall, we note that, despite the L1 regularization employed in an effort to remove noise from the feature set, it is possible that this actually led to a loss of several important features that were indicative of finer differences between personalities. As personality is a complex concept, it often tends to be both affected and manifested through the smallest differences present between individuals. As such, we speculate that L1 regularization caused the model to be less effective in efforts to capture these small differences, in turn, leading to poor performances on the task of Big Five personality trait prediction.
KerasRegressor resulted in predictions that correlate slightly worse than the baseline approach across all of the personality traits. While these results indicate worse performances than any of the other models included in Table 13, it should be noted that this approach outperformed the BERT-based method that Gjurković et al. [7] experimented on. While we tested different architectures of the KerasRegressor for this task, it is possible that a more complex deep-learning model would be capable of better capturing the relationship between the features used and personality traits.
Similarly to the KerasRegressor model, XGBoost also demonstrated less than satisfactory results. Despite improving on predictions of the Neuroticism trait over the baseline, the results for the other four personality traits saw a significant decrease in comparison to the baseline. We propose that, due to the small size, the data-boosting algorithm struggled to correctly predict the right value for each of the personality traits. Additionally, while the LIWC dimensions differed between feature sets, XGBoost showed almost identical results for each of the experiments. This leads us to believe that XGBoost is less capable of leveraging this language-related information and instead prioritizes features, such as n-grams and MBTI/Enneagram predictions from the feature set.
The best performing solution for the Agreeableness trait was when using the SVR model that included a subset of LIWC dimensions correlating with the T-F MBTI type (e.g., you, article and sad) in the feature set. While not the best performing model, SVR still managed to outperform the baseline approach using several different feature sets, especially when predicting the Agreeableness trait, for which it outperformed the baseline on every single experiment conducted.
We propose that these results are largely due to the SVR’s nature to work well with smaller sets of data, as well as the error function on which it relies. However, we must remark that SVR had worse results than the baseline on both the Openness and Extroversion traits—both of which have shown the overall highest correlations with n-gram features, indicating that SVR places less importance on this particular set of features when making predictions.
Another well-performing model is the Huber regressor, which demonstrated overall exemplary performances when predicting the Conscientiousness and Neuroticism personality traits, with the results for the other three traits also showing promise. When it comes to predictions for the Neuroticism trait, we suggest that good results are due to the Huber regressors capability of working well with outliers, possibly being more capable of working with the Neuroticism trait, which demonstrated the presence of bimodal distribution.
Out of all the models, the overall best performing one seems to be Elastic-Net, which performed best when predicting three of the five Big Five traits, namely Openness, Conscientiousness and Extroversion. The effectiveness of Elastic-Net can be attributed largely to the good balance of both the L1 and L2 regularization norms, which eliminated noisy features while simultaneously keeping those that influenced personality prediction, thus, utilizing them to capture subtle differences in personality.
We indicate that, despite the SVR and Huber regressor slightly outperforming Elastic-Net when predicting the Agreeableness and Neuroticism dimensions, the consistent improvements in scores for many different feature sets point towards Elastic-Net being the best overall choice for the task of predicting Big Five traits with the MBTI/Enneagram predictions present in the feature set.

6. Discussion

In the previous section, we outlined and briefly discussed the results from a variety of different feature and model-selection approaches. While experiments were conducted on several different algorithms, including deep-learning and ensemble methods, experimentation on linear regression models was more prevalent for the sake of highlighting the effectiveness of features, while also offering better interpretability comparability with the baseline approach. In the end, the set of features included MBTI/Enneagram prediction, a set of n-grams stemming from the work of Gjurković et al. [7] and a set of LIWC-based features created through method described in Section 5.1.4.
While the other features that were experimented with led to limited or no improvement at all for certain personality traits, they offered valuable insight into the nature of personality traits. When considering the experiments involving the conversion of Big Five personality prediction into a classification issue rather than a regression one, followed by using these predictions as features in a regression model, we observed that, except for Openness, none of the other personality traits saw improvement in the results (shown in Table 7 and Table 8).
Although it is possible that these improvements for the Openness trait can be attributed to data following a negatively skewed distribution (Figure 6), we suggest that this is a result of the classification predictions for Openness being more statistically independent from other 4 personality traits. Despite the previous research reporting promising results when using binning strategies [76], we propose that the possibility of information loss largely outweighs the positives of this approach [114,115] when predicting personality traits in this manner.
Another set of features that we experimented with was Reddit participation and the way in which this reflects on personality. As this particular set of features demonstrated overall little to no improvement, this suggests that personality has little effect on topical interests and the way they are expressed through Reddit (Table 16). However, as the majority of the most popular subreddits were those that centre around broader topics, it is possible that grouping certain interests into larger classes (e.g., hobbies, music-related and news), and using them as features could lead to a higher correlation with certain personality traits. Due to the breadth of the issue and the overall experimental complexity such study would warrant, we decided to leave it for future works.
The LIWC-based features introduced in our experiments led to improvements in predicting Big Five traits; however, they also introduced additionally complexity in the feature space. To best handle this and bring the most out of these features, an adequate regression model was necessary. Algorithms that achieved the best results on each of the Big Five traits did so when they used LIWC features selected through the methodology described in Section 5.1.4. The trait that saw the highest increase was Openness, correlating by 3.3 % more with the actual trait values than with the baseline approach.
These results were achieved when using combination of Elastic-Net model as predictor and a feature set consisting of n-grams, MBTI/Enneagram predictions and a set of LIWC features selected for S-N—an MBTI type with which Openness demonstrated a statistically significant correlation in the past. The same model yielded the best results for Conscientiousness when the LIWC features were selected for the J-P type, and Extroversion when LIWC features that correlated with for the E-I MBTI type were used.
In the case of these traits, the increase was 1.2 % for Conscientiousness and 2.1 % for Extroversion with a final correlation of 40.8 % for the Extroversion trait being the highest correlation value for an individual trait. The Huber regressor has achieved the exact same correlation percentage on the Conscientiousness dimension as the Elastic-Net model did when using the same features.
Additionally, the Huber regressor yielded the best results when predicting Neuroticism at 31.2 % correlation, scoring 2.9 % higher than the baseline approach. Finally, SVR model achieved an increase of 2.8 % in correlation over the baseline when predicting the Agreeableness trait, using n-grams, MBTI/Enneagram predictions and LIWC features selected for the T-F type, with which it demonstrated a statistically significant correlation.
When analysing the results achieved using the deep-learning model, it is a bit surprising to see it not perform as well as the other options, especially considering the popularity of deep-learning approaches for tasks of automatic personality recognition in recent years [58]. However, as Gjurković et al. [7] also reported similar results when applying a deep-learning algorithm, we can conclude that linear regression models tend to be the better choice in leveraging this particular set of features for prediction.
This is possibly due to the high linearity of features, as linear regression models tend to be designed to work best in these situations. Another possible contributing factor to ensemble and deep-learning approaches performing worse than expected could be that KerasRegressor and XGBoost require more data to be efficient.
One final experiment that we conducted was the analysis of the effect Enneagram predictions on the task of predicting the Big Five traits (Table 14). Our analysis indicated that, despite a considerable increase in prediction scores for the Conscientiousness and Agreeableness traits on several different feature sets, the scores for Neuroticism were worse every single time when Enneagram predictions were removed from the feature set. These results signal a possibility of a relationship existing between the Enneagram types and Big Five’s Neuroticism trait. This is significant due to the fact that Neuroticism has not been previously found to correlate with any of the MBTI types [13,17,18].

7. Conclusions

In this paper, we analysed the effectiveness of different features and algorithms when paired with the MBTI and Enneagram labels on the task of automatic personality recognition. We conducted multiple experiments, testing the performance of each feature set and prediction model in order to further explore the relationship between type-based models and the Big Five.
For our experiments, we looked into the effectiveness of standardising the domain of personality models by introducing the classification results of the Big Five prediction to the feature set. In addition to this, we also looked into the effect that language features extracted using the LIWC tool have on personality as well as the effect of social media participation. The best performing set of features included MBTI/Enneagram labels, a list of n-grams coming from previous work and a set of LIWC features that were selected based on their relationship with the MBTI types. The best performing feature set was then used as input for multiple different regression algorithms as well as a deep-learning and a boosting approach.
Our experiments suggest that an algorithm that utilised L1 and L2 normalisation led to the best performance, causing an improvement of up 3% for the Pearson correlation coefficient metric on a per-trait level. In addition to these findings, we examined the effectiveness of labels for the Enneagram model and their effectiveness on the prediction of Big Five traits. Our analysis points towards a possible relationship between the Enneagram types and the Big Five’s Neuroticism trait, as the correlation scores saw a decrease of almost 3% when Enneagram predictions were taken out of the feature set.
Possible directions in which this research can be taken in the future involve taking a closer look into the effects of interests and topics on the personality prediction. While we examined the possibility of subreddit popularity having an effect on the prediction of traits, such as Extroversion, it is possible that specific hobbies and involvement in subreddits centred around them could be an indicator of one’s personality. Additional directions in which this research can be expanded include applying the methods on different sets of data. While datasets that include information for multiple personality models are still scarce, other social media platforms, such as Twitter, could prove useful in collecting data for future experiments [60].
Finally, we propose that the results of this study can be helpful in further understanding personality as they indicate how well it can be captured when translating from one set of personality measures to another. The findings of our study can also be beneficial when seeking to create more believable dialogue agents, as it allows for inputs in the form of MBTI personality.

Author Contributions

Conceptualization, D.R. and R.R.; methodology, D.R.; software, D.R.; validation, D.R., R.R. and K.A.; formal analysis, D.R.; investigation, D.R.; resources, D.R.; writing—original draft preparation, D.R.; writing—review and editing, D.R., R.R. and K.A; visualization, D.R.; supervision, R.R. and K.A.; project administration, R.R. All authors have read and agreed to the published version of the manuscript.

Funding

This research received no external funding.

Institutional Review Board Statement

Not applicable.

Informed Consent Statement

Not applicable.

Data Availability Statement

This study utilizes the PANDORA dataset available at: https://psy.takelab.fer.hr/datasets/all/ (accessed on 28 March 2023), with the code for this research available at: https://github.com/hokudai-LML/personality-types-to-traits (accessed on 28 March 2023).

Acknowledgments

We would like to thank doctor Bojan Batalo from the University of Tsukuba for their continuous support in works leading up to this research.

Conflicts of Interest

The authors declare no conflict of interest.

Abbreviations

The following abbreviations are used in this manuscript:
Agreeable.Agreeableness
Conscient.Conscientiousness
Enne.Enneagram
LIWCLinguistic Inquiry and Word Count
MBTIMyers–Briggs Type Indicator
Preds.Predictions
Reg.Regression
SVMSupport Vector Machine
SVRSupport Vector Regression

References

  1. Vinciarelli, A.; Mohammadi, G. A survey of personality computing. IEEE Trans. Affect. Comput. 2014, 5, 273–291. [Google Scholar] [CrossRef] [Green Version]
  2. Uleman, J.S.; Adil Saribay, S.; Gonzalez, C.M. Spontaneous inferences, implicit impressions, and implicit theories. Annu. Rev. Psychol. 2008, 59, 329–360. [Google Scholar] [CrossRef] [PubMed] [Green Version]
  3. Funder, D.C. Accurate personality judgment. Curr. Dir. Psychol. Sci. 2012, 21, 177–182. [Google Scholar] [CrossRef]
  4. Jhangiani, R.; Tarry, H.; Stangor, C. Principles of Social Psychology-1st International Edition; BCcampus: Victoria, BC, Canada, 2014. [Google Scholar]
  5. Engler, B. Personality Theories, 9th ed.; Cengage Learning: Boston, MA, USA, 2013. [Google Scholar]
  6. Phan, L.V.; Rauthmann, J.F. Personality computing: New frontiers in personality assessment. Soc. Personal. Psychol. Compass 2021, 15, e12624. [Google Scholar] [CrossRef]
  7. Gjurković, M.; Karan, M.; Vukojević, I.; Bošnjak, M.; Snajder, J. PANDORA Talks: Personality and Demographics on Reddit. In Proceedings of the Ninth International Workshop on Natural Language Processing for Social Media, Online, 10 June 2021; pp. 138–152. [Google Scholar] [CrossRef]
  8. Worrell, F.C.; Cross, W.E., Jr. The reliability and validity of Big Five Inventory scores with African American college students. J. Multicult. Couns. Dev. 2004, 32, 18–32. [Google Scholar] [CrossRef]
  9. Fossati, A.; Borroni, S.; Marchione, D.; Maffei, C. The Big Five Inventory (BFI): Reliability and validity of its Italian translation in three independent nonclinical samples. Eur. J. Psychol. Assess. 2011, 27, 50. [Google Scholar] [CrossRef]
  10. Morsunbul, U. The validity and reliability study of the Turkish version of quick big five personality test. Dusunen Adam J. Psychiatry Neurol. Sci. 2014, 27, 316. [Google Scholar] [CrossRef] [Green Version]
  11. Mount, M.K.; Barrick, M.R.; Strauss, J.P. Validity of observer ratings of the big five personality factors. J. Appl. Psychol. 1994, 79, 272. [Google Scholar] [CrossRef]
  12. Van der Linden, D.; te Nijenhuis, J.; Bakker, A.B. The general factor of personality: A meta-analysis of Big Five intercorrelations and a criterion-related validity study. J. Res. Personal. 2010, 44, 315–327. [Google Scholar] [CrossRef]
  13. McCrae, R.R.; Costa, P.T., Jr. Reinterpreting the Myers-Briggs type indicator from the perspective of the five-factor model of personality. J. Personal. 1989, 57, 17–40. [Google Scholar] [CrossRef]
  14. Pittenger, D.J. Measuring the MBTI … and coming up short. J. Career Plan. Employ. 1993, 54, 48–52. [Google Scholar]
  15. Bess, T.L.; Harvey, R.J. Bimodal score distributions and the Myers-Briggs Type Indicator: Fact or artifact? J. Personal. Assess. 2002, 78, 176–186. [Google Scholar] [CrossRef] [PubMed]
  16. Thyer, B.A.; Pignotti, M. Science and Pseudoscience in Social Work Practice; Springer: New York, NY, USA, 2015. [Google Scholar] [CrossRef]
  17. MacDonald, D.A.; Anderson, P.E.; Tsagarakis, C.I.; Holland, C.J. Examination of the relationship between the Myers-Briggs Type Indicator and the NEO Personality Inventory. Psychol. Rep. 1994, 74, 339–344. [Google Scholar] [CrossRef]
  18. Furnham, A. The big five versus the big four: The relationship between the Myers-Briggs Type Indicator (MBTI) and NEO-PI five factor model of personality. Personal. Individ. Differ. 1996, 21, 303–307. [Google Scholar] [CrossRef]
  19. Fang, Q.; Giachanou, A.; Bagheri, A.; Boeschoten, L.; van Kesteren, E.J.; Kamalabad, M.S.; Oberski, D.L. On Text-based Personality Computing: Challenges and Future Directions. arXiv 2022, arXiv:2212.06711. [Google Scholar] [CrossRef]
  20. Digman, J.M. Personality structure: Emergence of the five-factor model. Annu. Rev. Psychol. 1990, 41, 417–440. [Google Scholar] [CrossRef]
  21. Diggle, J. Theophrastus: Characters; Cambridge University Press: Cambridge, UK, 2022. [Google Scholar]
  22. Singer, P.N.; Van der Eijk, P.J.; Tassinari, P. Galen: Works on Human Nature-Volume 1: Mixtures (De Temperamentis); Cambridge University Press: Cambridge, UK, 2019. [Google Scholar]
  23. Strelau, J.; Zawadzki, B. Temperament from a psychometric perspective: Theory and measurement. SAGE Handb. Personal. Theory Assess. 2008, 2, 352–373. [Google Scholar] [CrossRef]
  24. Kant, I. Kant: Anthropology from a Pragmatic Point of View; Cambridge University Press: Cambridge, UK, 2006. [Google Scholar]
  25. Stelmack, R.M.; Stalikas, A. Galen and the humour theory of temperament. Personal. Individ. Differ. 1991, 12, 255–263. [Google Scholar] [CrossRef]
  26. Leary, D.E. Immanuel Kant and the Development of Modern Psychology; University of Richmond: Richmond, VA, USA, 1982. [Google Scholar]
  27. Eysenck, H.; Eysenck, S. Eysenck Personality Questionnaire-Revised (EPQ-R); EdITS LLC/Educational and Industrial Testing Service: San Diego, CA, USA, 1984. [Google Scholar] [CrossRef]
  28. Cattell, H.E.P. The sixteen personality factor (16PF) questionnaire. In Understanding Psychological Assessment; Springer US: New York, NY, USA, 2001; Chapter 10; pp. 187–215. [Google Scholar] [CrossRef]
  29. Ashton, M.C.; Lee, K. Empirical, theoretical, and practical advantages of the HEXACO model of personality structure. Personal. Soc. Psychol. Rev. 2007, 11, 150–166. [Google Scholar] [CrossRef] [Green Version]
  30. McCrae, R.R.; John, O.P. An introduction to the five-factor model and its applications. J. Personal. 1992, 60, 175–215. [Google Scholar] [CrossRef]
  31. McCrae, R.R. The Five-Factor Model of Personality Traits: Consensus and Controversy; Cambridge Handbooks in Psychology; Cambridge University Press: Cambridge, UK, 2009; pp. 148–161. [Google Scholar] [CrossRef]
  32. Allport, G.W.; Odbert, H.S. Trait-names: A psycho-lexical study. Psychol. Monogr. 1936, 47, 22–38. [Google Scholar] [CrossRef]
  33. Myers, I.B. The Myers-Briggs Type Indicator: Manual (1962); Consulting Psychologists Press: Palo Alto, CA, USA, 1962. [Google Scholar] [CrossRef]
  34. Jung, C.G. Psychological Types: Volume 6; Princeton University: Princeton, NJ, USA, 1921. [Google Scholar]
  35. Štajner, S.; Yenikent, S. Why Is MBTI Personality Detection from Texts a Difficult Task? In Proceedings of the 16th Conference of the European Chapter of the Association for Computational Linguistics, Main Volume, Online, 19–23 April 2021; pp. 3580–3589. [Google Scholar] [CrossRef]
  36. Myers, I.B. Introduction to Type: A Description of the Theory and Applications of the Myers-Briggs Type Indicator; Consulting Psychologists Press: Palo Alto, CA, USA, 1997. [Google Scholar]
  37. Riso, D.R.; Hudson, R. Personality Types: Using the Enneagram for Self-discovery; Houghton Mifflin Harcourt: Boston, MA, USA, 1996. [Google Scholar]
  38. Kale, S.H.; Shrivastava, S. The enneagram system for enhancing workplace spirituality. J. Manag. Dev. 2003, 22, 308–328. [Google Scholar] [CrossRef]
  39. Kemboi, R.J.K.; Kindiki, N.; Misigo, B. Relationship between personality types and career choices of undergraduate students: A case of Moi University, Kenya. J. Educ. Pract. 2016, 7, 102–112. [Google Scholar]
  40. Lounsbury, J.W.; Park, S.H.; Sundstrom, E.; Williamson, J.M.; Pemberton, A.E. Personality, career satisfaction, and life satisfaction: Test of a directional model. J. Career Assess. 2004, 12, 395–406. [Google Scholar] [CrossRef]
  41. Seibert, S.E.; Crant, J.M.; Kraimer, M.L. Proactive personality and career success. J. Appl. Psychol. 1999, 84, 416–427. [Google Scholar] [CrossRef] [PubMed]
  42. Gerber, A.S.; Huber, G.A.; Doherty, D.; Dowling, C.M.; Raso, C.; Ha, S.E. Personality traits and participation in political processes. J. Politics 2011, 73, 692–706. [Google Scholar] [CrossRef]
  43. Caprara, G.V.; Schwartz, S.; Capanna, C.; Vecchione, M.; Barbaranelli, C. Personality and politics: Values, traits, and political choice. Political Psychol. 2006, 27, 1–28. [Google Scholar] [CrossRef]
  44. Blais, A.; St-Vincent, S.L. Personality traits, political attitudes and the propensity to vote. Eur. J. Political Res. 2011, 50, 395–417. [Google Scholar] [CrossRef]
  45. Taylor, A.; MacDonald, D.A. Religion and the five factor model of personality: An exploratory investigation using a Canadian university sample. Personal. Individ. Differ. 1999, 27, 1243–1259. [Google Scholar] [CrossRef]
  46. Lodi-Smith, J.; Roberts, B.W. Social investment and personality: A meta-analysis of the relationship of personality traits to investment in work, family, religion, and volunteerism. Personal. Soc. Psychol. Rev. 2007, 11, 68–86. [Google Scholar] [CrossRef] [Green Version]
  47. Roberts, B.W.; Kuncel, N.R.; Shiner, R.; Caspi, A.; Goldberg, L.R. The power of personality: The comparative validity of personality traits, socioeconomic status, and cognitive ability for predicting important life outcomes. Perspect. Psychol. Sci. 2007, 2, 313–345. [Google Scholar] [CrossRef] [Green Version]
  48. Picard, R.W. Affective Computing; MIT press: Cambridge, MA, USA, 2000. [Google Scholar]
  49. Pennebaker, J.W.; King, L.A. Linguistic styles: Language use as an individual difference. J. Personal. Soc. Psychol. 1999, 77, 1296–1312. [Google Scholar] [CrossRef] [PubMed]
  50. Argamon, S.; Dhawle, S.; Koppel, M.; Pennebaker, J.W. Lexical predictors of personality type. In Proceedings of the 2005 Joint Annual Meeting of the Interface and the Classification Society of North America, St. Louis, MS, USA, 8–12 June 2005; pp. 1–16. [Google Scholar]
  51. Mairesse, F.; Walker, M.A.; Mehl, M.R.; Moore, R.K. Using linguistic cues for the automatic recognition of personality in conversation and text. J. Artif. Intell. Res. 2007, 30, 457–500. [Google Scholar] [CrossRef] [Green Version]
  52. Oberlander, J.; Gill, A.J. Language with character: A stratified corpus comparison of individual differences in e-mail communication. Discourse Process. 2006, 42, 239–270. [Google Scholar] [CrossRef]
  53. Oberlander, J.; Nowson, S. Whose thumb is it anyway? Classifying author personality from weblog text. In Proceedings of the COLING/ACL 2006 Main Conference Poster Sessions, Sydney, Australia, 17–18 July 2006; pp. 627–634. [Google Scholar]
  54. Gill, A.; Nowson, S.; Oberlander, J. What are they blogging about? Personality, topic and motivation in blogs. In Proceedings of the International AAAI Conference on Web and Social Media, San Jose, CA, USA, 17–20 May 2009; Volume 3, pp. 18–25. [Google Scholar]
  55. Kosinski, M.; Matz, S.C.; Gosling, S.D.; Popov, V.; Stillwell, D. Facebook as a research tool for the social sciences: Opportunities, challenges, ethical considerations, and practical guidelines. Am. Psychol. 2015, 70, 543–556. [Google Scholar] [CrossRef] [PubMed] [Green Version]
  56. Kosinski, M.; Stillwell, D.; Graepel, T. Private traits and attributes are predictable from digital records of human behavior. Proc. Natl. Acad. Sci. USA 2013, 110, 5802–5805. [Google Scholar] [CrossRef] [Green Version]
  57. Wiegmann, M.; Stein, B.; Potthast, M. Celebrity profiling. In Proceedings of the 57th annual meeting of the Association for Computational Linguistics, Florence, Italy, 28 July–August 2 2019; pp. 2611–2618. [Google Scholar] [CrossRef]
  58. Mehta, Y.; Majumder, N.; Gelbukh, A.; Cambria, E. Recent trends in deep learning based personality detection. Artif. Intell. Rev. 2020, 53, 2313–2339. [Google Scholar] [CrossRef] [Green Version]
  59. Mehl, M.R.; Gosling, S.D.; Pennebaker, J.W. Personality in its natural habitat: Manifestations and implicit folk theories of personality in daily life. J. Personal. Soc. Psychol. 2006, 90, 862–877. [Google Scholar] [CrossRef] [Green Version]
  60. Celli, F.; Lepri, B. Is big five better than MBTI? A personality computing challenge using Twitter data. In Proceedings of the Fifth Italian Conference on Computational Linguistics CLiC-it 2018, Torino, Italy, 10–12 December 2018; pp. 93–98. [Google Scholar] [CrossRef] [Green Version]
  61. Thornton, C.; Hutter, F.; Hoos, H.H.; Leyton-Brown, K. Auto-WEKA: Combined selection and hyperparameter optimization of classification algorithms. In Proceedings of the 19th ACM SIGKDD International Conference on Knowledge Discovery and Data Mining, Chicago, IL, USA, 11–14 August 2013; pp. 847–855. [Google Scholar] [CrossRef]
  62. Sun, X.; Liu, B.; Cao, J.; Luo, J.; Shen, X. Who am I? Personality detection based on deep learning for texts. In Proceedings of the 2018 IEEE International Conference on Communications (ICC), Kansas City, KS, USA, 20–24 May 2018; pp. 1–6. [Google Scholar] [CrossRef]
  63. Biel, J.I.; Gatica-Perez, D. The youtube lens: Crowdsourced personality impressions and audiovisual analysis of vlogs. IEEE Trans. Multimed. 2012, 15, 41–55. [Google Scholar] [CrossRef]
  64. Kazameini, A.; Fatehi, S.; Mehta, Y.; Eetemadi, S.; Cambria, E. Personality trait detection using bagged svm over bert word embedding ensembles. arXiv 2020, arXiv:2010.01309. [Google Scholar] [CrossRef]
  65. Devlin, J.; Chang, M.W.; Lee, K.; Toutanova, K. BERT: Pre-training of Deep Bidirectional Transformers for Language Understanding. In Proceedings of the 2019 Conference of the North American Chapter of the Association for Computational Linguistics: Human Language Technologies, Volume 1 (Long and Short Papers), Minneapolis, MN, USA, 2–7 June 2019; pp. 4171–4186. [Google Scholar] [CrossRef]
  66. Kerz, E.; Qiao, Y.; Zanwar, S.; Wiechmann, D. Pushing on Personality Detection from Verbal Behavior: A Transformer Meets Text Contours of Psycholinguistic Features. arXiv 2022, arXiv:2204.04629. [Google Scholar] [CrossRef]
  67. Li, C.; Hancock, M.; Bowles, B.; Hancock, O.; Perg, L.; Brown, P.; Burrell, A.; Frank, G.; Stiers, F.; Marshall, S.; et al. Feature extraction from social media posts for psychometric typing of participants. In Proceedings of the International Conference on Augmented Cognition, Las Vegas, NV, USA, 3 June 2018; pp. 267–286. [Google Scholar] [CrossRef]
  68. Ahmad, H.; Asghar, M.U.; Asghar, M.Z.; Khan, A.; Mosavi, A.H. A hybrid deep learning technique for personality trait classification from text. IEEE Access 2021, 9, 146214–146232. [Google Scholar] [CrossRef]
  69. Li, Y.; Kazemeini, A.; Mehta, Y.; Cambria, E. Multitask learning for emotion and personality traits detection. Neurocomputing 2022, 493, 340–350. [Google Scholar] [CrossRef]
  70. Schwartz, H.A.; Eichstaedt, J.C.; Kern, M.L.; Dziurzynski, L.; Ramones, S.M.; Agrawal, M.; Shah, A.; Kosinski, M.; Stillwell, D.; Seligman, M.E.; et al. Personality, gender, and age in the language of social media: The open-vocabulary approach. PLoS ONE 2013, 8, e73791. [Google Scholar] [CrossRef]
  71. Farnadi, G.; Zoghbi, S.; Moens, M.F.; De Cock, M. Recognising personality traits using facebook status updates. In Proceedings of the International AAAI Conference on Web and Social Media, Cambridge, MA, USA, 8–11 June 2013; Volume 7, pp. 14–18. [Google Scholar]
  72. Verhoeven, B.; Daelemans, W.; De Smedt, T. Ensemble methods for personality recognition. In Proceedings of the International AAAI Conference on Web and Social Media, Cambridge, MA, USA, 8–11 July 2013; Volume 7, pp. 35–38. [Google Scholar]
  73. Celli, F.; Pianesi, F.; Stillwell, D.; Kosinski, M. Workshop on computational personality recognition: Shared task. In Proceedings of the International AAAI Conference on Web and Social Media, Cambridge, MA, USA, 8–11 July 2013; Volume 7, pp. 2–5. [Google Scholar]
  74. Park, G.; Schwartz, H.A.; Eichstaedt, J.C.; Kern, M.L.; Kosinski, M.; Stillwell, D.J.; Ungar, L.H.; Seligman, M.E. Automatic personality assessment through social media language. J. Personal. Soc. Psychol. 2015, 108, 934. [Google Scholar] [CrossRef] [Green Version]
  75. Youyou, W.; Kosinski, M.; Stillwell, D. Computer-based personality judgments are more accurate than those made by humans. Proc. Natl. Acad. Sci. USA 2015, 112, 1036–1040. [Google Scholar] [CrossRef] [Green Version]
  76. Segalin, C.; Celli, F.; Polonio, L.; Kosinski, M.; Stillwell, D.; Sebe, N.; Cristani, M.; Lepri, B. What your Facebook profile picture reveals about your personality. In Proceedings of the 25th ACM International Conference on Multimedia, Mountain View, CA, USA, 23–27 October 2017; pp. 460–468. [Google Scholar] [CrossRef] [Green Version]
  77. Tandera, T.; Suhartono, D.; Wongso, R.; Prasetio, Y.L. Personality prediction system from facebook users. Procedia Comput. Sci. 2017, 116, 604–611. [Google Scholar] [CrossRef]
  78. Kulkarni, V.; Kern, M.L.; Stillwell, D.; Kosinski, M.; Matz, S.; Ungar, L.; Skiena, S.; Schwartz, H.A. Latent human traits in the language of social media: An open-vocabulary approach. PLoS ONE 2018, 13, e0201703. [Google Scholar] [CrossRef] [Green Version]
  79. Ramos, R.; Neto, G.; Silva, B.; Monteiro, D.; Paraboni, I.; Dias, R. Building a corpus for personality-dependent natural language understanding and generation. In Proceedings of the Eleventh International Conference on Language Resources and Evaluation (LREC 2018), Miyazaki, Japan, 7–12 May 2018; pp. 1138–1145. [Google Scholar]
  80. Xue, D.; Wu, L.; Hong, Z.; Guo, S.; Gao, L.; Wu, Z.; Zhong, X.; Sun, J. Deep learning-based personality recognition from text posts of online social networks. Appl. Intell. 2018, 48, 4232–4246. [Google Scholar] [CrossRef]
  81. Marengo, D.; Sindermann, C.; Elhai, J.D.; Montag, C. One social media company to rule them all: Associations between use of Facebook-owned social media platforms, sociodemographic characteristics, and the big five personality traits. Front. Psychol. 2020, 11, 936. [Google Scholar] [CrossRef]
  82. Cristani, M.; Vinciarelli, A.; Segalin, C.; Perina, A. Unveiling the multimedia unconscious: Implicit cognitive processes and multimedia content analysis. In Proceedings of the 21st ACM International Conference on Multimedia, Barcelona, Spain, 21–25 October 2013; pp. 213–222. [Google Scholar] [CrossRef] [Green Version]
  83. Osterholz, S.; Mosel, E.I.; Egloff, B. #Insta personality: Personality expression in Instagram accounts, impression formation, and accuracy of personality judgments at zero acquaintance. J. Personal. 2022, 1–17. [Google Scholar] [CrossRef]
  84. Gjurković, M.; Šnajder, J. Reddit: A gold mine for personality prediction. In Proceedings of the Second Workshop on Computational Modeling of People’s Opinions, Personality, and Emotions in Social Media, New Orleans, LA, USA, 6 June 2018; pp. 87–97. [Google Scholar] [CrossRef] [Green Version]
  85. Wu, X.; Lin, W.; Wang, Z.; Rastorgueva, E. Author2Vec: A Framework for Generating User Embedding. CoRR 2020. [Google Scholar] [CrossRef]
  86. Radisavljević, D.; Batalo, B.; Rzepka, R.; Araki, K. Myers-Briggs Type Indicator and the Big Five Model—How Our Personality Affects Language Use. In Proceedings of the IEEE CSDE 2022, Gold Coast, Australia, 18–20 December 2022. [Google Scholar]
  87. Zhou, Z.; Xu, K.; Zhao, J. Extroverts tweet differently from introverts in Weibo. EPJ Data Sci. 2018, 7, 1–22. [Google Scholar] [CrossRef] [Green Version]
  88. Meng, K.S.; Leung, L. Factors influencing TikTok engagement behaviors in China: An examination of gratifications sought, narcissism, and the Big Five personality traits. Telecommun. Policy 2021, 45, 102172. [Google Scholar] [CrossRef]
  89. Plank, B.; Hovy, D. Personality traits on twitter—or—how to get 1500 personality tests in a week. In Proceedings of the sixth Workshop on Computational Approaches to Subjectivity, Sentiment and Social Media Analysis, Lisbon, Portugal, 17 September 2015; pp. 92–98. [Google Scholar] [CrossRef] [Green Version]
  90. Verhoeven, B.; Daelemans, W.; Plank, B. Twisty: A multilingual twitter stylometry corpus for gender and personality profiling. In Proceedings of the tenth Annual Conference on Language Resources and Evaluation (LREC 2016), Portorož, Slovenia, 23–28 May 2016; pp. 1–6. [Google Scholar]
  91. Tighe, E.; Cheng, C. Modeling personality traits of filipino twitter users. In Proceedings of the Second Workshop on Computational Modeling of People’s Opinions, Personality, and Emotions in Social Media, New Orleans, LA, USA, 6 June 2018; pp. 112–122. [Google Scholar] [CrossRef]
  92. Balakrishnan, V.; Khan, S.; Fernandez, T.; Arabnia, H.R. Cyberbullying detection on twitter using Big Five and Dark Triad features. Personal. Individ. Differ. 2019, 141, 252–257. [Google Scholar] [CrossRef]
  93. Cahyani, D.E.; Faishal, A.F. Classification of Big Five Personality Behavior Tendencies Based on Study Field with Twitter Analysis Using Support Vector Machine. In Proceedings of the 2020 seventh International Conference on Information Technology, Computer, and Electrical Engineering (ICITACEE), Online, 24–25 September 2020; pp. 140–145. [Google Scholar] [CrossRef]
  94. Bassignana, E.; Nissim, M.; Patti, V. Matching Theory and Data with Personal–ITY: What a Corpus of Italian YouTube Comments Reveals About Personality. In Proceedings of the Third Workshop on Computational Modeling of People’s Opinions, Personality, and Emotion’s in Social Media. Association for Computational Linguistics, Barcelona, Spain, 13 December 2020; pp. 11–22. [Google Scholar] [CrossRef]
  95. Mehta, Y.; Fatehi, S.; Kazameini, A.; Stachl, C.; Cambria, E.; Eetemadi, S. Bottom-up and top-down: Predicting personality with psycholinguistic and language model features. In Proceedings of the 2020 IEEE International Conference on Data Mining (ICDM), Sorrento, Italy, 17–20 November 2020; pp. 1184–1189. [Google Scholar] [CrossRef]
  96. Uysal, S.D.; Pohlmeier, W. Unemployment duration and personality. J. Econ. Psychol. 2011, 32, 980–992. [Google Scholar] [CrossRef] [Green Version]
  97. Daumé, H., III. Frustratingly Easy Domain Adaptation. In Proceedings of the 45th Annual Meeting of the Association of Computational Linguistics, Prague, Czech Republic, 23–30 June 2007; Association for Computational Linguistics: Prague, Czech Republic, 2007; pp. 256–263. [Google Scholar] [CrossRef]
  98. Peng, C.Y.J.; Lee, K.L.; Ingersoll, G.M. An introduction to logistic regression analysis and reporting. J. Educ. Res. 2002, 96, 3–14. [Google Scholar] [CrossRef]
  99. Hoerl, A.E.; Kennard, R.W. Ridge regression: Biased estimation for nonorthogonal problems. Technometrics 1970, 12, 55–67. [Google Scholar] [CrossRef]
  100. Majumder, N.; Poria, S.; Gelbukh, A.; Cambria, E. Deep learning-based document modeling for personality detection from text. IEEE Intell. Syst. 2017, 32, 74–79. [Google Scholar] [CrossRef]
  101. Ramírez-de-la Rosa, G.; Jiménez-Salazar, H.; Villatoro-Tello, E.; Reyes-Meza, V.; Rojas-Avila, J. A lexical–availability–based framework from short communications for automatic personality identification. Cogn. Syst. Res. 2023, 79, 126–137. [Google Scholar] [CrossRef]
  102. Boyd, R.L.; Pennebaker, J.W. Language-based personality: A new approach to personality in a digital world. Curr. Opin. Behav. Sci. 2017, 18, 63–68. [Google Scholar] [CrossRef] [Green Version]
  103. Boyd, R.L.; Schwartz, H.A. Natural language analysis and the psychology of verbal behavior: The past, present, and future states of the field. J. Lang. Soc. Psychol. 2021, 40, 21–41. [Google Scholar] [CrossRef] [PubMed]
  104. Holtgraves, T. Text messaging, personality, and the social context. JOurnal Res. Personal. 2011, 45, 92–99. [Google Scholar] [CrossRef]
  105. Pennebaker, J.W.; Francis, M.E.; Booth, R.J. Linguistic inquiry and word count: LIWC 2001. Mahway Lawrence Erlbaum Assoc. 2001, 71, 1–23. [Google Scholar]
  106. Vinciarelli, A.; Pantic, M.; Heylen, D.; Pelachaud, C.; Poggi, I.; D’Errico, F.; Schroeder, M. Bridging the gap between social animal and unsocial machine: A survey of social signal processing. IEEE Trans. Affect. Comput. 2011, 3, 69–87. [Google Scholar] [CrossRef] [Green Version]
  107. Baumgartner, J.; Zannettou, S.; Keegan, B.; Squire, M.; Blackburn, J. The pushshift reddit dataset. In Proceedings of the International AAAI Conference on Web and Social Media, Atlanta, GE, USA, 8–11 June 2020; Volume 14, pp. 830–839. [Google Scholar] [CrossRef]
  108. Tibshirani, R. Regression shrinkage and selection via the lasso. JOurnal R. Stat. Soc. Ser. B (Methodol.) 1996, 58, 267–288. [Google Scholar] [CrossRef]
  109. Huber, P.J. Robust statistics. In International Encyclopedia of Statistical Science; Springer: Berlin/Heidelberg, Germany, 2011; pp. 1248–1251. [Google Scholar] [CrossRef]
  110. Awad, M.; Khanna, R. Efficient Learning Machines; Apress Open: New York, NY, USA, 2015; Chapter 4; pp. 67–80. [Google Scholar] [CrossRef] [Green Version]
  111. Amirhosseini, M.H.; Kazemian, H. Machine learning approach to personality type prediction based on the myers–briggs type indicator®. Multimodal Technol. Interact. 2020, 4, 9. [Google Scholar] [CrossRef] [Green Version]
  112. Prechelt, L. Early stopping-but when? In Neural Networks: Tricks of the Trade; Springer: Berlin/Heidelberg, Germany, 1998; pp. 55–69. [Google Scholar] [CrossRef]
  113. Schober, P.; Boer, C.; Schwarte, L.A. Correlation coefficients: Appropriate use and interpretation. Anesth. Analg. 2018, 126, 1763–1768. [Google Scholar] [CrossRef]
  114. Irwin, J.R.; McClelland, G.H. Negative consequences of dichotomizing continuous predictor variables. J. Mark. Res. 2003, 40, 366–371. [Google Scholar] [CrossRef]
  115. Royston, P.; Altman, D.G.; Sauerbrei, W. Dichotomizing continuous predictors in multiple regression: A bad idea. Stat. Med. 2006, 25, 127–141. [Google Scholar] [CrossRef]
Figure 1. The frequency of personality models in book titles, showcasing interest in scientific circles for different personality models. The graph originates from https://books.google.com/ngrams (accessed on 28 March 2023). We note that the Big Five model is usually referred to as simply the “Big Five” in book titles.
Applsci 13 04506 g001
Figure 2. The frequency of personality models appearing as Google search terms, showcasing the interests of the general public. Data source: https://trends.google.com/trends/ (accessed on 28 March 2023).
Applsci 13 04506 g002
Figure 3. Graphical depiction of a sample Big Five test result.
Applsci 13 04506 g003
Figure 4. Example MBTI test results. The blue background indicates the dominant value of the dichotomy.
Applsci 13 04506 g004
Figure 5. Enneagram types with their virtues, passions and ego-fixations as described by the Bolivian philosopher Óscar Ichazo.
Applsci 13 04506 g005
Figure 6. Probability distribution for each of the Big Five personality trait labels present in the PANDORA dataset. While the previous research has suggested Big Five traits usually follow a normal distribution, labels present in the PANDORA dataset [7] seem to follow a more skewed one.
Applsci 13 04506 g006
Figure 7. Heatmap indicating linear correlation between labels for the Big Five traits and MBTI types present in the PANDORA dataset [7].
Applsci 13 04506 g007
Figure 8. Illustration of the model stack after introducing the Big Five classification predictions. Orange highlights the added logistic regression model that predicts Big Five traits as one of either two or three classes, depending on if the median or quartile values are used as separators between classes. The newly added model acts as a weak learner in the model stack.
Applsci 13 04506 g008
Figure 9. Simplified illustration of the pipeline behind our method. The green rectangle depicts feature selection approaches, while the red one highlights the model selection step.
Applsci 13 04506 g009
Table 2. The number of users and comments labelled with each of the personality models in the PANDORA dataset. The data in this table were adapted from the work of Gjurković et al. [7] CC-BY-NC.
Personality ModelNumber of UsersNumber of Comments
Big Five1608 3 , 006 , 566
Enneagram794 1 , 458 , 816
MBTI9084 15 , 597 , 237
Big Five and Enneagram64 235 , 883
Big Five and MBTI393 1 , 086 , 324
Enneagram and MBTI793 1 , 457 , 625
All three models63 234 , 692
Total 10 , 288 17 , 640 , 062
Table 3. Hyperparameters used by the XGBoost model for our experiments.
Parameter NameParameter Value
Number of estimators10,000
Learning rate 0.002
Maximum depth of a tree3
L1 regularization term 5.25
L2 regularization term 34.85
Subsample of columns 0.1
Subsample of training instances 0.7
Gamma0
Table 4. The results of the baseline approach. The Pearson correlation coefficient scores were adapted from the work of Gjurković et al. [7] CC-BY-NC.
OpennessConscient.ExtroversionAgreeablenessNeuroticism
Pearson corr. 0.250 0.2730.3870.2700.283
Bolded numbers represent the best result reported by Gjurković et al. [7].
Table 5. The Pearson correlation coefficient between the gold-standard Big Five labels and the predicted values of MBTI types and Big Five traits. Correlations adapted from the work of Gjurković et al. [7] CC-BY-NC.
OpennessConscient.ExtroversionAgreeablenessNeuroticism
Predicted…
Introverted−0.0820.039−0.262−0.003−0.002
Intuitive0.127−0.0210.0490.0600.001
Thinking−0.0010.038−0.039−0.259−0.172
Perceiving0.018−0.2410.0070.0340.039
Predicted...
Openness0.147−0.0820.2120.1450.070
Conscient.−0.0070.2370.013−0.112−0.090
Extroversion0.098−0.0280.2720.0440.022
Agreeableness0.006−0.0790.0230.2640.176
Neuroticism−0.048−0.025−0.0420.2310.162
Underlined numbers indicate significant correlation ( p < 0.05 ).
Table 6. Pearson correlation coefficient between the actual Big Five traits and the predictions achieved through usage of n-grams, MBTI/Enneagram predictions and median-split Big Five predictions as features.
FeaturesOpennessConscient.ExtroversionAgreeablenessNeuroticism
n-grams + Median Split Preds.0.2600.1840.3360.2460.257
n-grams + Median + Other Preds.0.2700.2250.3750.2630.255
Bold numbers mark a result that is outperforming the baseline.
Table 7. Correlations between the gold-standard Big Five labels and predictions that use median-delimited Big Five categories as features.
OpennessConscient.ExtroversionAgreeablenessNeuroticism
Median Preds.
Openness 0.198 −0.0530.1210.005−0.036
Conscient.−0.0780.227−0.039−0.037−0.061
Extroversion0.145−0.0430.3290.012−0.105
Agreeableness0.029-0.031−0.0010.2360.171
Neuroticism−0.008−0.023−0.0280.1600.246
Underlined numbers indicate significant correlation ( p < 0.05 ).
Table 8. Correlations between the gold-standard Big Five labels and predictions that use the quartile-delimited Big Five categories as features.
OpennessConscient.ExtroversionAgreeablenessNeuroticism
Quartile Preds.
Openness0.235−0.0250.160−0.011−0.018
Conscient.−0.0710.2510.010−0.039−0.078
Extroversion0.1710.0660.3500.039−0.011
Agreeableness−0.011−0.086−0.0280.2840.169
Neuroticism−0.039−0.107−0.0670.1520.234
Underlined numbers indicate significant correlation ( p < 0.05 ).
Table 9. Pearson correlation coefficient between the actual Big Five traits and predictions achieved through the usage of n-grams, MBTI/Enneagram predictions and quartile-split Big Five class predictions as features.
FeaturesOpennessConscient.ExtroversionAgreeablenessNeuroticism
n-grams + Quartile Preds.0.2430.2220.3720.2660.246
n-grams + Quartile + Other Preds.0.2590.2580.3860.2490.265
Bold numbers mark a result that is outperforming the baseline.
Table 10. Correlation between MBTI types and LIWC features present in the PANDORA dataset. LIWC features that correlate with at least one MBTI type are shown in the table.
IntrovertedIntuitiveThinkingPerceiving
LIWC Dim.
achieve 0.020 0.050 * * 0.091 * * 0.057 * *
adverb 0.010 0.012 0.193 * * 0.030 * *
affect 0.079 * * 0.014 0.208 * * 0.025 *
AllPunc 0.024 * 0.001 0.013 0.009
anger 0.034 * * 0.002 0.068 * * 0.075 * *
anx 0.027 * * 0.009 0.184 * * 0.038 * *
Apostro 0.019 0.022 * 0.100 * * 0.010
article 0.049 * * 0.034 * * 0.197 * * 0.014
assent 0.057 * * 0.043 * * 0.111 * * 0.051 * *
auxverb 0.030 * * 0.002 0.024 * 0.004
bio 0.062 * * 0.031 * * 0.080 * * 0.011
body 0.053 * * 0.049 * * 0.038 * * 0.010
cause 0.007 0.048 * * 0.153 * * 0.019
certain 0.019 0.059 * * 0.046 * * 0.014
cogmech 0.026 * 0.049 * * 0.068 * * 0.007
Colon 0.033 * * 0.023 * 0.038 * * 0.009
Comma 0.022 * 0.045 * * 0.007 0.002
conj 0.053 * * 0.012 0.137 * * 0.029 * *
Dash 0.036 * * 0.016 0.024 * 0.034 * *
death 0.061 * * 0.037 * * 0.088 * * 0.069 * *
Note: * when ( p < 0.05 ) and * * when ( p < 0.01 ).
Table 11. Continuation of Table 10—Correlation between MBTI types and LIWC features present in the PANDORA dataset. LIWC features that correlate with at least one MBTI type are shown in the table.
IntrovertedIntuitiveThinkingPerceiving
LIWC Dim. (2)
Dic 0.047 * * 0.012 0.121 * * 0.047 * *
discrep 0.027 * 0.001 0.068 * * 0.026 *
excl 0.003 0.006 0.028 * * 0.037 * *
Exclam 0.077 * * 0.033 * * 0.211 * * 0.038 * *
family 0.037 * * 0.067 * * 0.105 * * 0.075 * *
feel 0.061 * * 0.015 0.265 * * 0.030 * *
filler 0.040 * * 0.064 * * 0.151 * * 0.055 * *
friend 0.118 * * 0.037 * * 0.213 * * 0.020
funct 0.030 * * 0.010 0.103 * * 0.035 * *
future 0.023 * 0.009 0.108 * * 0.005
health 0.024 * 0.023 * 0.069 * * 0.059 * *
hear 0.013 0.022 * 0.126 * * 0.071 * *
home 0.007 0.084 * * 0.051 * * 0.097 * *
humans 0.067 * * 0.017 0.037 * * 0.001
i 0.038 * * 0.076 * * 0.236 * * 0.023 *
incl 0.087 * * 0.001 0.173 * * 0.076 * *
ingest 0.015 0.058 * * 0.020 0.042 * *
inhib 0.030 * * 0.037 * * 0.127 * * 0.047 * *
insight 0.019 0.078 * * 0.067 * * 0.020
ipron 0.006 0.064 * * 0.057 * * 0.026 *
leisure 0.034 * * 0.028 * * 0.033 * * 0.051 * *
money 0.028 * * 0.014 0.167 * * 0.068 * *
motion 0.036 * * 0.055 * * 0.001 0.095 * *
negate 0.035 * * 0.014 0.095 * * 0.024 *
negemo 0.030 * * 0.016 0.017 0.057 * *
nonfl 0.005 0.005 0.022 * 0.037 * *
number 0.054 * * 0.032 * * 0.074 * * 0.001
OtherP 0.052 * * 0.004 0.043 * * 0.024 *
Parenth 0.047 * * 0.011 0.003 0.016
past 0.003 0.044 * * 0.126 * * 0.025 *
percept 0.001 0.050 * * 0.224 * * 0.022 *
posemo 0.081 * * 0.005 0.265 * * 0.012
ppron 0.089 * * 0.064 * * 0.256 * * 0.053 * *
preps 0.005 0.045 * * 0.002 0.066 * *
present 0.062 * * 0.012 0.105 * * 0.004
pronoun 0.070 * * 0.027 * * 0.230 * * 0.033 * *
QMark 0.001 0.019 0.055 * * 0.048 * *
quant 0.036 * * 0.055 * * 0.032 * * 0.002
Quote 0.001 0.022 * 0.021 * 0.013
relativ 0.010 0.042 * * 0.037 * * 0.075 * *
relig 0.038 * * 0.041 * * 0.008 0.048 * *
sad 0.032 * * 0.025 * 0.121 * * 0.001
see 0.043 * * 0.060 * * 0.064 * * 0.024 *
SemiC 0.011 0.009 0.021 * 0.006
sexual 0.058 * * 0.007 0.051 * * 0.029 * *
shehe 0.072 * * 0.038 * * 0.130 * * 0.036 * *
Sixltr 0.014 0.075 * * 0.128 * * 0.016
social 0.127 * * 0.009 0.145 * * 0.051 * *
space 0.020 0.008 0.044 * * 0.047 * *
swear 0.049 * * 0.026 * 0.055 * * 0.086 * *
tentat 0.034 * * 0.017 0.001 0.031 * *
they 0.011 0.015 0.069 * * 0.045 * *
time 0.013 0.052 * * 0.118 * * 0.059 * *
verb 0.046 * * 0.025 * 0.127 * * 0.009
WC 0.006 0.007 0.070 * * 0.023 *
we 0.066 * * 0.030 * * 0.059 * * 0.023 *
work 0.018 0.017 0.147 * * 0.068 * *
WPS 0.020 0.023 * 0.044 * * 0.040 * *
you 0.066 * * 0.020 0.025 * 0.030 * *
Note: * when ( p < 0.05 ) and ** when ( p < 0.01 ).
Table 12. The Pearson correlation coefficient between the actual Big Five traits and the ones predicted using combinations of n-grams, MBTI/Enne. predictions and various LIWC dimensions are divided in sets based on which MBTI type they correlate with.
FeaturesOpennessConscient.ExtroversionAgreeablenessNeuroticism
n-grams + …
Introverted Correlating LIWC0.2290.1480.3210.2120.249
Intuitive Correlating LIWC0.2320.1590.3240.2300.238
Thinking Correlating LIWC0.2160.1500.3400.2030.241
Perceiving Correlating LIWC0.2280.1540.3190.2160.243
All MBTI Types Correlating LIWC0.2140.1500.3300.2060.237
n-grams + MBTI/Enne. + …
Introverted Correlating LIWC0.2340.2740.3790.2580.279
Intuitive Correlating LIWC0.2390.2830.3840.2720.266
Thinking Correlating LIWC0.2210.2730.3890.2860.298
Perceiving Correlating LIWC0.2350.2740.3860.2490.282
All MBTI Types Correlating LIWC0.2270.2710.3820.2530.289
Bold numbers mark a result that is outperforming the baseline approach.
Table 13. Pearson correlation coefficient between the gold-standard Big Five labels and predictions achieved through using combinations of n-grams, MBTI/Enneagram predictions and selected LIWC dimensions for each of the MBTI traits (from top to bottom: (1) E-I, (2) S-N, (3) T-F and (4) J-P).
FeaturesOpennessConscient.ExtroversionAgreeablenessNeuroticism
n-grams + MBTI/Enne. Preds. + …
shehe, incl, number, present, posemo, pronoun0.2560.2700.4070.2630.296
WPS, past, social, ipron, Colon0.2650.2750.3920.2730.290
you, article, sad0.2500.2720.3810.2890.283
Exclam, i, hear, tentat0.2460.2830.3840.2690.272
Bold numbers mark a result that is outperforming the baseline approach.
Table 14. The Pearson correlation coefficient between the gold-standard Big Five labels and predictions achieved through using n-grams, MBTI predictions and selected LIWC dimensions in the feature set with the Enneagram predictions omitted. LIWC dimensions selected for each MBTI type follow the same order described in Table 13 (e.g., from top to bottom: (1) E-I, (2) S-N, (3) T-F and (4) J-P)).
FeaturesOpennessConscient.ExtroversionAgreeablenessNeuroticism
n-grams + …
Baseline without Enne. Preds.0.2500.2810.3740.2760.258
n-grams + MBTI Preds. + …
shehe, incl, number, present, posemo, pronoun0.2420.2770.3800.2660.268
WPS, past, social, ipron, Colon0.2530.2850.3780.2780.267
you, article, sad0.2500.2810.3700.2990.256
Exclam, i, hear, tentat0.2480.2930.3710.2740.248
Bold numbers indicate results that outperform results on the same model that use Enneagram predictions in their feature set.
Table 15. The Pearson correlation coefficient of the gold-standard Big Five labels with the predicted values of Enneagram types as reported by Gjurković et al. [7] CC-BY-NC.
FeaturesOpennessConscient.ExtroversionAgreeablenessNeuroticism
Pred. Type
Enneagram Type 10.0020.032−0.0280.0470.025
Enneagram Type 2−0.0110.1080.0300.1350.046
Enneagram Type 30.0850.0140.071−0.064−0.069
Enneagram Type 40.0410.0170.0330.1660.159
Enneagram Type 50.067−0.035−0.060−0.121-0.076
Enneagram Type 6−0.0510.004−0.0350.0460.113
Enneagram Type 7−0.043−0.0190.078−0.085−0.088
Enneagram Type 80.022−0.0440.063−0.129−0.075
Enneagram Type 9−0.034−0.016−0.1020.041−0.005
Underlined numbers indicate significant correlation ( p < 0.05 ).
Table 16. The Pearson correlation coefficient between the actual Big Five traits and predictions achieved through usage of n-grams, MBTI/Enneagram predictions and subreddit participation in the feature set.
FeaturesOpennessConscient.ExtroversionAgreeablenessNeuroticism
n-grams + Subreddits0.2080.1600.3310.1710.224
n-grams + Subreddits + MBTI/Enne.0.2250.2740.3870.2740.252
Bold numbers mark a result that is outperforming the baseline approach.
Table 17. Scores for predicting the gold-standard Big Five labels using combinations of n-grams, MBTI/Enneagram predictions and LIWC dimensions selected through process outlined in the previous subsection (Table 14) evaluated on different models.
FeaturesOpennessConscient.ExtroversionAgreeable.Neuroticism
Ridge Reg.E-I0.2560.2700.4070.2630.296
S-N0.2650.2750.3920.2730.290
T-F0.2500.2720.3810.2890.283
J-P0.2460.2830.3840.2690.272
Lasso Reg.E-I0.1670.2660.3580.2640.281
S-N0.1810.2680.3470.2680.270
T-F0.1700.2670.3200.2560.247
J-P0.1680.2700.3270.2630.259
Elastic-NetE-I0.2690.2700.4080.2640.310
S-N0.2830.2830.3970.2740.298
T-F0.2630.2720.3880.2890.296
J-P0.2670.2850.3910.2650.292
Huber Reg.E-I0.2550.2690.3960.2600.312
S-N0.2630.2760.3840.2720.288
T-F0.2450.2720.3750.2840.274
J-P0.2540.2850.3780.2680.266
SVRE-I0.2300.2740.3700.2820.291
S-N0.2320.2670.3610.2890.286
T-F0.2420.2740.3590.2980.279
J-P0.2420.2820.3580.2940.279
Keras Reg.E-I0.2350.1790.3680.2230.228
S-N0.2340.1810.3690.2200.231
T-F0.2390.1780.3590.2310.230
J-P0.2490.1710.3590.2100.227
XGBoostE-I0.2240.2190.3370.2490.285
S-N0.2160.2190.3490.2530.284
T-F0.2220.2240.3350.2500.287
J-P0.2210.2170.3370.2560.286
Underlined numbers outperform the baseline; Bold numbers mark the best performing result.
Disclaimer/Publisher’s Note: The statements, opinions and data contained in all publications are solely those of the individual author(s) and contributor(s) and not of MDPI and/or the editor(s). MDPI and/or the editor(s) disclaim responsibility for any injury to people or property resulting from any ideas, methods, instructions or products referred to in the content.

