Article

The Effects of Energy on the Relationship between the Acoustic Focal Region and Biological Focal Region during Low-Power Cumulative HIFU Ablation

College of Metrology and Measurement Engineering, China Jiliang University, Hangzhou 310018, China
*
Author to whom correspondence should be addressed.
Appl. Sci. 2023, 13(7), 4492; https://doi.org/10.3390/app13074492
Submission received: 24 February 2023 / Revised: 20 March 2023 / Accepted: 28 March 2023 / Published: 1 April 2023

Abstract

:
The biological focal region (BFR) induced by a single high-intensity focused ultrasound (HIFU) exposure is considered to be the foundation of the ultrasound ablation of tumor lesions. The purpose of this study was to explore the relationship between the acoustic focal region (AFR) and the BFRs with different combinations of power and time in low-power cumulative HIFU treatment. The finite-difference time-domain (FDTD) method was used to simulate AFR and BFR during HIFU ablation. The acoustic fields, the temperature profiles, and the shapes of BFRs were calculated by the Westervelt equation, Pennes’ equation, and the equivalent thermal dose model. In order to verify the simulation rules, phantom and ex vivo bovine livers were exposed by HIFU with a different power and time. The results demonstrated that in the low-power cumulative HIFU treatment, when the lengths of BFRs and the length of AFR were approximately equal, the shape of the BFR induced by ‘high power × short time’ exposure was closer to that of AFR than the shape of the BFR induced by ‘low power × long time’ exposure, and the exposure energy required was significantly reduced. The analysis revealed the relationship between the BFR and the AFR with different acoustic power. This study provides a reference for doctors to determine power, time, and movement distance in clinical treatment.

1. Introduction

High-intensity focused ultrasound (HIFU) therapy is a non-invasive medical technology in which an ultrasound beam is focused within the body to locally affect the targeted site without damaging intervening tissues [1]. The most common HIFU regime in clinical use is thermal ablation, which has been widely used in the clinical treatment of breast cancer, uterine fibroids, prostate cancer, and other solid tumors [2,3]. In the early stage of HIFU technology as applied to biological tissue, the description of coagulation necrosis under HIFU treatment was not clear. With the development of HIFU technology, the energy storage form and expression mode of HIFU in biological tissues, and how to quantify the biological effects of HIFU, have become topics of widespread concern. The coagulation necrosis formed by the energy deposition of HIFU in the tissue was named as the biological focal region (BFR) by Wang et al. [4,5]. It is reported that the shape of a BFR produced by HIFU is not only related to the acoustic focal region (AFR) of a transducer but also to the acoustic power, exposure time, and energy deposition in biological tissue. When other physical parameters remain unchanged, the size and shape of coagulation necrosis induced by HIFU exposure are related to the exposure energy (acoustic power × exposure time) [6], but the specific relationship between them has not been reported in detail. The length of the AFR of a transducer is a function of acoustic frequency alone, independent of acoustic source intensity [7]. The correlation between acoustic source intensity, exposure time, focus depth, and BFR in tissues during HIFU ablation was studied by Li et al. [8]. Several studies have analyzed the relationship between the shape of BFR and exposure energy by using different acoustic power and exposure time, finding that when the exposure energy is in a certain range, there is a linear correlation between them [9,10,11]. However, the BFR does not increase indefinitely. It is limited to increase the necrosis by increasing the acoustic power and prolonging the exposure time.
Traditional HIFU usually uses a high input power (400–1000 W); high power means that the temperature of tissue rises rapidly, and it is difficult to control. The shape of necrosis induced by HIFU is always undesirable due to the cavitation effect. Zhao et al. proposed a new treatment strategy, called low-power cumulative HIFU [12,13]. Low-power cumulative HIFU makes the acoustic intensity lower than the cavitation threshold (1000 W/cm2 [14]) and achieves its therapeutic purpose through thermal diffusion and thermal accumulation. Low-power cumulative HIFU has been applied to the treatment of pancreatic cancer (acoustic power 100–300 W) and myxofibrosarcoma (acoustic power 120–150 W). The results showed that compared with traditional HIFU treatment, continuous low-power cumulative HIFU treatment could achieve a better efficacy and reduce the harm to patients. In this study, the model was constructed to simulate a low-power cumulative HIFU exposure process by the finite-difference time-domain (FDTD) method. The acoustic fields and the temperature profiles are caculated by Westervelt equation and Pennes equation, respectively, getting the shapes of BFRs. According to the non-negligible effect of thermal diffusion in low-power cumulative HIFU treatment, the effects of the shape of the AFR, acoustic power, and exposure time on the formation of BFRs in the specific medium in low-power cumulative HIFU treatment were analyzed.

2. Materials and Methods

2.1. Acoustic Model for Ultrasound Wave Propagation

The pressure distribution in the calculation domain was obtained by the nonlinear Westervelt equation [15,16], which is expressed as:
2 p 1 c 0 2 2 p t 2 + δ c 0 4 3 p t 3 + β ρ 0 c 0 4 2 p t 2 = 0
where p is acoustic pressure, c0 is acoustic velocity, t is time, ρ0 is the density, β is the nonlinear coefficient, and δ is the acoustic diffusion coefficient. 2 is a Laplace operator, which can be expressed as 2 = 2 / r 2 + ( / r ) / r + 2 / z 2 .
The finite-difference time-domain (FDTD) method is usually used to solve the Westervelt equation, and the numerical solution of Equation (1) is calculated on the polar cylindrical grid. The ultrasonic source is modeled as a spherical shell shape about the axial symmetry of the sound source. The sound field and temperature field are calculated in the axial z and radial r directions using two-dimensional spatial grid x. The explicit FDTD method is generally used [17]. The FDTD method approximates the discrete difference of spatial and temporal partial derivatives. Each node on the computational grids is expanded from the Taylor series. The grids consist of two spatial dimensions (i, j) of uniform spacing Δ z and Δ r , alongside a time dimension n of uniform spacing Δ t . The time derivative of the Westervelt equation is calculated to the second-order accuracy:
2 p t 2 1 Δ t 2 p i , j n + 1 2 p i , j n + p i , j n 1
3 p t 3 1 2 Δ t 3 6 p i , j n 23 p i , j n 1 + 34 p i , j n 2 24 p i , j n 3 + 8 p i , j n 4 p i , j n 5
The spatial difference is calculated using the fourth-order accuracy:
p r 1 12 Δ r p i , j + 2 n + 8 p i , j + 1 n 8 p i , j 1 n + p i , j 2 n
2 p r 2 1 12 Δ r 2 p i , j + 2 n + 16 p i , j + 1 n 30 p i , j n + 16 p i , j 1 n p i , j 2 n
2 p z 2 1 12 Δ z 2 p i + 2 , j n + 16 p i + 1 , j n 30 p i , j n + 16 p i 1 , j n p i 2 , j n
The explicit difference equation of p i , j n + 1 can be obtained, and finally the sound field is obtained.

2.2. Thermal Energy Model for Tissue Heating

When focused ultrasound propagates in tissue, part of the energy is absorbed and converted into thermal energy. At present, the most widely used heat transfer model is the biological heat transfer model proposed by Pennes in 1948, that is, Pennes’ equation [18]. Pennes’ equation is usually expressed as:
T t = κ ρ 0 C t 2 T w b C b ρ 0 C t ( T T 0 ) + Q ρ 0 C t + Q m ρ 0 C t
where T represents the tissue temperature, ρ 0 is the density of biological tissue, C t is the heat capacity of biological tissue, κ is the thermal conductivity of biological tissue, wb and Cb are the perfusion rate and heat capacity of blood flow, respectively, and T0 is the initial temperature of the tissue. This study was an in vitro tissue experiment and did not consider the effects of blood perfusion rate, so w b C b ρ 0 C t ( T T 0 ) in Equation (7) was not considered. Qm is the metabolic rate item, which is usually not considered in HIFU simulation [19,20,21], and Q is the heat source for ultrasonic heating. Q can be expressed as:
Q = 1 ρ 0 c 0 n t h = 1 2 α n t h p n t h 2
In the formula, α n t h is the absorption coefficient corresponding to the nth harmonic component. < > represents the time average.
In order to evaluate the performance of the HIFU treatment, the thermal dose is usually used to estimate the tissue necrosis. The concept of the equivalent thermal dose was proposed by Sapareto and Dewey [22]. In this method, the different temperatures and time are combined as the equivalent time required for heating at 43 °C (CEM43). The formula for calculating the CEM43 of each voxel is [23]:
C E M 43 = t = 0 f i n a l R ( 43 T Δ t ) Δ t
where t is the time period from zero to the end of the whole temperature measurement, Δ t is the duration of this temperature, and T Δ t is the average temperature over the duration. R is a constant: when T > = 43 °C, R = 0.5; when T < 43 °C, R = 0.25. In this paper, the threshold of CEM43 is 240 min, and those tissues whose equivalent thermal dose exceed the threshold are considered as in necrosis.

2.3. Simulation Model

A two-dimensional axisymmetric simulation model of the HIFU ablation was established by using COMSOl 6.0, as shown in Figure 1. In this simulation, the curvature radius of the transducer was 150 mm and the aperture diameter was 95 mm. The excitation signal was a sine wave with a center frequency of 1.12 MHz. Assuming that tissue is a homogeneous medium, the thickness of the tissue for the simulation was 50 mm and the diameter 50 mm.
The transducer size and ablation tissue used by Zhao et al. [12] in low-power cumulative HIFU were different from those in this study. When the acoustic power was 50 W (acoustic intensity at focus was 425 W/cm2)—150 W (acoustic intensity at focus was 1250 W/cm2) in this study—the acoustic intensity was roughly equal to that of 110 W (acoustic intensity at focus was 423 W/cm2), while it would be 300 W (acoustic intensity at focus was 1150 W/cm2) in clinical treatment according to the numerical calculation.
The perfectly matched layer (PML) was used for the boundary of the simulation area to absorb the acoustic waves propagating to the boundary of the solution area and to prevent the reflected waves from interfering with the acoustic field focus when the acoustic waves propagate to the boundary.
The grid size used in the numerical calculation in this study was 0.1 mm × 0.1 mm (<λ/10, λ is wavelength), which could meet the accuracy requirements for solving the acoustic and thermal fields. The initial temperature of the tissue in the simulation was 30 °C, consistent with the experimental ambient temperature.
Table 1 shows the acoustic intensity at the focal point of the focusing transducer in water at different powers used in this experiment.
Simulations were performed in phantom and bovine liver to explore the relationship between their BFRs and the AFR. The acoustic and thermal parameters of the two tissues are shown in Table 2.

2.4. Experimental Setup

In order to verify the reliability of the simulation results, phantom and bovine liver experiments were designed, and the experimental system was as shown in Figure 2. The liver tissue was cut into 50 × 50 × 50 mm cubes. The cubes were placed in a pressure chamber with degassing water, and the pressure chamber was sealed. The tissue was degassed for 40 min with a pump with a vacuum degree of −0.09 MPa.
The arbitrary signal generator (DG5072, RIGOL, Beijing, China) was used to generate the excitation signal, the parameters of the transducer used in the experimental system were consistent with the simulation, the curvature radius of the transducer was 150 mm, and the aperture diameter was 95 mm. The excitation signal was a sine wave with a center frequency of 1.12 MHz, and HIFU was applied in 200-ms pulses with a 200-ms pulsing interval (i.e., 50% duty cycle), such that the signal passed through the power amplifier (AR800W, Amplifier Research, Souderton, PA, USA) and drove the transducer to irradiate the ultrasonic wave. In the phantom experiment, the camera (30 fps) could accurately monitor the BFR due to the transparency of the phantom. The phantom was placed at the focus of the focused transducer in water, and the signal generated by the signal source was excited by the power amplifier. The camera was used to record the variations in the BFRs of the phantom during HIFU ablation.
In the liver experiment, since the bovine liver tissue was not transparent, it was not possible to directly observe BFR. It was necessary to observe BFR by sectioning and take photos of the sectioning results with a camera. Rulers were used to measure the size of the BFR, so there was no need for the upper computer to measure the BFR size through image processing.

3. Results

3.1. Simulation Results of Acoustic Field

The acoustic field was simulated according to the dimensions of the transducer, and the acoustic pressure distribution and the shape of the AFR were obtained, as shown in Figure 3.
The AFR, the region bounded by the pressure contour lying 6 dB below the peak pressure, was an ellipsoid with dimensions of 31.1 mm along the beam axis and 2.95 mm in the transverse direction, and its axis length ratio was 10.55.

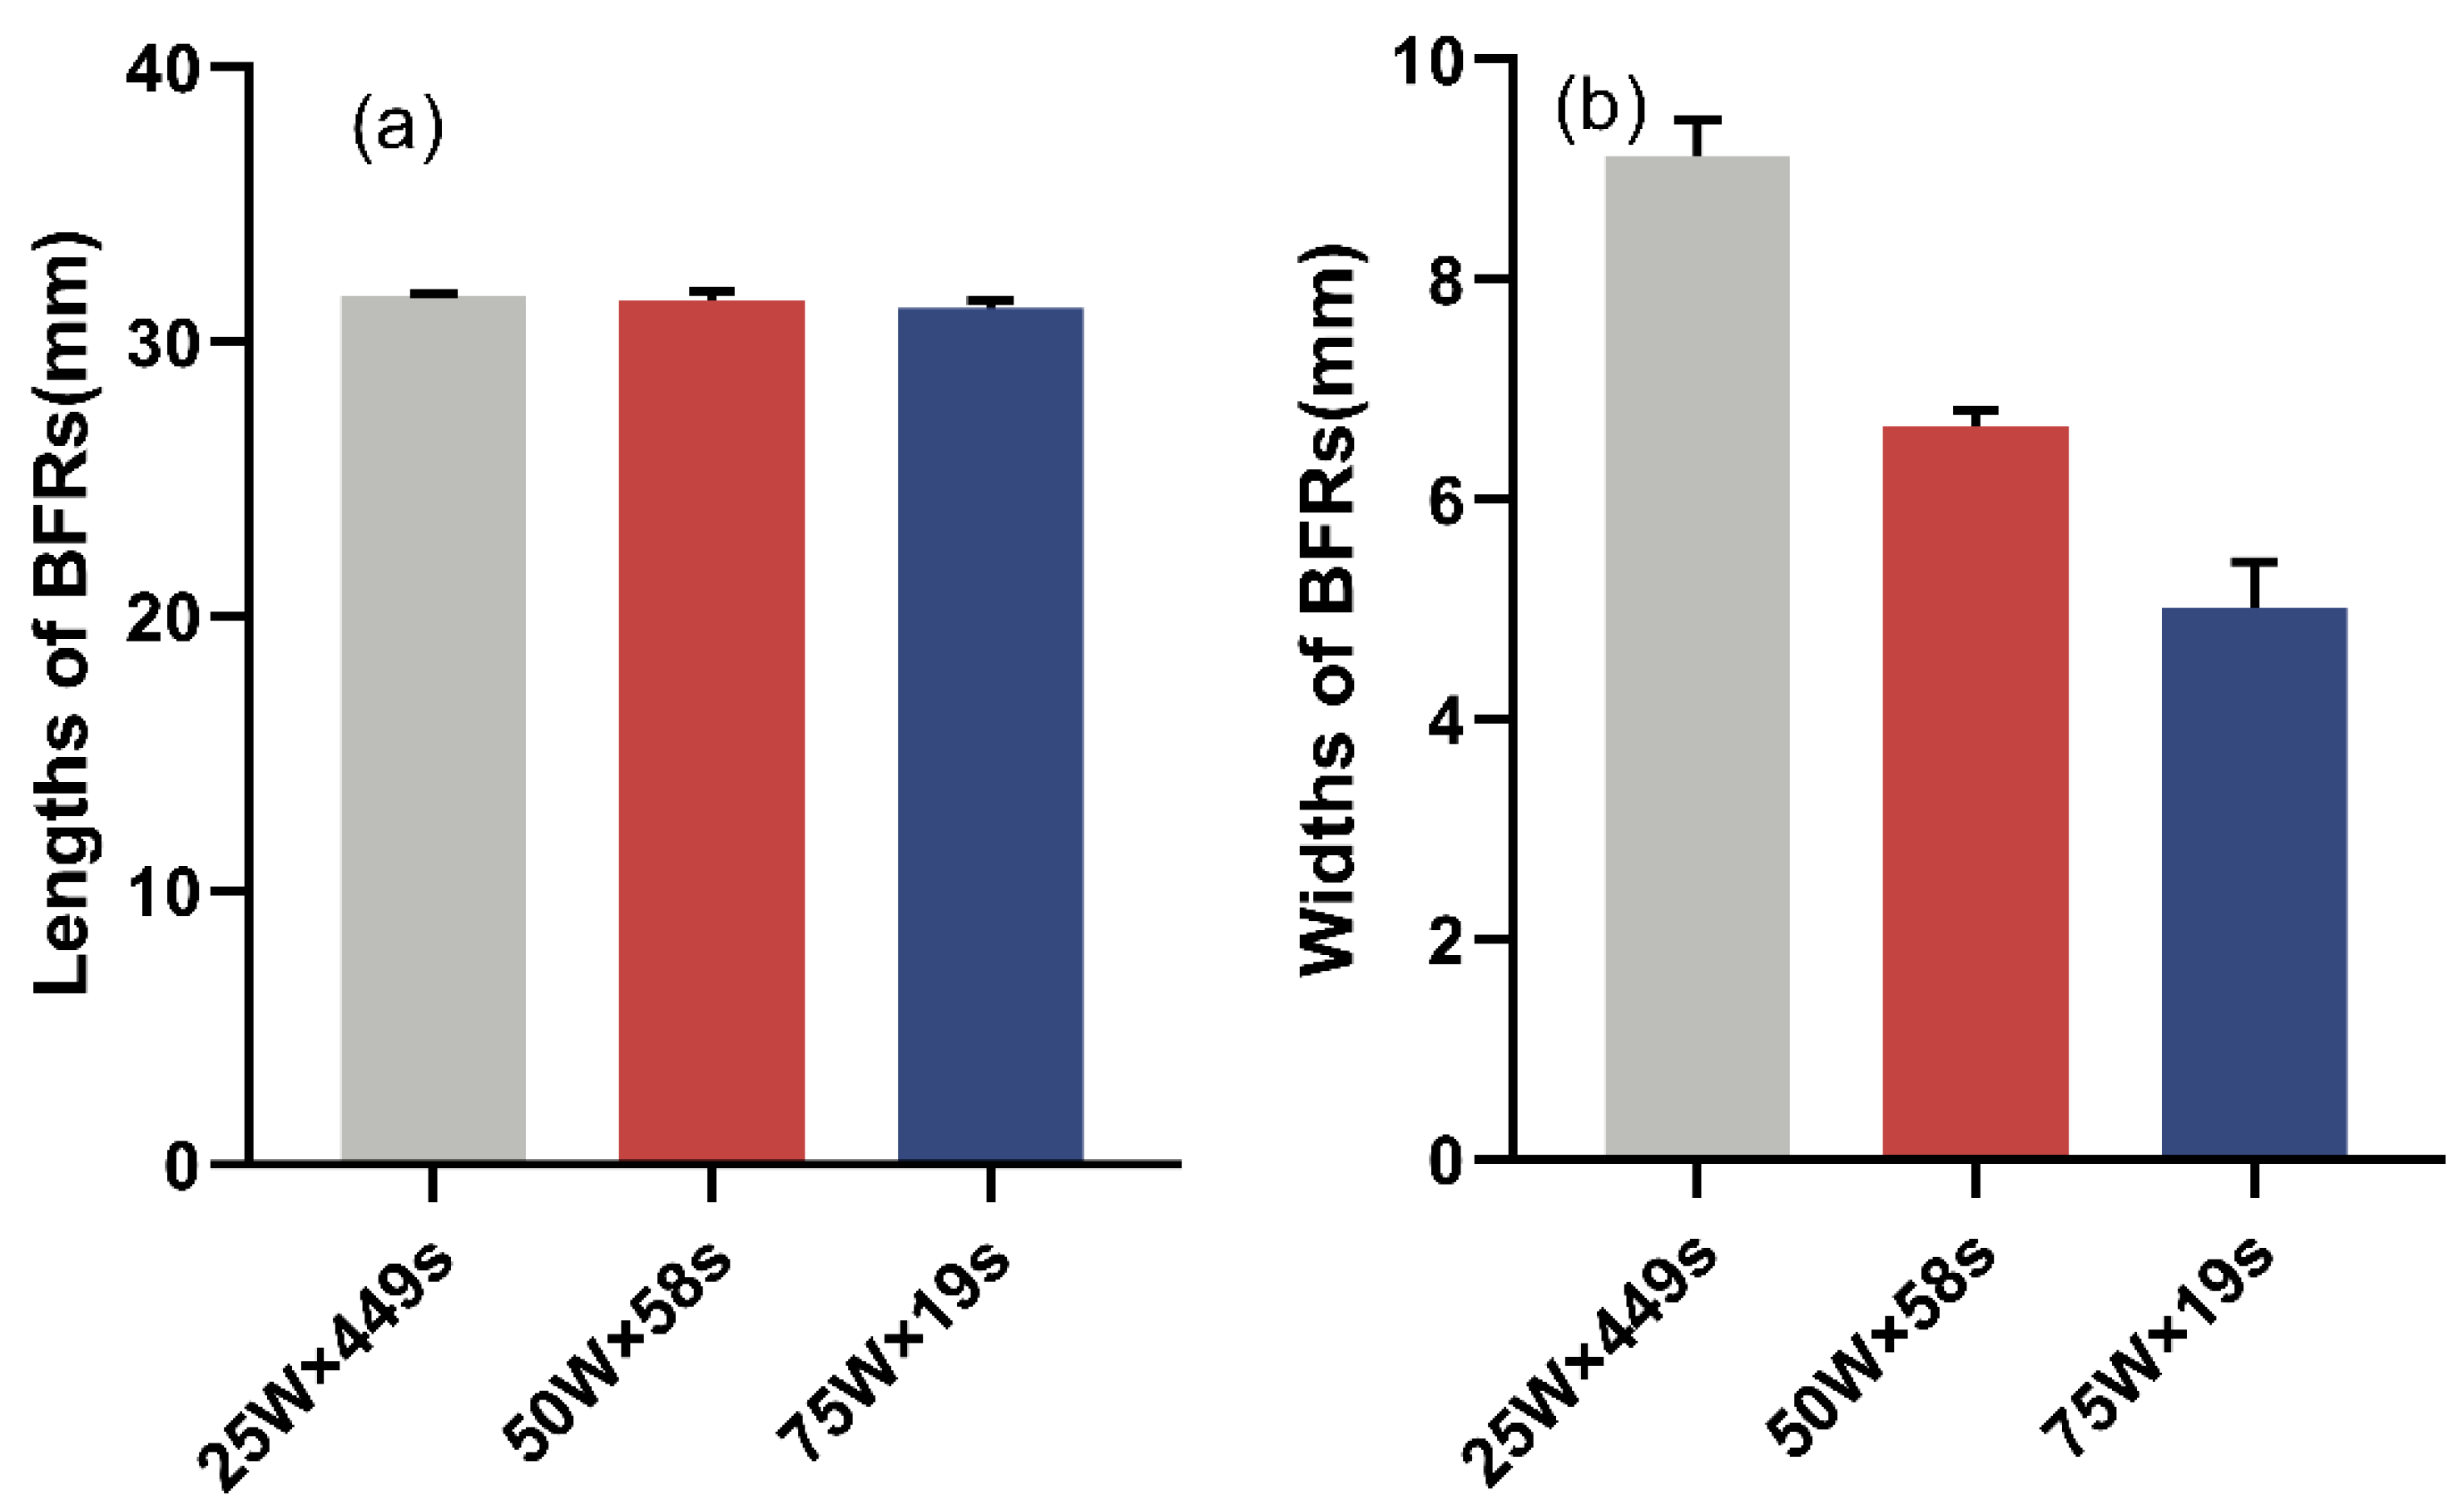
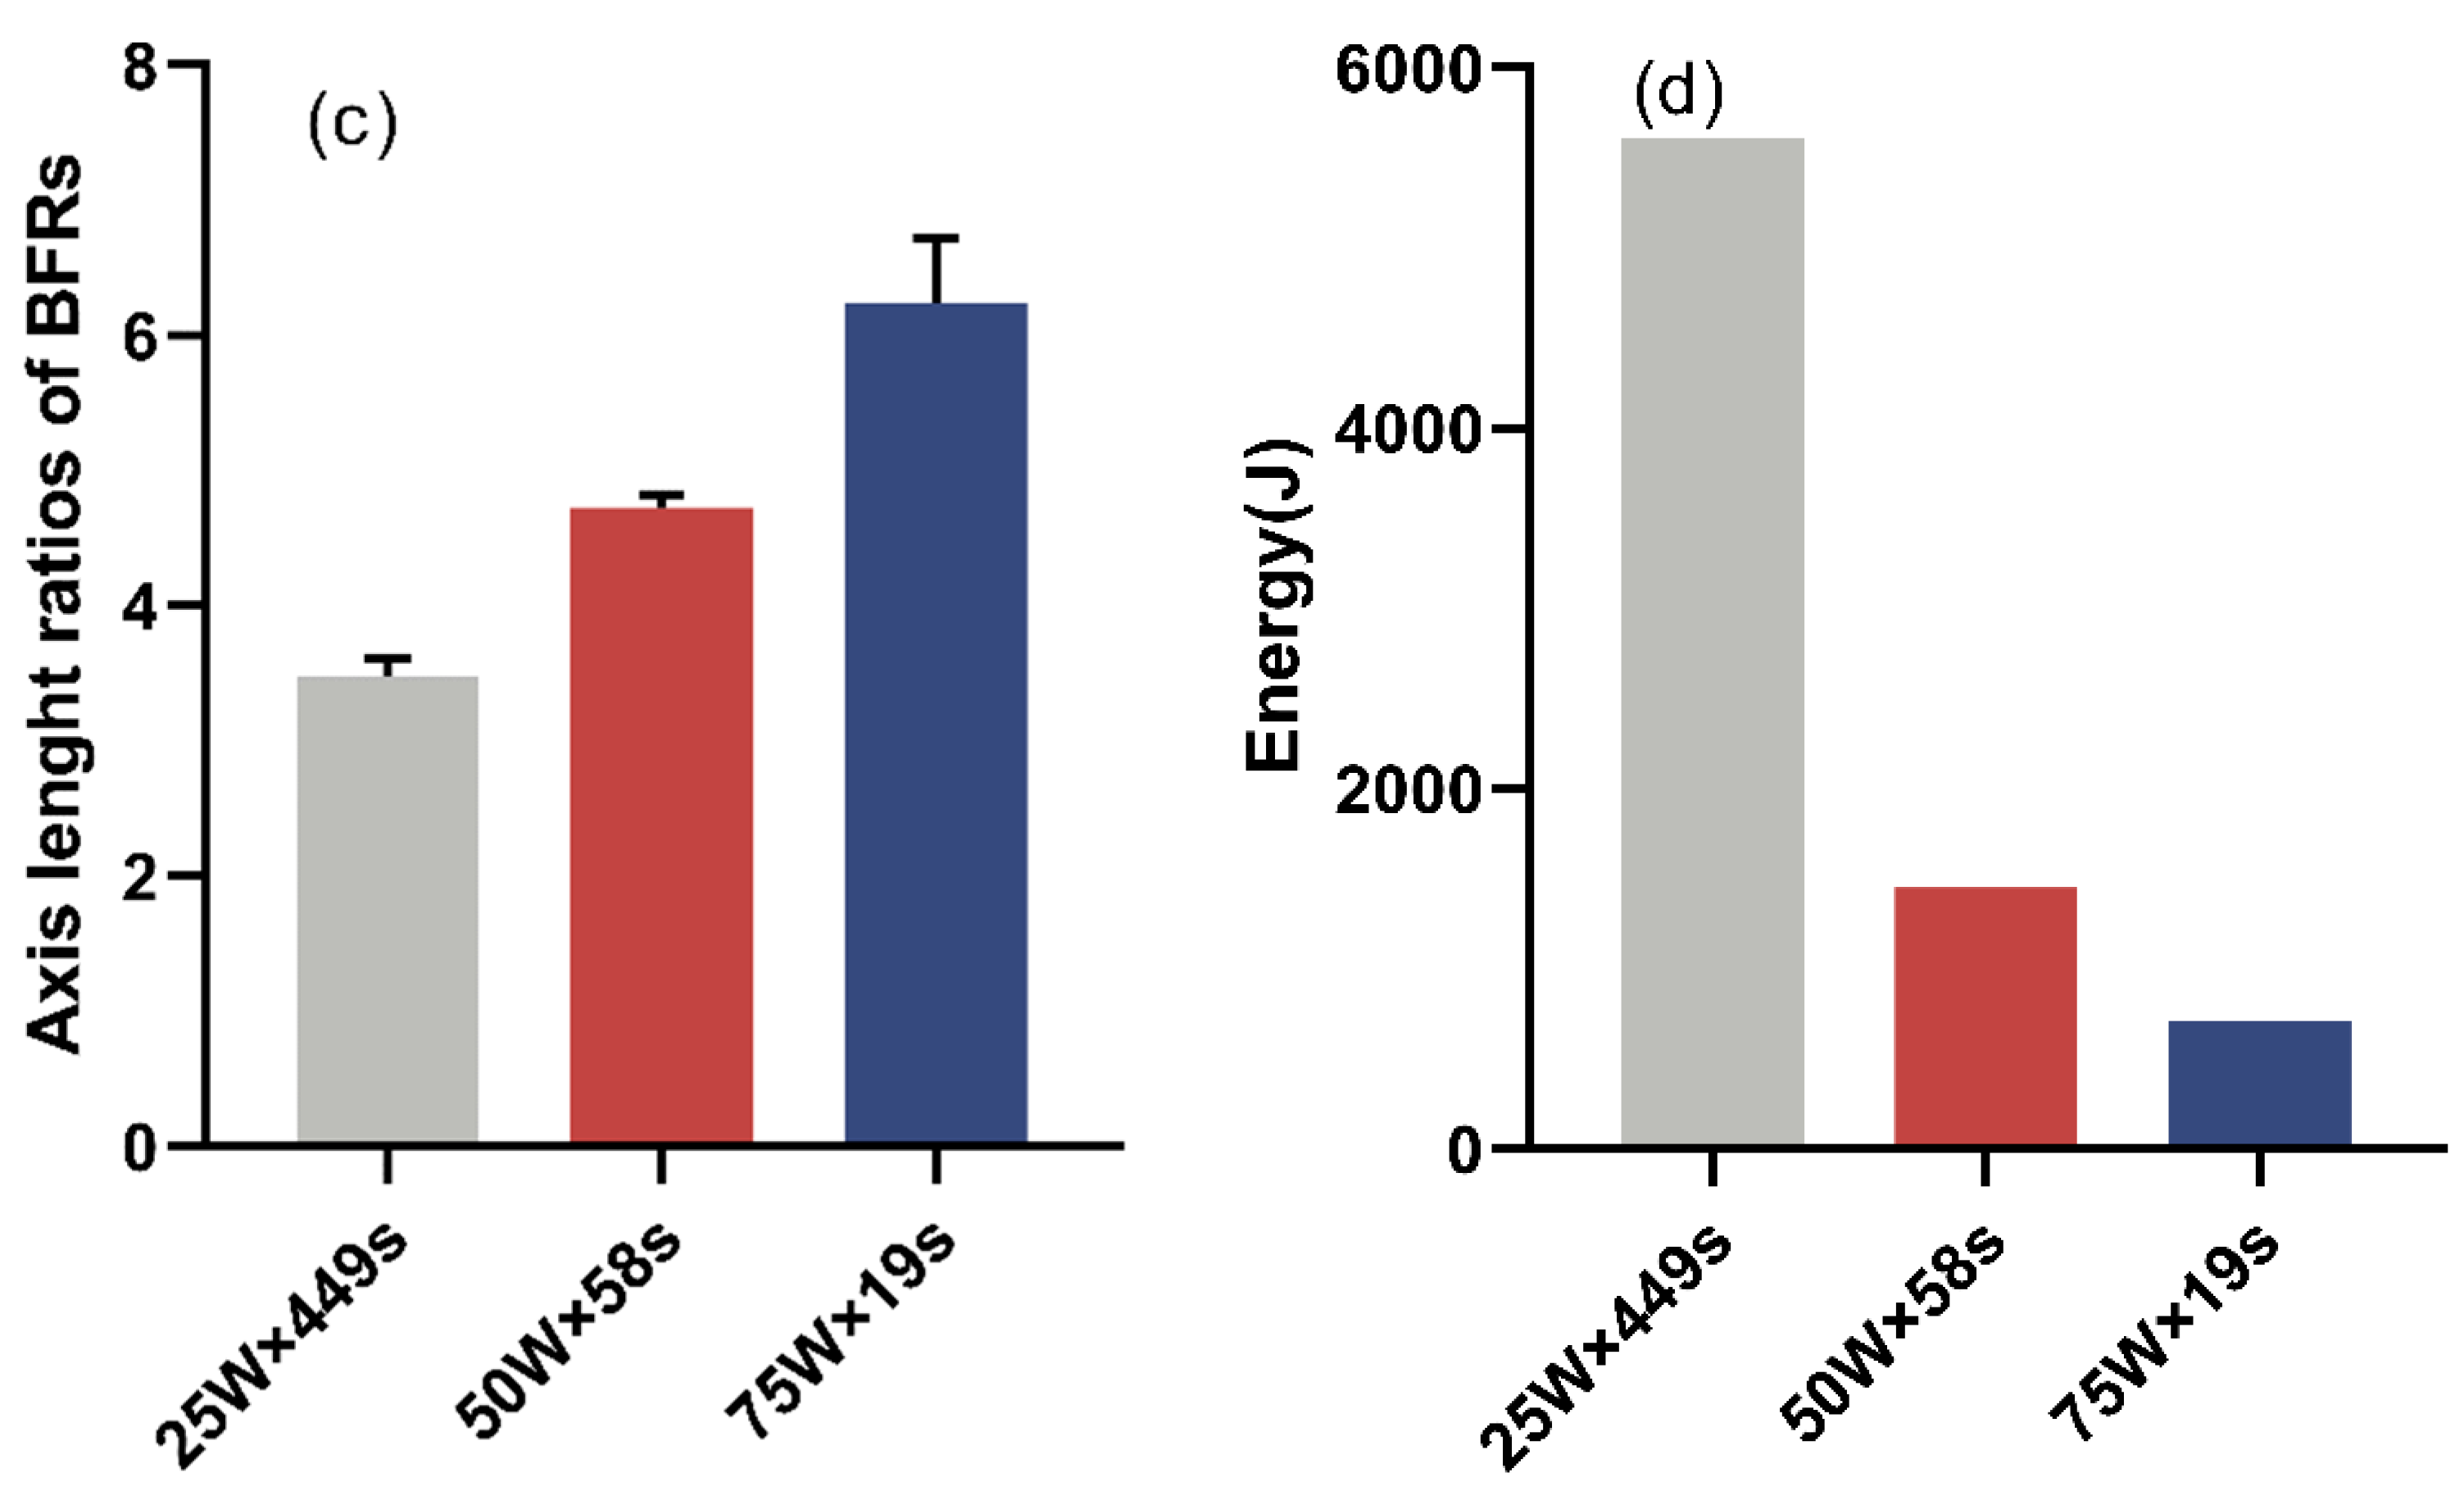
3.2. Simulation Results of BFRs

The BFR is the irreversible coagulation necrosis induced by HIFU exposure. In order to include this concept to numerical simulation, the method of equivalent thermal dose was introduced. Numerous studies had confirmed the application of this method in different tissues and its reliability in clinical tumor hyperthermia [26,27].
Simulated BFRs of phantoms after ultrasonication with different combinations of acoustic power and time are shown in Figure 4. In order to explore the relationship between the AFR and BFRs with different combinations of acoustic power and time in the phantom, the shapes of BFRs and exposure energy were calculated when the lengths of BFRs were approximately equal to that of the AFR, as shown in Figure 5.
For the phantom, the shape of the biological focal region produced by ‘high power × short time’ is closer to that of the physical focal region of the transducer compared with ‘low power × long time’. For example, in the phantom (Figure 5), when the lengths of BFRs were equal to that of the AFR, the difference between the width of the AFR and that of the BFR was 0.9 mm with an acoustic power of 150 W, and the difference was 2.05 mm with an acoustic power of 50 W. The axis length ratio of the BFR was 7.9 with an acoustic power of 150 W and was 6.3 with an acoustic power of 50 W. It can be seen from Figure 4 that when the lengths of the BFRs were approximately equal to that of the AFR, the exposure time decreased with the increase in acoustic power, and the energy of the BFR was less at a higher acoustic power than that at a lower acoustic power.
Simulated BFRs of bovine liver after ultrasonication with different combinations of acoustic power and time are shown in Figure 6. The shapes of biological focal regions and exposure energy in bovine liver are described in Figure 7. The shape of the BFR induced by ‘high power × short time’ exposure was closer to that of AFR than the shape of the BFR induced by ‘low power × long time’ exposure when the lengths of these BFRs were approximately equal. As the power increased from 50 W to 150 W, the exposure time required to produce BFRs of the same length decreased from 60.2 s to 12.8 s, and the exposure energy decreased from 3008 J to 1918 J.

3.3. BFRs Measurement in the Tissue

In the phantom experiment, the acoustic power was 25 W, 50 W, and 75 W, respectively, and we repeated three times for each power. As a result of the irreversible thermal damage to the phantom induced by ultrasound, each sample could only be used once; thus, nine samples were required. The BFRs of the phantom under different power × time are shown in Figure 8. The exposure time, energy, widths, and axis length ratios of the BFRs when the lengths of the BFRs were approximately equal were counted. These parameters of the BFRs of three samples in each group were statistically processed as shown in Figure 9.
In the bovine liver experiment, the acoustic power was 50 W, 100 W, and 125 W, respectively, and we repeated three times for each power. It was better to use the same power level for the phantom and bovine liver experiments. However, different power levels of ultrasound were required to induce BFR in the two tissues. BFR could be induced in phantoms with an acoustic power of 25 W, but it was difficult to induce BFR in bovine liver. In addition, the cavitation thresholds of the two tissues were not equal. When the power was 100 W, large bubbles could be seen in the phantom, then, the shapes of BFRs were irregular, and low-power cumulative HIFU was designed to avoid the cavitation effect, so the phantom experiment could only use a low power level compared with bovine liver.
The BFRs of bovine liver under different power × time are shown in Figure 10. We counted the exposure time, energy, widths, and axis length ratios of the BFRs when the lengths of the BFRs were approximately equal. These values of the BFRs of three samples in each group were statistically processed as shown in Figure 11.
In the bovine liver experiment, the shape of the BFR induced by 125 W was closer to the shape of the AFR than that induced by 50 W, and the exposure time and energy required for 125 W were also significantly less than those required for 50 W. The rules reflected by the results of the bovine liver experiment were consistent with the laws of the phantom experiment, when the lengths of BFRs and the length of the AFR were approximately equal, the shape of the BFR induced by ‘high power × short time’ exposure was closer to that of the AFR than the shape of the BFR induced by ‘low power × long time’ exposure, and the exposure energy required was significantly reduced.
In this study, the shapes of the BFRs of the phantom and bovine liver during the 1–10 s before the ultrasonication was statistically analyzed are shown in Figure 12 and Figure 13. In the simulation of the phantom (Figure 12), the lengths of BFRs induced by 50 W × 10 s and 100 W × 4 s were similar, their widths were 2.86 and 2.14 mm, respectively, and the axial length ratios were 7.63 and 10.07. The shape of the BFR induced by 100 w × 4 s was closer to that of the AFR. The widths of the BFRs induced by 50 W × 7 s, 75 W × 5 s, and 100 W × 4 s were similar, they were 2.14 mm, their lengths of BFRs were 17.62, 20.05, and 21.58 mm, and the axial length ratios were 8.23, 9.37, and 10.08, respectively. It could be seen that when the lengths or widths of the BFRs were similar, the shape of the BFR induced by “high power × short time” was closer to that of the AFR of the transducer compared with “low power × long time”. In the simulation of bovine liver (Figure 13), the lengths of the BFRs induced by 100 W × 10 s and 125 W × 7 s were similar, their widths were 3.2 and 2.86 mm, respectively, and the axial length ratios were 7.41 and 8.17. The shape of the BFR induced by 125 W × 7 s was closer to that of the AFR. The widths of the BFRs induced by 75 W × 10 s, 100 W × 7 s were similar, they were 2.5 mm, their lengths were 18.94 and 20.4 mm, and the axial length ratios were 7.41 and 8.17. It could be seen that when the lengths or widths of the BFRs were similar, the shape of the BFR induced by “high power × short time” was closer to that of the AFR of the transducer compared with “low power × long time”.

4. Discussion

In the low-power cumulative HIFU treatment, the shapes of BFRs in phantom and bovine liver were investigated both experimentally and theoretically. Since the shape of the AFR was independent of acoustic power and time, and the shapes of BFRs changed with power and time, different combinations of power and time were used to explore the relationship between the shapes of BFRs and the shape of AFR in the low-power cumulative HIFU treatment. In the process of focused ultrasound heating biological tissue, the BFRs are affected by many factors, such as the power, time, and the characteristics of biological media. Therefore, in order to quantify the relationship between the shape of the BFR and the AFR with different power, the method of controlling the lengths of BFRs is adopted in this study, that is, when the length of the BFR is equal to the length of the AFR, the width, axial length ratio, exposure time, and energy of the BFR are counted.
The experiments and simulation results show that compared with the action mode of “low power × long time”, the shape of the BFR generated by “high power × short time” is closer to the shape of the AFR, the energy used is greatly reduced, and the boundary of the BFR induced by HIFU is clearer under relatively high power. The reason for this phenomenon is that if it is expected to produce BFRs of the same length, the lower power usually lasts longer than the higher power. The experimental results show that the power increases linearly; however, the action time does not decrease linearly but decreases approximately exponentially. The sound pressure gradient of focused ultrasound in the focal plane direction (short axis direction) is large; thus, the temperature gradient is also large, and the influence of thermal diffusion effect cannot be ignored. The longer the exposure time, the deeper the degree of thermal diffusion. Therefore, the thermal diffusion effect of “low power × long time“ is more obvious than that of “high power × short time”. When the length of the biological focus region is the same, the width of the BFR induced by low power is wider. At the same time, the boundary around the BFR is blurred due to the deep degree of thermal diffusion. The shape of the BFR generated by ”high power × short time“ is closer to the shape of the AFR and the boundary of the BFR is also clearer.

5. Conclusions

In the process of focused ultrasound exposure of biological tissue, the biological focal region is affected by many factors, such as the power, time, and the characteristics of the tissue. Therefore, in order to quantify the relationship between the shape of the BFR and that of the AFR, the method of controlling the length of the BFR was adopted in this study—that is, when the length of the BFR was equal to that of the AFR, the width, axial length ratio, exposure time, and energy of the BFR were counted. The results showed that the shape of the BFR induced by “high power × short time“ was closer to that of the AFR of the transducer compared with “low power × long time“ in the treatment during low-power cumulative HIFU, the energy used was greatly reduced, and the boundary of the biological focal region generated by the tissue was clearer under relatively high power.
Although low-power cumulative HIFU has shown some advantages in treating tumors such as pancreatic cancer and myxofibrosarcoma, further simulation and experimental research are needed, and more accurate simulation research is needed before clinical treatment. The results of this study can provide a reference for the determination of the emission power, the exposure time, and the moving distance of the transducer in space in the treatment of low-power cumulative HIFU, which is helpful for uniform treatment in many single focus zones. The regenerative capacity of the surrounding tissues of the tumor [28], heating changes in the interstitial space [29], blood flow perfusion [30], and temperature-related delay [31] will greatly affect the therapeutic effect of HIFU, these effects will be the focus of future studies.

Author Contributions

Conceptualization, P.Z. and Y.W.; methodology, J.T.; software, P.Z.; validation, S.T. and Y.S.; writing—original draft preparation, P.Z. and S.T.; supervision, Y.W. All authors have read and agreed to the published version of the manuscript.

Funding

This research was funded by [Zhejiang Provincial Science and Technology Plan Project] grant number [2022C01002].

Data Availability Statement

Data has been shown in the article.

Conflicts of Interest

The authors declare no conflict of interest.

References

  1. Khokhlova, V.A.; Fowlkes, J.B.; Roberts, W.W.; Schade, G.R.; Xu, Z.; Khokhlova, T.D.; Hall, T.L.; Maxwell, A.D.; Wang, Y.-N.; Cain, C.A. Histotripsy methods in mechanical disintegration of tissue: Towards clinical applications. Int. J. Hyperth. 2015, 31, 145–162. [Google Scholar] [CrossRef] [PubMed]
  2. Kennedy, J.E. High-intensity focused ultrasound in the treatment of solid tumours. Nat. Rev. Cancer 2005, 5, 321–327. [Google Scholar] [CrossRef]
  3. Haar, G.T. Therapeutic applications of ultrasound. Prog. Biophys. Mol. Biol. 2007, 93, 111–129. [Google Scholar] [CrossRef]
  4. Wang, Z.; Wu, F.; Wang, Z.; Zhang, Z.; Zou, J.; Liu, C.; Liu, Y.; Cheng, X.; Du, Y.; He, Z.; et al. Targeted damage effects of high intensity focused ultrasound (HIFU) on liver tissues of Guizhou Province miniswine. Ultrason. Sonochemistry 1997, 4, 181–182. [Google Scholar] [CrossRef]
  5. Wang, Z.; Bai, J.; Li, F.; Du, Y.; Wen, S.; Hu, K.; Xu, G.; Ma, P.; Yin, N.; Chen, W.; et al. Study of a “biological focal region” of high-intensity focused ultrasound. Ultrasound Med. Biol. 2003, 29, 749–754. [Google Scholar] [CrossRef]
  6. Damianou, C.; Hynynen, K. The effect of various physical parameters on the size and shape of necrosed tissue volume during ultrasound surgery. J. Acoust. Soc. Am. 1994, 95, 1641–1649. [Google Scholar] [CrossRef] [PubMed]
  7. Samanipour, R.; Maerefat, M.; Nejad, H. Numerical study of the effect of ultrasound frequency on temperature distribution in layered tissue. J. Therm. Biol. 2013, 38, 287–293. [Google Scholar] [CrossRef]
  8. Li, F.; Feng, R.; Zhang, Q.; Bai, J.; Wang, Z. Estimation of HIFU induced lesions in vitro: Numerical simulation and experiment. Ultrasonics 2006, 44, e337–e340. [Google Scholar] [CrossRef]
  9. He, X.; Xiong, X.; Zou, J.; Li, F.; Ma, P.; Wang, Z. Study on Therapeutic Dosimetry and Biologic Effect of High Intensity Focused Ultrasound. J. Biomed. Eng. 2009, 26, 72–74. [Google Scholar]
  10. Zhou, Y.; Cunitz, B.W.; Dunmire, B.; Wang, Y.N.; Karl, S.G.; Warren, C.; Mitchell, S.; Hwang, J.H. Characterization and Ex Vivo evaluation of an extracorporeal high-intensity focused ultrasound (HIFU) system. J. Appl. Clin. Med. Phys. 2021, 22, 345–359. [Google Scholar] [CrossRef]
  11. Zhao, P.; Wang, Y.; Wu, Y.; Hu, X.; Shen, H.; Tong, S.; Tao, J. Formation process of thermal damage in a target area of high intensity focused ultrasound and effectiveness analysis of B-ultrasound real-time monitoring. Acta Acust. 2022, 6, 41. [Google Scholar] [CrossRef]
  12. Zhao, J.; Zhao, F.; Shi, Y.; Deng, Y.; Hu, X.; Shen, H. The efficacy of a new high intensity focused ultrasound therapy for locally advanced pancreatic cancer. J. Cancer Res. Clin. Oncol. 2017, 143, 2105–2111. [Google Scholar] [CrossRef] [PubMed]
  13. Zhao, J.; Shen, H.; Hu, X.; Wang, Y.; Yuan, Y. The efficacy of a new high-intensity focused ultrasound therapy for metastatic pancreatic cancer. Int. J. Hyperth. 2021, 38, 288–295. [Google Scholar] [CrossRef] [PubMed]
  14. Hariharan, P.; Myers, M.R.; Banerjee, R.K. HIFU procedures at moderate intensities—Effect of large blood vessels. Phys. Med. Biol. 2007, 52, 3493. [Google Scholar] [CrossRef] [PubMed]
  15. Solovchuk, M.; Sheu, T.W.H.; Thiriet, M. Simulation of nonlinear Westervelt equation for the investigation of acoustic streaming and nonlinear propagation effects. J. Acoust. Soc. Am. 2013, 134, 3931–3942. [Google Scholar] [CrossRef] [PubMed] [Green Version]
  16. Hallaj, I.M.; Cleveland, R.O. FDTD simulation of finite-amplitude pressure and temperature fields for biomedical ultrasound. J. Acoust. Soc. Am. 1999, 105, L7–L12. [Google Scholar] [CrossRef] [PubMed]
  17. Mur, G. Absorbing boundary conditions for the finite-difference approximation of the time-domain electromagnetic-field equations. IEEE Trans. Electromagn. Compat. 1981, 4, 377–382. [Google Scholar] [CrossRef]
  18. Pennes, H.H. Analysis of tissue and arterial blood temperatures in the resting human forearm. J. Appl. Physiol. 1984, 1, 93–122. [Google Scholar] [CrossRef]
  19. Tan, Q.; Zou, X.; Ding, Y.; Zhao, X.; Qian, S. The influence of dynamic tissue properties on HIFU hyperthermia: A numerical simulation study. Appl. Sci. 2018, 8, 1933. [Google Scholar] [CrossRef] [Green Version]
  20. Wang, M.; Zhou, Y. Simulation of non-linear acoustic field and thermal pattern of phased-array high-intensity focused ultrasound (HIFU). Int. J. Hyperth. 2016, 32, 569–582. [Google Scholar] [CrossRef] [Green Version]
  21. Ezzat, M.A.; Alsowayan, N.S.; Al-Muhiameed, Z.I.A. Fractional modelling of Pennes’ bioheat transfer equation. Heat Mass Transf. 2014, 50, 907–914. [Google Scholar] [CrossRef]
  22. Sapareto, S.A.; Dewey, W.C. Thermal dose determination in cancer therapy. Int. J. Radiat. Oncol. Biol. Phys. 1984, 10, 787–800. [Google Scholar] [CrossRef] [PubMed]
  23. Mouratidis, P.X.E.; Rivens, I.; Haar, G.T. A study of thermal dose-induced autophagy, apoptosis and necroptosis in colon cancer cells. Int. J. Hyperth. 2015, 31, 476–488. [Google Scholar] [CrossRef] [PubMed]
  24. Howard, S.; Yuen, J.; Wegner, P.; Zanelli, C. Characterization and FEA simulation for a HIFU phantom material. IEEE Symp. Ultrason. 2003, 2, 1270–1273. [Google Scholar]
  25. Guntur, S.R.; Lee, K.I.; Paeng, D.G.; Coleman, A.J.; Choi, M.J. Temperature-dependent thermal properties of ex vivo liver undergoing thermal ablation. Ultrasound Med. Biol. 2013, 39, 1771–1784. [Google Scholar] [CrossRef]
  26. van Rhoon, G.C. Is CEM43 still a relevant thermal dose parameter for hyperthermia treatment monitoring? Int. J. Hyperth. 2016, 32, 50–62. [Google Scholar] [CrossRef]
  27. Yarmolenko, P.S.; Moon, E.J.; Landon, C.; Manzoor, A.; Hochman, D.W.; Viglianti, B.L.; Dewhirst, M.W. Thresholds for thermal damage to normal tissues: An update. Int. J. Hyperth. 2011, 27, 320–343. [Google Scholar] [CrossRef]
  28. Singh, M. Incorporating vascular-stasis based blood perfusion to evaluate the thermal signatures of cell-death using modified Arrhenius equation with regeneration of living tissues during nanoparticle-assisted thermal therapy. Int. Commun. Heat Mass Transf. 2022, 135, 106046. [Google Scholar] [CrossRef]
  29. Singh, M.; Ma, R.; Zhu, L. Quantitative evaluation of effects of coupled temperature elevation, thermal damage, and enlarged porosity on nanoparticle migration in tumors during magnetic nanoparticle hyperthermia. Int. Commun. Heat Mass Transf. 2021, 126, 105393. [Google Scholar] [CrossRef]
  30. Singh, M.; Singh, T.; Soni, S. Pre-operative assessment of ablation margins for variable blood perfusion metrics in a magnetic resonance imaging based complex breast tumour anatomy: Simulation paradigms in thermal therapies. Comput. Methods Programs Biomed. 2021, 198, 105781. [Google Scholar] [CrossRef]
  31. Singh, M.; Gu, Q.; Ma, R.; Zhu, L. Heating protocol design affected by nanoparticle redistribution and thermal damage model in magnetic nanoparticle hyperthermia for cancer treatment. J. Heat Transf. 2020, 142, 072501. [Google Scholar] [CrossRef]
Figure 1. Schematic diagram of the model used in the simulation.
Applsci 13 04492 g001
Figure 2. Schematic diagram of the experimental system.
Applsci 13 04492 g002
Figure 3. The simulation distribution of (a) peak positive pressure and (b) acoustic focal region in the r-z plane generated by the transducer.
Applsci 13 04492 g003
Figure 4. Simulated BFRs of phantom after ultrasonication with different combinations of acoustic power and time: (a) 50 W × 25.3 s, (b) 100 W ×10.6 s, (c) 150 W × 6.3 s.
Applsci 13 04492 g004
Figure 5. (a) Lengths, (b) widths, (c) axis length ratios of the BFRs, and (d) energy after ultrasonication with different combinations of acoustic power and time in a phantom simulation.
Applsci 13 04492 g005
Figure 6. Simulated BFRs of bovine liver after ultrasonication with different combinations of acoustic power and time: (a) 50 W × 60.2 s, (b) 100 W ×21.1 s, (c) 150 W × 12.8 s.
Applsci 13 04492 g006
Figure 7. (a) Lengths (b) widths (c) axis length ratios of the BFRs, and (d) energy after ultrasonication with different combinations of acoustic power and time in bovine liver simulation.
Applsci 13 04492 g007
Figure 8. BFRs of phantom after ultrasonication with different combinations of acoustic power and time: (a) 25 W × 449 s, (b) 50 W × 58 s, (c) 75 W × 19 s. It could be seen from Figure 9 that in the phantom experiment, HIFU needed 448 s to induce a BFR with a length of 31.58 mm with an acoustic power of 25 W, and this BFR’s width was 9.17 mm, and the axis length ratio was 3.45, which was far from the axis length ratio of the AFR. The axis length ratio was 5.97 with an acoustic power of 75 W, and the shape of the BFR was closer to that of the AFR, and the exposure energy required was reduced by 87.38%.
Applsci 13 04492 g008
Figure 9. (a) Lengths (b) widths (c) axis length ratios of the BFRs, and (d) energy after ultrasonication with different combinations of acoustic power and time in phantom experiment.
Applsci 13 04492 g009aApplsci 13 04492 g009b
Figure 10. BFRs of bovine liver after ultrasonication with different combinations of acoustic power and time: (a) 50 W × 170 s, (b) 100 W × 27 s, (c) 125 W × 10 s.
Applsci 13 04492 g010
Figure 11. (a) Lengths (b) widths (c) axis length ratios of the BFRs, and (d) energy after ultrasonication with different combinations of acoustic power and time in bovine liver experiment.
Applsci 13 04492 g011
Figure 12. (a) Lengths and (b) widths of the BFRs during ultrasonication with different power in the phantom.
Applsci 13 04492 g012
Figure 13. (a) Lengths and (b) widths of the BFRs during ultrasonication with different power in bovine liver.
Applsci 13 04492 g013
Table 1. Acoustic power and corresponding intensity at the focus.
Power
[W]
Intensity
[W/cm2]
50425
75624
100831
1251040
1501270
Table 2. Acoustic and thermal parameters of the two tissues.
TissuesAcoustic Velocity
c [m·s−1]
Attenuation Coefficient
α [Np·m−1·MHz−1]
Density
ρ [kg·m−3]
Heat Capacity
C [J·kg−1·K−1]
Thermal Conductivity
κ [W·m−1·K−1]
Phantom1570 a7.7 a1060 a3600 a0.5 a
Bovine liver15963.510363560 b0.5 b
a [24] b [25].
Disclaimer/Publisher’s Note: The statements, opinions and data contained in all publications are solely those of the individual author(s) and contributor(s) and not of MDPI and/or the editor(s). MDPI and/or the editor(s) disclaim responsibility for any injury to people or property resulting from any ideas, methods, instructions or products referred to in the content.

