

Modeling of Brain Cortical Activity during Relaxation and Mental Workload Tasks Based on EEG Signal Collection

 ,
,
Abstract
:1. Introduction
2. Materials and Methods
2.1. Cohort Recruitment
- A: 30 subjects who were exposed to relaxation.
- B: 30 subjects who were asked to perform a mental task.
2.2. Inclusion and Exclusion Criteria
2.2.1. Inclusion Criteria
2.2.2. Exclusion Criteria
2.3. Information for Participants
2.4. EEG Recordings
2.5. Deep State of Relaxation
2.6. Mental Task
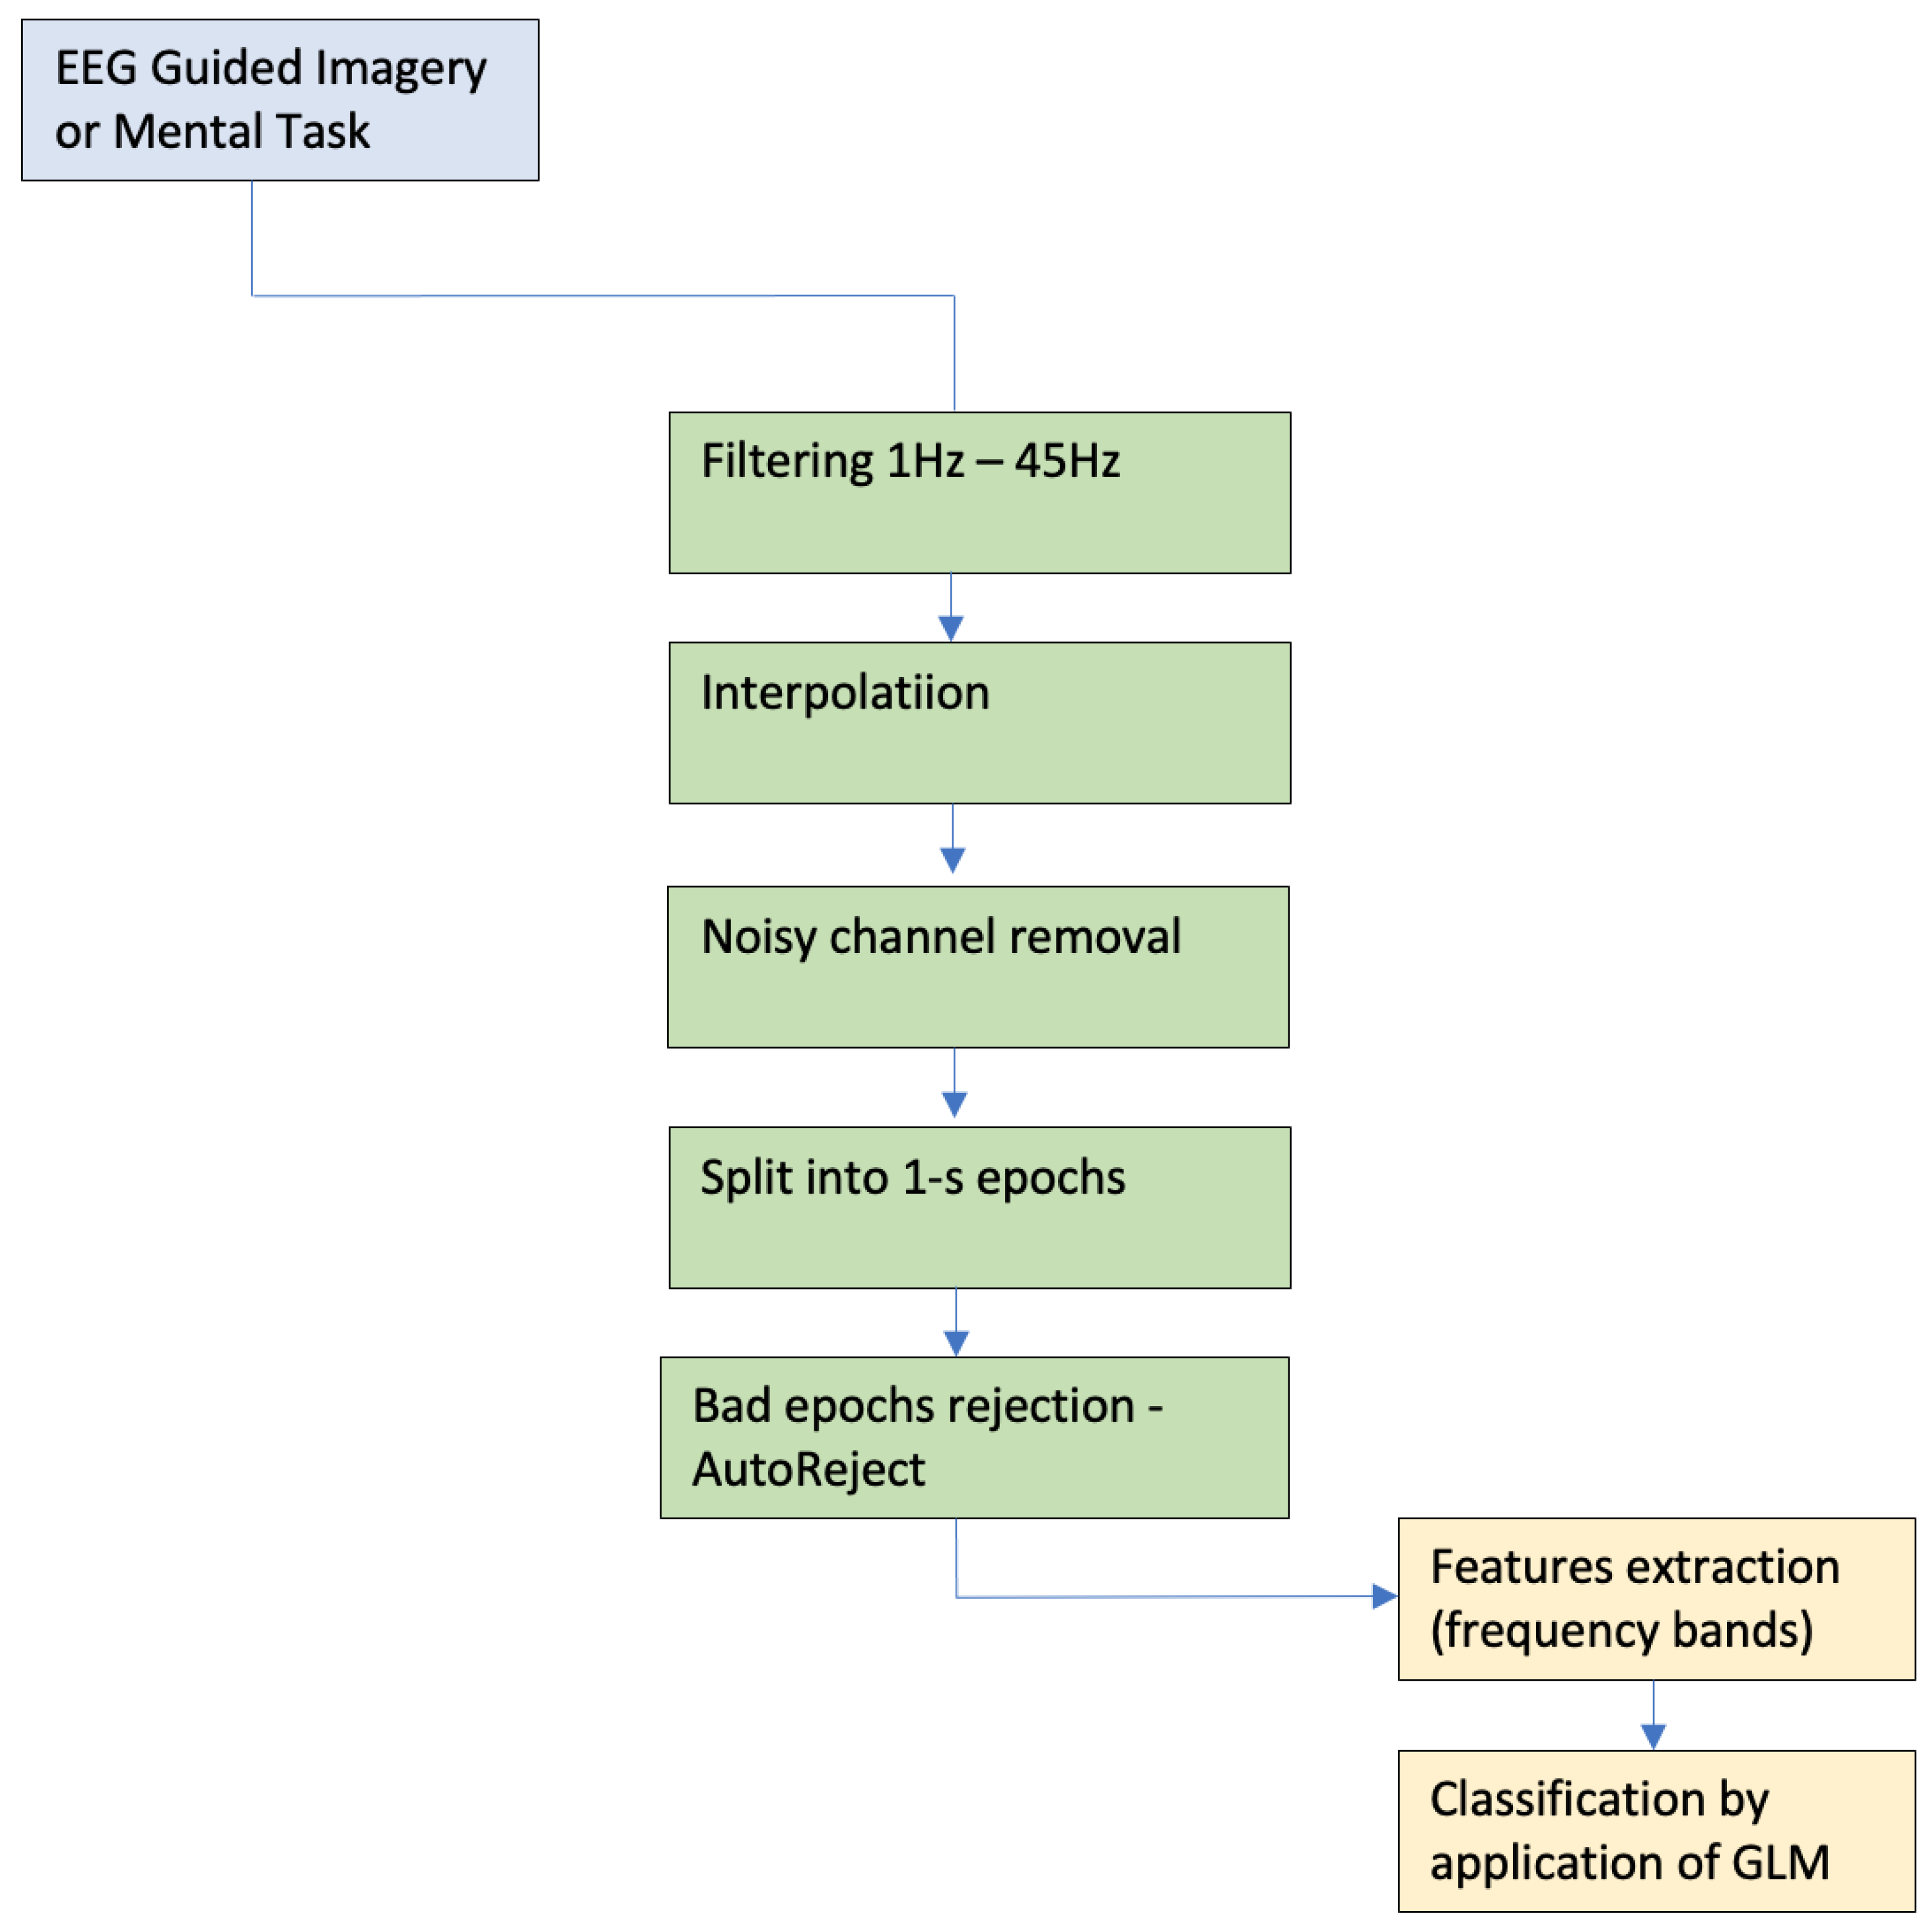
2.7. Preprocessing Pipeline
3. Results
Machine Learning Data Analysis
4. Discussion
4.1. Signal Classification
4.2. Future Research
Author Contributions
Funding
Informed Consent Statement
Data Availability Statement
Acknowledgments
Conflicts of Interest
References
- Carrington, P.; Collings, G.H., Jr.; Benson, H.; Robinson, H.; Wood, L.W.; Lehrer, P.M.; Woolfolk, R.L.; Cole, J.W. The use of meditation–relaxation techniques for the management of stress in a working population. J. Occup. Med. Off. Publ. Ind. Med. Assoc. 1980, 22, 221–231. [Google Scholar]
- Scotland-Coogan, D.; Davis, E. Relaxation techniques for trauma. J.-Evid.-Inf. Soc. Work 2016, 13, 434–441. [Google Scholar] [CrossRef] [PubMed]
- Sung, B.; Roussanov, O.; Nagubandi, M.; Golden, L. A002: Effectiveness of various relaxation techniques in lowering blood pressure associated with mental stress. Am. J. Hypertens. 2000, 13, 185A. [Google Scholar] [CrossRef] [Green Version]
- Mamun, M.A. Suicide and suicidal behaviors in the context of COVID-19 pandemic in Bangladesh: A systematic review. Psychol. Res. Behav. Manag. 2021, 14, 695. [Google Scholar] [CrossRef]
- Al Mamun, F.; Hosen, I.; Misti, J.M.; Kaggwa, M.M.; Mamun, M.A. Mental disorders of Bangladeshi students during the COVID-19 pandemic: A systematic review. Psychol. Res. Behav. Manag. 2021, 14, 645. [Google Scholar] [CrossRef]
- Mertens, G.; Gerritsen, L.; Duijndam, S.; Salemink, E.; Engelhard, I.M. Fear of the coronavirus (COVID-19): Predictors in an online study conducted in March 2020. J. Anxiety Disord. 2020, 74, 102258. [Google Scholar] [CrossRef] [PubMed]
- Benson, H.; Beary, J.F.; Carol, M.P. The relaxation response. Psychiatry 1974, 37, 37–46. [Google Scholar] [CrossRef]
- Bernstein, D.A.; Borkovec, T.D. Progressive Relaxation Training: A Manual for the Helping Professions; Research Press: Champaign, IL, USA, 1973. [Google Scholar]
- Basmajian, J.V. Clinical use of biofeedback in rehabilitation. Psychosomatics 1982, 23, 67–73. [Google Scholar] [CrossRef] [PubMed]
- Chaves, J.F.; Barber, T.X. Cognitive strategies, experimenter modeling, and expectation in the attenuation of pain. J. Abnorm. Psychol. 1974, 83, 356. [Google Scholar] [CrossRef] [Green Version]
- Edmonston, W.E., Jr. Neutral hypnosis as relaxation. Am. J. Clin. Hypn. 1977, 20, 69–75. [Google Scholar] [CrossRef]
- Morse, D.R.; Martin, J.S.; Furst, M.L.; Dubin, L.L. A physiological and subjective evaluation of meditation, hypnosis, and relaxation. Psychosom. Med. 1977, 39, 304–324. [Google Scholar] [CrossRef]
- Shapiro, D.A.; Shapiro, D. Meta-analysis of comparative therapy outcome studies: A replication and refinement. Psychol. Bull. 1982, 92, 581. [Google Scholar] [CrossRef]
- Achterberg, J.; Healing, I.I. Shamanism and Modern Medicine; Shambala: Boston, MA, USA; London, UK, 1985. [Google Scholar]
- Shafer, K.C.; Greenfield, F. Asthma Free in 21 Days: The Breakthrough Mind-Body Healing Program; Harper: San Francisco, CA, USA, 2000. [Google Scholar]
- Heinschel, J.A. A descriptive study of the interactive guided imagery experience. J. Holist. Nurs. 2002, 20, 325–346. [Google Scholar] [CrossRef] [PubMed]
- Donaldson, M.S.; Corrigan, J.M.; Kohn, L.T. To Err Is Human: Building a Safer Health System; National Academies Press: Washington, DC, USA, 2000. [Google Scholar]
- Trakhtenberg, E.C. The effects of guided imagery on the immune system: A critical review. Int. J. Neurosci. 2008, 118, 839–855. [Google Scholar] [CrossRef] [PubMed]
- De Paolis, G.; Naccarato, A.; Cibelli, F.; D’Alete, A.; Mastroianni, C.; Surdo, L.; Casale, G.; Magnani, C. The effectiveness of progressive muscle relaxation and interactive guided imagery as a pain-reducing intervention in advanced cancer patients: A multicentre randomised controlled non-pharmacological trial. Complement. Ther. Clin. Pract. 2019, 34, 280–287. [Google Scholar] [CrossRef] [PubMed]
- Sabatinelli, D.; Lang, P.J.; Bradley, M.M.; Flaisch, T. The neural basis of narrative imagery: Emotion and action. Prog. Brain Res. 2006, 156, 93–103. [Google Scholar] [PubMed] [Green Version]
- Fox, A.S.; Kalin, N.H. A translational neuroscience approach to understanding the development of social anxiety disorder and its pathophysiology. Am. J. Psychiatry 2014, 171, 1162–1173. [Google Scholar] [CrossRef] [Green Version]
- Perich, T.; Manicavasagar, V.; Mitchell, P.B.; Ball, J.R. The association between meditation practice and treatment outcome in mindfulness-based cognitive therapy for bipolar disorder. Behav. Res. Ther. 2013, 51, 338–343. [Google Scholar] [CrossRef]
- Shapiro, S.L. The integration of mindfulness and psychology. J. Clin. Psychol. 2009, 65, 555–560. [Google Scholar] [CrossRef] [PubMed]
- Vøllestad, J.; Nielsen, M.B.; Nielsen, G.H. Mindfulness-and acceptance-based interventions for anxiety disorders: A systematic review and meta-analysis. Br. J. Clin. Psychol. 2012, 51, 239–260. [Google Scholar] [CrossRef]
- Williams, J.M.G.; Crane, C.; Barnhofer, T.; Brennan, K.; Duggan, D.S.; Fennell, M.J.; Hackmann, A.; Krusche, A.; Muse, K.; Von Rohr, I.R.; et al. Mindfulness-based cognitive therapy for preventing relapse in recurrent depression: A randomized dismantling trial. J. Consult. Clin. Psychol. 2014, 82, 275. [Google Scholar] [CrossRef] [PubMed]
- Hudetz, J.A.; Hudetz, A.G.; Klayman, J. Relationship between relaxation by guided imagery and performance of working memory. Psychol. Rep. 2000, 86, 15–20. [Google Scholar] [CrossRef]
- Pelletier, A.M. Three uses of guided imagery in hypnosis. Am. J. Clin. Hypn. 1979, 22, 32–36. [Google Scholar] [CrossRef] [PubMed]
- Simonton, O.C.; Matthews-Simonton, S.; Sparks, T.F. Psychological intervention in the treatment of cancer. Psychosomatics 1980, 21, 226–233. [Google Scholar] [CrossRef] [PubMed]
- Herman, J.P.; Figueiredo, H.; Mueller, N.K.; Ulrich-Lai, Y.; Ostrander, M.M.; Choi, D.C.; Cullinan, W.E. Central mechanisms of stress integration: Hierarchical circuitry controlling hypothalamo–pituitary–adrenocortical responsiveness. Front. Neuroendocrinol. 2003, 24, 151–180. [Google Scholar] [CrossRef]
- McEwen, B.S.; Gianaros, P.J. Stress-and allostasis-induced brain plasticity. Annu. Rev. Med. 2011, 62, 431–445. [Google Scholar] [CrossRef] [Green Version]
- Klimesch, W. EEG alpha and theta oscillations reflect cognitive and memory performance: A review and analysis. Brain Res. Rev. 1999, 29, 169–195. [Google Scholar] [CrossRef]
- Tran, Y.; Thuraisingham, R.; Wijesuriya, N.; Nguyen, H.; Craig, A. Detecting neural changes during stress and fatigue effectively: A comparison of spectral analysis and sample entropy. In Proceedings of the 2007 3rd International IEEE/EMBS Conference on Neural Engineering, Kohala Coast, HI, USA, 2–5 May 2007; pp. 350–353. [Google Scholar]
- Stern, E.R.; Gonzalez, R.; Welsh, R.C.; Taylor, S.F. Updating beliefs for a decision: Neural correlates of uncertainty and underconfidence. J. Neurosci. 2010, 30, 8032–8041. [Google Scholar] [CrossRef] [Green Version]
- Lewis, R.S.; Weekes, N.Y.; Wang, T.H. The effect of a naturalistic stressor on frontal EEG asymmetry, stress, and health. Biol. Psychol. 2007, 75, 239–247. [Google Scholar] [CrossRef]
- Alonso, J.; Romero, S.; Ballester, M.; Antonijoan, R.; Mañanas, M. Stress assessment based on EEG univariate features and functional connectivity measures. Physiol. Meas. 2015, 36, 1351. [Google Scholar] [CrossRef]
- Hebert, R.; Lehmann, D.; Tan, G.; Travis, F.; Arenander, A. Enhanced EEG alpha time-domain phase synchrony during Transcendental Meditation: Implications for cortical integration theory. Signal Process. 2005, 85, 2213–2232. [Google Scholar] [CrossRef]
- Travis, F. Autonomic and EEG patterns distinguish transcending from other experiences during Transcendental Meditation practice. Int. J. Psychophysiol. 2001, 42, 1–9. [Google Scholar] [CrossRef]
- Cahn, B.R.; Delorme, A.; Polich, J. Event-related delta, theta, alpha and gamma correlates to auditory oddball processing during Vipassana meditation. Soc. Cogn. Affect. Neurosci. 2013, 8, 100–111. [Google Scholar] [CrossRef] [Green Version]
- Braboszcz, C.; Cahn, B.R.; Levy, J.; Fernandez, M.; Delorme, A. Increased gamma brainwave amplitude compared to control in three different meditation traditions. PLoS ONE 2017, 12, e0170647. [Google Scholar] [CrossRef] [PubMed] [Green Version]
- Phneah, S.W.; Nisar, H. EEG-based alpha neurofeedback training for mood enhancement. Australas. Phys. Eng. Sci. Med. 2017, 40, 325–336. [Google Scholar] [CrossRef] [PubMed]
- Zoefel, B.; Huster, R.J.; Herrmann, C.S. Neurofeedback training of the upper alpha frequency band in EEG improves cognitive performance. Neuroimage 2011, 54, 1427–1431. [Google Scholar] [CrossRef]
- Hudetz, J.A.; Hudetz, A.G.; Reddy, D.M. Effect of relaxation on working memory and the Bispectral Index of the EEG. Psychol. Rep. 2004, 95, 53–70. [Google Scholar] [CrossRef]
- Fu, H.; Garrett, B.; Tao, G.; Cordingley, E.; Ofoghi, Z.; Taverner, T.; Sun, C.; Cheung, T. Virtual Reality–Guided Meditation for Chronic Pain in Patients With Cancer: Exploratory Analysis of Electroencephalograph Activity. JMIR Biomed. Eng. 2021, 6, e26332. [Google Scholar] [CrossRef]
- Kbah, S.N.S. A computational model of the brain cortex and its synchronization. BioMed Res. Int. 2020, 2020, 3874626. [Google Scholar] [CrossRef]
- Perez-Valero, E.; Vaquero-Blasco, M.A.; Lopez-Gordo, M.A.; Morillas, C. Quantitative assessment of stress through EEG during a virtual reality stress-relax session. Front. Comput. Neurosci. 2021, 15, 684423. [Google Scholar] [CrossRef] [PubMed]
- Wada, Y.; Takizawa, Y.; Zheng-Yan, J.; Yamaguchi, N. Gender differences in quantitative EEG at rest and during photic stimulation in normal young adults. Clin. Electroencephalogr. 1994, 25, 81–85. [Google Scholar] [CrossRef] [PubMed]
- Cantillo-Negrete, J.; Carino-Escobar, R.I.; Carrillo-Mora, P.; Flores-Rodríguez, T.B.; Elias-Vinas, D.; Gutierrez-Martinez, J. Gender differences in quantitative electroencephalogram during a simple hand movement task in young adults. Rev. Investig. Clin. 2017, 68, 245–255. [Google Scholar]
- Tusek, D.L.; Church, J.M.; Strong, S.A.; Grass, J.A.; Fazio, V.W. Guided imagery. Dis. Colon Rectum 1997, 40, 172–178. [Google Scholar] [CrossRef]
- Hart, J. Guided imagery. Altern. Complement. Ther. 2008, 14, 295–299. [Google Scholar] [CrossRef]
- Roffe, L.; Schmidt, K.; Ernst, E. A systematic review of guided imagery as an adjuvant cancer therapy. Psycho-Oncology 2005, 14, 607–617. [Google Scholar] [CrossRef] [PubMed] [Green Version]
- Dyląg, K.A.; Wieczorek, W.; Bauer, W.; Walecki, P.; Bando, B.; Martinek, R.; Kawala-Sterniuk, A. Pilot Study on Analysis of Electroencephalography Signals from Children with FASD with the Implementation of Naive Bayesian Classifiers. Sensors 2021, 22, 103. [Google Scholar] [CrossRef]
- Mikołajewska, E.; Mikołajewski, D. Non-invasive EEG-based brain-computer interfaces in patients with disorders of consciousness. Mil. Med. Res. 2014, 1, 14. [Google Scholar] [CrossRef] [PubMed] [Green Version]
- Salankar, N.; Qaisar, S.M.; Pławiak, P.; Tadeusiewicz, R.; Hammad, M. EEG based alcoholism detection by oscillatory modes decomposition second order difference plots and machine learning. Biocybern. Biomed. Eng. 2022, 42, 173–186. [Google Scholar] [CrossRef]
- John, E.R.; Prichep, L.; Fridman, J.; Easton, P. Neurometrics: Computer-assisted differential diagnosis of brain dysfunctions. Science 1988, 239, 162–169. [Google Scholar] [CrossRef]
- Wojcik, G.M.; Masiak, J.; Kawiak, A.; Kwasniewicz, L.; Schneider, P.; Postepski, F.; Gajos-Balinska, A. Analysis of decision-making process using methods of quantitative electroencephalography and machine learning tools. Front. Neuroinform. 2019, 13, 73. [Google Scholar] [CrossRef]
- Wojcik, G.M.; Masiak, J.; Kawiak, A.; Schneider, P.; Kwasniewicz, L.; Polak, N.; Gajos-Balinska, A. New protocol for quantitative analysis of brain cortex electroencephalographic activity in patients with psychiatric disorders. Front. Neuroinform. 2018, 12, 27. [Google Scholar] [CrossRef] [PubMed]
- Tadeusiewicz, R. Neural networks as a tool for modeling of biological systems. Bio-Algorithms-Med-Syst. 2015, 11, 135–144. [Google Scholar] [CrossRef]
- Ważny, M.; Wojcik, G.M. Shifting spatial attention—numerical model of Posner experiment. Neurocomputing 2014, 135, 139–144. [Google Scholar] [CrossRef]
- Wojcik, G.M.; Kaminski, W.A.; Matejanka, P. Self-organised criticality in a model of the rat somatosensory cortex. In Proceedings of the Parallel Computing Technologies: 9th International Conference, PaCT 2007, Pereslavl-Zalessky, Russia, 3–7 September 2007; Springer: Berlin/Heidelberg, Germany, 2007; pp. 468–476. [Google Scholar]
- Wojcik, G.M.; Garcia-Lazaro, J.A. Analysis of the neural hypercolumn in parallel pcsim simulations. Procedia Comput. Sci. 2010, 1, 845–854. [Google Scholar] [CrossRef] [Green Version]
- Kawala-Sterniuk, A.; Podpora, M.; Pelc, M.; Blaszczyszyn, M.; Gorzelanczyk, E.J.; Martinek, R.; Ozana, S. Comparison of smoothing filters in analysis of EEG data for the medical diagnostics purposes. Sensors 2020, 20, 807. [Google Scholar] [CrossRef] [PubMed] [Green Version]
- Wójcik, G.M.; Kawiak, A.; Kwasniewicz, L.; Schneider, P.; Masiak, J. Azure machine learning tools efficiency in the electroencephalographic signal P300 standard and target responses classification. Bio-Algorithms-Med-Syst. 2019, 15. [Google Scholar] [CrossRef]
- Wojcik, G.M.; Masiak, J.; Kawiak, A.; Kwasniewicz, L.; Schneider, P.; Polak, N.; Gajos-Balinska, A. Mapping the human brain in frequency band analysis of brain cortex electroencephalographic activity for selected psychiatric disorders. Front. Neuroinform. 2018, 12, 73. [Google Scholar] [CrossRef] [Green Version]
- Kawala-Sterniuk, A.; Browarska, N.; Al-Bakri, A.; Pelc, M.; Zygarlicki, J.; Sidikova, M.; Martinek, R.; Gorzelanczyk, E.J. Summary of over fifty years with brain-computer interfaces—A review. Brain Sci. 2021, 11, 43. [Google Scholar] [CrossRef]
- Wierzgała, P.; Zapała, D.; Wojcik, G.M.; Masiak, J. Most popular signal processing methods in motor-imagery BCI: A review and meta-analysis. Front. Neuroinform. 2018, 12, 78. [Google Scholar] [CrossRef] [Green Version]
- Mikołajewska, E.; Mikołajewski, D. Ethical considerations in the use of brain-computer interfaces. Cent. Eur. J. Med. 2013, 8, 720–724. [Google Scholar] [CrossRef]
- Mikołajewska, E.; Mikołajewski, D. The prospects of brain-computer interface applications in children. Open Med. 2014, 9, 74–79. [Google Scholar] [CrossRef]
- Zhang, J. Development of an Apache Spark-Based Framework for Processing and Analyzing Neuroscience Big Data: Application in Epilepsy Using EEG Signal Data. Ph.D. Thesis, Case Western Reserve University, Cleveland, OH, USA, 2020. [Google Scholar]


| Group | dT (s) | ACC Train | F1 Train | AUC Train | ACC Valid | F1 Valid | AUC Valid |
|---|---|---|---|---|---|---|---|
| A | 299–301 | 0.6559 | 0.7165 | 0.7255 | 0.6252 | 0.7027 | 0.6808 |
| A | 599–601 | 0.6578 | 0.7156 | 0.7291 | 0.6401 | 0.7051 | 0.7006 |
| A | 779–781 | 0.6853 | 0.7326 | 0.7672 | 0.6693 | 0.7279 | 0.7451 |
| A | 839–841 | 0.6842 | 0.7336 | 0.7663 | 0.6629 | 0.7221 | 0.7355 |
| A | 899–901 | 0.6660 | 0.7177 | 0.7441 | 0.6506 | 0.7167 | 0.7252 |
| Group | dT (s) | ACC Train | F1 Train | AUC Train | ACC Valid | F1 Valid | AUC Valid |
|---|---|---|---|---|---|---|---|
| B | 299–359 | 0.7785 | 0.8337 | 0.8620 | 0.7804 | 0.8360 | 0.8602 |
| B | 599–659 | 0.7884 | 0.8407 | 0.8678 | 0.7955 | 0.8478 | 0.8727 |
| B | 779–839 | 0.8097 | 0.8532 | 0.8926 | 0.8113 | 0.8578 | 0.8929 |
| B | 839–899 | 0.7830 | 0.8367 | 0.8628 | 0.7827 | 0.8409 | 0.8631 |
| B | 899–959 | 0.7812 | 0.8345 | 0.8634 | 0.7839 | 0.8410 | 0.8625 |
| Group | dT (s) | ACC Train | F1 Train | AUC Train | ACC Valid | F1 Valid | AUC Valid |
|---|---|---|---|---|---|---|---|
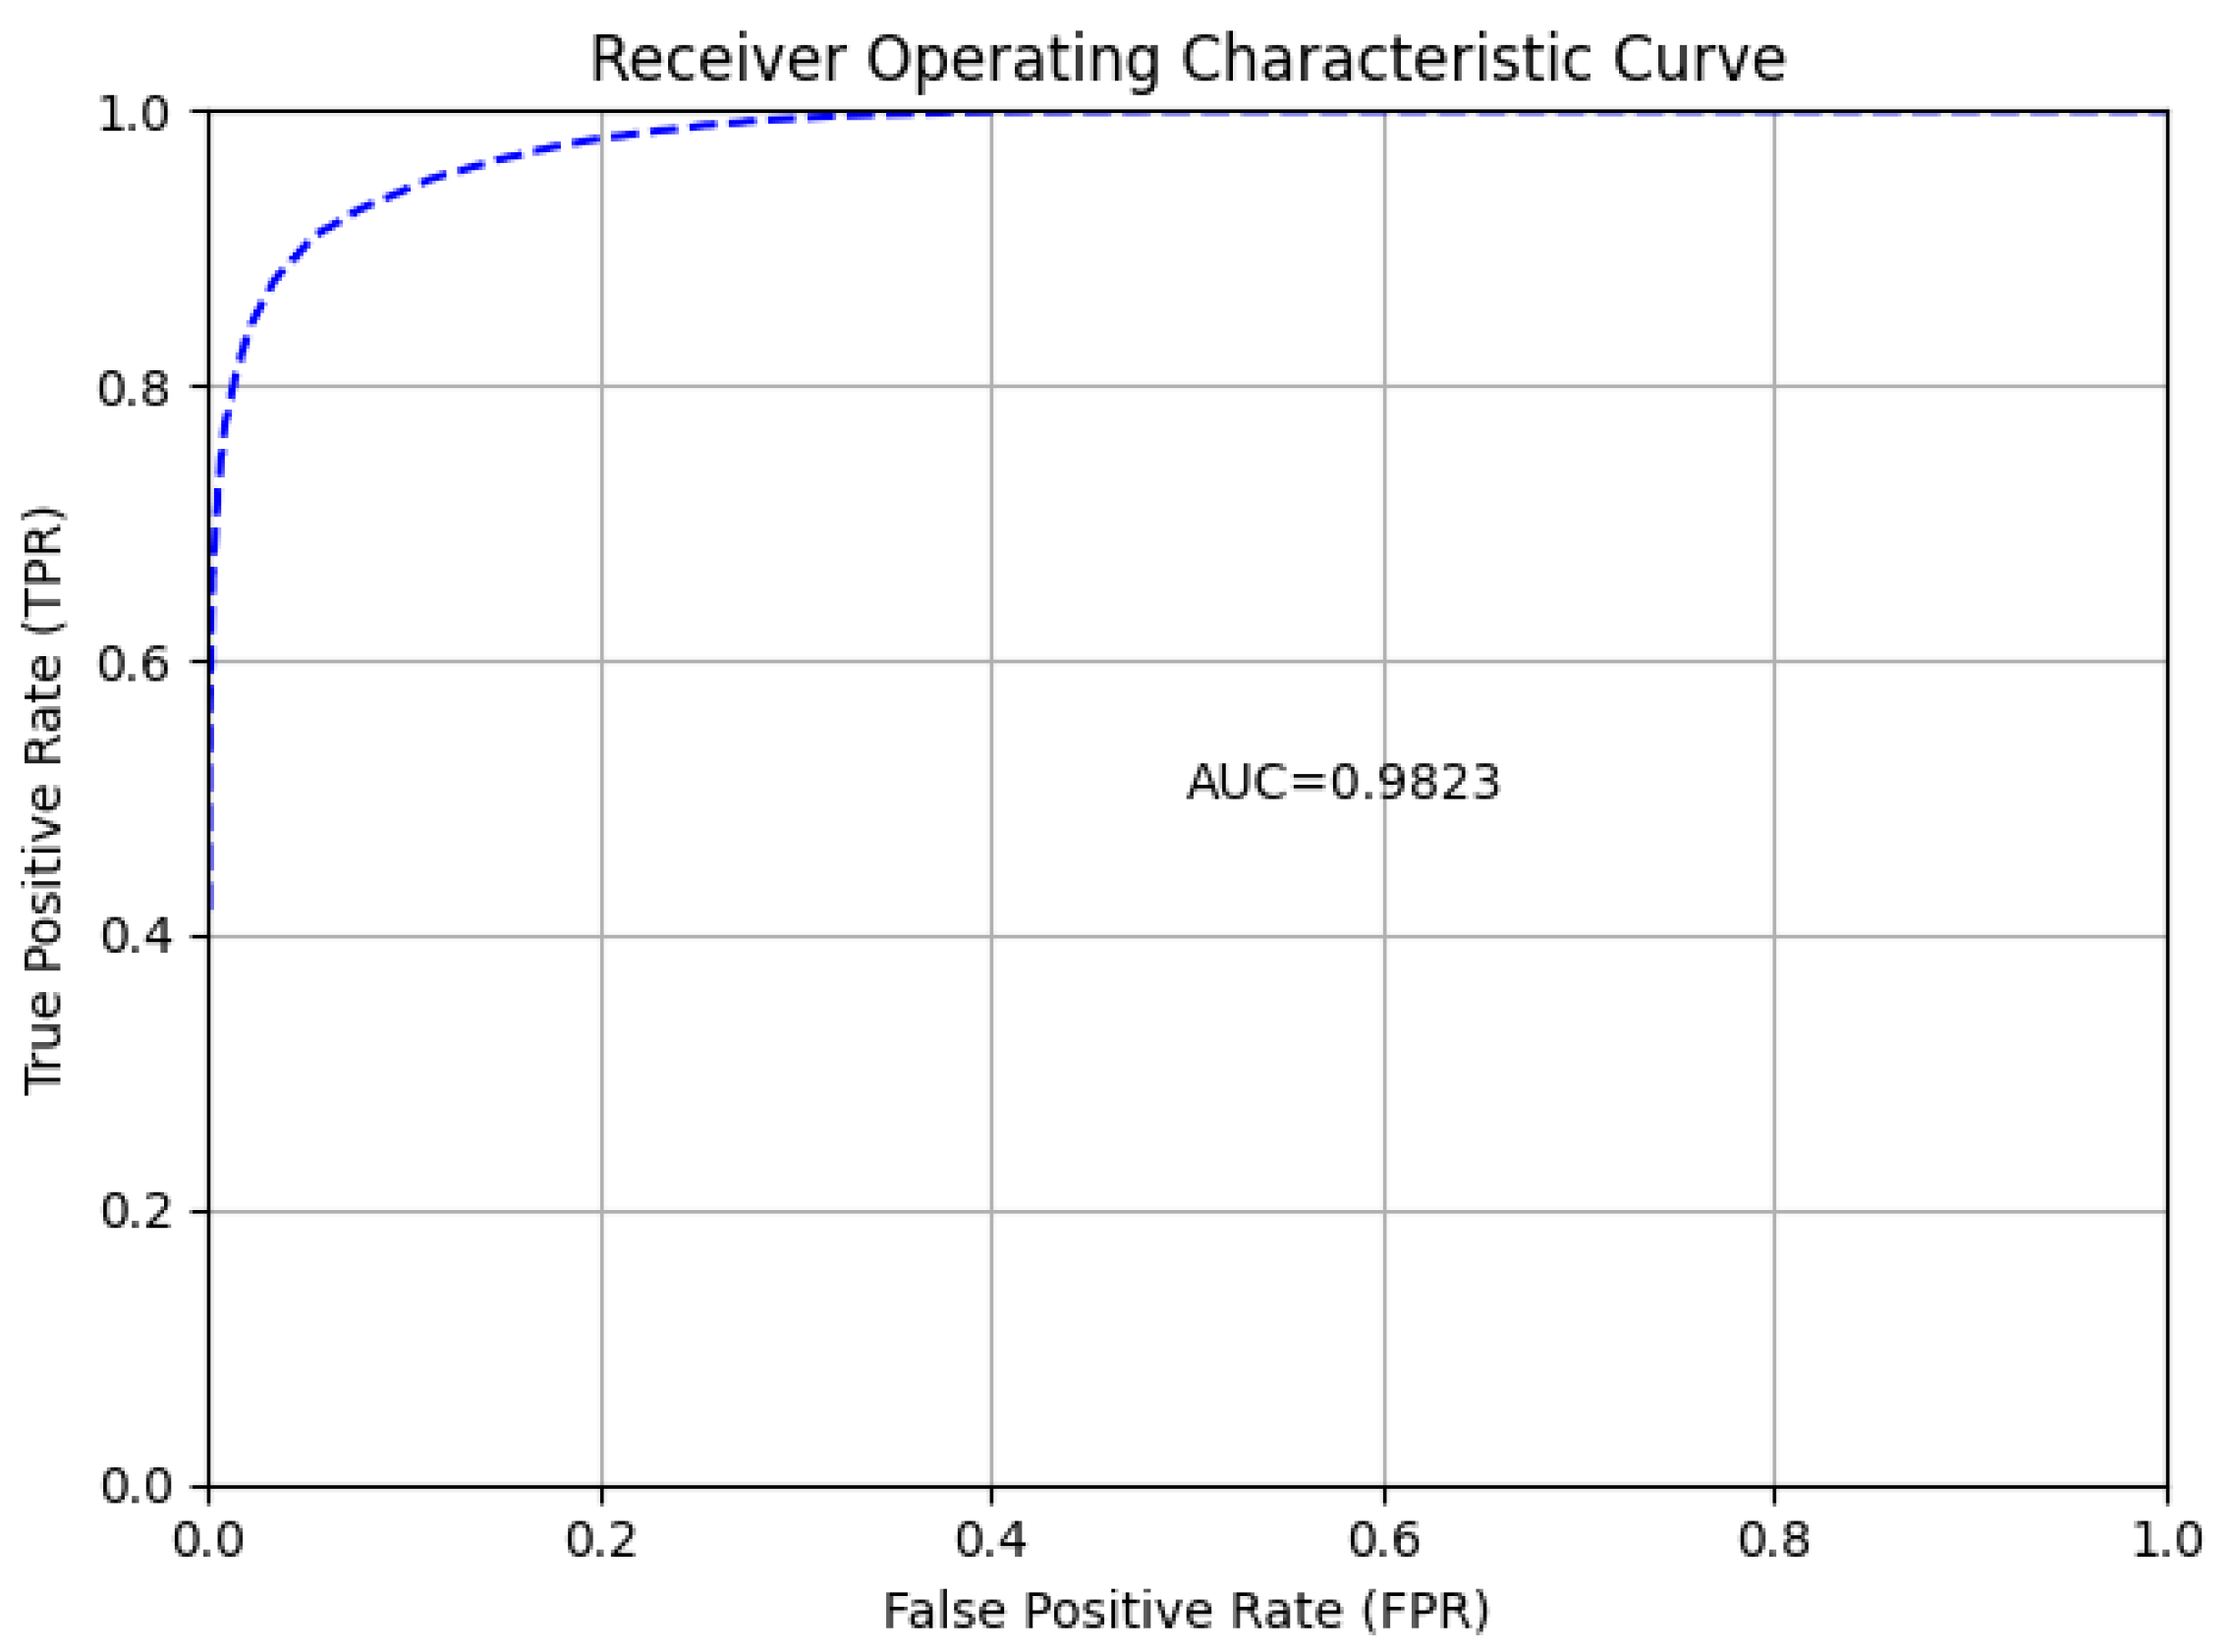
| B | 1–1200 | 0.9258 | 0.9370 | 0.9822 | 0.9077 | 0.9238 | 0.9748 |
Disclaimer/Publisher’s Note: The statements, opinions and data contained in all publications are solely those of the individual author(s) and contributor(s) and not of MDPI and/or the editor(s). MDPI and/or the editor(s) disclaim responsibility for any injury to people or property resulting from any ideas, methods, instructions or products referred to in the content. |
© 2023 by the authors. Licensee MDPI, Basel, Switzerland. This article is an open access article distributed under the terms and conditions of the Creative Commons Attribution (CC BY) license (https://creativecommons.org/licenses/by/4.0/).
Share and Cite
Zemla, K.; Wojcik, G.M.; Postepski, F.; Wróbel, K.; Kawiak, A.; Sedek, G. Modeling of Brain Cortical Activity during Relaxation and Mental Workload Tasks Based on EEG Signal Collection. Appl. Sci. 2023, 13, 4472. https://doi.org/10.3390/app13074472
Zemla K, Wojcik GM, Postepski F, Wróbel K, Kawiak A, Sedek G. Modeling of Brain Cortical Activity during Relaxation and Mental Workload Tasks Based on EEG Signal Collection. Applied Sciences. 2023; 13(7):4472. https://doi.org/10.3390/app13074472
Chicago/Turabian StyleZemla, Katarzyna, Grzegorz M. Wojcik, Filip Postepski, Krzysztof Wróbel, Andrzej Kawiak, and Grzegorz Sedek. 2023. "Modeling of Brain Cortical Activity during Relaxation and Mental Workload Tasks Based on EEG Signal Collection" Applied Sciences 13, no. 7: 4472. https://doi.org/10.3390/app13074472