
A Self-Supervised Tree-Structured Framework for Fine-Grained Classification


Abstract
:1. Introduction
2. Related Work
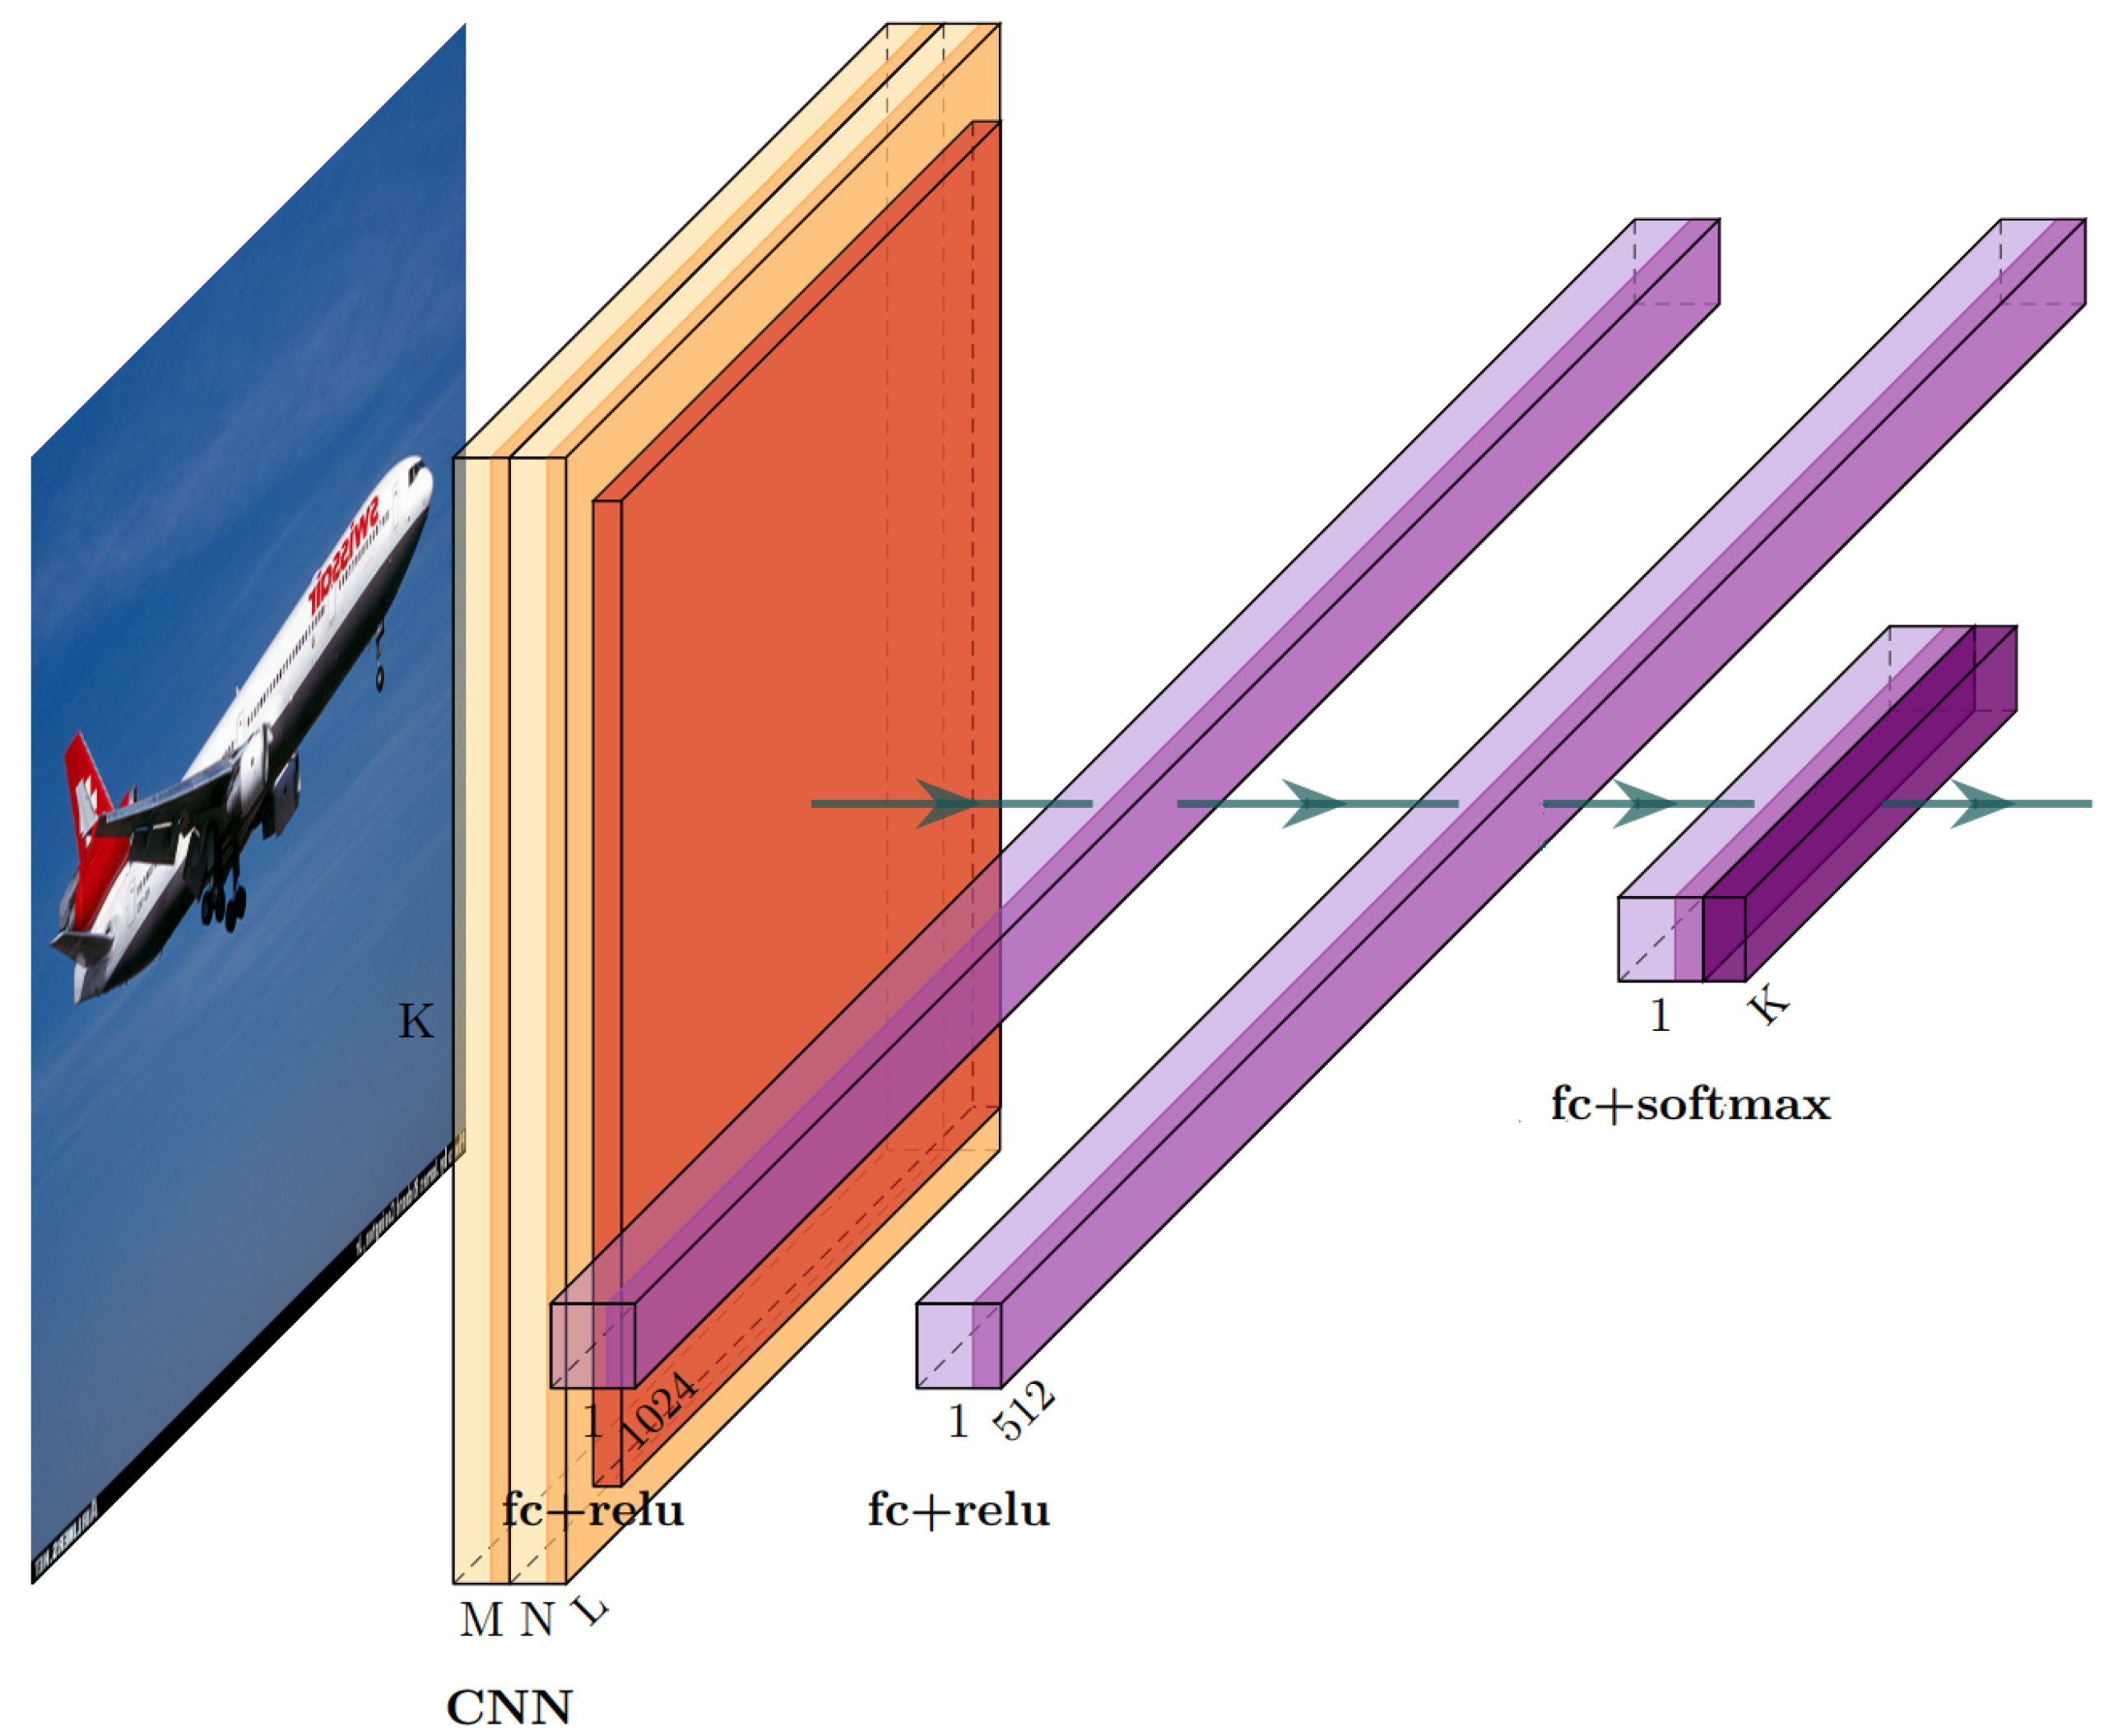
3. Proposed Tree-Structured Framework for Fine-Grained Classification
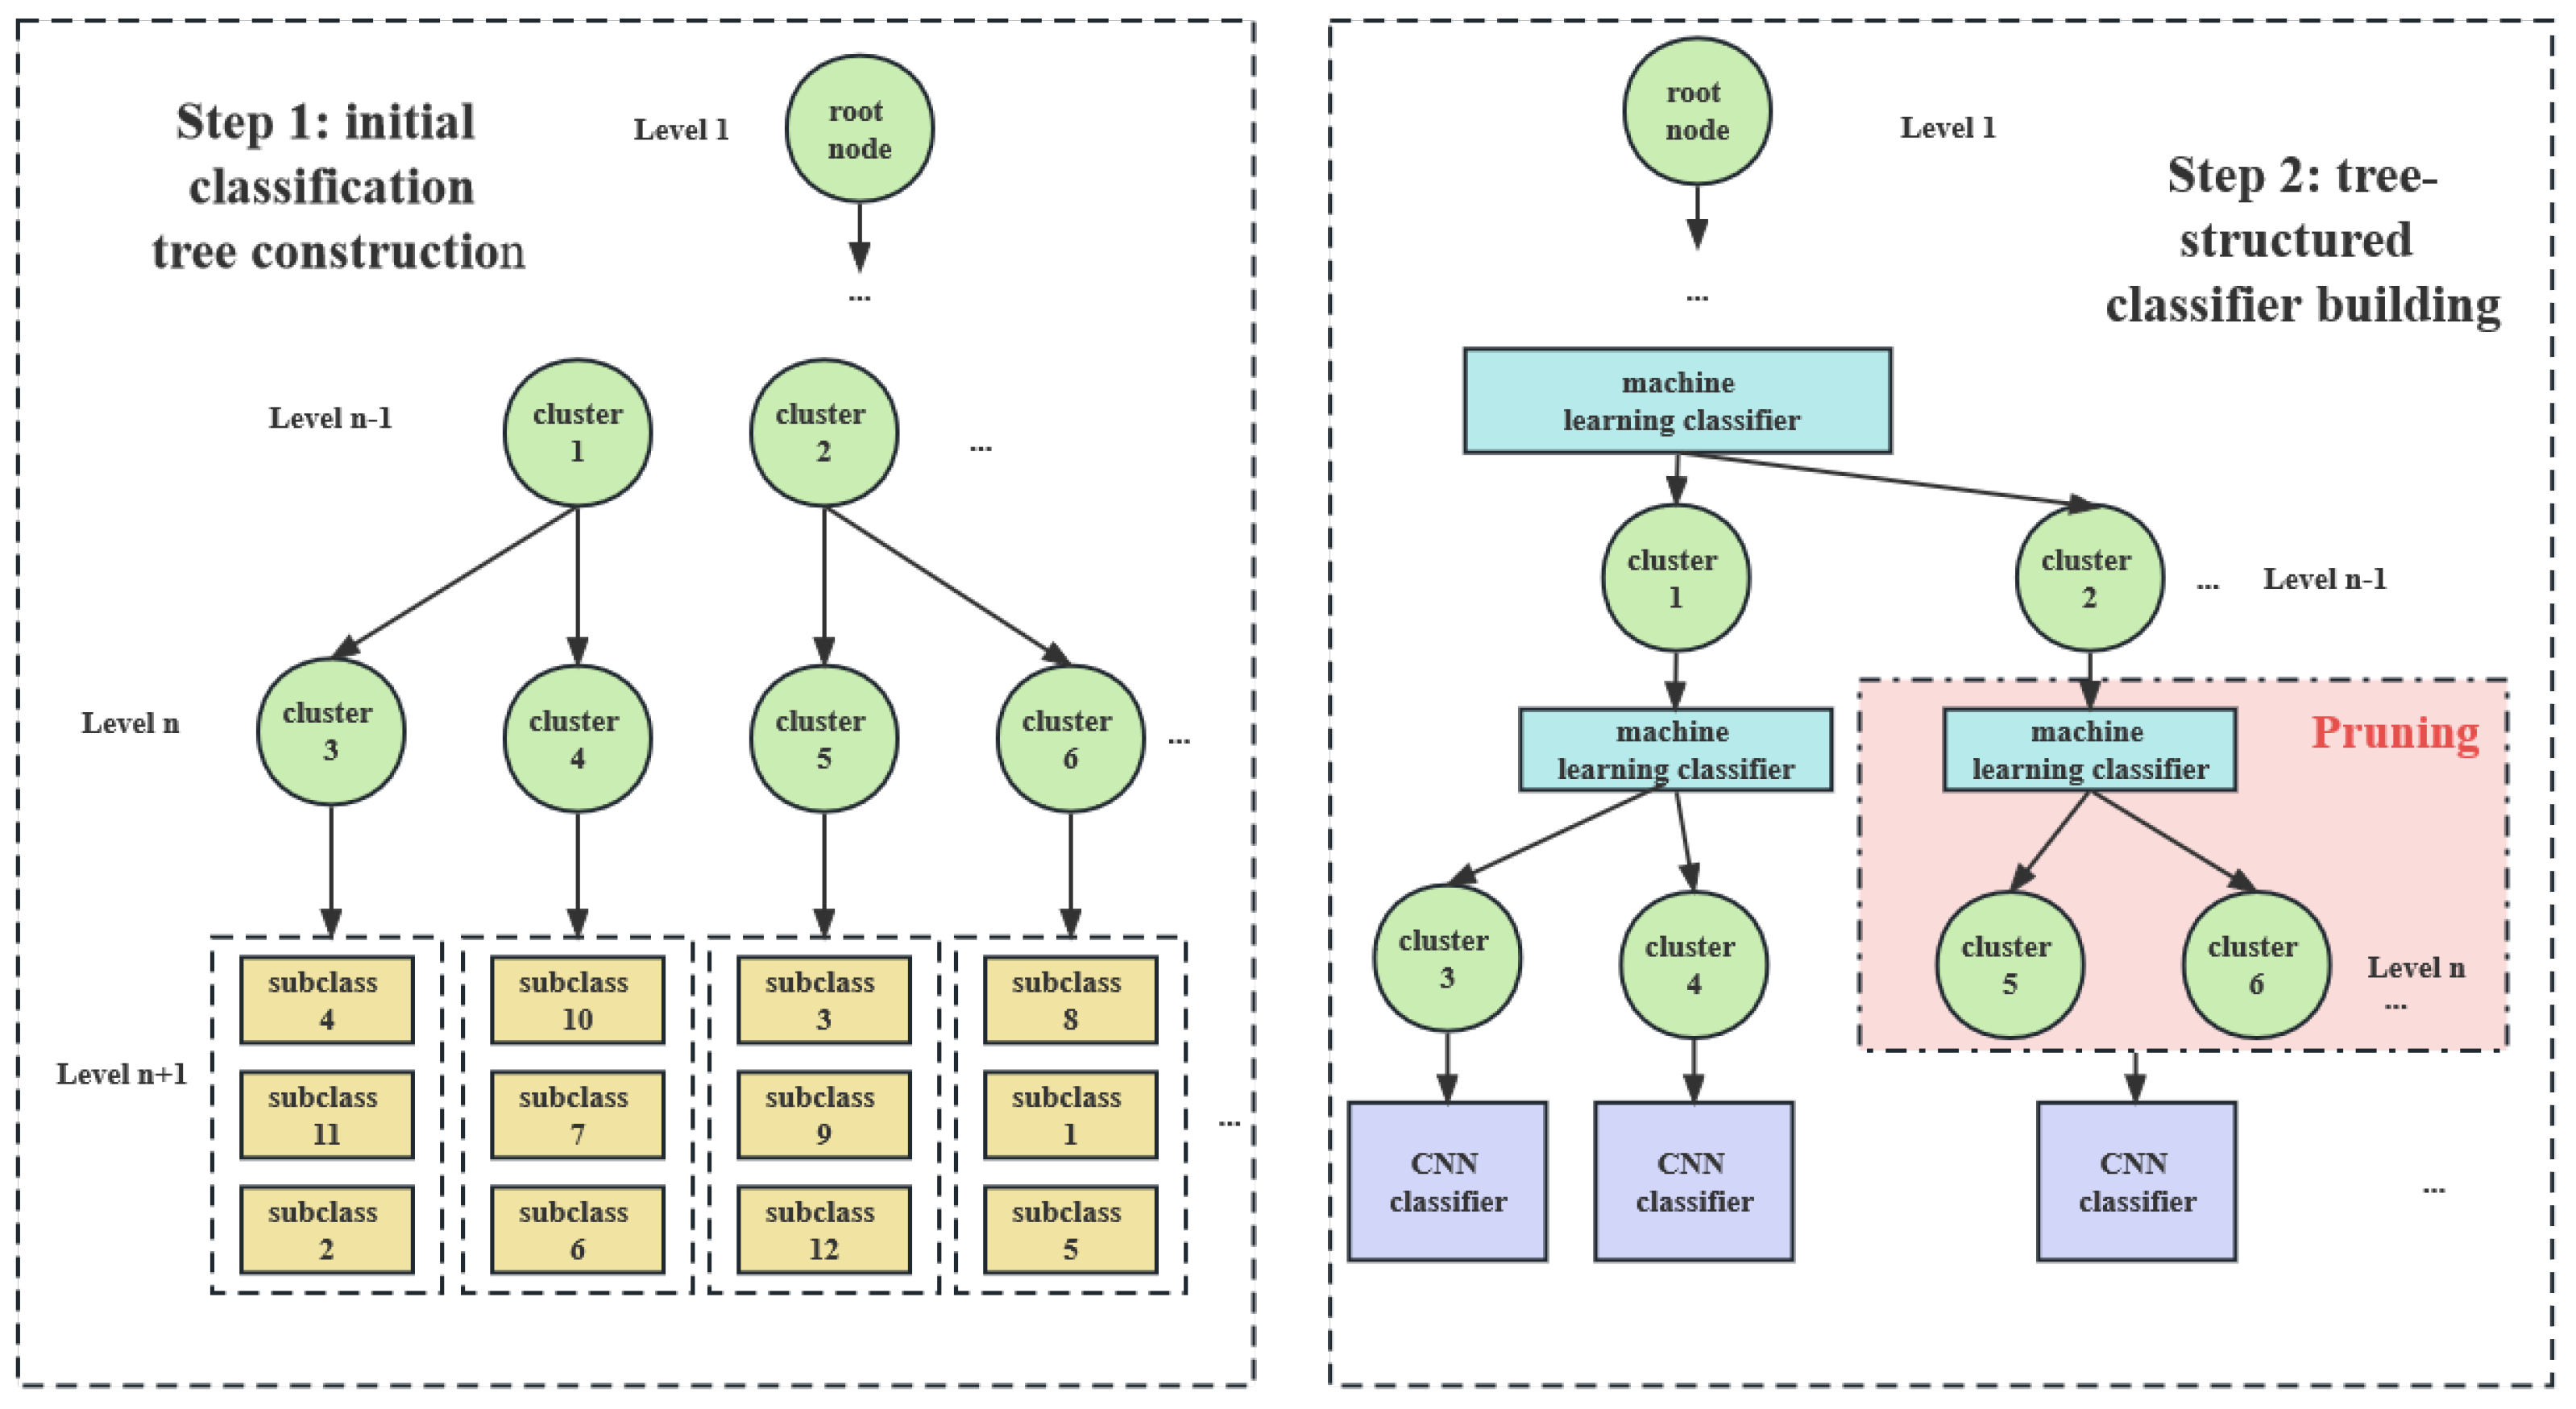
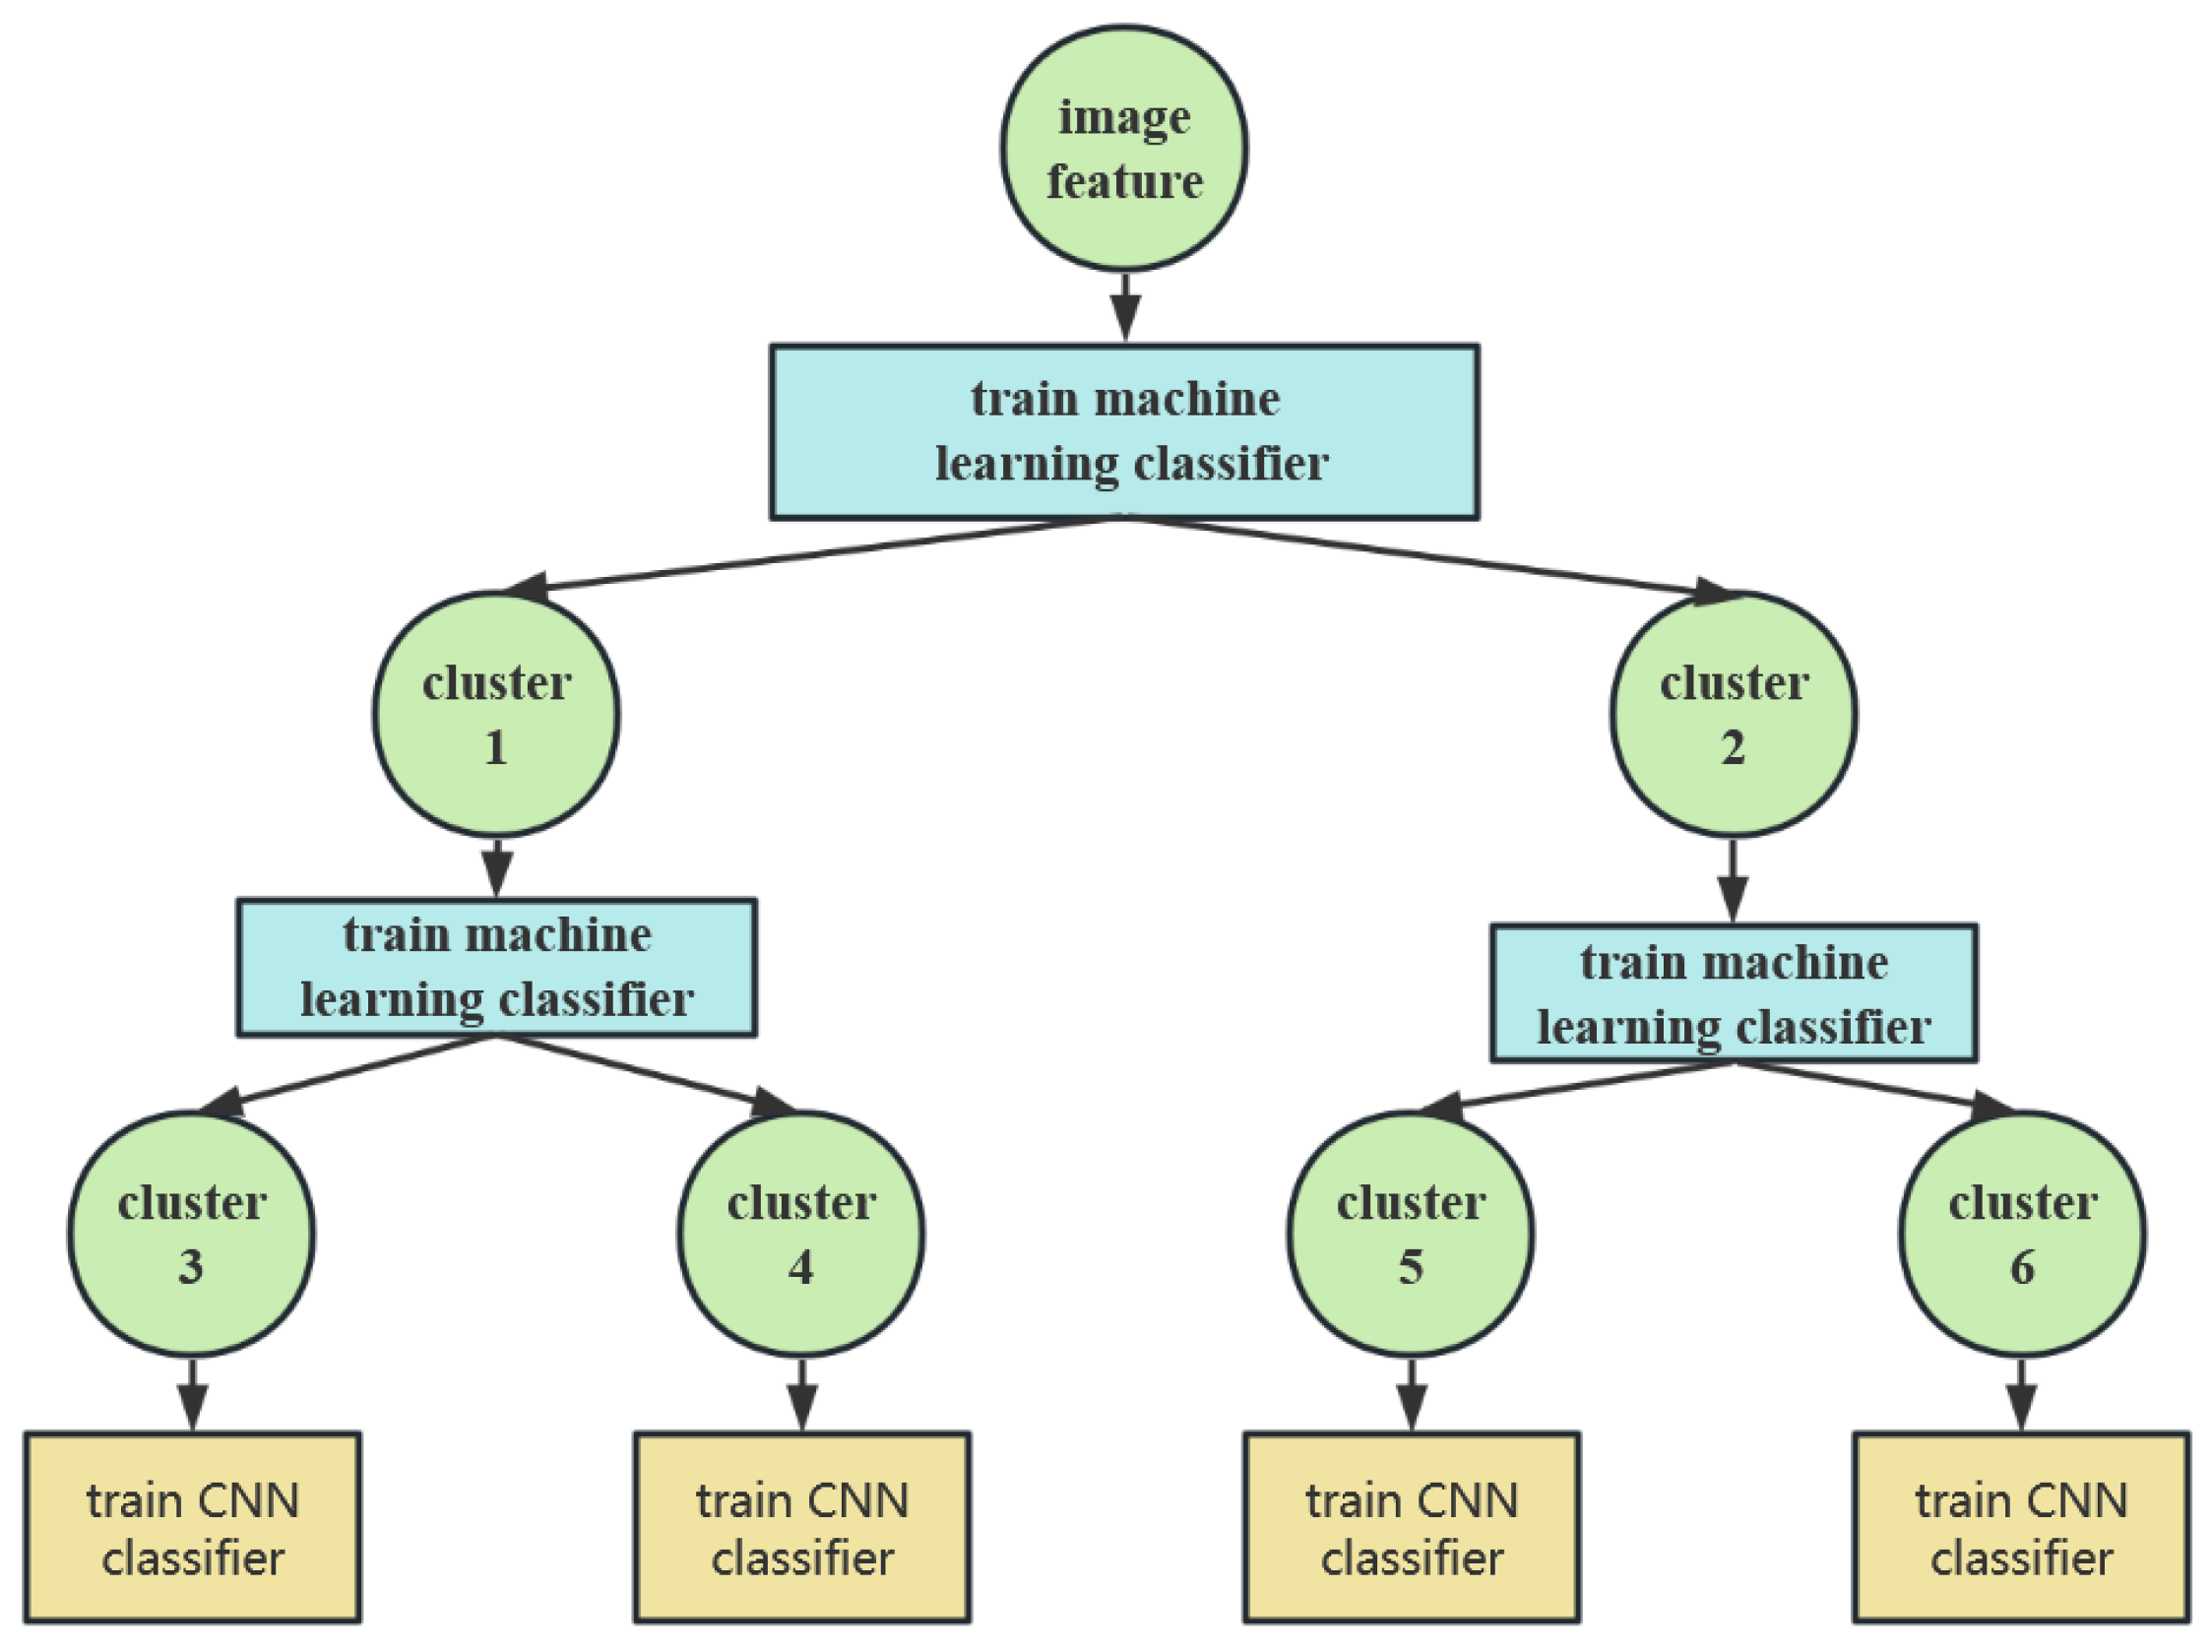
- Initial classification tree construction: This step applies a recursive method to construct an initial classification tree through a clustering algorithm. This helps to group similar subclasses together, achieving the effect of automatic hierarchy building. As shown in Figure 3, the proposed approach classifies subclasses into different clusters based on their similarity in Level n. Then, the clusters of Level n are classified into Level clusters.
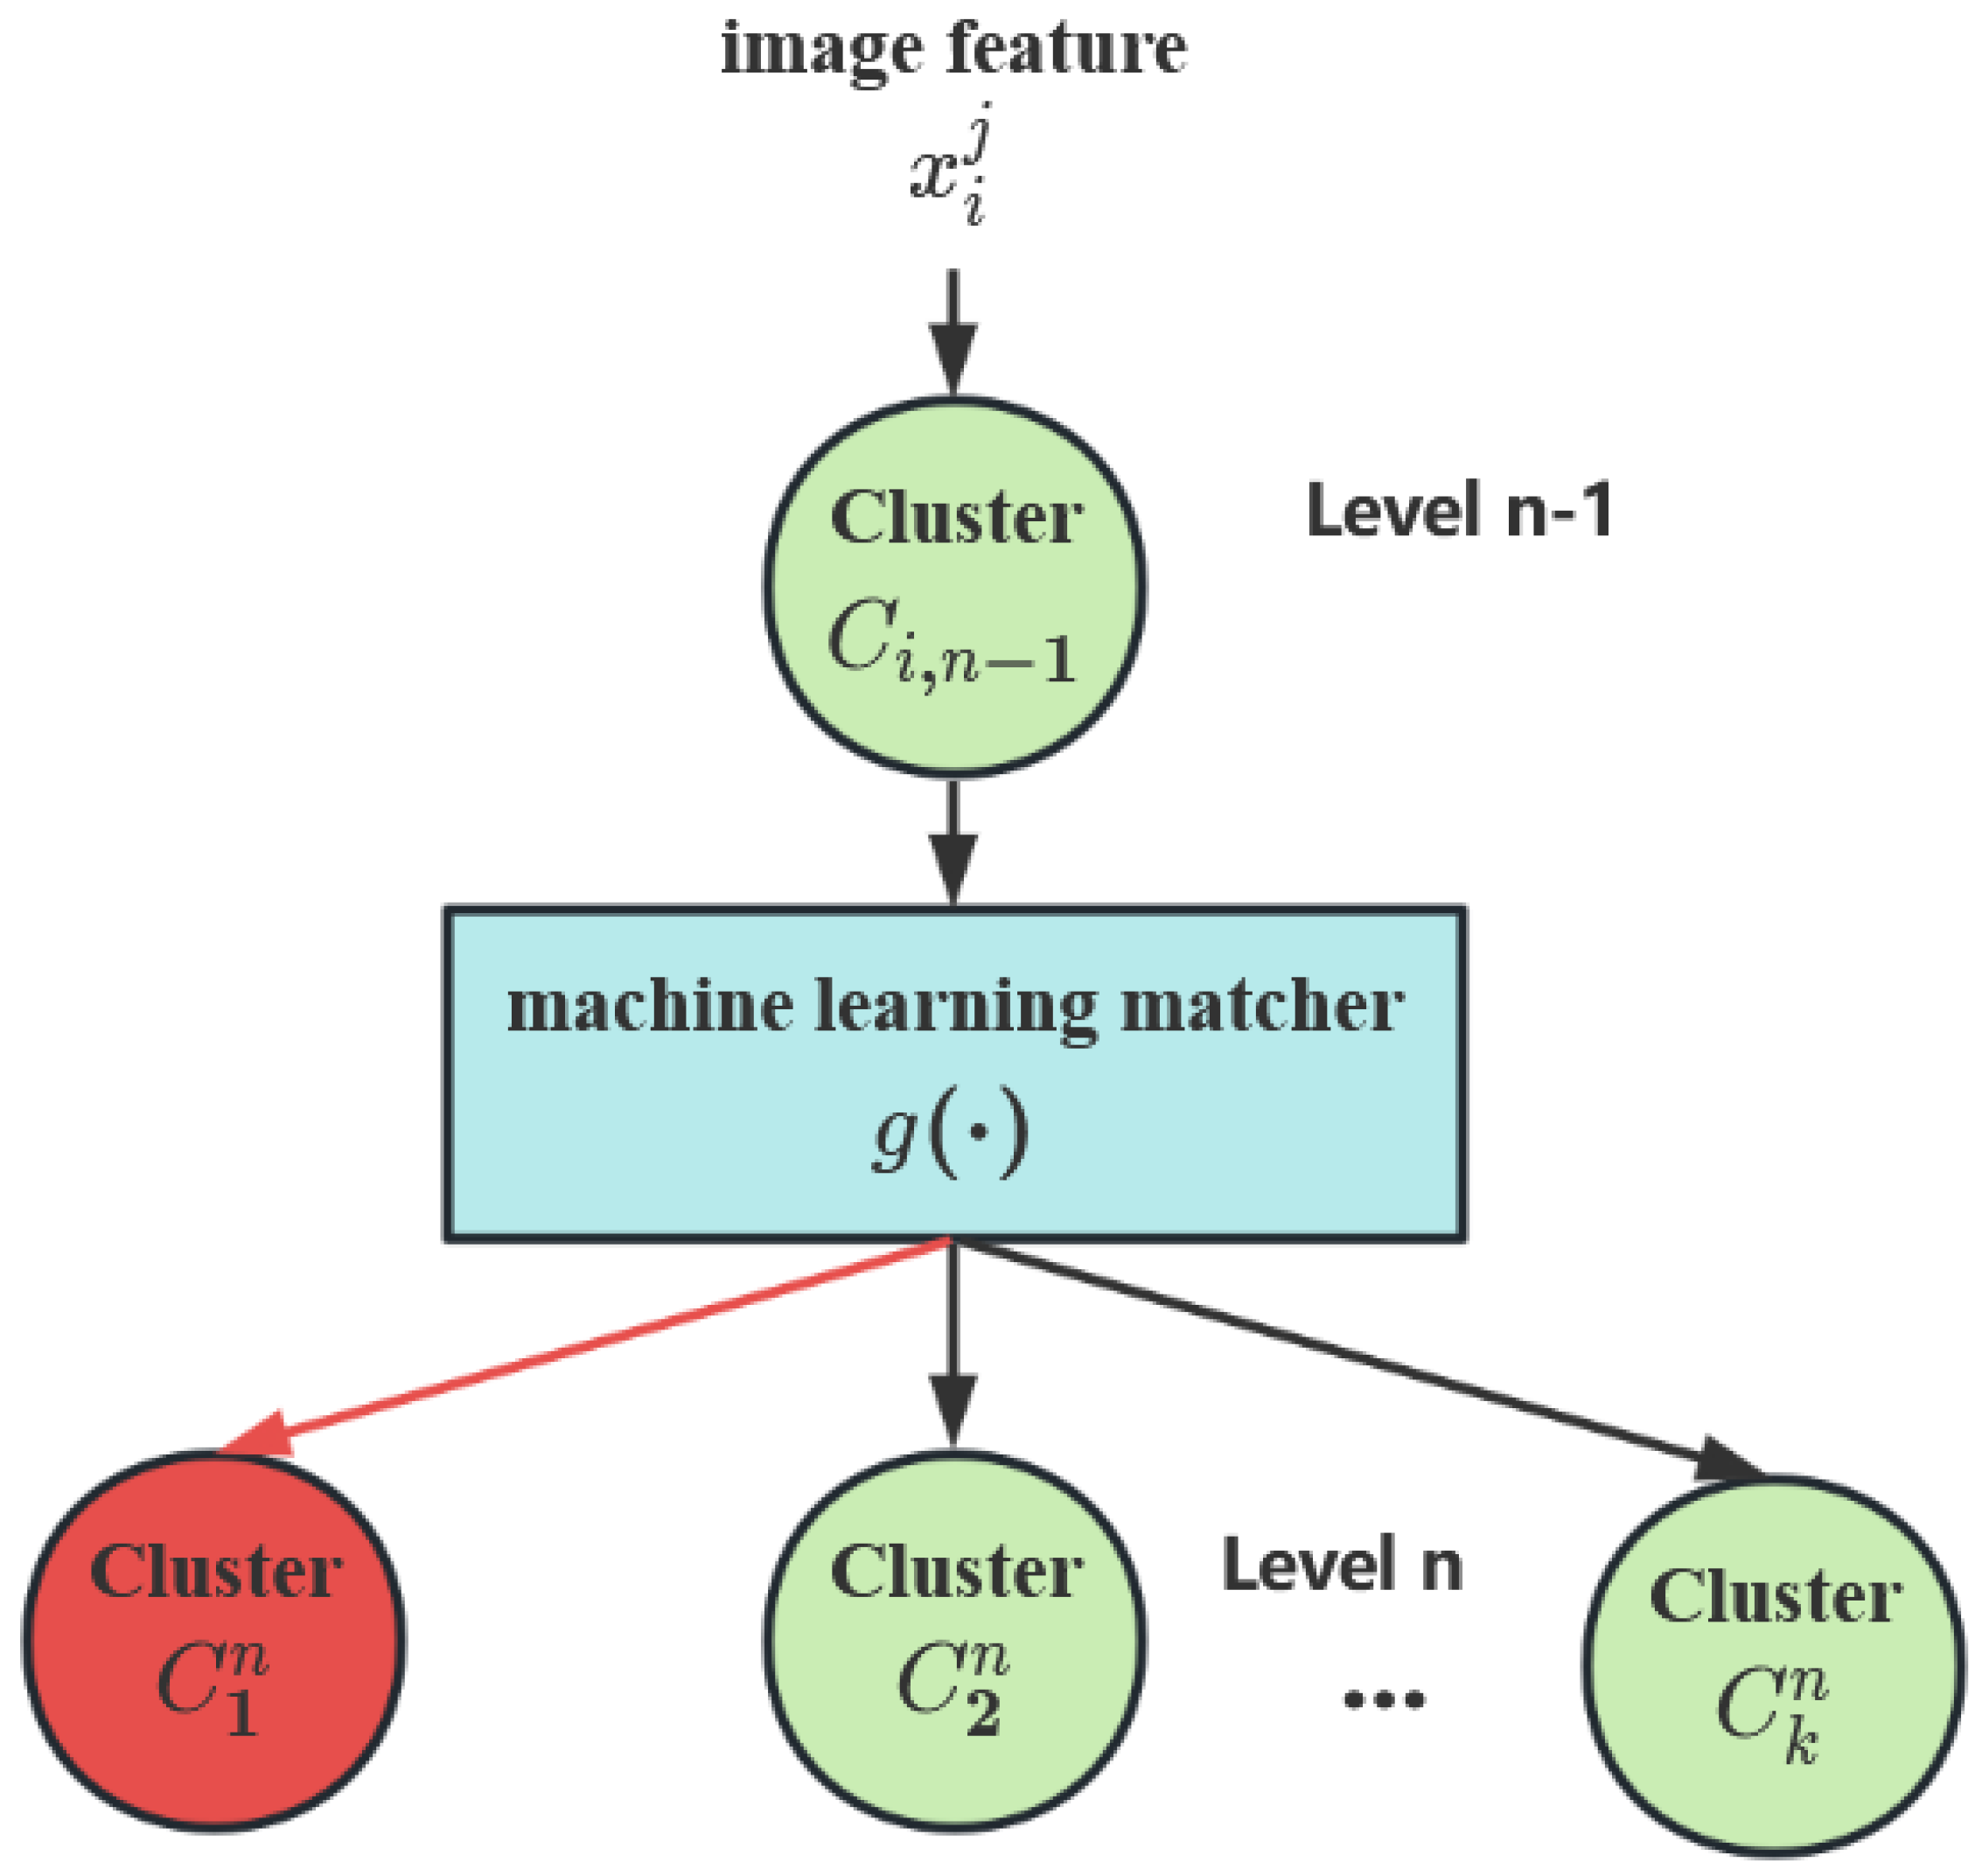
- Tree-structured classifier building: In this step, a machine-learning matcher is developed to predict the belonging cluster. Then, a pruning criterion is applied to remove useless clusters from the tree hierarchy, resulting in a classifier with a better classification performance. As shown in Figure 3, the red box represents the useless clusters that have been pruned. Finally, within the leaf cluster, a CNN model is used to predict the subclass.
3.1. Initial Classification Tree Construction
| Algorithm 1 Determining the belonging classes for the subclasses. |
|
| Algorithm 2 Construction of the initial classification tree. |
|
3.2. Tree-Structured Classifier Building
| Algorithm 3 Tree-structured classifier building. |
|
4. Experiment
4.1. Experimental Setting
4.1.1. Datasets
4.1.2. Metric
4.1.3. Parameter Settings
4.2. Experimental Results
Training and Testing Phase
- Initial classification tree construction: Algorithm 2 is employed to construct an initial classification tree, where the K-means++ clustering algorithm is utilized.
- Training to predict class: Machine-learning matchers are trained for each level of the classification tree to associate images with their corresponding clusters. The tree-structured classifier is built using Algorithm 3, which utilizes the initial classification tree obtained in Step 1 and the trained machine-learning matchers.
- Cluster matching: Based on the extracted image features, a machine-learning matcher is employed to match the belonging cluster, i.e., the leaf cluster.
- Subclass prediction: The CNN classifier is applied to predict the belonging subclass in the leaf cluster.
4.3. Conducted Experiments and Results
4.3.1. Experiment 1
4.3.2. Experiment 2
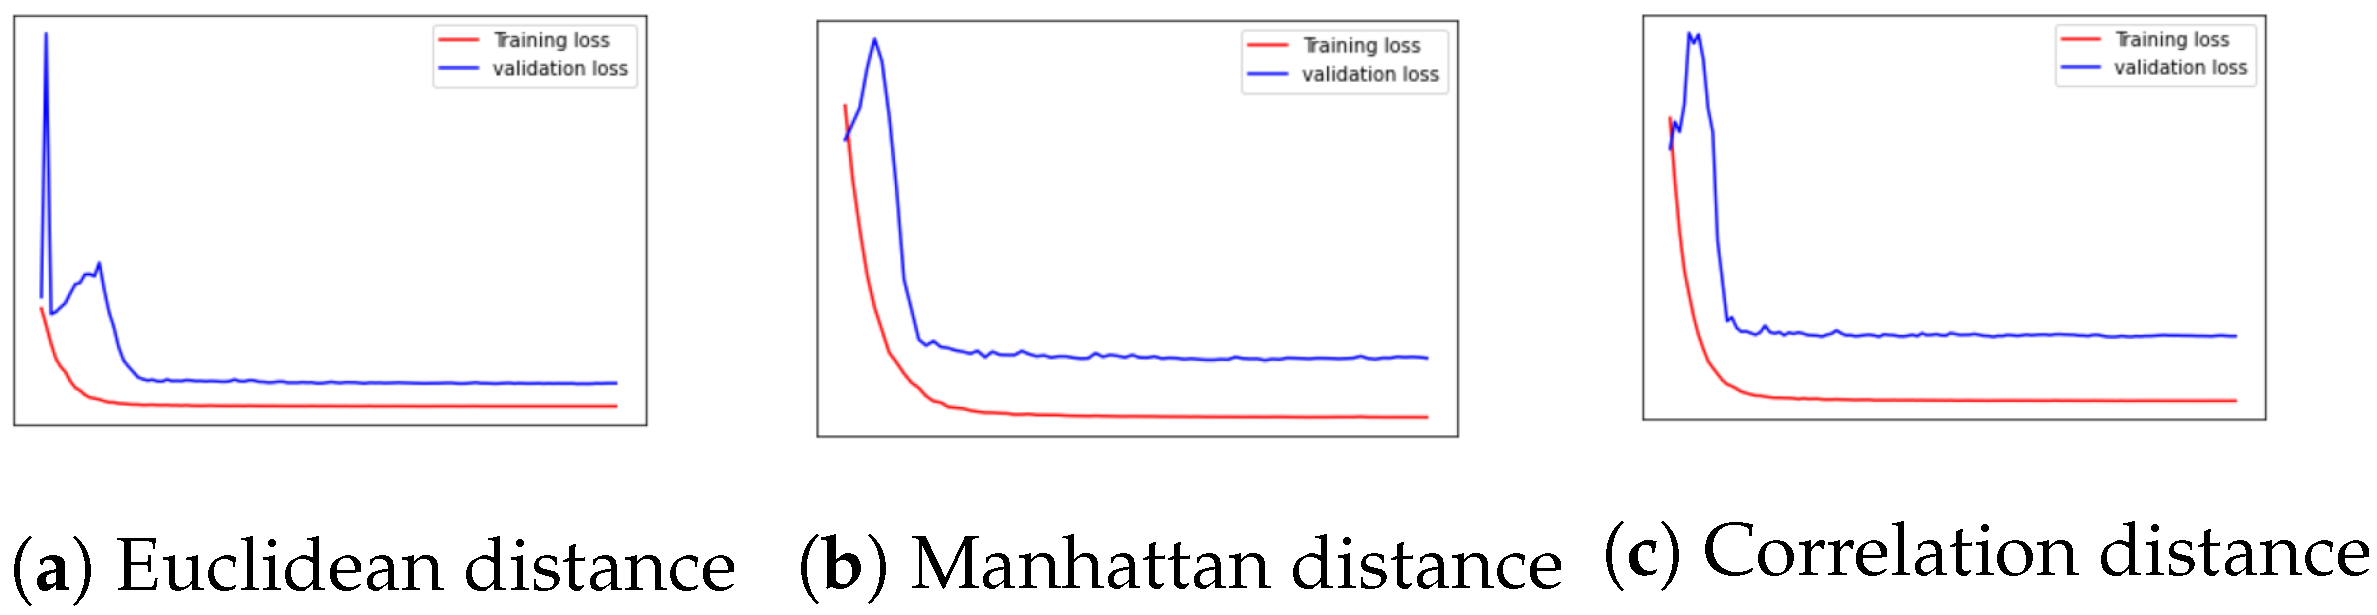
4.3.3. Experiment 3
4.3.4. Experiment 4
5. Conclusions
Author Contributions
Funding
Institutional Review Board Statement
Informed Consent Statement
Data Availability Statement
Conflicts of Interest
References
- Ning, X.; Gong, K.; Li, W.; Zhang, L.; Bai, X.; Tian, S. Feature refinement and filter network for person re-identification. IEEE Trans. Circ. Syst. Video Technol. 2020, 31, 3391–3402. [Google Scholar] [CrossRef]
- Han, J.; Yao, X.; Cheng, G.; Feng, X.; Xu, D. P-CNN: Part-based convolutional neural networks for fine-grained visual categorization. IEEE Trans. Pattern Anal. Mach. Intell. 2019, 44, 579–590. [Google Scholar] [CrossRef] [PubMed]
- Liu, X.; Han, Z.; Liu, Y.S.; Zwicker, M. Fine-grained 3D shape classification with hierarchical part-view attention. IEEE Trans. Image Process. 2021, 30, 1744–1758. [Google Scholar] [CrossRef] [PubMed]
- Lin, D.; Shen, X.; Lu, C.; Jia, J. Deep lac: Deep localization, alignment and classification for fine-grained recognition. In Proceedings of the IEEE Conference on Computer Vision and Pattern Recognition, Boston, MA, USA, 7–15 June 2015; pp. 1666–1674. [Google Scholar]
- Wang, Q.; Xie, J.; Zuo, W.; Zhang, L.; Li, P. Deep cnns meet global covariance pooling: Better representation and generalization. IEEE Trans. Pattern Anal. Mach. Intell. 2020, 43, 2582–2597. [Google Scholar] [CrossRef] [PubMed]
- Lu, Z.; Yang, Z. Image recognition based on improved recurrent attention network. In Proceedings of the 2021 4th International Conference on Robotics, Control and Automation Engineering (RCAE), Wuhan, China, 4–6 November 2021; IEEE: Piscataway, NJ, USA, 2021; pp. 31–35. [Google Scholar]
- Liu, Z.; Agu, E.; Pedersen, P.; Lindsay, C.; Tulu, B.; Strong, D. Comprehensive assessment of fine-grained wound images using a patch-based CNN with context-preserving attention. IEEE Open J. Eng. Med. Biol. 2021, 2, 224–234. [Google Scholar] [CrossRef] [PubMed]
- Wei, X.S.; Luo, J.H.; Wu, J.; Zhou, Z.H. Selective convolutional descriptor aggregation for fine-grained image retrieval. IEEE Trans. Image Proc. 2017, 26, 2868–2881. [Google Scholar] [CrossRef] [PubMed]
- Zhang, F.; Li, M.; Zhai, G.; Liu, Y. Multi-branch and multi-scale attention learning for fine-grained visual categorization. In Proceedings of the MultiMedia Modeling: 27th International Conference, MMM 2021, Part I 27, Prague, Czech Republic, 22–24 June 2021; Springer: Berlin/Heidelberg, Germany, 2021; pp. 136–147. [Google Scholar]
- Breiki, F.A.; Ridzuan, M.; Grandhe, R. Self-supervised learning for fine-grained image classification. arXiv 2021, arXiv:2107.13973. [Google Scholar]
- Lai, D.; Tian, W.; Chen, L. Improving classification with semi-supervised and fine-grained learning. Pattern Recognit. 2019, 88, 547–556. [Google Scholar] [CrossRef]
- Zhang, Y.; Wei, X.S.; Wu, J.; Cai, J.; Lu, J.; Nguyen, V.A.; Do, M.N. Weakly supervised fine-grained categorization with part-based image representation. IEEE Trans. Image Proc. 2016, 25, 1713–1725. [Google Scholar] [CrossRef] [PubMed]
- Wang, S.H.; Zhang, Y.D. DenseNet-201-based deep neural network with composite learning factor and precomputation for multiple sclerosis classification. ACM Trans. Multimed. Comp. Commun. Appl. (TOMM) 2020, 16, 1–19. [Google Scholar] [CrossRef]
- Hu, Q.; Wang, H.; Li, T.; Shen, C. Deep CNNs with spatially weighted pooling for fine-grained car recognition. IEEE Trans. Intell. Transp. Syst. 2017, 18, 3147–3156. [Google Scholar] [CrossRef]
- Tanno, R.; Arulkumaran, K.; Alexander, D.; Criminisi, A.; Nori, A. Adaptive neural trees. In Proceedings of the International Conference on Machine Learning, PMLR, Long Beach, CA, USA, 9–15 June 2019; pp. 6166–6175. [Google Scholar]
- Chien, E.; Chang, W.C.; Hsieh, C.J.; Yu, H.F.; Zhang, J.; Milenkovic, O.; Dhillon, I.S. Node feature extraction by self-supervised multi-scale neighborhood prediction. arXiv 2021, arXiv:2111.00064. [Google Scholar]
- Daumé, H., III; Karampatziakis, N.; Langford, J.; Mineiro, P. Logarithmic time one-against-some. In Proceedings of the International Conference on Machine Learning, PMLR. Sydney, Australia, 6–11 August 2017; pp. 923–932. [Google Scholar]
- Morin, F.; Bengio, Y. Hierarchical probabilistic neural network language model. In Proceedings of the International Workshop on Artificial Intelligence and Statistics, PMLR, Barbados, Caribbean, 6–8 January 2005; pp. 246–252. [Google Scholar]
- Baharav, T.Z.; Jiang, D.L.; Kolluri, K.; Sanghavi, S.; Dhillon, I.S. Enabling efficiency-precision trade-offs for label trees in extreme classification. In Proceedings of the 30th ACM International Conference on Information & Knowledge Management, Online, 1–5 November 2021; pp. 3717–3726. [Google Scholar]
- Yu, H.F.; Zhang, J.; Chang, W.C.; Jiang, J.Y.; Li, W.; Hsieh, C.J. Pecos: Prediction for enormous and correlated output spaces. In Proceedings of the 28th ACM SIGKDD Conference on Knowledge Discovery and Data Mining, Washington, DC, USA, 14–18 August 2022; pp. 4848–4849. [Google Scholar]
- Sadeghi, Z.; Araabi, B.N.; Ahmadabadi, M.N. A computational approach towards visual object recognition at taxonomic levels of concepts. Comp. Intell. Neurosci. 2015, 2015, 72. [Google Scholar] [CrossRef] [PubMed]
- Goel, A.; Banerjee, B.; Pižurica, A. Hierarchical metric learning for optical remote sensing scene categorization. IEEE Geosci. Remote Sens. Lett. 2018, 16, 952–956. [Google Scholar] [CrossRef]
- Bameri, F.; Pourreza, H.R.; Taherinia, A.H.; Aliabadian, M.; Mortezapour, H.R.; Abdilzadeh, R. TMTCPT: The Tree Method based on the Taxonomic Categorization and the Phylogenetic Tree for fine-grained categorization. Biosystems 2020, 195, 104137. [Google Scholar] [CrossRef] [PubMed]
- Hasan, M.S. An application of pre-trained CNN for image classification. In Proceedings of the 2017 20th International Conference of Computer and Information Technology (ICCIT), Dhaka, Bangladesh, 22–24 December 2017; IEEE: Piscataway, NJ, USA, 2017; pp. 1–6. [Google Scholar]
- Dechev, D.; Ahn, T.H. Using sst/macro for effective analysis of mpi-based applications: Evaluating large-scale genomic sequence search. IEEE Access 2013, 1, 428–435. [Google Scholar] [CrossRef]
- He, K.; Zhang, X.; Ren, S.; Sun, J. Deep residual learning for image recognition. In Proceedings of the IEEE Conference on CComputer Vision and Pattern Recognition, Las Vegas, NV, USA, 26 June–1 July 2016; pp. 770–778. [Google Scholar]
- Arthur, D.; Vassilvitskii, S. k-Means++: The Advantages of Careful Seeding; Technical Report; Stanford University: Stanford, CA, USA, 2006. [Google Scholar]
- Maji, S.; Rahtu, E.; Kannala, J.; Blaschko, M.; Vedaldi, A. Fine-grained visual classification of aircraft. arXiv 2013, arXiv:1306.5151. [Google Scholar]
- Wah, C.; Branson, S.; Welinder, P.; Perona, P.; Belongie, S. The Caltech-Ucsd Birds-200-2011 Dataset; California Institute of Technology: California, CA, USA, 2011. [Google Scholar]
- Krause, J.; Stark, M.; Deng, J.; Fei-Fei, L. 3d object representations for fine-grained categorization. In Proceedings of the IEEE International Conference on Computer Vision Workshops, Washington, DC, USA, 2–8 December 2013; pp. 554–561. [Google Scholar]
- Bora, M.; Jyoti, D.; Gupta, D.; Kumar, A. Effect of different distance measures on the performance of K-means algorithm: An experimental study in Matlab. arXiv 2014, arXiv:1405.7471. [Google Scholar]
- Berge, C. Two theorems in graph theory. Proc. Nat. Acad. Sci. USA 1957, 43, 842–844. [Google Scholar] [CrossRef] [PubMed]
- Szegedy, C.; Vanhoucke, V.; Ioffe, S.; Shlens, J.; Wojna, Z. Rethinking the inception architecture for computer vision. In Proceedings of the IEEE Conference on Computer Vision and Pattern Recognition, Las Vegas, NV, USA, 27–30 June 2016; pp. 2818–2826. [Google Scholar]
- Howard, A.G.; Zhu, M.; Chen, B.; Kalenichenko, D.; Wang, W.; Weyand, T.; Andreetto, M.; Adam, H. Mobilenets: Efficient convolutional neural networks for mobile vision applications. arXiv 2017, arXiv:1704.04861. [Google Scholar]


| Parameter | Setting Value | Parameter | Setting Value |
|---|---|---|---|
| Maximal number of iterations | 100 | Number of replicates | 1 |
| Start mode | sample | Threshold for change in the cost function |
| Parameter | Setting Value | Parameter | Setting Value |
|---|---|---|---|
| EPOCHS | 80 | optimizer | SGD |
| steps per epoch | Number of subclass/16 | loss | categorical cross-entropy |
| verbose | 1 | metrics | accuracy |
| Machine Learning Matcher | Parameter | Setting Value | Parameter | Setting Value |
|---|---|---|---|---|
| Random forest | number of trees in the forest | 500 | bootstrap sampling for growing trees | True |
| minimum size of terminal nodes | 1 | maximum number of terminal nodes | NULL | |
| Naive Bayes | smallest possible positive number | frequency-based discretization | False | |
| SVM | type | C-classification | coef0 | 1 |
| cost | 10 | gamma | 0.0009 | |
| probability | Ture | – | – |
| Number of Child Clusters | Traditional ResNet Classifier Accuracy | Proposed Classifier Accuracy | Traditional ResNet Classifier Training Time | Proposed Classifier Training Time |
|---|---|---|---|---|
| 2 | 68.63% | 69.80% | 1480.41 s | 1395.08 s |
| 3 | 70.15% | 993.25 s | ||
| 4 | 69.94% | 927.64 s | ||
| 5 | 68.50% | 873.20 s |
| Distance Calculation Method | Traditional ResNet Classifier Accuracy | Proposed Classifier Accuracy | Traditional ResNet Classifier Training Time | Proposed Classifier Training Time |
|---|---|---|---|---|
| Euclidean distance | 68.63% | 70.15% | 1480.41 s | 993.25 s |
| Manhattan distance | 70.34% | 1090.64 s | ||
| Correlation distance | 69.03% | 849.5043 s |
| Machine- Learning Matcher | Tested Matcher | Accuracy | Training Time | Machine- Learning Matcher | Tested Matcher | Accuracy | Training Time |
|---|---|---|---|---|---|---|---|
| SVM (linear) | 2-1 | 100% | 71.20 s | SVM (radial) | 2-1 | 99.90% | 117.01 s |
| 2-2 | 100% | 19.41 s | 2-2 | 98.55% | 30.01 s | ||
| 3-1 | 100% | 91.77 s | 3-1 | 98.55% | 132.89 s | ||
| 4-1 | 99.98% | 100.73 s | 4-1 | 96.85% | 137.91 s | ||
| 5-1 | 99.97% | 107.26 s | 5-1 | 96.68% | 150.48 s | ||
| SVM (poly) | 2-1 | 100% | 98.86 s | SVM (sigmoid) | 2-1 | 92.29% | 95.61 s |
| 2-2 | 99.96% | 24.41 s | 2-2 | 94.18% | 27.14 s | ||
| 3-1 | 99.85% | 113.06 s | 3-1 | 89.70% | 115.24 s | ||
| 4-1 | 99.54% | 116.40 s | 4-1 | 97.67% | 124.69 s | ||
| 5-1 | 99.37% | 126.23 s | 5-1 | 88.63% | 150.90 s | ||
| Naive Bayes | 2-1 | 91.37% | 0.86 s | Random forest | 2-1 | 98.50% | 209.74 s |
| 2-2 | 93.14% | 0.64 s | 2-2 | 97.18% | 101.35 s | ||
| 3-1 | 88.56% | 1.13 s | 3-1 | 96.22% | 225.83 s | ||
| 4-1 | 85.64% | 1.31 s | 4-1 | 95.20% | 233.55 s | ||
| 5-1 | 84.22% | 1.51 s | 5-1 | 94.34% | 234.48 s |
| Datasets | Applied Model | Number of Child Clusters | Proposed Classifier Accuracy | Traditional CNN Classifier Accuracy | Proposed Classifier Training Time | Traditional CNN Training Time |
|---|---|---|---|---|---|---|
| Bird | ResNet | 3 | 70.15% | 68.63% | 993.25 s | 1480.41 s |
| Aircraft | MobileNet | 3 | 74.20% | 72.19% | 1962.21 s | 3060.01 s |
| Car | Inception | 2 | 82.83% | 83.42% | 3435.48 s | 4017.29 s |
Disclaimer/Publisher’s Note: The statements, opinions and data contained in all publications are solely those of the individual author(s) and contributor(s) and not of MDPI and/or the editor(s). MDPI and/or the editor(s) disclaim responsibility for any injury to people or property resulting from any ideas, methods, instructions or products referred to in the content. |
© 2023 by the authors. Licensee MDPI, Basel, Switzerland. This article is an open access article distributed under the terms and conditions of the Creative Commons Attribution (CC BY) license (https://creativecommons.org/licenses/by/4.0/).
Share and Cite
Cai, Q.; Niu, L.; Shang, X.; Ding, H. A Self-Supervised Tree-Structured Framework for Fine-Grained Classification. Appl. Sci. 2023, 13, 4453. https://doi.org/10.3390/app13074453
Cai Q, Niu L, Shang X, Ding H. A Self-Supervised Tree-Structured Framework for Fine-Grained Classification. Applied Sciences. 2023; 13(7):4453. https://doi.org/10.3390/app13074453
Chicago/Turabian StyleCai, Qihang, Lei Niu, Xibin Shang, and Heng Ding. 2023. "A Self-Supervised Tree-Structured Framework for Fine-Grained Classification" Applied Sciences 13, no. 7: 4453. https://doi.org/10.3390/app13074453