
Strategic Development of Dielectric Strength Prediction Protocol for Perfluorocarbon and Nonperfluorocarbon Compounds

Abstract
:1. Introduction
2. Methodology
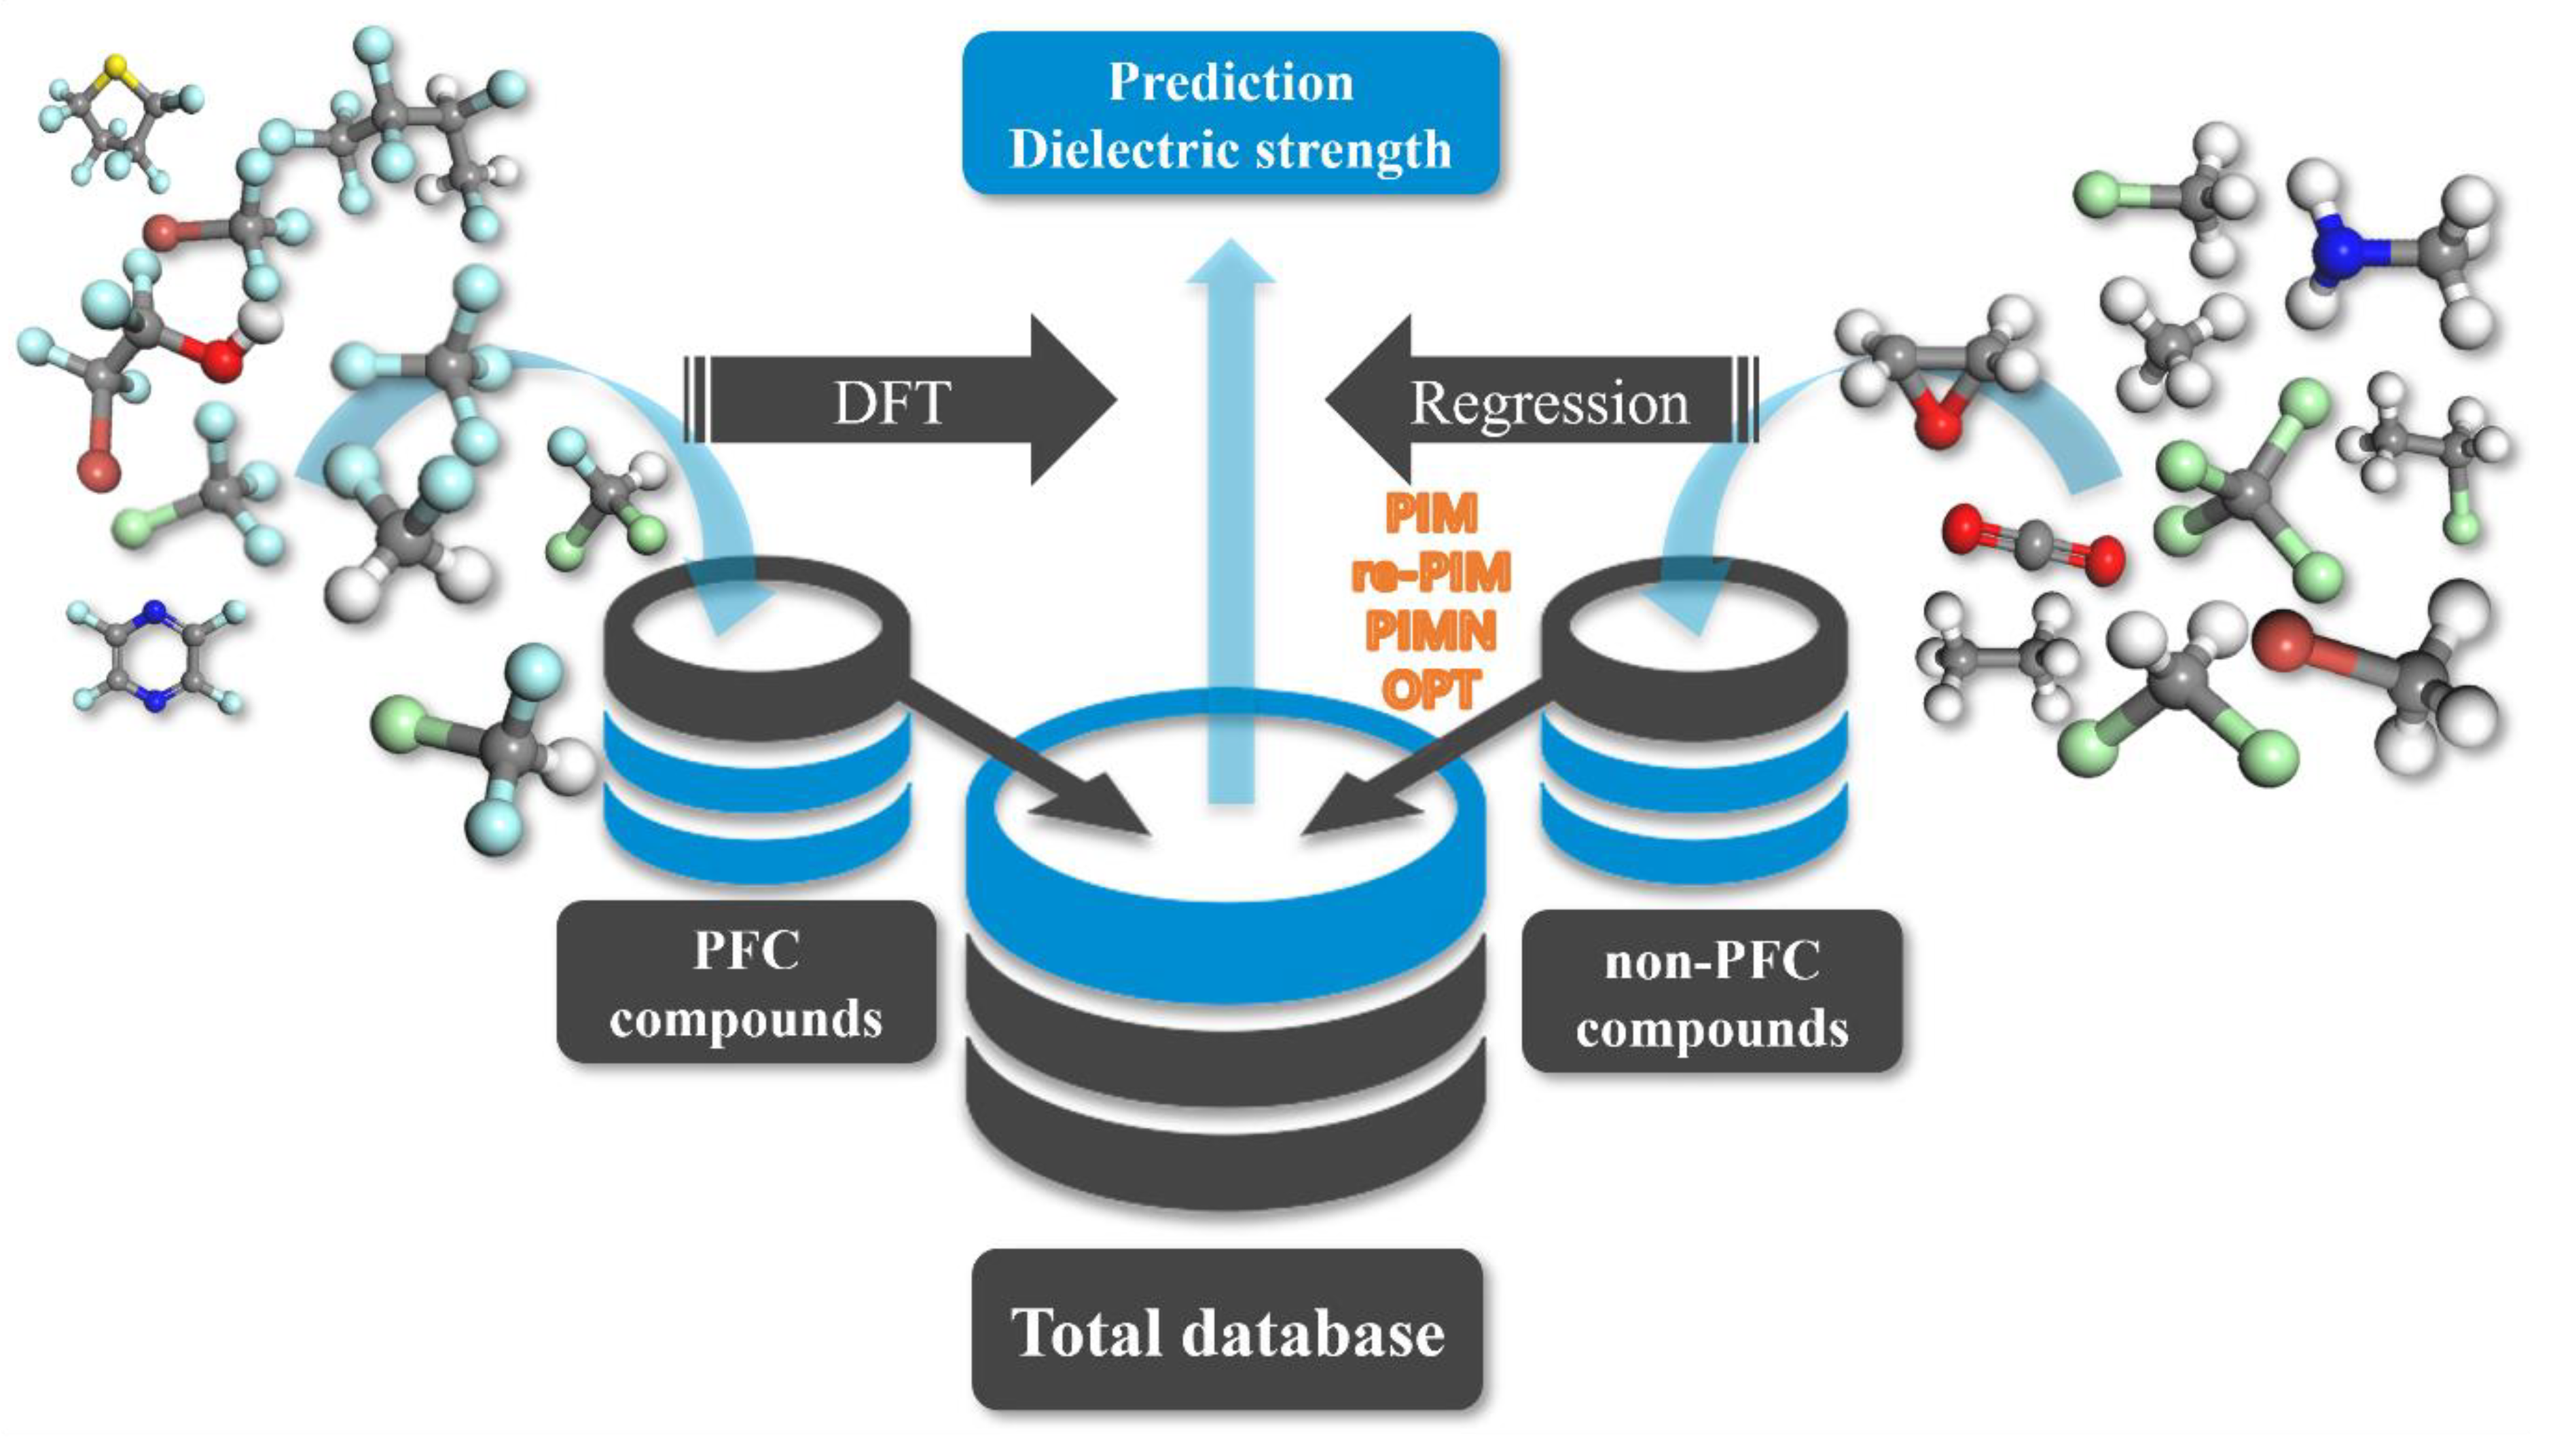
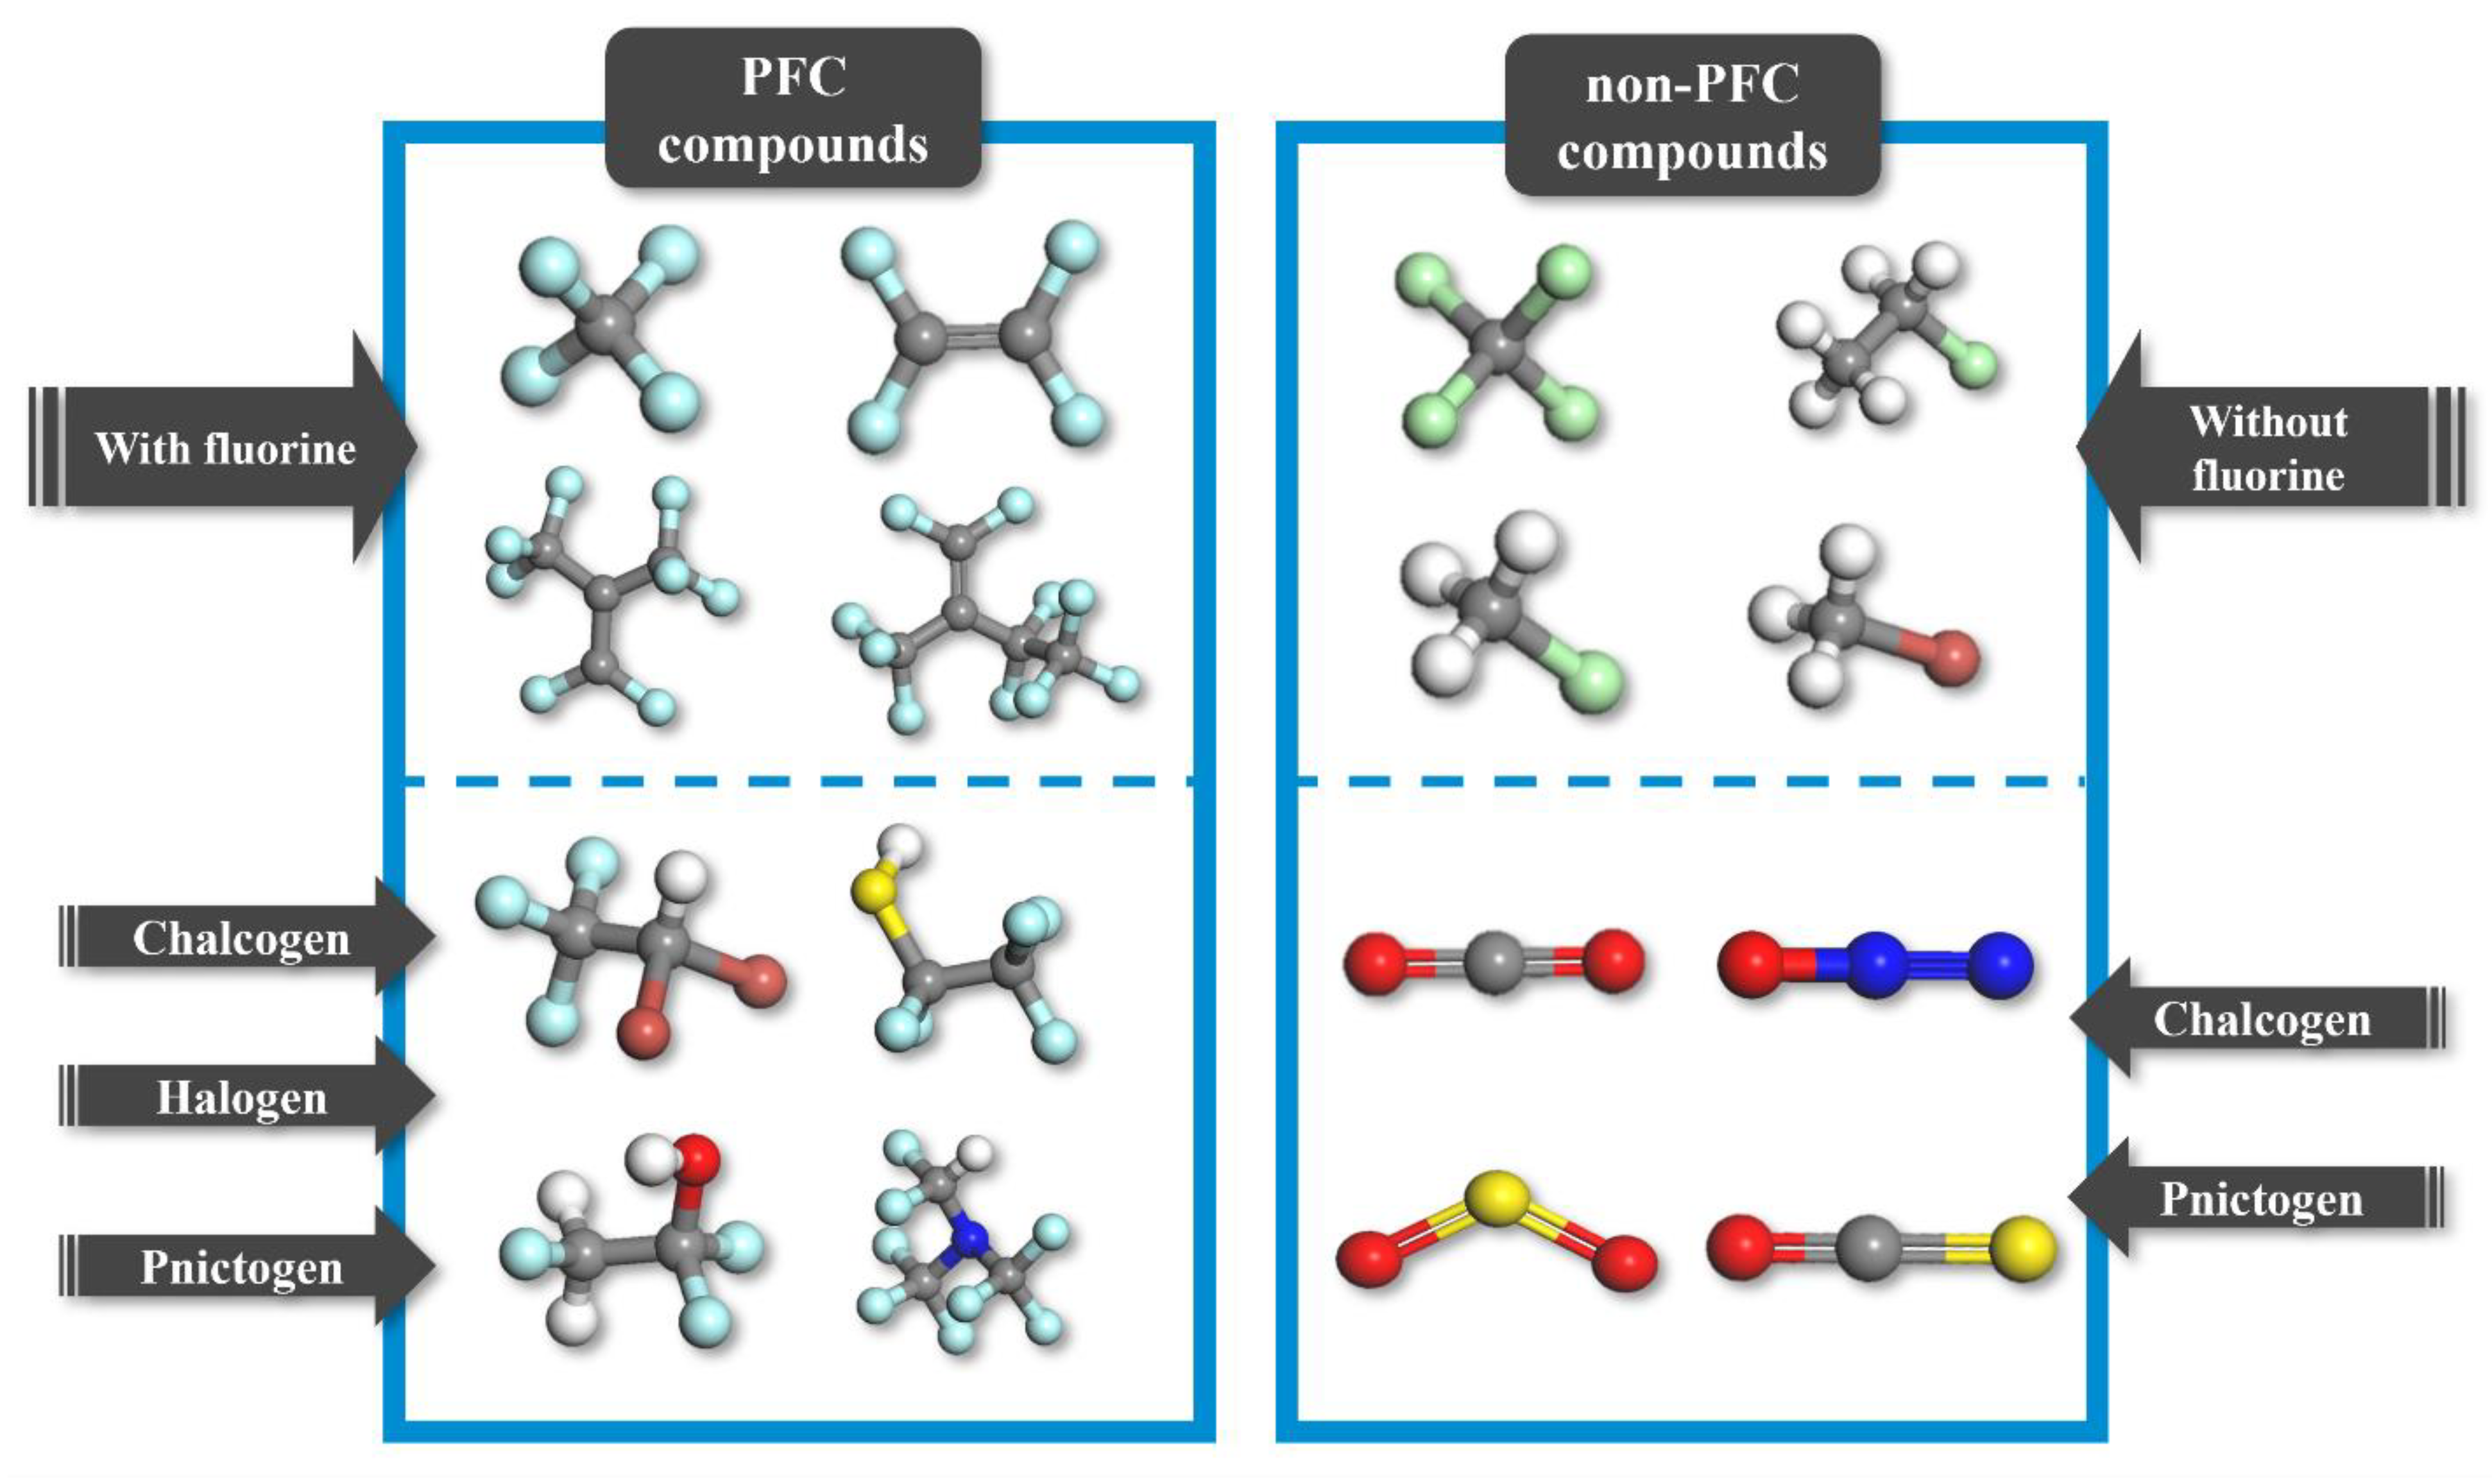
2.1. Overview of Strategy and Materials Database
2.2. Computational Protocols Employed to Predict Dielectric Strength
3. Results and Discussion
3.1. Universal Validity: Reliability of Previous Protocol for Predicting the Dielectric Strengths of Non-PFC Materials
3.2. Strategies for Upgrading the Dielectric Strength Prediction Protocol
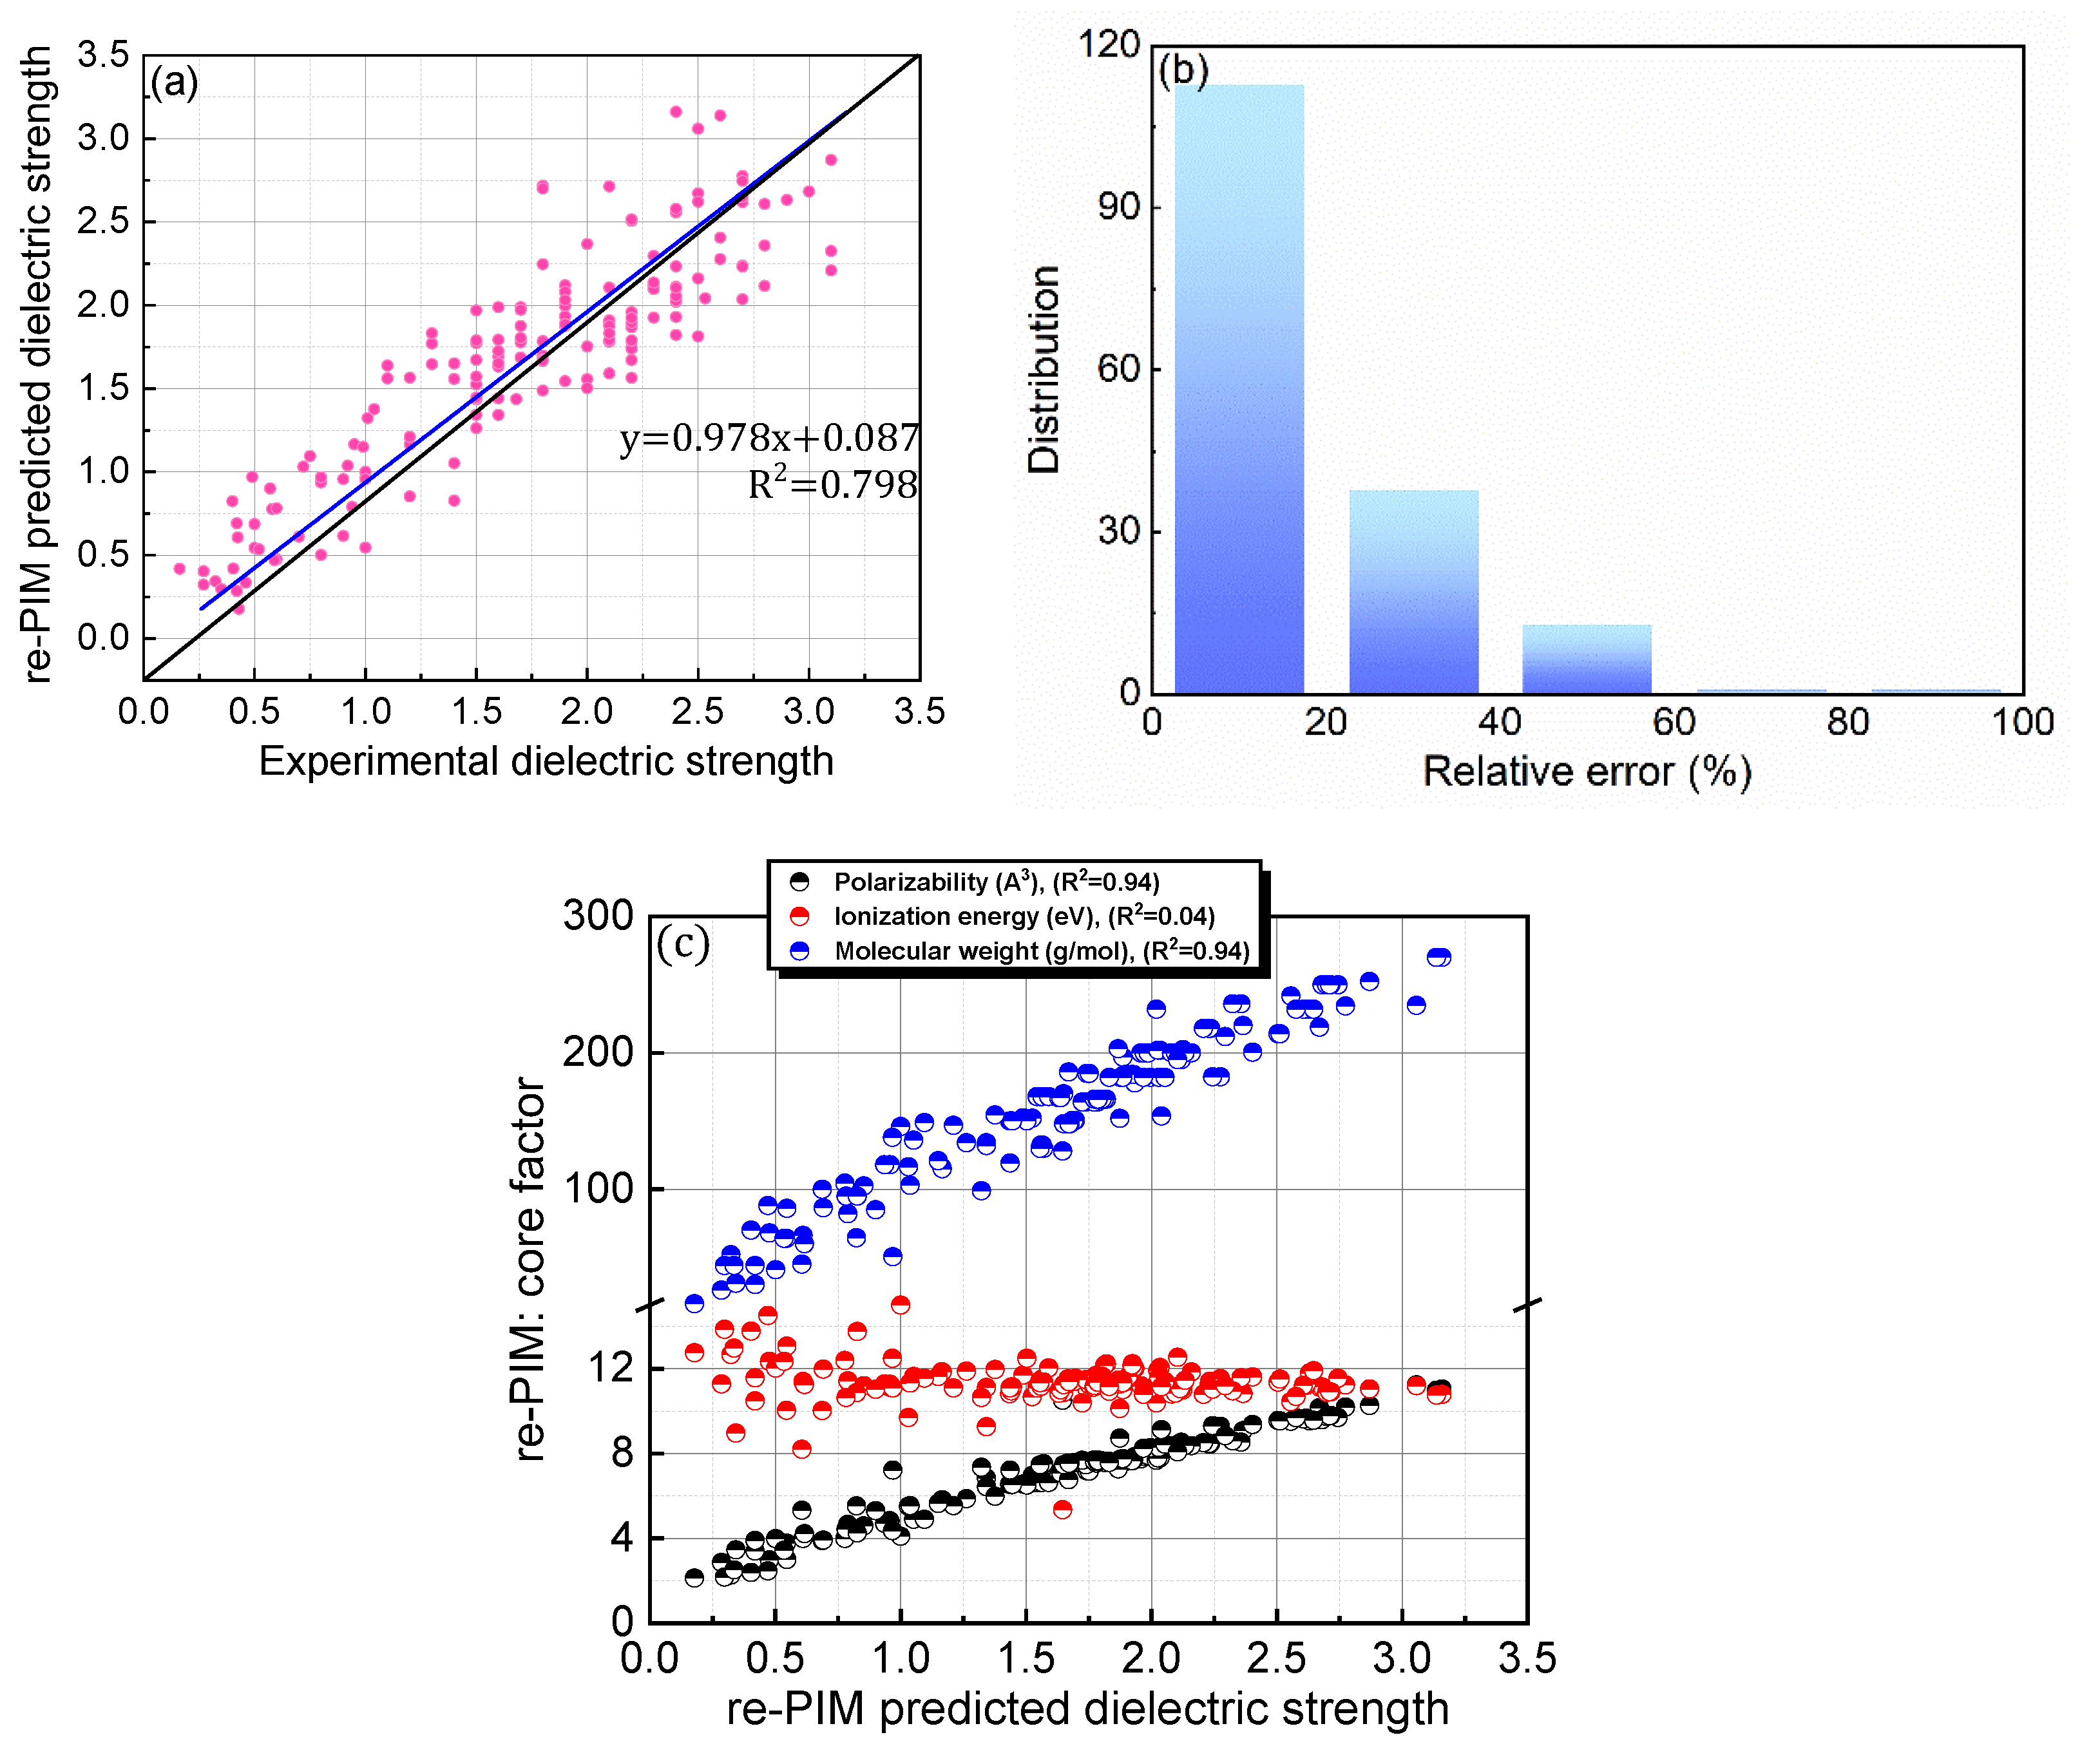
3.2.1. Strategy I: Reparameterization of Previous Protocol
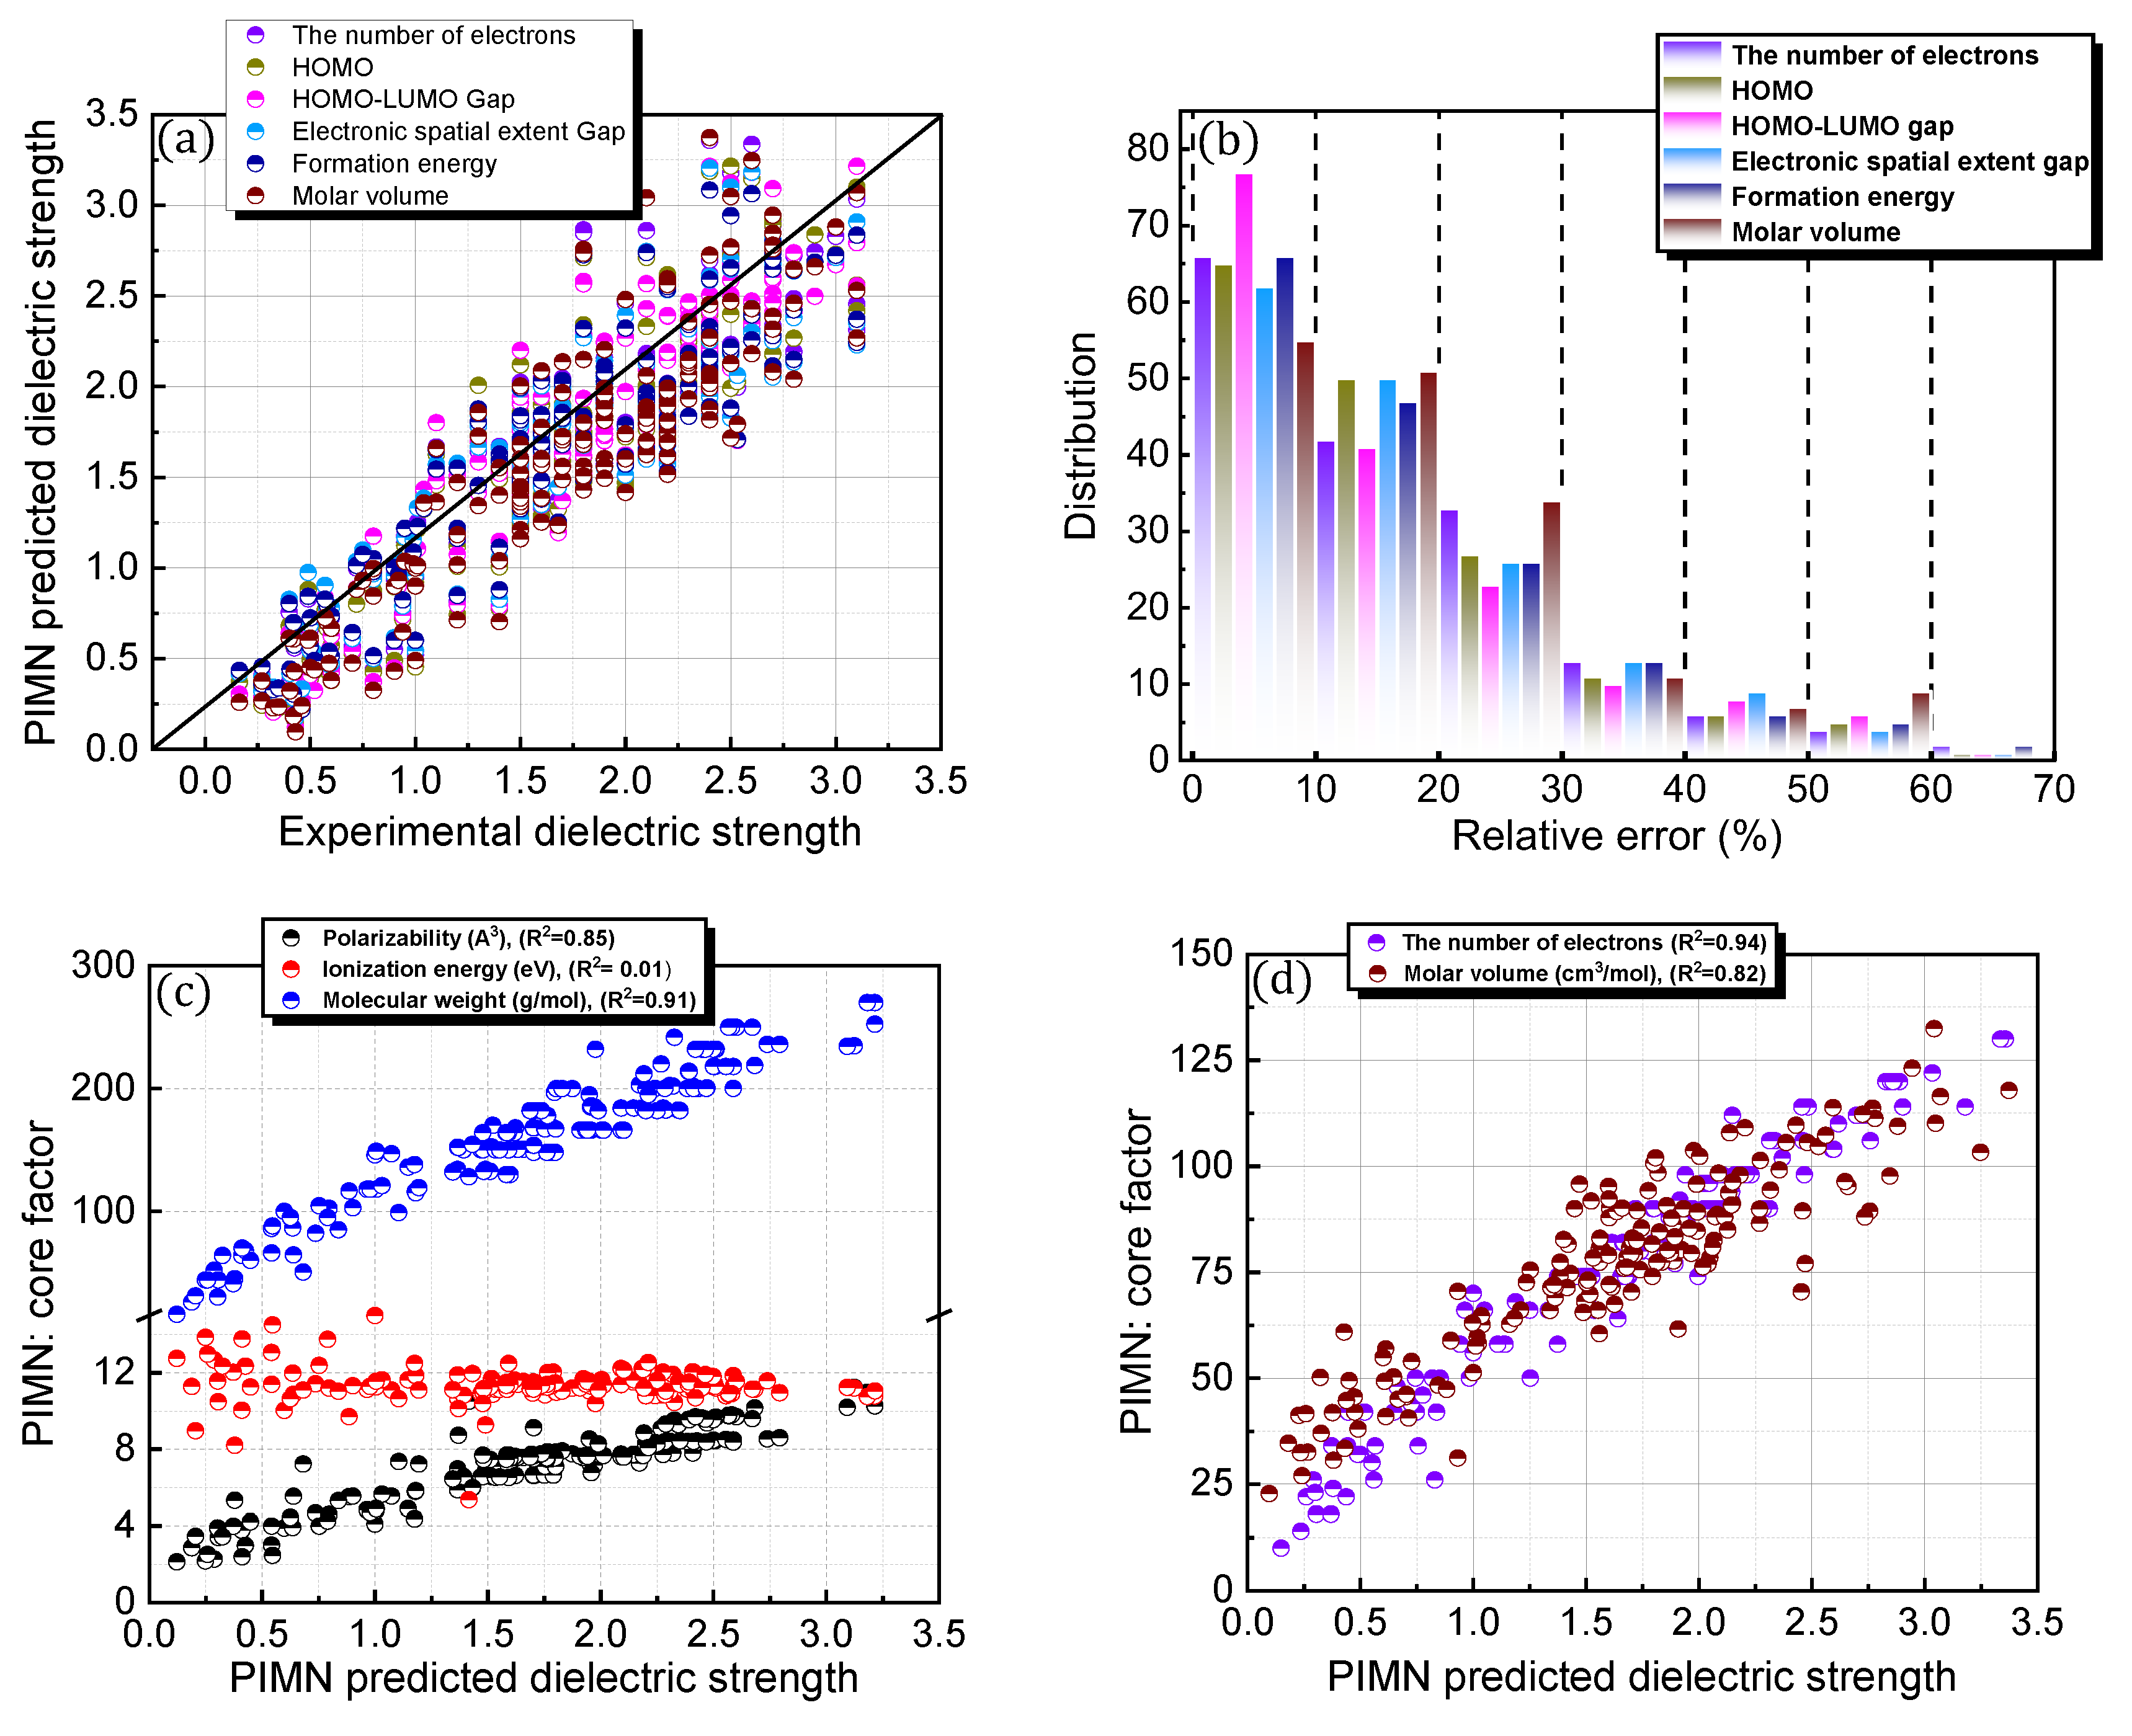
3.2.2. Strategy II: Incorporation of a Novel Factor into the Previous Protocol
3.2.3. Strategy III: Importance of Original Factors in Dielectric Strength Predictions
3.3. In-Depth Analysis of Correlations between Dielectric Strength and Various Core Factors
4. Conclusions
Supplementary Materials
Author Contributions
Funding
Informed Consent Statement
Data Availability Statement
Conflicts of Interest
References
- Pan, B.; Wang, G.; Shi, H.; Shen, J.; Ji, H.-K.; Kil, G.-S. Green gas for grid as an eco-friendly alternative insulation gas to SF6: A review. Appl. Sci. 2020, 10, 2526. [Google Scholar] [CrossRef] [Green Version]
- Kieffel, Y.; Irwin, T.; Ponchon, P.; Owens, J. Green gas to replace SF6 in electrical grids. IEEE Power Electron. Mag. 2016, 14, 32–39. [Google Scholar] [CrossRef]
- Dervos, C.T.; Vassiliou, P.; Mergos, J.A. Thermal stability of SF6 associated with metallic conductors incorporated in gas insulated switchgear power substations. J. Phys. D Appl. Phys. 2007, 40, 6942–6952. [Google Scholar] [CrossRef]
- Zhong, L.; Rong, M.; Wang, X.; Wu, J.; Han, G.; Han, G.; Lu, Y.; Yang, A.; Wu, Y. Compositions, thermodynamic properties, and transport coefficients of hightemperature C5F10O mixed with CO2 and O2 as substitutes for SF6 to reduce global warming potential. AIP Adv. 2017, 7, 075003. [Google Scholar] [CrossRef] [Green Version]
- Rabie, M.; Franck, C.M. Assessment of eco-friendly gases for electrical insulation to replace the most potent industrial greenhouse gas SF6. Environ. Sci. Technol. 2018, 52, 369–380. [Google Scholar] [CrossRef] [PubMed] [Green Version]
- Yu, X.; Hou, H.; Wang, B. Prediction on dielectric strength and boiling point of gaseous molecules for replacement of SF6. J. Comput. Chem. 2017, 38, 721–729. [Google Scholar] [CrossRef] [PubMed]
- Rabie, M.; Dahl, D.A.; Donald, S.M.A.; Reiher, M.; Franck, C. Predictors for gases of high electrical strength. IEEE Trans. Dielectr. Electr. Insul. 2013, 20, 856–863. [Google Scholar] [CrossRef]
- Franck, C.M.; Dahl, D.A.; Rabie, M.; Haefliger, P.; Koch, M. An efficient procedure to identify and quantify new molecules for insulating gas mixtures. Contrib. Plasma Phys. 2014, 54, 3–13. [Google Scholar] [CrossRef] [Green Version]
- Tian, S.; Zhang, X.; Cressault, Y.; Hu, J.; Wang, B.; Xiao, S.; Li, Y.; Kabbaj, N. Research status of replacement gases for SF6 in power industry. AIP Adv. 2020, 10, 050702. [Google Scholar] [CrossRef]
- Beroual, A.; Haddad, A.M. Recent advances in the quest for a new insulation gas with a low impact on the environment to replace sulfur hexafluoride (SF6) gas in high-voltage power network applications. Energies 2017, 10, 1216. [Google Scholar] [CrossRef] [Green Version]
- Owens, J.; Xiao, A.; Bonk, J.; DeLorme, M.; Zhang, A. Recent development of two alternative gases to SF6 for high voltage electrical power applications. Energies 2021, 14, 5051. [Google Scholar] [CrossRef]
- Juntao, J.; Dengming, X.; Xiaoling, Z.; Yunkun, D. Analysis of the molecules structure and vertical electron affnity of organic gas impact on electric strength. Plasma Sci. Technol. 2016, 18, 554–559. [Google Scholar]
- Hu, S.; Wang, Y.; Zhou, W.; Qiu, R.; Luo, Y.; Wang, B. Dielectric properties of CF3SO2F/N2 and CF3SO2F/CO2 mixtures as a substitute to SF6. Ind. Eng. Chem. Res. 2020, 59, 15796–15804. [Google Scholar] [CrossRef]
- Zhang, X.; Xiao, S.; Han, Y.; Cressault, Y. Experimental studies on power frequency breakdown voltage of CF3I/N2 mixed gas under different electric fields. Appl. Phys. Lett. 2016, 108, 092901. [Google Scholar] [CrossRef]
- Pagliaro, J.L.; Linteris, G.T. Hydrocarbon flame inhibition by C6F12O (Novec 1230): Unstretched burning velocity measurements and predictions. Fire Saf. 2017, 87, 10–17. [Google Scholar] [CrossRef] [Green Version]
- Cooke, C.; Cookson, A. The nature and practice of gases as electrical insulators. IEEE Electr. Insul. Mag. 1978, 13, 239–248. [Google Scholar] [CrossRef]
- Zhang, C.; Shi, H.; Cheng, L.; Zhao, K. First principles based computational scheme for designing new SF6 replacements. IEEE Trans. Dielectr. Electr. Insul. 2016, 23, 2572–2578. [Google Scholar] [CrossRef]
- Zhang, X.; Li, Y.; Tian, S.; Xiao, S.; Chen, D.; Tang, J.; Zhuo, R. Decomposition mechanism of the C5-PFK/CO2 gas mixture as an alternative gas for SF6. Chem. Eng. J. 2017, 336, 36–48. [Google Scholar] [CrossRef]
- Zhang, B.; Chen, L.; Li, X.; Guo, Z.; Pu, Y.; Tang, N. Evaluating the dielectric strength of promising SF6 alternatives by DFT calculations and DC breakdown tests. IEEE Trans. Dielectr. Electr. Insul. 2020, 27, 1187–1194. [Google Scholar] [CrossRef]
- Rabie, M.; Franck, C. Computational screening of new high voltage insulation gases with low global warming potential. IEEE Trans. Dielectr. Electr. Insul. 2015, 22, 296–302. [Google Scholar] [CrossRef] [Green Version]
- Jang, J.; Jung, K.H.; Kim, K.C. Development of computational design for reliable prediction of dielectric strengths of perfluorocarbon compounds. Sci. Rep. 2022, 12, 7027. [Google Scholar] [CrossRef] [PubMed]
- Ding, C.; Hu, X.; Gao, Z. Study on relative electrical strength of SF6 substitute gas based on density functional theory. IEEE Access. 2022, 10, 75395–75403. [Google Scholar] [CrossRef]
- Go, C.Y.; Jang, S.S.; Kim, K.C. Tailored design of electrochemically degradable anthraquinone functionality toward organic cathodes. ACS Appl. Mater. Interfaces 2021, 13, 35729–35738. [Google Scholar] [CrossRef]
- Go, C.Y.; Lim, S.; Lee, J.; Kim, K.C. Toward coupling of electrochemical redox properties with electrostatic potential surfaces tailored by dopant architectures for pyrenetetrone. Energy Stor. Mater. 2021, 35, 610–619. [Google Scholar] [CrossRef]
- Jeong, G.S.; Lee, D.K.; Kim, K.C. Crucial role of cyanides for high-potential electrochemical reduction reaction. Energy Stor. Mater. 2020, 29, 140–148. [Google Scholar] [CrossRef]
- Jung, K.H.; Jeong, G.S.; Go, C.Y.; Kim, K.C. Conjugacy of organic cathode materials for high-potential lithium-ion batteries: Carbonitriles versus quinones. Energy Stor. Mater. 2020, 24, 237–246. [Google Scholar] [CrossRef]
- Jung, K.H.; Jeong, G.S.; Joo, J.B.; Kim, K.C. Improving the understanding of the redox properties of Fluoranil derivatives for cathodes in Sodium-ion batteries. ChemSusChem 2019, 12, 4968–4975. [Google Scholar] [CrossRef]
- Jung, K.H.; Lim, S.; Choi, S.; Kim, K.C. Unraveling three-stage discharging behaviors of bio-inspired organic cathode materials. Adv. Funct. Mater. 2021, 31, 2105285. [Google Scholar] [CrossRef]
- Kim, K.C. Design strategies for promising organic positive electrodes in Lithium-ion batteries: Quinones and carbon materials. Ind. Eng. Chem. Res. 2017, 56, 12009–12023. [Google Scholar] [CrossRef]
- Kim, K.C.; Liu, T.; Jung, K.H.; Lee, S.W.; Jang, S.S. Unveiled correlations between electron affinity and solvation in redox potential of quinone-based sodium-ion batteries. Energy Stor. Mater. 2019, 19, 242–250. [Google Scholar] [CrossRef]
- Kim, K.C.; Liu, T.; Lee, S.W.; Jang, S.S. First-principles density functional theory modeling of Li binding: Thermodynamics and redox properties of quinone derivatives for Lithium-ion batteries. J. Am. Chem. Soc. 2016, 138, 2374–2382. [Google Scholar] [CrossRef] [PubMed]
- Liu, T.; Kim, K.C.; Kavian, R.; Jang, S.S.; Lee, S.W. High-density Lithium-ion energy storage utilizing the surface redox reactions in folded graphene films. Chem. Mater. 2015, 27, 3291–3298. [Google Scholar] [CrossRef]
- Liu, T.; Kim, K.C.; Lee, B.; Chen, Z.; Noda, S.; Jang, S.S.; Lee, S.W. Self-polymerized dopamine as an organic cathode for Li- and Na-ion batteries. Energy Environ. Sci. 2017, 10, 205–215. [Google Scholar] [CrossRef] [Green Version]
- Zhu, Y.; Kim, K.C.; Jang, S.S. Boron-doped coronenes with high redox potential for organic positive electrodes in lithium-ion batteries: A first-principles density functional theory modeling study. J. Mater. Chem. A 2018, 6, 10111–10120. [Google Scholar] [CrossRef]


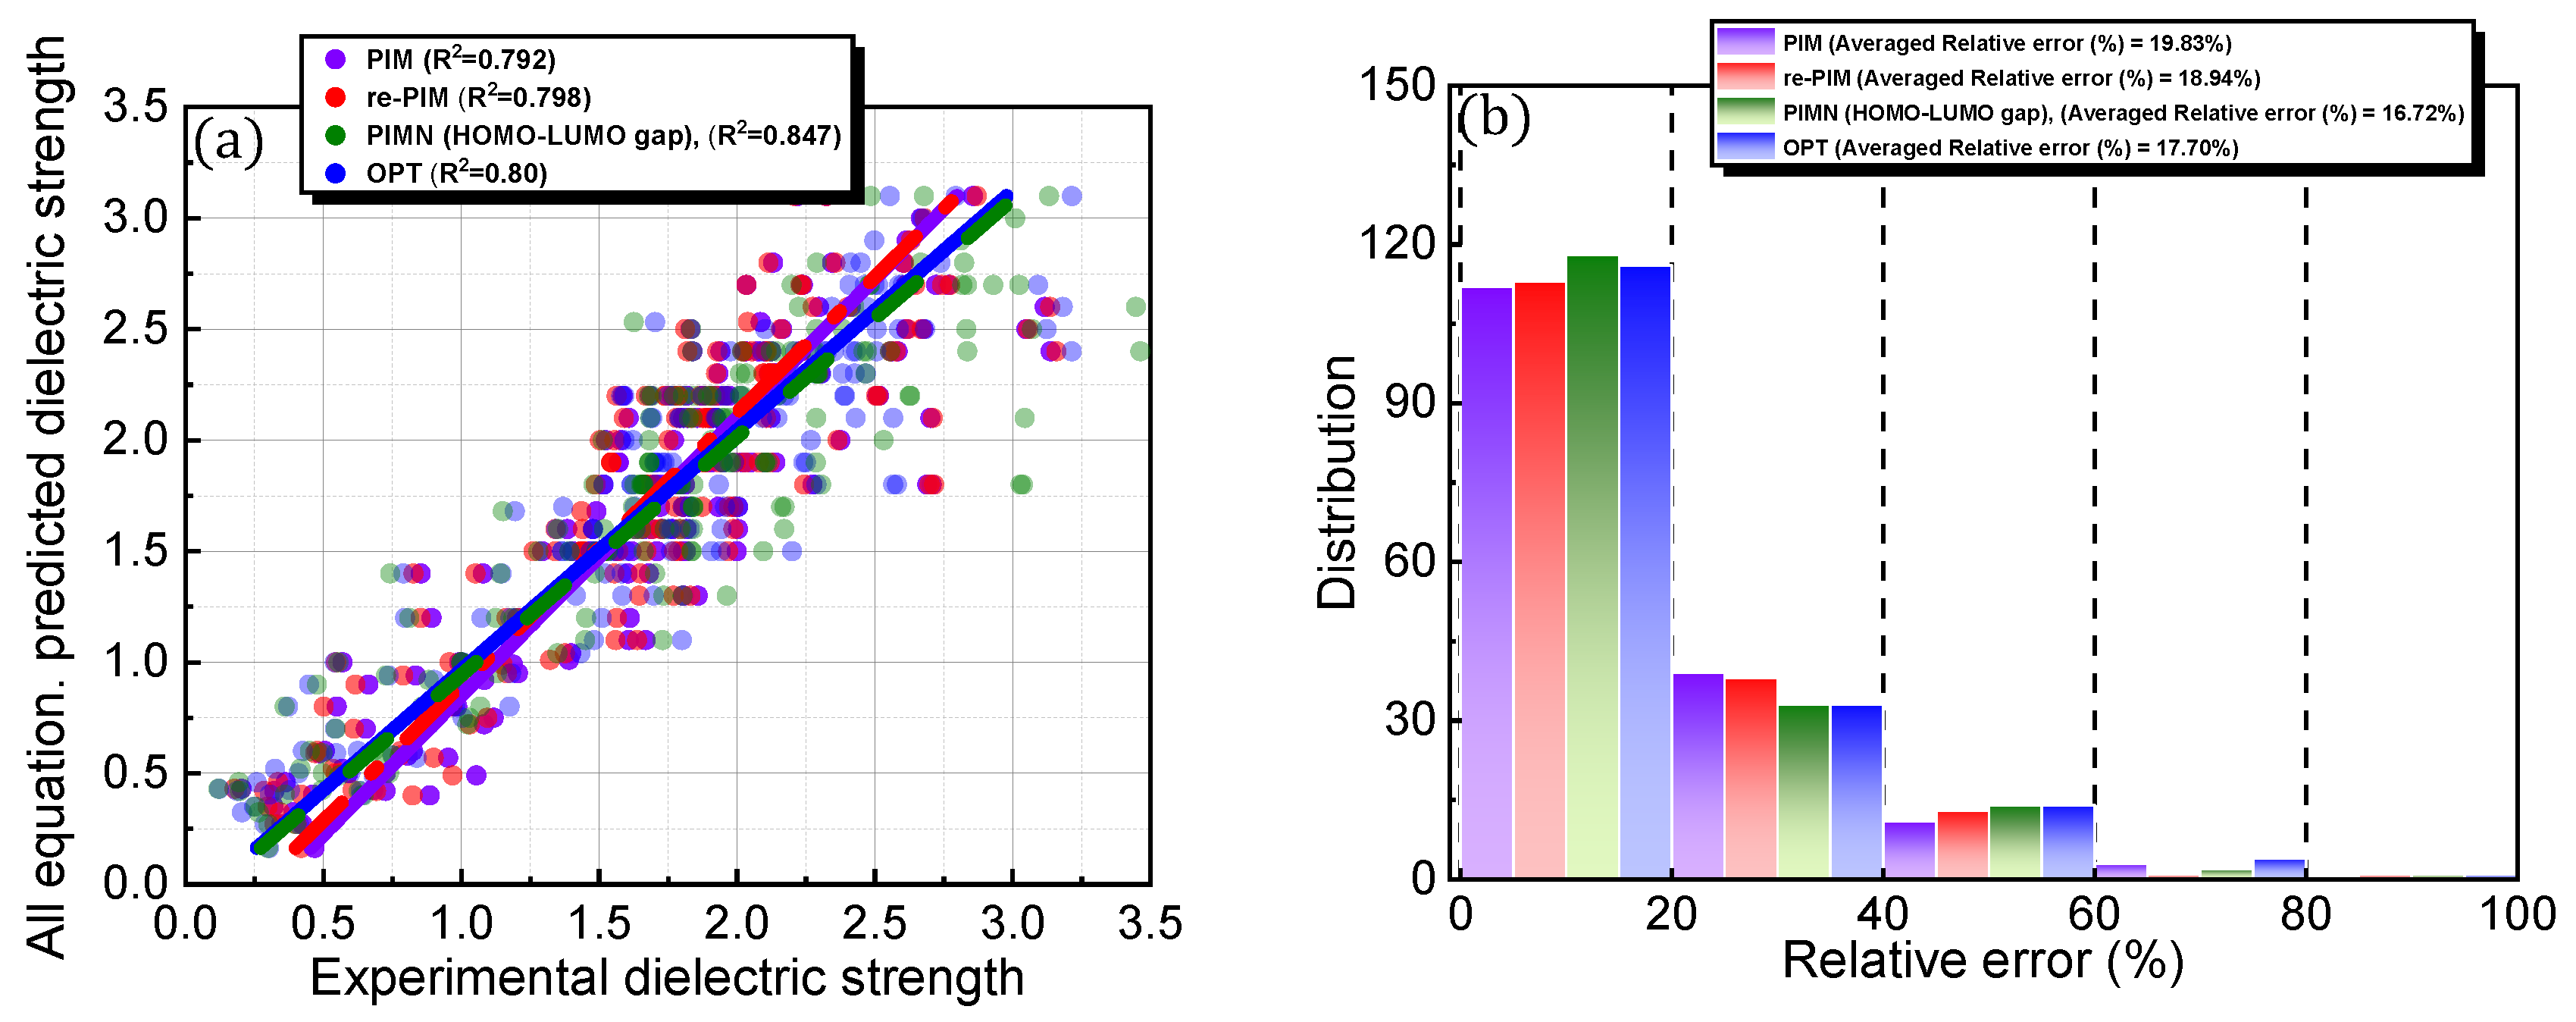
| Prediction Protocol and Core Factor | Average Relative Error | RMSD | x | y | z | m | n | ||
|---|---|---|---|---|---|---|---|---|---|
| Equation (1). PIM | 19.83% | 0.329 | 0.0012 | 1 | 0.288 | 0.401 | - | ||
| Equation (2). re-PIM | 18.94% | 0.328 | 1 | 1 | 0.327 | 0.457 | - | ||
| Equation (3). PIMN | Number of electrons (Ne) | 18.20% | 0.329 | 1 | 0.94 | 0.32 | 0.1 | 0.522 | |
| HOMO [eV] | 17.59% | 0.313 | 0.98 | 1.275 | 0.005 | 0.408 | 1 | ||
| HOMO–LUMO gap [eV] | 16.72% | 0.289 | 1.21 | 0.916 | 0.217 | 0.732 | 0.65 | ||
| Electronic spatial extent gap [a.u.] | 18.96% | 0.328 | 0.65 | 1.012 | 0.37 | 0.459 | 0.001 | ||
| Formation energy [a.u.] | 18.45% | 0.320 | 0.38 | 0.83 | 0.48 | 0.461 | 0.106 | ||
| Molar volume [cm3 mol−1] | 17.89% | 0.346 | 1 | 0.638 | 0.281 | 0.757 | 0.253 | ||
| Prediction protocol and core factor | Average relative error | RMSD | x | y | z | m | n | l | |
| Equation (4). OPT | 17.70% | 0.340 | 0.365 | 0.549 | 0.9 | 0.001 | 0.079 | 0.008 | |
| Prediction Protocol | Core Factor | Linear Regression Line | Correlation Coefficient (R2) | Corresponding Figure |
|---|---|---|---|---|
| Equation (1). PIM | Polarizability [Å3] | 0.94 | Figure 3d | |
| Ionization energy [eV] | 0.05 | |||
| Molecular weight [g mol−1] | 0.92 | |||
| Equation (2). re-PIM | Polarizability [Å3] | 0.94 | Figure 4c | |
| Ionization energy [eV] | 0.04 | |||
| Molecular weight [g mol−1] | 0.94 | |||
| Equation (3). PIMN | Polarizability [Å3] | 0.85 | Figure 5c | |
| Ionization energy [eV] | 0.01 | |||
| Molecular weight [g mol−1] | 0.91 | |||
| Number of electrons | 0.94 | Figure 5d | ||
| Molar volume [cm3 mol−1] | 0.82 | |||
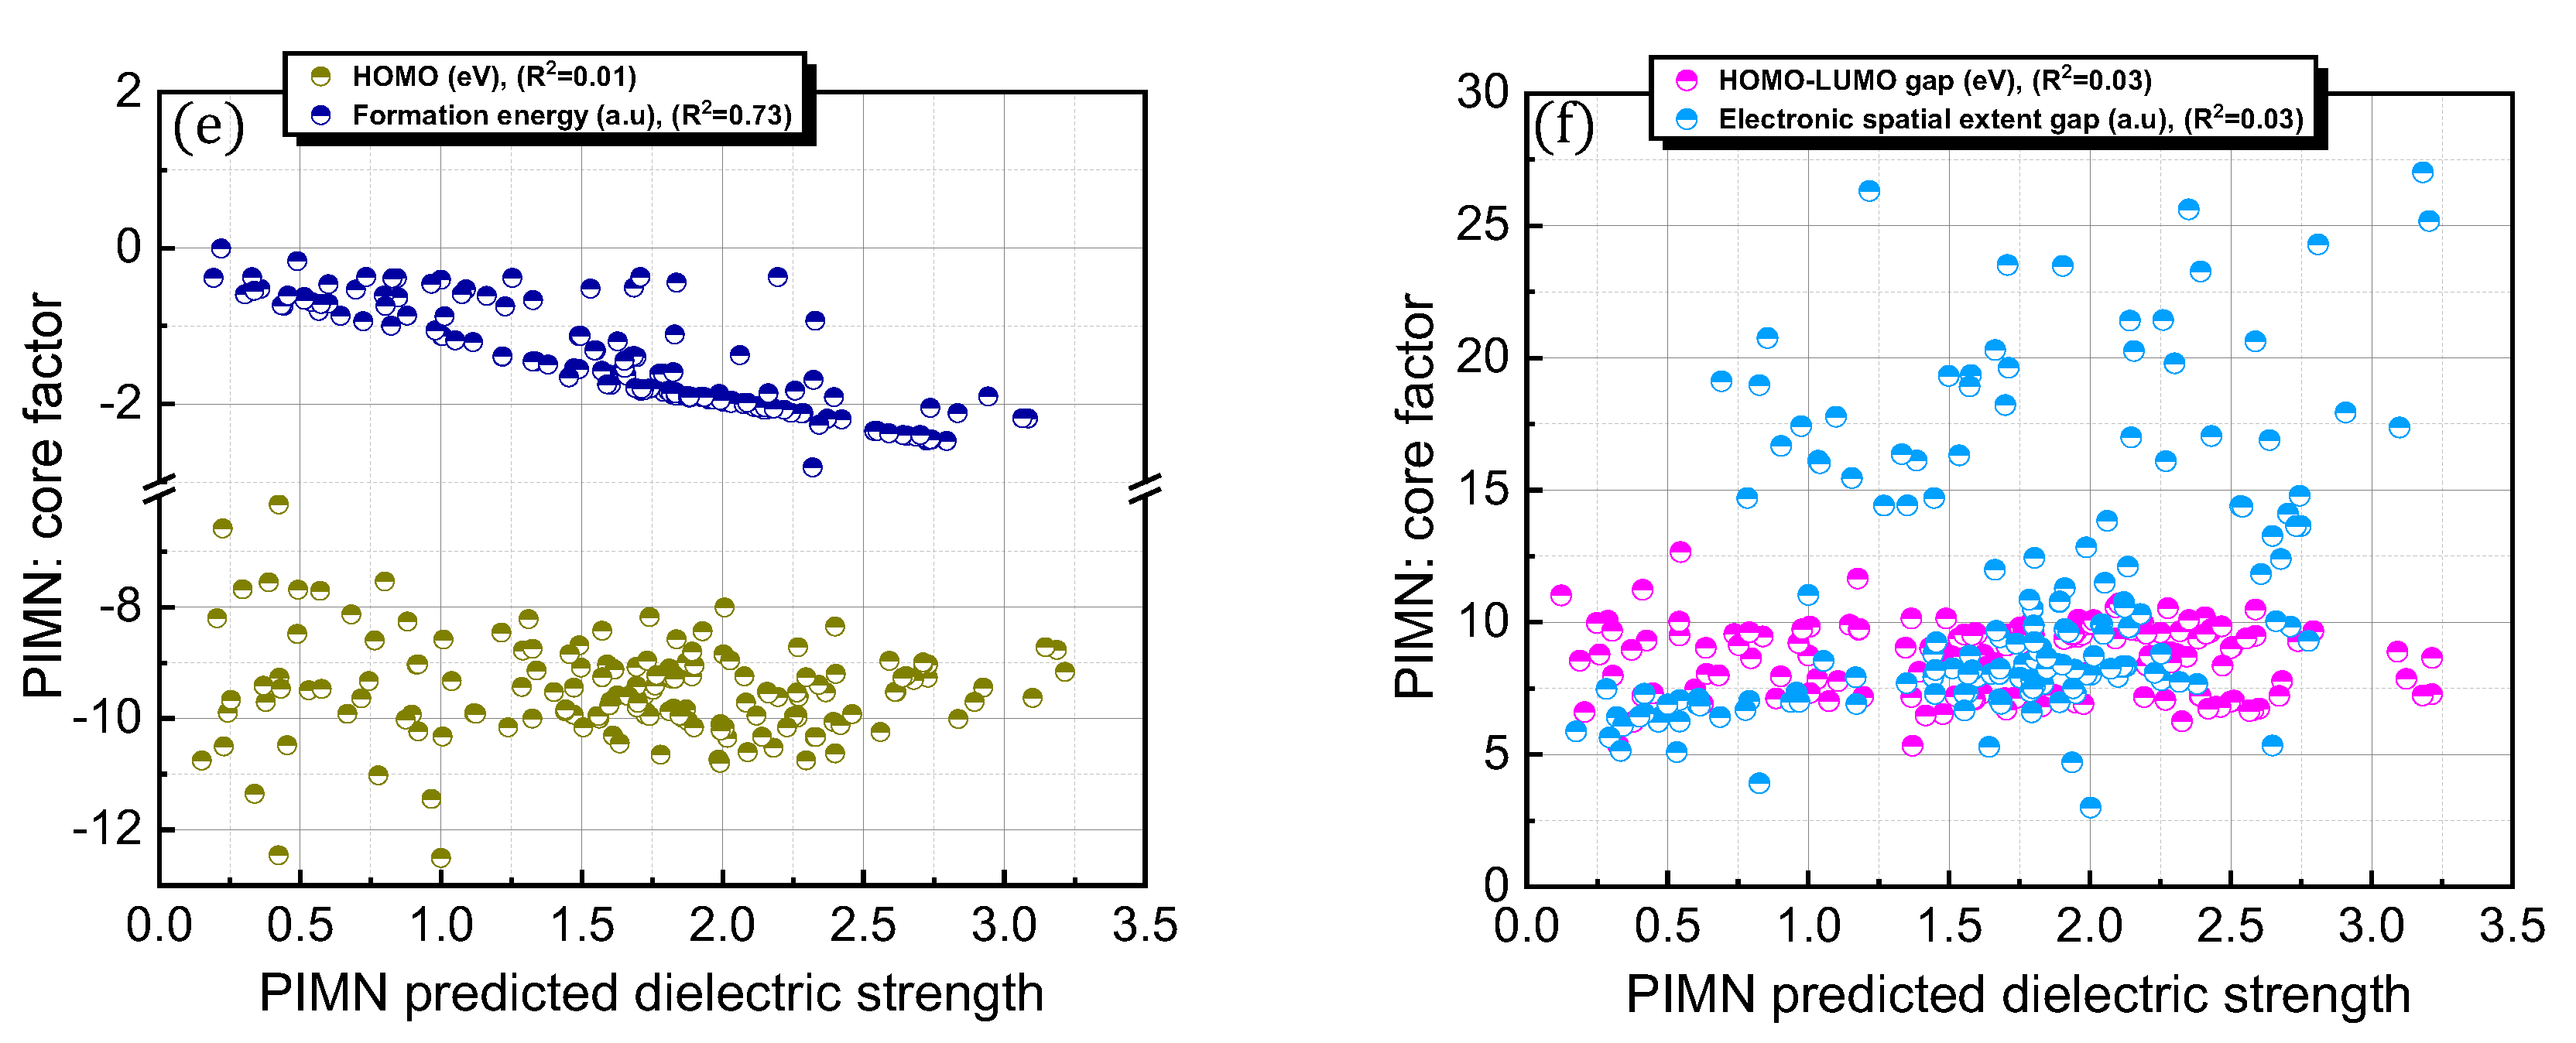
| HOMO [eV] | 0.01 | Figure 5e | ||
| Formation energy [a.u.] | 0.73 | |||
| HOMO–LUMO gap [eV] | 0.03 | Figure 5f | ||
| Electronic spatial extent gap [a.u.] | 0.03 | |||
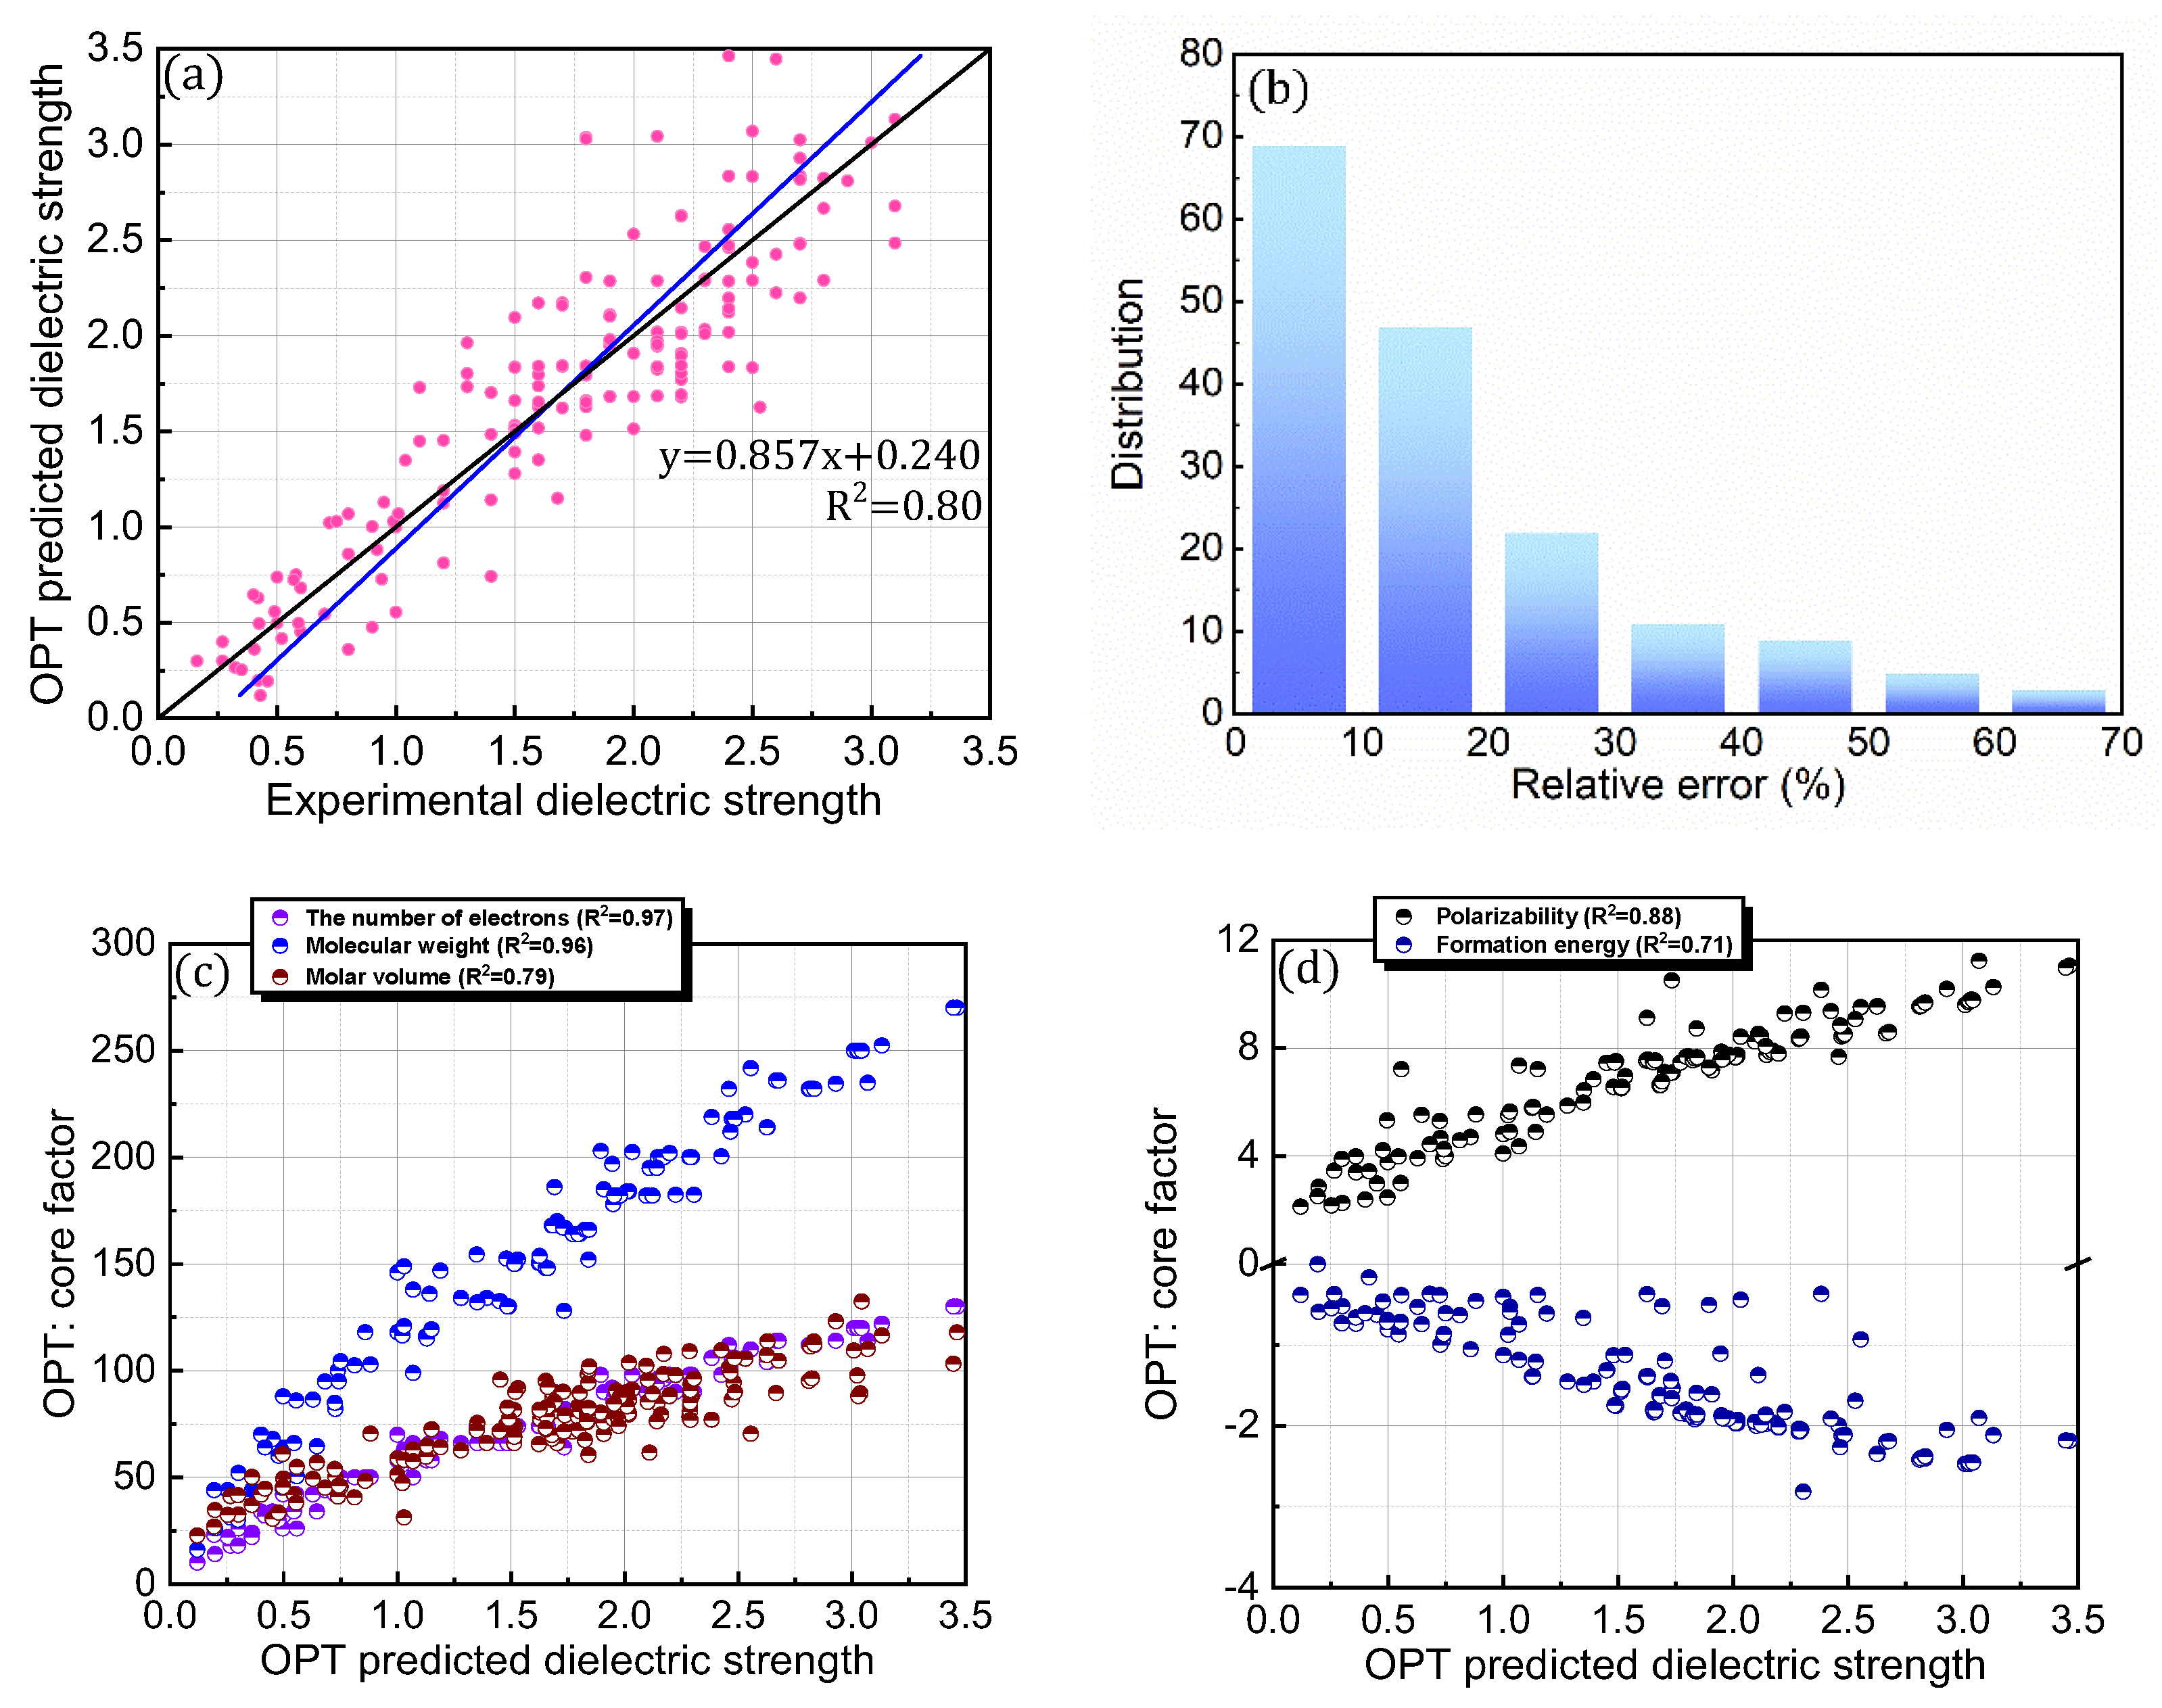
| Equation (4). OPT | Number of electrons | 0.97 | Figure 6c | |
| Molecular weight [g mol−1] | 0.96 | |||
| Molar volume [cm3 mol−1] | 0.79 | |||
| Polarizability [Å3] | 0.88 | Figure 6d | ||
| Formation energy [a.u.] | 0.71 |
Disclaimer/Publisher’s Note: The statements, opinions and data contained in all publications are solely those of the individual author(s) and contributor(s) and not of MDPI and/or the editor(s). MDPI and/or the editor(s) disclaim responsibility for any injury to people or property resulting from any ideas, methods, instructions or products referred to in the content. |
© 2023 by the authors. Licensee MDPI, Basel, Switzerland. This article is an open access article distributed under the terms and conditions of the Creative Commons Attribution (CC BY) license (https://creativecommons.org/licenses/by/4.0/).
Share and Cite
Choi, M.K.; Kim, K.C. Strategic Development of Dielectric Strength Prediction Protocol for Perfluorocarbon and Nonperfluorocarbon Compounds. Appl. Sci. 2023, 13, 4318. https://doi.org/10.3390/app13074318
Choi MK, Kim KC. Strategic Development of Dielectric Strength Prediction Protocol for Perfluorocarbon and Nonperfluorocarbon Compounds. Applied Sciences. 2023; 13(7):4318. https://doi.org/10.3390/app13074318
Chicago/Turabian StyleChoi, Min Kyu, and Ki Chul Kim. 2023. "Strategic Development of Dielectric Strength Prediction Protocol for Perfluorocarbon and Nonperfluorocarbon Compounds" Applied Sciences 13, no. 7: 4318. https://doi.org/10.3390/app13074318